
Exhibit 99.2 MANITEX INTERNATIONAL, INC. NASDAQ: MNTX First Quarter Earnings Conference Call May 2020Exhibit 99.2 MANITEX INTERNATIONAL, INC. NASDAQ: MNTX First Quarter Earnings Conference Call May 2020
Forward-Looking Statement and Non-GAAP Measures Safe Harbor Statement under the U.S. Private Securities Litigation Reform Act of 1995: This presentation contains statements that are forward-looking in nature which express the beliefs and expectations of management including statements regarding the Company’s expected results of operations or liquidity; statements concerning projections, predictions, expectations, estimates or forecasts as to our business, financial and operational results and future economic performance; and statements of management’s goals and objectives and other similar expressions concerning matters that are not historical facts. In some cases, you can identify forward-looking statements by terminology such as “anticipate,” “estimate,” “plan,” “project,” “continuing,” “ongoing,” “expect,” “we believe,” “we intend,” “may,” “will,” “should,” “could,” and similar expressions. Such statements are based on current plans, estimates and expectations and involve a number of known and unknown risks, uncertainties and other factors that could cause the Company's future results, performance or achievements to differ significantly from the results, performance or achievements expressed or implied by such forward-looking statements. These factors and additional information are discussed in the Company's filings with the Securities and Exchange Commission and statements in this presentation should be evaluated in light of these important factors. Although we believe that these statements are based upon reasonable assumptions, we cannot guarantee future results. Forward-looking statements speak only as of the date on which they are made, and the Company undertakes no obligation to update publicly or revise any forward-looking statement, whether as a result of new information, future developments or otherwise. NASDAQ : MNTX 2Forward-Looking Statement and Non-GAAP Measures Safe Harbor Statement under the U.S. Private Securities Litigation Reform Act of 1995: This presentation contains statements that are forward-looking in nature which express the beliefs and expectations of management including statements regarding the Company’s expected results of operations or liquidity; statements concerning projections, predictions, expectations, estimates or forecasts as to our business, financial and operational results and future economic performance; and statements of management’s goals and objectives and other similar expressions concerning matters that are not historical facts. In some cases, you can identify forward-looking statements by terminology such as “anticipate,” “estimate,” “plan,” “project,” “continuing,” “ongoing,” “expect,” “we believe,” “we intend,” “may,” “will,” “should,” “could,” and similar expressions. Such statements are based on current plans, estimates and expectations and involve a number of known and unknown risks, uncertainties and other factors that could cause the Company's future results, performance or achievements to differ significantly from the results, performance or achievements expressed or implied by such forward-looking statements. These factors and additional information are discussed in the Company's filings with the Securities and Exchange Commission and statements in this presentation should be evaluated in light of these important factors. Although we believe that these statements are based upon reasonable assumptions, we cannot guarantee future results. Forward-looking statements speak only as of the date on which they are made, and the Company undertakes no obligation to update publicly or revise any forward-looking statement, whether as a result of new information, future developments or otherwise. NASDAQ : MNTX 2

COVID-19 Update Positioned for Recovery P&L Effects § Diversified crane/lifting business with § Estimated $3.0 million in lost sales <10% oil and gas exposure and approximately $500k in Adjusted EBITDA in Q1 2020 § Sabre divestiture progressing § No backlog cancellations in Q1 § 1.1 book to bill at PM Group for Q1 2020 § Reduced production to align with § PM (articulating crane) remains a global demand and preserve margins; growth market temporary headcount reduction at PM/Italy Facilities \Balance Sheet and Credit § PM has reopened, effective, April 21 (following § 3.2x Leverage Ratio (TTM) 30-day closure) § $42 Million Total Net Debt § All U.S. facilities have continued to operate without stoppage § $46 Million in Total Cash and Credit Availability NASDAQ : MNTX 3COVID-19 Update Positioned for Recovery P&L Effects § Diversified crane/lifting business with § Estimated $3.0 million in lost sales <10% oil and gas exposure and approximately $500k in Adjusted EBITDA in Q1 2020 § Sabre divestiture progressing § No backlog cancellations in Q1 § 1.1 book to bill at PM Group for Q1 2020 § Reduced production to align with § PM (articulating crane) remains a global demand and preserve margins; growth market temporary headcount reduction at PM/Italy Facilities \Balance Sheet and Credit § PM has reopened, effective, April 21 (following § 3.2x Leverage Ratio (TTM) 30-day closure) § $42 Million Total Net Debt § All U.S. facilities have continued to operate without stoppage § $46 Million in Total Cash and Credit Availability NASDAQ : MNTX 3
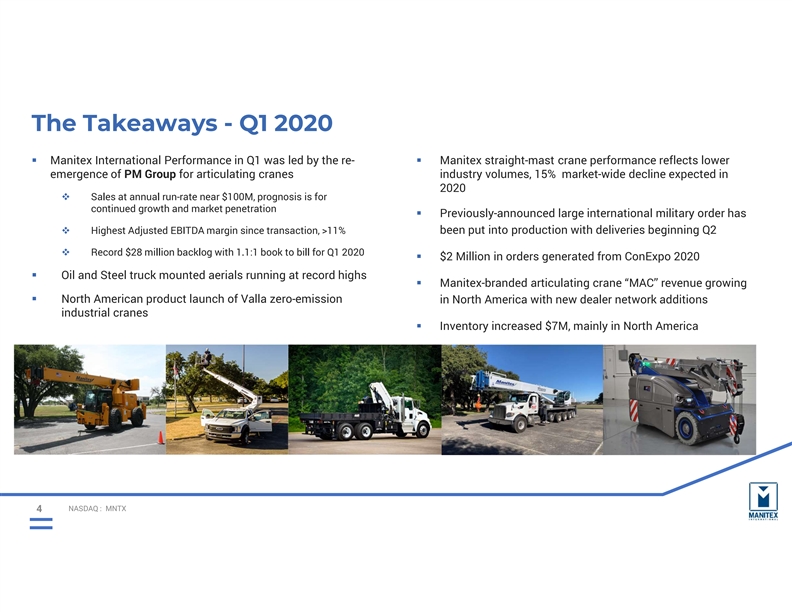
The Takeaways - Q1 2020 § Manitex International Performance in Q1 was led by the re-§ Manitex straight-mast crane performance reflects lower emergence of PM Group for articulating cranes industry volumes, 15% market-wide decline expected in 2020 v Sales at annual run-rate near $100M, prognosis is for continued growth and market penetration § Previously-announced large international military order has v Highest Adjusted EBITDA margin since transaction, >11% been put into production with deliveries beginning Q2 v Record $28 million backlog with 1.1:1 book to bill for Q1 2020 § $2 Million in orders generated from ConExpo 2020 § Oil and Steel truck mounted aerials running at record highs § Manitex-branded articulating crane “MAC” revenue growing § North American product launch of Valla zero-emission in North America with new dealer network additions industrial cranes § Inventory increased $7M, mainly in North America NASDAQ : MNTX 4The Takeaways - Q1 2020 § Manitex International Performance in Q1 was led by the re-§ Manitex straight-mast crane performance reflects lower emergence of PM Group for articulating cranes industry volumes, 15% market-wide decline expected in 2020 v Sales at annual run-rate near $100M, prognosis is for continued growth and market penetration § Previously-announced large international military order has v Highest Adjusted EBITDA margin since transaction, >11% been put into production with deliveries beginning Q2 v Record $28 million backlog with 1.1:1 book to bill for Q1 2020 § $2 Million in orders generated from ConExpo 2020 § Oil and Steel truck mounted aerials running at record highs § Manitex-branded articulating crane “MAC” revenue growing § North American product launch of Valla zero-emission in North America with new dealer network additions industrial cranes § Inventory increased $7M, mainly in North America NASDAQ : MNTX 4
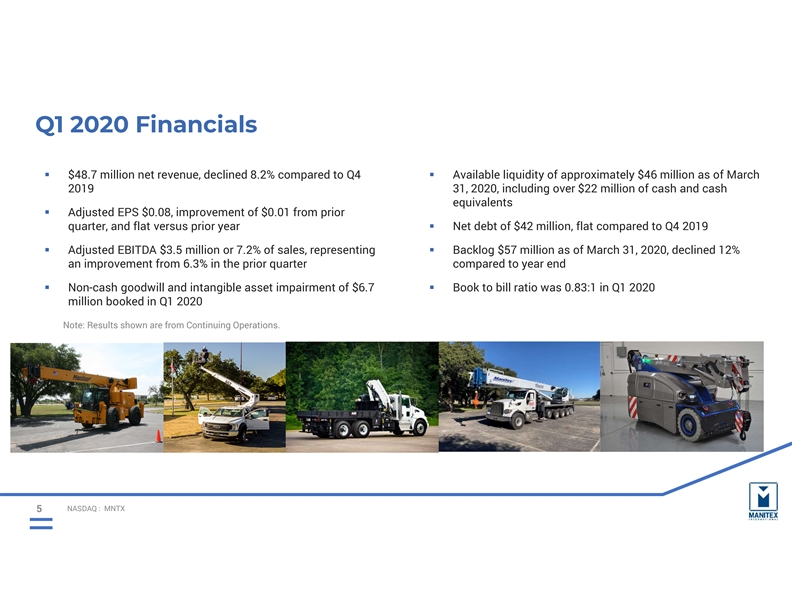
Q1 2020 Financials § $48.7 million net revenue, declined 8.2% compared to Q4 § Available liquidity of approximately $46 million as of March 2019 31, 2020, including over $22 million of cash and cash equivalents § Adjusted EPS $0.08, improvement of $0.01 from prior quarter, and flat versus prior year § Net debt of $42 million, flat compared to Q4 2019 § Adjusted EBITDA $3.5 million or 7.2% of sales, representing § Backlog $57 million as of March 31, 2020, declined 12% an improvement from 6.3% in the prior quarter compared to year end § Non-cash goodwill and intangible asset impairment of $6.7 § Book to bill ratio was 0.83:1 in Q1 2020 million booked in Q1 2020 Note: Results shown are from Continuing Operations. NASDAQ : MNTX 5Q1 2020 Financials § $48.7 million net revenue, declined 8.2% compared to Q4 § Available liquidity of approximately $46 million as of March 2019 31, 2020, including over $22 million of cash and cash equivalents § Adjusted EPS $0.08, improvement of $0.01 from prior quarter, and flat versus prior year § Net debt of $42 million, flat compared to Q4 2019 § Adjusted EBITDA $3.5 million or 7.2% of sales, representing § Backlog $57 million as of March 31, 2020, declined 12% an improvement from 6.3% in the prior quarter compared to year end § Non-cash goodwill and intangible asset impairment of $6.7 § Book to bill ratio was 0.83:1 in Q1 2020 million booked in Q1 2020 Note: Results shown are from Continuing Operations. NASDAQ : MNTX 5

Q1 Operating Results Amounts in USD 000’s Q1 2020 Q4 2019 Q1 2019 (Except EPS) As Reported As Adjusted* As Reported As Adjusted* As Reported As Adjusted* Net sales $48,733 $48,733 $53,090 $53,090 $54,425 $54,425 % change Vs Q4 2019-8.2%8.2% % change Vs Q1 2019-10.5%-10.5% Gross margin $10,247 $10,317 $9,918 $10,225 $11,992 $12,487 % of Sales21.0%21.2%18.7%19.3%22.0%22.9% Value-add GM% (excludes pass through sales) 22.7% 20.6% 24.2% Operating income (loss) $(5,201) $2,467 $1,493 $2,272 $2,189 $3,008 % of Sales-10.7%5.1%2.8%4.3%4.0%5.5% Net income (loss) $ (7,044) $ 1,603 $(54) $1,304 $1,309 $1,567 Diluted EPS $(0.36) $0.08 $(0.00) $ 0.07 $0.07 $0.08 EBITDA $(4,163) $3,505 $2,558 $3,337 $3,255 $4,074 % of Sales -8.5% 7.2% 4.8% 6.3% 6.0% 7.5% Note: Results shown are from Continuing Operations. *See reconciliation to US GAAP on appendix. 6 NASDAQ : MNTX Q1 Operating Results Amounts in USD 000’s Q1 2020 Q4 2019 Q1 2019 (Except EPS) As Reported As Adjusted* As Reported As Adjusted* As Reported As Adjusted* Net sales $48,733 $48,733 $53,090 $53,090 $54,425 $54,425 % change Vs Q4 2019-8.2%8.2% % change Vs Q1 2019-10.5%-10.5% Gross margin $10,247 $10,317 $9,918 $10,225 $11,992 $12,487 % of Sales21.0%21.2%18.7%19.3%22.0%22.9% Value-add GM% (excludes pass through sales) 22.7% 20.6% 24.2% Operating income (loss) $(5,201) $2,467 $1,493 $2,272 $2,189 $3,008 % of Sales-10.7%5.1%2.8%4.3%4.0%5.5% Net income (loss) $ (7,044) $ 1,603 $(54) $1,304 $1,309 $1,567 Diluted EPS $(0.36) $0.08 $(0.00) $ 0.07 $0.07 $0.08 EBITDA $(4,163) $3,505 $2,558 $3,337 $3,255 $4,074 % of Sales -8.5% 7.2% 4.8% 6.3% 6.0% 7.5% Note: Results shown are from Continuing Operations. *See reconciliation to US GAAP on appendix. 6 NASDAQ : MNTX
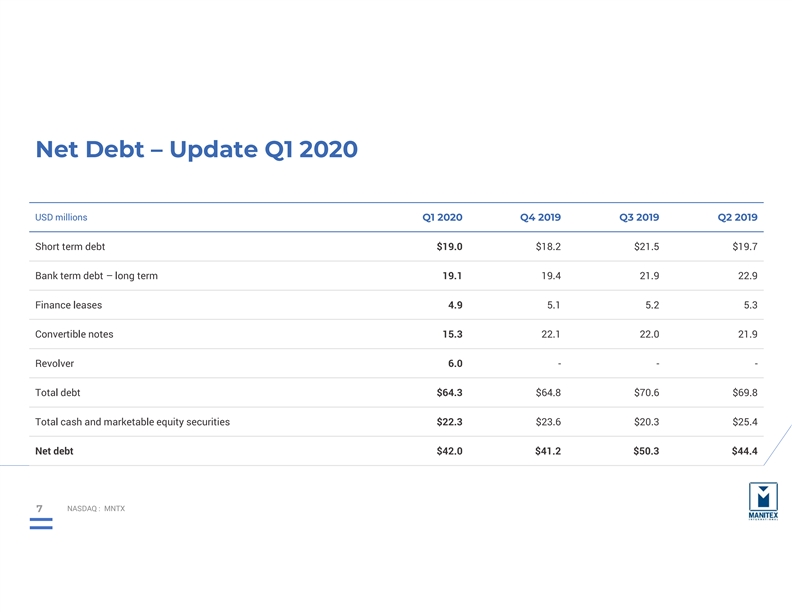
Net Debt – Update Q1 2020 USD millions Q1 2020 Q4 2019 Q3 2019 Q2 2019 Short term debt $19.0 $18.2 $21.5 $19.7 Bank term debt – long term 19.1 19.4 21.9 22.9 Finance leases 4.9 5.1 5.2 5.3 Convertible notes 15.3 22.1 22.0 21.9 Revolver 6.0 - - - Total debt $64.3 $64.8 $70.6 $69.8 Total cash and marketable equity securities $22.3 $23.6 $20.3 $25.4 Net debt $42.0 $41.2 $50.3 $44.4 NASDAQ : MNTX 7Net Debt – Update Q1 2020 USD millions Q1 2020 Q4 2019 Q3 2019 Q2 2019 Short term debt $19.0 $18.2 $21.5 $19.7 Bank term debt – long term 19.1 19.4 21.9 22.9 Finance leases 4.9 5.1 5.2 5.3 Convertible notes 15.3 22.1 22.0 21.9 Revolver 6.0 - - - Total debt $64.3 $64.8 $70.6 $69.8 Total cash and marketable equity securities $22.3 $23.6 $20.3 $25.4 Net debt $42.0 $41.2 $50.3 $44.4 NASDAQ : MNTX 7

Ongoing Manitex International Initiatives § Maintain the safety of our team for duration of COVID-19 and beyond § 100% of our facilities are up and running § Aligning costs with market demands § Strong global brands provide stability and credibility § Diversified industrial portfolio and limited exposure to Oil & Gas § Solid balance sheet and liquidity § Rising PM participation in global growth market continuing to deliver growth and improved profitability to Manitex NASDAQ : MNTX 8Ongoing Manitex International Initiatives § Maintain the safety of our team for duration of COVID-19 and beyond § 100% of our facilities are up and running § Aligning costs with market demands § Strong global brands provide stability and credibility § Diversified industrial portfolio and limited exposure to Oil & Gas § Solid balance sheet and liquidity § Rising PM participation in global growth market continuing to deliver growth and improved profitability to Manitex NASDAQ : MNTX 8
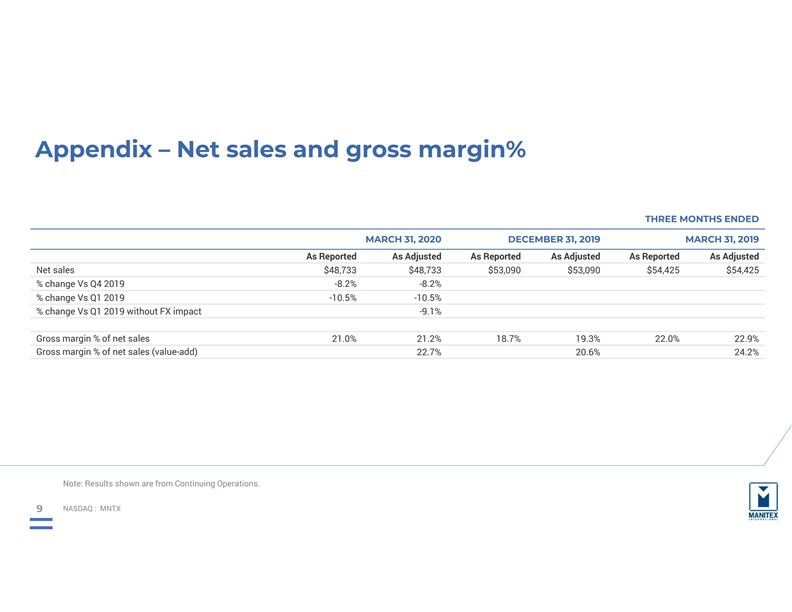
Appendix – Net sales and gross margin% THREE MONTHS ENDED MARCH 31, 2020 DECEMBER 31, 2019 MARCH 31, 2019 As Reported As Adjusted As Reported As Adjusted As Reported As Adjusted Net sales $48,733 $48,733 $53,090 $53,090 $54,425 $54,425 % change Vs Q4 2019 -8.2% -8.2% % change Vs Q1 2019 -10.5% -10.5% % change Vs Q1 2019 without FX impact -9.1% Gross margin % of net sales 21.0% 21.2% 18.7% 19.3% 22.0% 22.9% Gross margin % of net sales (value-add) 22.7% 20.6% 24.2% Note: Results shown are from Continuing Operations. NASDAQ : MNTX 9Appendix – Net sales and gross margin% THREE MONTHS ENDED MARCH 31, 2020 DECEMBER 31, 2019 MARCH 31, 2019 As Reported As Adjusted As Reported As Adjusted As Reported As Adjusted Net sales $48,733 $48,733 $53,090 $53,090 $54,425 $54,425 % change Vs Q4 2019 -8.2% -8.2% % change Vs Q1 2019 -10.5% -10.5% % change Vs Q1 2019 without FX impact -9.1% Gross margin % of net sales 21.0% 21.2% 18.7% 19.3% 22.0% 22.9% Gross margin % of net sales (value-add) 22.7% 20.6% 24.2% Note: Results shown are from Continuing Operations. NASDAQ : MNTX 9

Appendix – Reconciliations Reconciliation of GAAP Net Income (Loss) to Adjusted Net Income (in thousands except shares and EPS) THREE MONTHS ENDED MARCH 31, 2020 DECEMBER 31, 2019 MARCH 31, 2019 Net income (loss) $(7,044) $(54) $1,309 Adjustments related to change in fair value of securities, trade show, discontinued model, customer declared bankruptcy, foreign exchange, goodwill and intangible asset impairment, plant closing, restatement, 8,647 1,358 258 restricted stock, restructuring, and other expenses (including net tax impact) Adjusted net income $1,603 $1,304 $1,567 Weighted diluted shares outstanding 19,733,772 19,696,093 19,694,973 Diluted earnings (loss) per shares as reported $(0.36) $(0.00) $0.07 Total EPS effect $0.44 $0.07 $0.01 Adjusted diluted earnings per share $0.08 $0.07 $0.08 Note: Results shown are from Continuing Operations. NASDAQ : MNTX 10Appendix – Reconciliations Reconciliation of GAAP Net Income (Loss) to Adjusted Net Income (in thousands except shares and EPS) THREE MONTHS ENDED MARCH 31, 2020 DECEMBER 31, 2019 MARCH 31, 2019 Net income (loss) $(7,044) $(54) $1,309 Adjustments related to change in fair value of securities, trade show, discontinued model, customer declared bankruptcy, foreign exchange, goodwill and intangible asset impairment, plant closing, restatement, 8,647 1,358 258 restricted stock, restructuring, and other expenses (including net tax impact) Adjusted net income $1,603 $1,304 $1,567 Weighted diluted shares outstanding 19,733,772 19,696,093 19,694,973 Diluted earnings (loss) per shares as reported $(0.36) $(0.00) $0.07 Total EPS effect $0.44 $0.07 $0.01 Adjusted diluted earnings per share $0.08 $0.07 $0.08 Note: Results shown are from Continuing Operations. NASDAQ : MNTX 10

Appendix – Reconciliations Reconciliation of GAAP Operating Income (Loss) to Adjusted EBITDA (in thousands) THREE MONTHS ENDED MARCH 31, 2020 DECEMBER 31, 2019 MARCH 31, 2019 Operating income (loss) $(5,201) $1,493 $2,189 Adjustments related to trade show, customer declared bankruptcy, discontinued model, goodwill and intangible asset impairment, plant closing, restatement, restricted stock, restructuring and other 7,668 779 819 expenses Adjusted operating income 2,467 2,272 3,008 Depreciation and amortization 1,038 1,065 1,066 Adjusted EBITDA $3,505 $3,337 $4,074 Adjusted EBITDA % to sales 7.2% 6.3% 7.5% Note: Results shown are from Continuing Operations. NASDAQ : MNTX 11Appendix – Reconciliations Reconciliation of GAAP Operating Income (Loss) to Adjusted EBITDA (in thousands) THREE MONTHS ENDED MARCH 31, 2020 DECEMBER 31, 2019 MARCH 31, 2019 Operating income (loss) $(5,201) $1,493 $2,189 Adjustments related to trade show, customer declared bankruptcy, discontinued model, goodwill and intangible asset impairment, plant closing, restatement, restricted stock, restructuring and other 7,668 779 819 expenses Adjusted operating income 2,467 2,272 3,008 Depreciation and amortization 1,038 1,065 1,066 Adjusted EBITDA $3,505 $3,337 $4,074 Adjusted EBITDA % to sales 7.2% 6.3% 7.5% Note: Results shown are from Continuing Operations. NASDAQ : MNTX 11
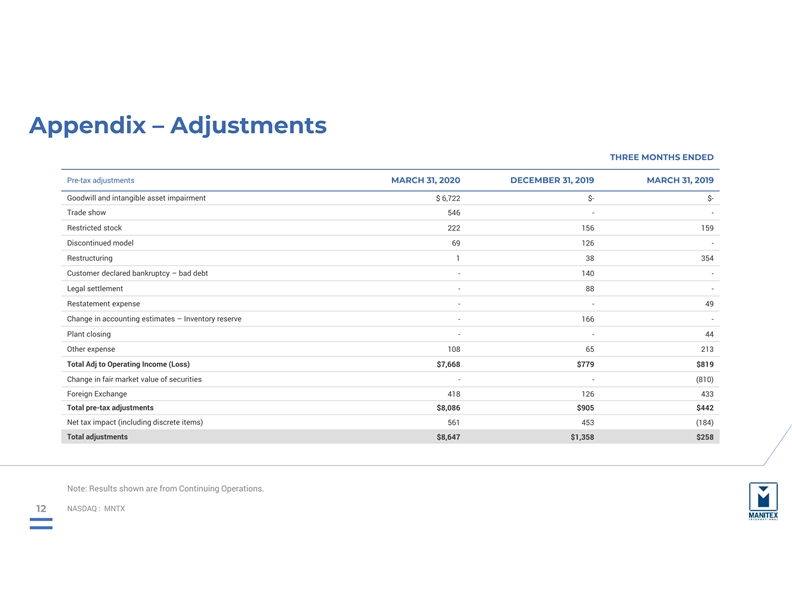
Appendix – Adjustments THREE MONTHS ENDED Pre-tax adjustments MARCH 31, 2020 DECEMBER 31, 2019 MARCH 31, 2019 Goodwill and intangible asset impairment $ 6,722 $- $- Trade show 546 - - Restricted stock 222 156 159 Discontinued model 69 126 - Restructuring 1 38 354 Customer declared bankruptcy – bad debt - 140 - Legal settlement - 88 - Restatement expense - - 49 Change in accounting estimates – Inventory reserve - 166 - Plant closing - - 44 Other expense 108 65 213 Total Adj to Operating Income (Loss) $7,668 $779 $819 Change in fair market value of securities - - (810) Foreign Exchange 418 126 433 Total pre-tax adjustments $8,086 $905 $442 Net tax impact (including discrete items) 561 453 (184) Total adjustments $8,647 $1,358 $258 Note: Results shown are from Continuing Operations. NASDAQ : MNTX 12Appendix – Adjustments THREE MONTHS ENDED Pre-tax adjustments MARCH 31, 2020 DECEMBER 31, 2019 MARCH 31, 2019 Goodwill and intangible asset impairment $ 6,722 $- $- Trade show 546 - - Restricted stock 222 156 159 Discontinued model 69 126 - Restructuring 1 38 354 Customer declared bankruptcy – bad debt - 140 - Legal settlement - 88 - Restatement expense - - 49 Change in accounting estimates – Inventory reserve - 166 - Plant closing - - 44 Other expense 108 65 213 Total Adj to Operating Income (Loss) $7,668 $779 $819 Change in fair market value of securities - - (810) Foreign Exchange 418 126 433 Total pre-tax adjustments $8,086 $905 $442 Net tax impact (including discrete items) 561 453 (184) Total adjustments $8,647 $1,358 $258 Note: Results shown are from Continuing Operations. NASDAQ : MNTX 12

Steve Filipov, CEO MANITEX INTERNATIONAL, INC. Manitex International NASDAQ: MNTX 708-237-2054 First Quarter Earnings Conference Call May 2020 Peter Seltzberg, IR Darrow Associates, Inc. 516-419-9915Steve Filipov, CEO MANITEX INTERNATIONAL, INC. Manitex International NASDAQ: MNTX 708-237-2054 First Quarter Earnings Conference Call May 2020 Peter Seltzberg, IR Darrow Associates, Inc. 516-419-9915