Exhibit 99.1 MANITEX INTERNATIONAL, INC. NASDAQ: MNTX Corporate Presentation March 2022
Forward-Looking Statement and Non-GAAP Measures Safe Harbor Statement under the U.S. Private Securities Litigation Reform Act of 1995: This presentation contains statements that are forward-looking in nature which express the beliefs and expectations of management including statements regarding the Company’s expected results of operations or liquidity; statements concerning projections, predictions, expectations, estimates or forecasts as to our business, financial and operational results and future economic performance; and statements of management’s goals and objectives and other similar expressions concerning matters that are not historical facts. In some cases, you can identify forward-looking statements by terminology such as “anticipate,” “estimate,” “plan,” “project,” “continuing,” “ongoing,” “expect,” “we believe,” “we intend,” “may,” “will,” “should,” “could,” and similar expressions. Such statements are based on current plans, estimates and expectations and involve a number of known and unknown risks, uncertainties and other factors that could cause the Company's future results, performance or achievements to differ significantly from the results, performance or achievements expressed or implied by such forward-looking statements. These factors and additional information are discussed in the Company's filings with the Securities and Exchange Commission and statements in this presentation should be evaluated in light of these important factors. Although we believe that these statements are based upon reasonable assumptions, we cannot guarantee future results. Forward-looking statements speak only as of the date on which they are made, and the Company undertakes no obligation to update publicly or revise any forward-looking statement, whether as a result of new information, future developments or otherwise. Non-GAAP Measures: Manitex International from time to time refers to various non-GAAP (generally accepted accounting principles) financial measures in this presentation. Manitex believes that this information is useful to understanding its operating results without the impact of special items. See Manitex’s Q4 2021 earnings release on the Investor Relations section of our website www.manitexinternational.com for a description and/or reconciliation of these measures. NASDAQ : MNTX 2
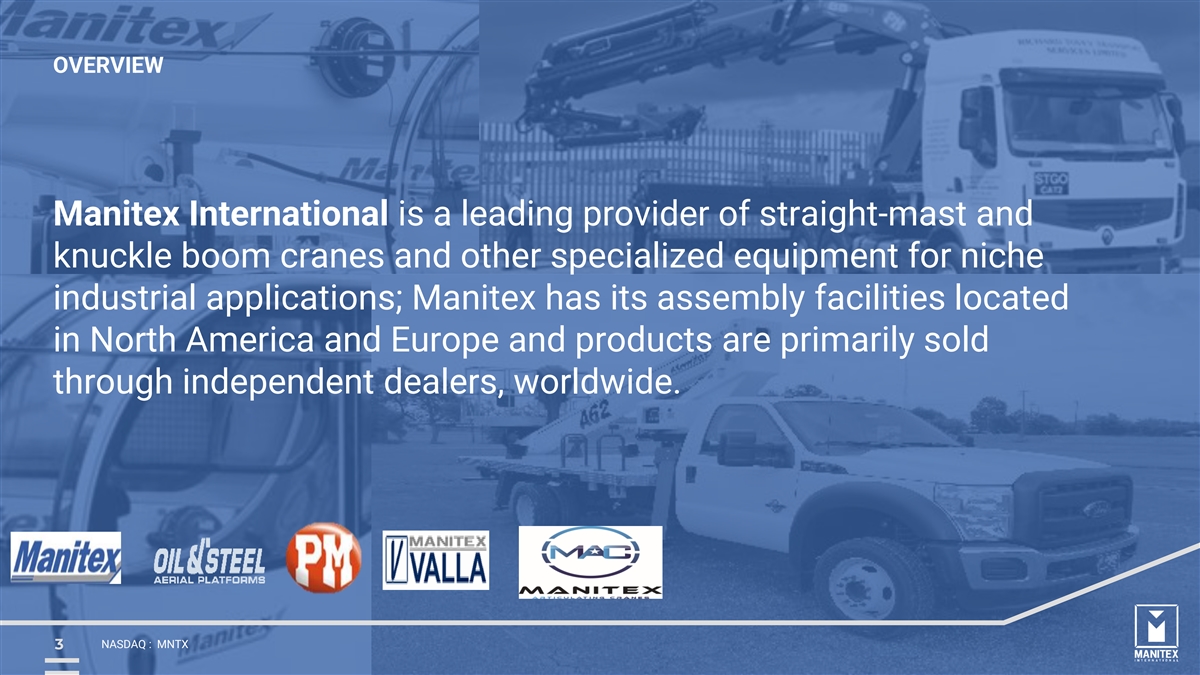
OVERVIEW Manitex International is a leading provider of straight-mast and knuckle boom cranes and other specialized equipment for niche industrial applications; Manitex has its assembly facilities located in North America and Europe and products are primarily sold through independent dealers, worldwide. NASDAQ : MNTX 3
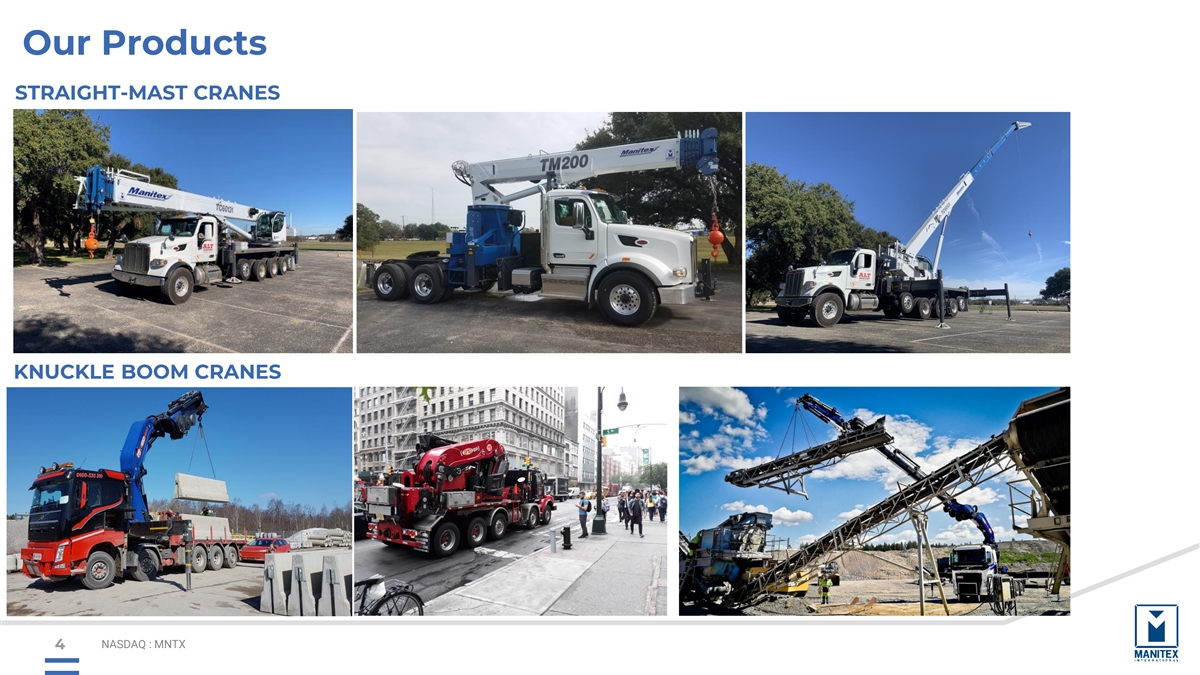
Our Products STRAIGHT-MAST CRANES KNUCKLE BOOM CRANES NASDAQ : MNTX 4
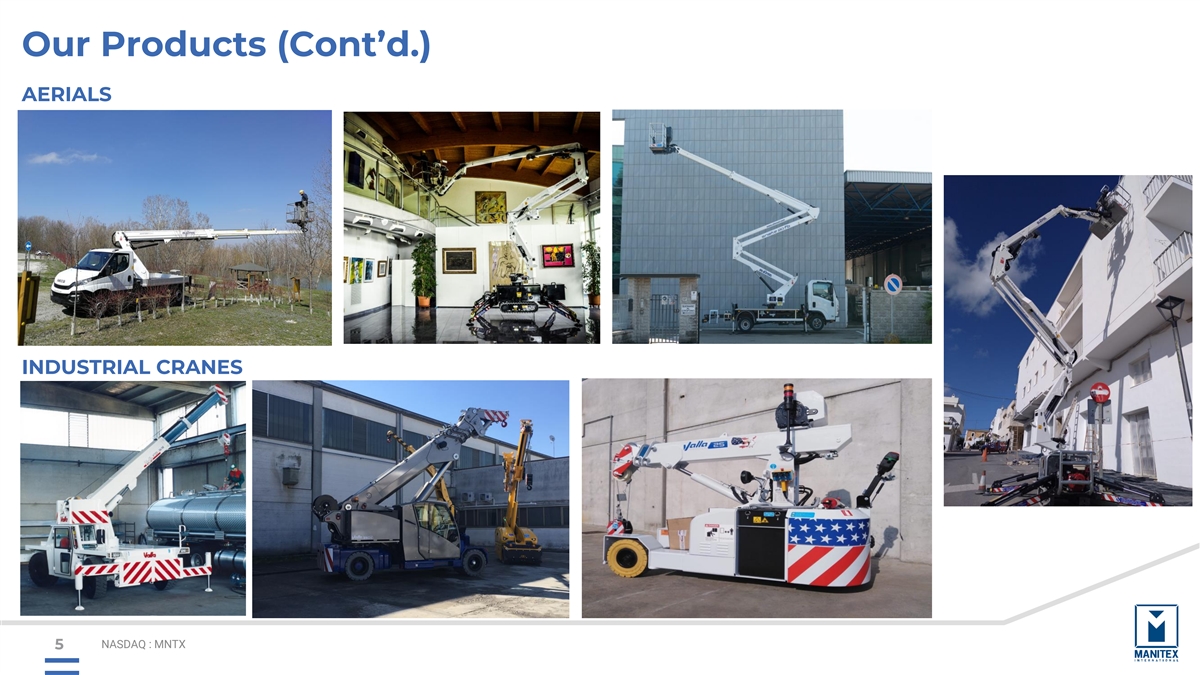
Our Products (Cont’d.) AERIALS INDUSTRIAL CRANES NASDAQ : MNTX 5
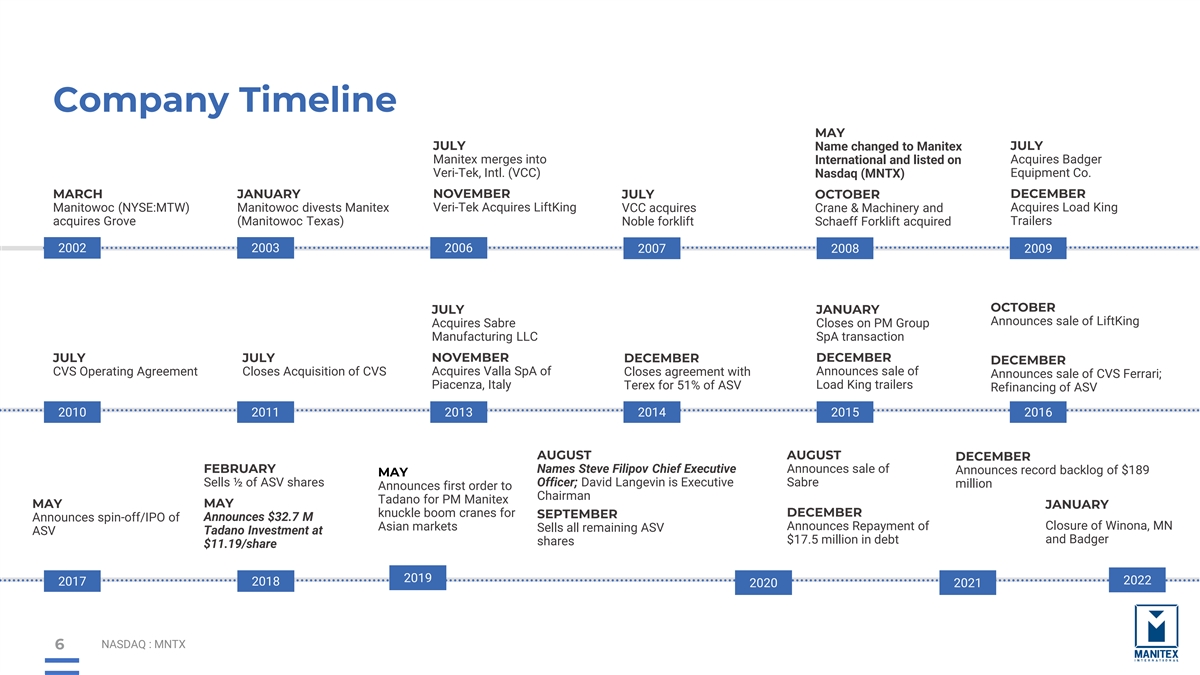
Company Timeline MAY JULY JULY Name changed to Manitex Manitex merges into International and listed on Acquires Badger Veri-Tek, Intl. (VCC) Nasdaq (MNTX) Equipment Co. MARCH JANUARY NOVEMBER JULY OCTOBER DECEMBER Veri-Tek Acquires LiftKing Acquires Load King Manitowoc (NYSE:MTW) Manitowoc divests Manitex VCC acquires Crane & Machinery and acquires Grove (Manitowoc Texas) Trailers Noble forklift Schaeff Forklift acquired 2002 2003 2006 2007 2008 2009 OCTOBER JULY JANUARY Announces sale of LiftKing Acquires Sabre Closes on PM Group Manufacturing LLC SpA transaction JULY JULY NOVEMBER DECEMBER DECEMBER DECEMBER Acquires Valla SpA of Announces sale of CVS Operating Agreement Closes Acquisition of CVS Closes agreement with Announces sale of CVS Ferrari; Piacenza, Italy Load King trailers Terex for 51% of ASV Refinancing of ASV 2010 2011 2013 2014 2015 2016 AUGUST AUGUST DECEMBER Names Steve Filipov Chief Executive Announces sale of FEBRUARY Announces record backlog of $189 MAY Sells ½ of ASV shares Officer; David Langevin is Executive Sabre million Announces first order to Chairman Tadano for PM Manitex MAY MAY JANUARY DECEMBER knuckle boom cranes for SEPTEMBER Announces spin-off/IPO of Announces $32.7 M Announces Repayment of Closure of Winona, MN Asian markets Sells all remaining ASV ASV Tadano Investment at $17.5 million in debt and Badger shares $11.19/share 2019 2022 2017 2018 2020 2021 NASDAQ : MNTX 6

Q4 Business Update Highlights ▪ Fourth quarter net sales increased 18.2% year-over-year, to $53.4 million, compared to $45.2 million in 2020 ▪ For the full year, net sales rose to $211.5 million from $167.5 million in 2020 ▪ Adjusted EBITDA was $0.3 million in the fourth quarter of fiscal 2021 versus $1.5 million in 2020 ▪ For the full year, Adjusted EBITDA rose to $8.0 million from $5.7 million in the prior-year period ▪ $189.0 million backlog – up 66% from Q3 2021 ▪ Book-to-bill ratio was 2.4:1 ▪ European business now represents 60% of total backlog ▪ North America backlog up 189% YTD Operations Balance Sheet and Credit ▪ Seeing greater stability in operations versus during the pandemic ▪ $23.8 million Total Net Debt ▪ Announced closure of Winona, MN facility and expecting positive cash flow ▪ Leverage ratio of less than 3.0 times trailing Adjusted EBITDA ▪ Order pipeline remains robust, representing enduring demand ▪ $37.6 million in Total Cash and Credit Availability ▪ Supply chain constraints and higher raw material costs still an issue, being mitigated as much as possible ▪ Managing working capital while dealing with supply chain issues ▪ Price increases are in effect, which should lead to gross margin expansion going forward NASDAQ : MNTX 7
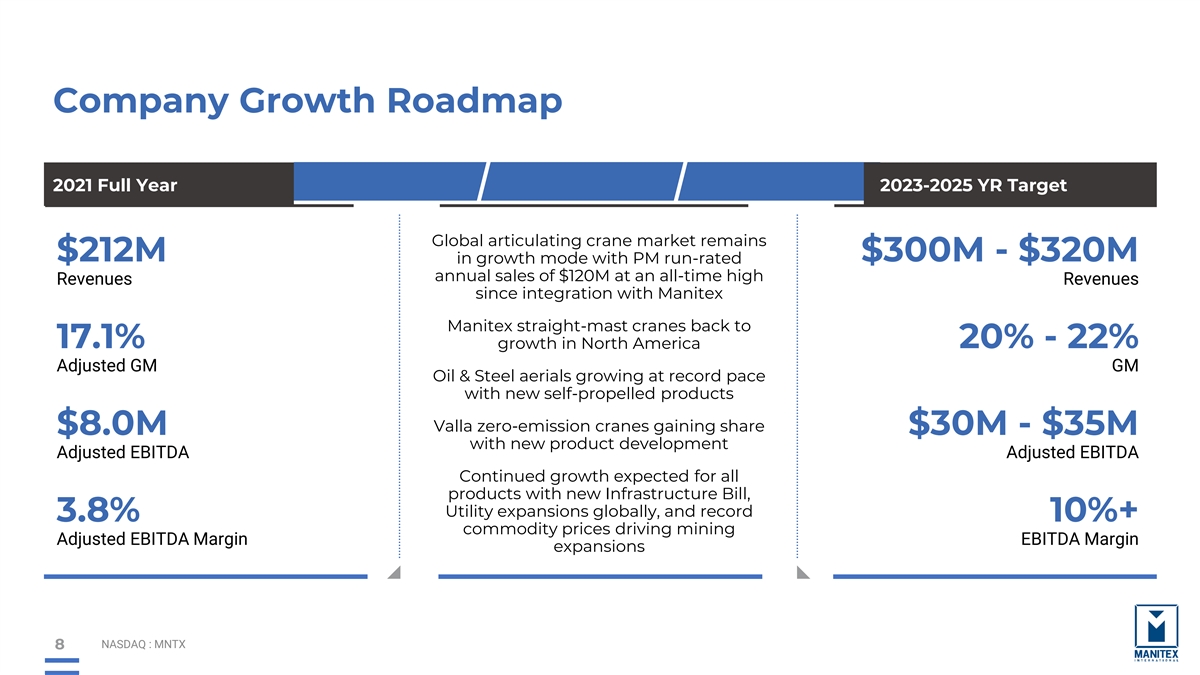
Company Growth Roadmap 2021 Full Year 2023-2025 YR Target Global articulating crane market remains $212M $300M - $320M in growth mode with PM run-rated annual sales of $120M at an all-time high Revenues Revenues since integration with Manitex Manitex straight-mast cranes back to 17.1% growth in North America 20% - 22% Adjusted GM GM Oil & Steel aerials growing at record pace with new self-propelled products Valla zero-emission cranes gaining share $8.0M $30M - $35M with new product development Adjusted EBITDA Adjusted EBITDA Continued growth expected for all products with new Infrastructure Bill, Utility expansions globally, and record 3.8% 10%+ commodity prices driving mining Adjusted EBITDA Margin EBITDA Margin expansions NASDAQ : MNTX 8
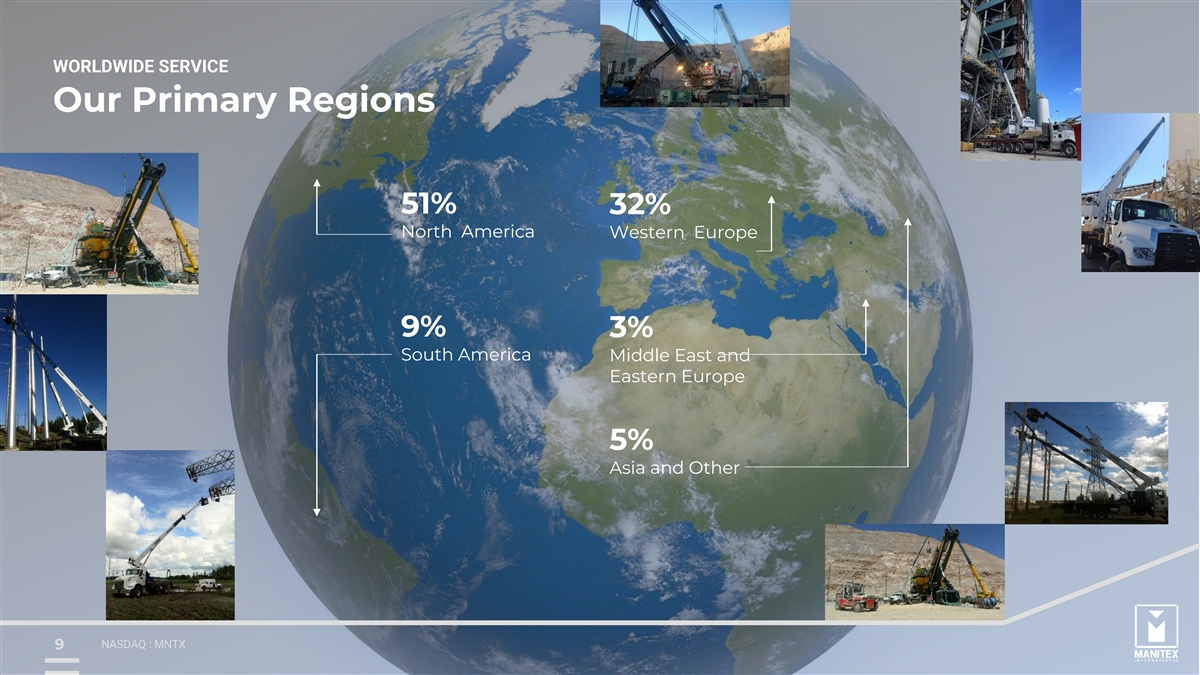
WORLDWIDE SERVICE Our Primary Regions 51% 32% North America Western Europe 9% 3% South America Middle East and Eastern Europe 5% Asia and Other NASDAQ : MNTX 9
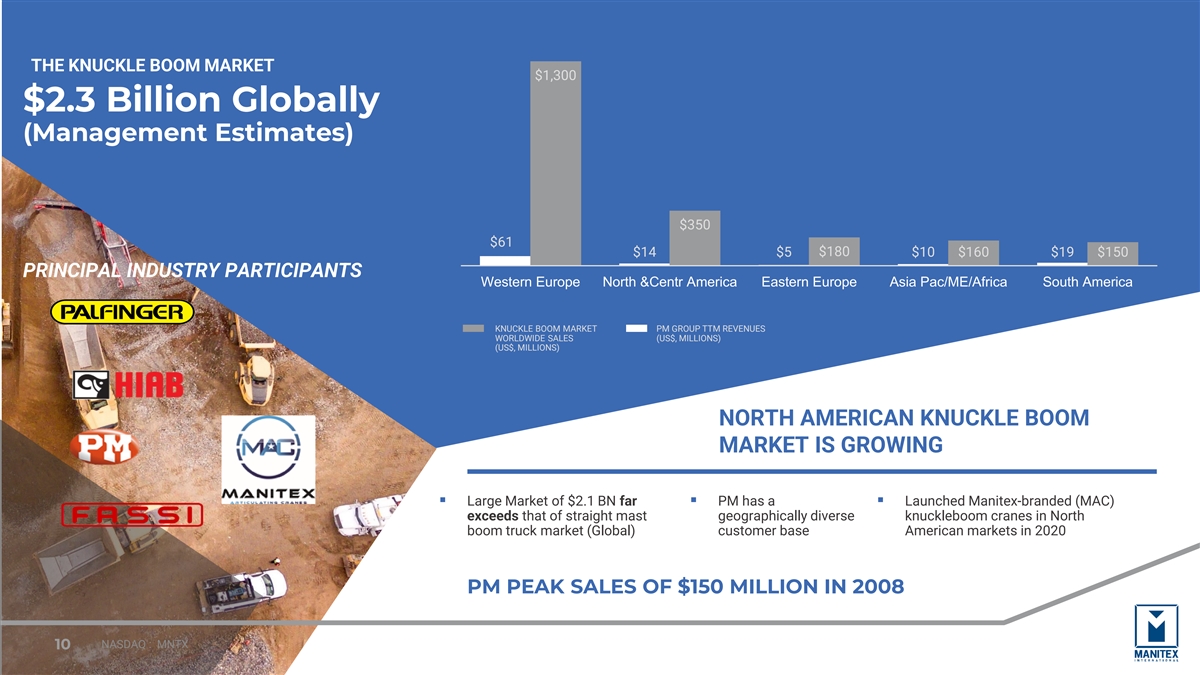
THE KNUCKLE BOOM MARKET $1,300 $2.3 Billion Globally (Management Estimates) $350 $61 $180 $14 $5 $10 $160 $19 $150 PRINCIPAL INDUSTRY PARTICIPANTS Western Europe North &Centr America Eastern Europe Asia Pac/ME/Africa South America KNUCKLE BOOM MARKET PM GROUP TTM REVENUES WORLDWIDE SALES (US$, MILLIONS) (US$, MILLIONS) NORTH AMERICAN KNUCKLE BOOM MARKET IS GROWING ▪ Large Market of $2.1 BN far ▪ PM has a ▪ Launched Manitex-branded (MAC) exceeds that of straight mast geographically diverse knuckleboom cranes in North boom truck market (Global) customer base American markets in 2020 PM PEAK SALES OF $150 MILLION IN 2008 NASDAQ : MNTX 10
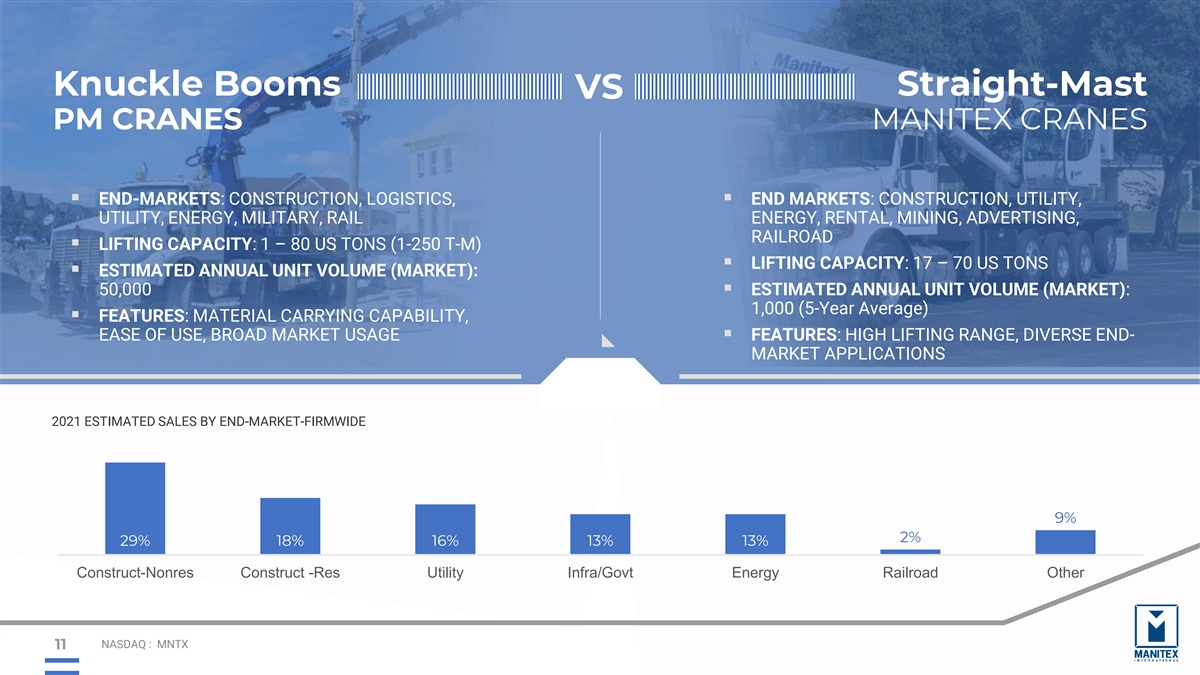
Knuckle Booms Straight-Mast VS PM CRANES MANITEX CRANES ▪ END-MARKETS: CONSTRUCTION, LOGISTICS, ▪ END MARKETS: CONSTRUCTION, UTILITY, UTILITY, ENERGY, MILITARY, RAIL ENERGY, RENTAL, MINING, ADVERTISING, RAILROAD ▪ LIFTING CAPACITY: 1 – 80 US TONS (1-250 T-M) ▪ LIFTING CAPACITY: 17 – 70 US TONS ▪ ESTIMATED ANNUAL UNIT VOLUME (MARKET): 50,000▪ ESTIMATED ANNUAL UNIT VOLUME (MARKET): 1,000 (5-Year Average) ▪ FEATURES: MATERIAL CARRYING CAPABILITY, EASE OF USE, BROAD MARKET USAGE▪ FEATURES: HIGH LIFTING RANGE, DIVERSE END- MARKET APPLICATIONS 2021 ESTIMATED SALES BY END-MARKET-FIRMWIDE 9% 2% 29% 18% 16% 13% 13% Construct-Nonres Construct -Res Utility Infra/Govt Energy Railroad Other NASDAQ : MNTX 11
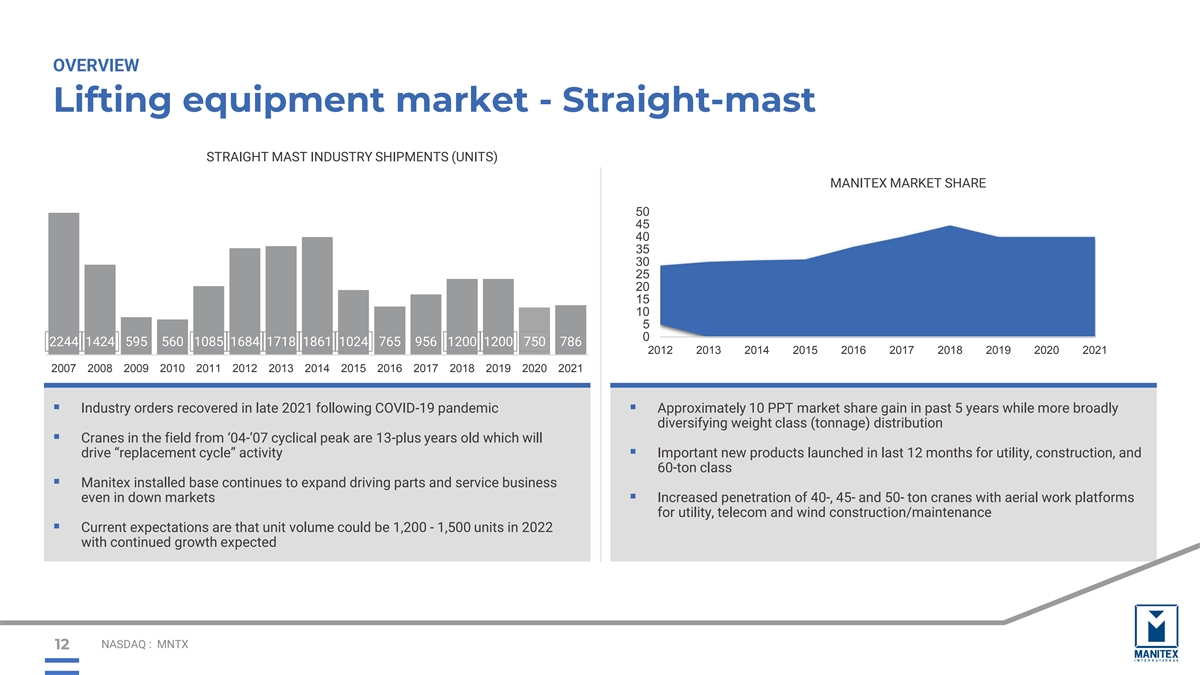
OVERVIEW Lifting equipment market - Straight-mast STRAIGHT MAST INDUSTRY SHIPMENTS (UNITS) MANITEX MARKET SHARE 50 45 40 35 30 25 20 15 10 5 0 2244 1424 595 560 1085 1684 1718 1861 1024 765 956 1200 1200 750 786 2012 2013 2014 2015 2016 2017 2018 2019 2020 2021 2007 2008 2009 2010 2011 2012 2013 2014 2015 2016 2017 2018 2019 2020 2021 ▪ Industry orders recovered in late 2021 following COVID-19 pandemic ▪ Approximately 10 PPT market share gain in past 5 years while more broadly diversifying weight class (tonnage) distribution ▪ Cranes in the field from ‘04-’07 cyclical peak are 13-plus years old which will drive “replacement cycle” activity▪ Important new products launched in last 12 months for utility, construction, and 60-ton class ▪ Manitex installed base continues to expand driving parts and service business even in down markets▪ Increased penetration of 40-, 45- and 50- ton cranes with aerial work platforms for utility, telecom and wind construction/maintenance ▪ Current expectations are that unit volume could be 1,200 - 1,500 units in 2022 with continued growth expected NASDAQ : MNTX 12
Replacements Parts & Service Consistent recurring revenue stream throughout the cycle Typically generates 10%-20% of net sales in a quarter/year Typically carry 2x gross margin of core equipment business Spares relate to swing drives, rotating components, cylinders, booms and other components, many of which are proprietary Serve additional brands Service team for crane equipment Proprietary e-commerce system implemented in principal operations NASDAQ : MNTX 13
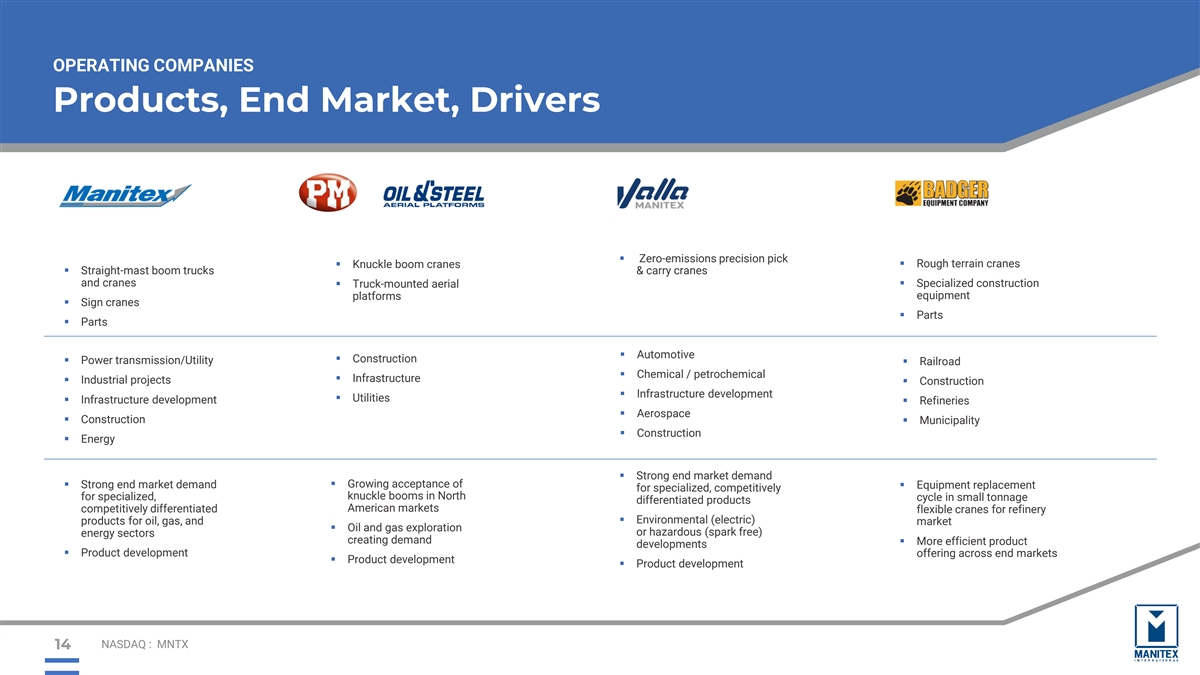
OPERATING COMPANIES Products, End Market, Drivers ▪ Zero-emissions precision pick ▪ Rough terrain cranes ▪ Knuckle boom cranes ▪ Straight-mast boom trucks & carry cranes and cranes ▪ Truck-mounted aerial ▪ Specialized construction equipment platforms ▪ Sign cranes ▪ Parts ▪ Parts ▪ Automotive ▪ Construction ▪ Power transmission/Utility ▪ Railroad ▪ Chemical / petrochemical ▪ Infrastructure ▪ Industrial projects ▪ Construction ▪ Infrastructure development ▪ Utilities ▪ Infrastructure development ▪ Refineries ▪ Aerospace ▪ Construction▪ Municipality ▪ Construction ▪ Energy ▪ Strong end market demand ▪ Growing acceptance of ▪ Strong end market demand ▪ Equipment replacement for specialized, competitively for specialized, knuckle booms in North cycle in small tonnage differentiated products competitively differentiated American markets flexible cranes for refinery ▪ Environmental (electric) products for oil, gas, and market ▪ Oil and gas exploration or hazardous (spark free) energy sectors creating demand ▪ More efficient product developments ▪ Product development offering across end markets ▪ Product development ▪ Product development NASDAQ : MNTX 14
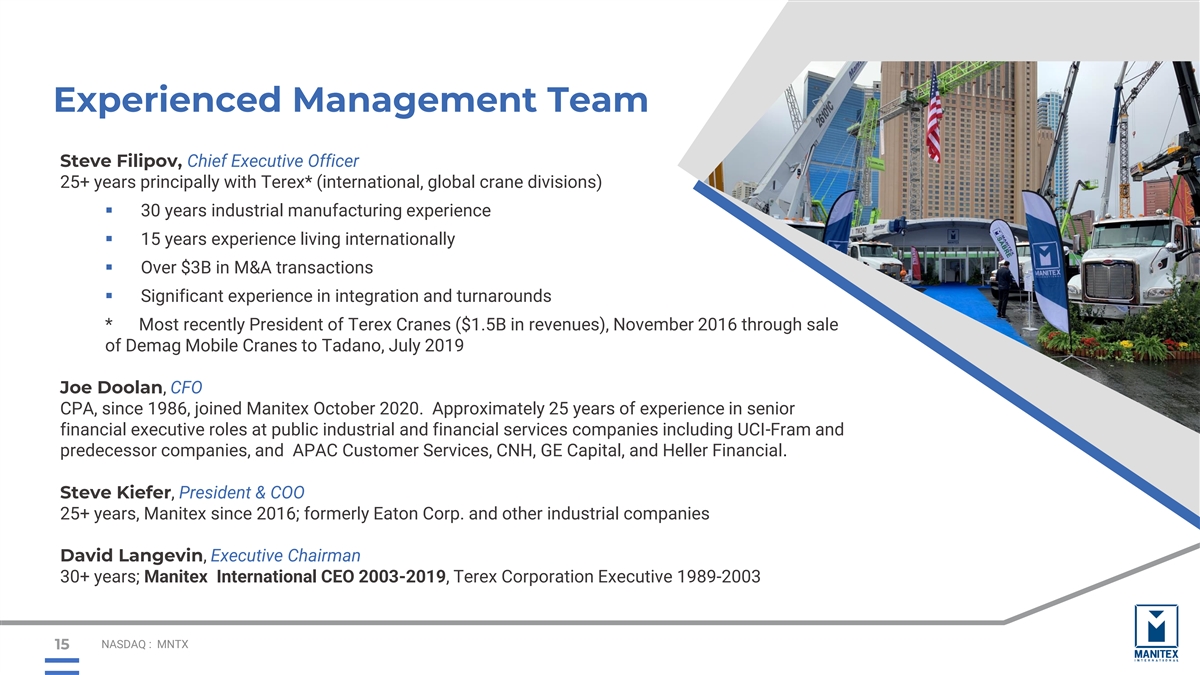
Experienced Management Team Steve Filipov, Chief Executive Officer 25+ years principally with Terex* (international, global crane divisions) ▪ 30 years industrial manufacturing experience ▪ 15 years experience living internationally ▪ Over $3B in M&A transactions ▪ Significant experience in integration and turnarounds * Most recently President of Terex Cranes ($1.5B in revenues), November 2016 through sale of Demag Mobile Cranes to Tadano, July 2019 Joe Doolan, CFO CPA, since 1986, joined Manitex October 2020. Approximately 25 years of experience in senior financial executive roles at public industrial and financial services companies including UCI-Fram and predecessor companies, and APAC Customer Services, CNH, GE Capital, and Heller Financial. Steve Kiefer, President & COO 25+ years, Manitex since 2016; formerly Eaton Corp. and other industrial companies David Langevin, Executive Chairman 30+ years; Manitex International CEO 2003-2019, Terex Corporation Executive 1989-2003 NASDAQ : MNTX 15
Financial Overview 16
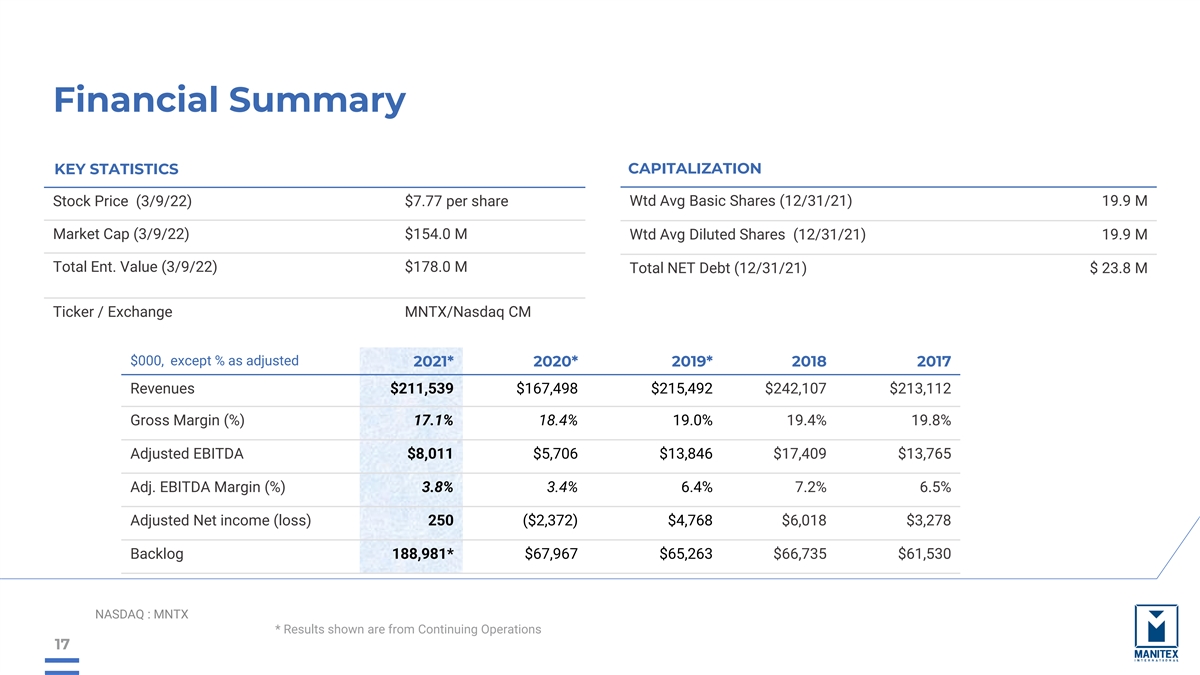
Financial Summary CAPITALIZATION KEY STATISTICS Stock Price (3/9/22) $7.77 per share Wtd Avg Basic Shares (12/31/21) 19.9 M Market Cap (3/9/22) $154.0 M Wtd Avg Diluted Shares (12/31/21) 19.9 M Total Ent. Value (3/9/22) $178.0 M Total NET Debt (12/31/21) $ 23.8 M Ticker / Exchange MNTX/Nasdaq CM $000, except % as adjusted 2021* 2020* 2019* 2018 2017 Revenues $211,539 $167,498 $215,492 $242,107 $213,112 Gross Margin (%) 17.1% 18.4% 19.0% 19.4% 19.8% Adjusted EBITDA $8,011 $5,706 $13,846 $17,409 $13,765 Adj. EBITDA Margin (%) 3.8% 3.4% 6.4% 7.2% 6.5% Adjusted Net income (loss) 250 ($2,372) $4,768 $6,018 $3,278 Backlog 188,981* $67,967 $65,263 $66,735 $61,530 NASDAQ : MNTX * Results shown are from Continuing Operations 17
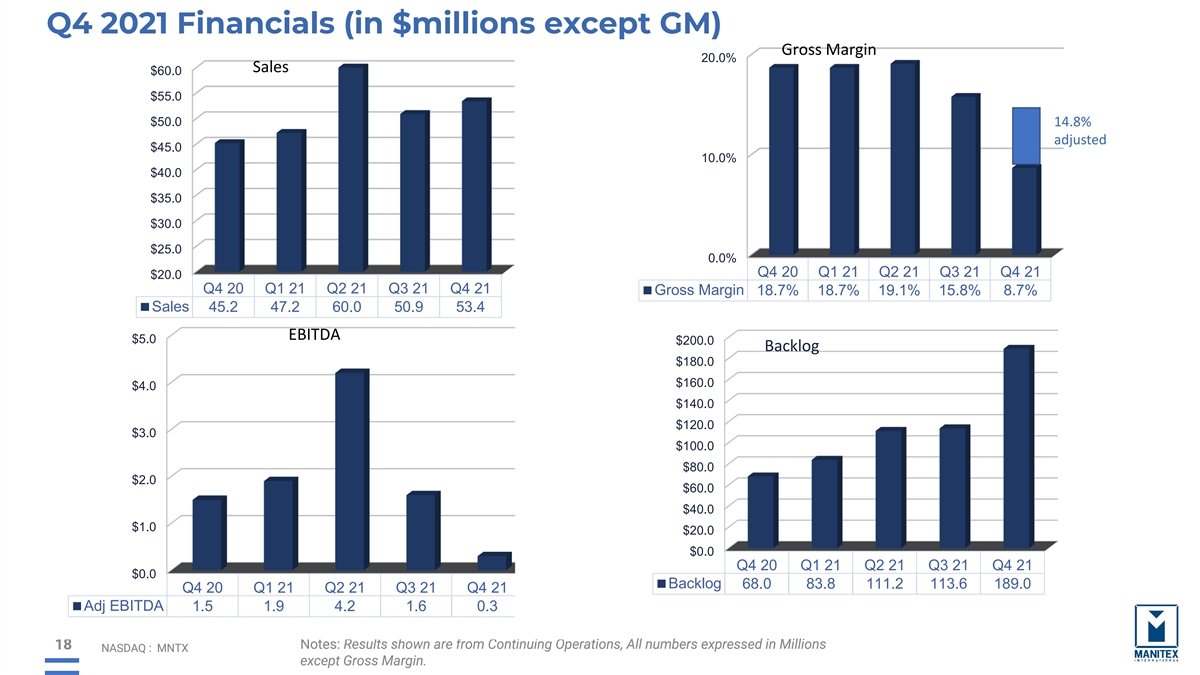
Q4 2021 Financials (in $millions except GM) Gross Margin 20.0% Sales $60.0 $55.0 $50.0 14.8% adjusted $45.0 10.0% $40.0 $35.0 $30.0 $25.0 0.0% Q4 20 Q1 21 Q2 21 Q3 21 Q4 21 $20.0 Q4 20 Q1 21 Q2 21 Q3 21 Q4 21 Gross Margin 18.7% 18.7% 19.1% 15.8% 8.7% Sales 45.2 47.2 60.0 50.9 53.4 EBITDA $5.0 $200.0 Backlog $180.0 $160.0 $4.0 $140.0 $120.0 $3.0 $100.0 $80.0 $2.0 $60.0 $40.0 $1.0 $20.0 $0.0 Q4 20 Q1 21 Q2 21 Q3 21 Q4 21 $0.0 Backlog 68.0 83.8 111.2 113.6 189.0 Q4 20 Q1 21 Q2 21 Q3 21 Q4 21 Adj EBITDA 1.5 1.9 4.2 1.6 0.3 N No otes tes: : Re Results sults shown shown a are re from from Cont Contiin nuing uing O Ope perati rations, ons, All All n num umbe bers ex rs expr pre esse ssed d iin n Mi Milllliions ons 18 18 N NAS ASDAQ DAQ : : M MN NT TX X e ex xcep cept t Gr Gross Ma oss Mar rgin gin. ..

Full Year Performance Sales Adjusted EBITDA +40% +26% $250 $8 $200 $6 $150 $4 $100 $2 $50 $0 $0 2020 2021 2020 2021 Sales $167.5 $211.5 Adj EBITDA $5.7 $8.0 19
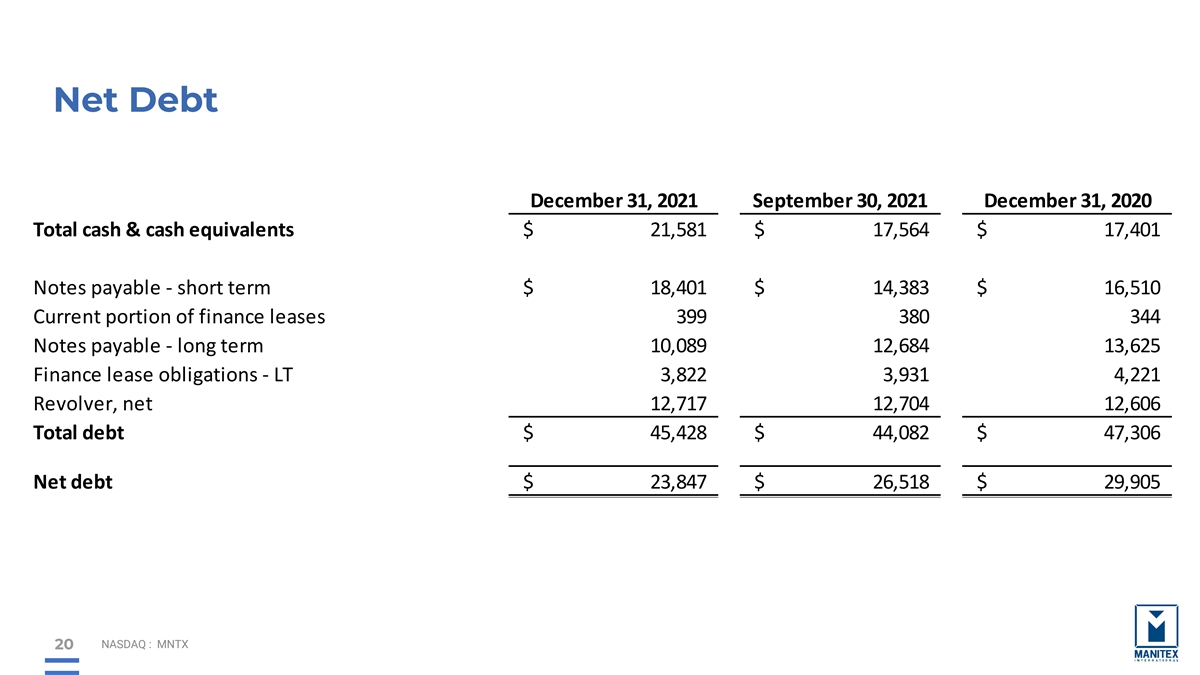
Net Debt December 31, 2021 September 30, 2021 December 31, 2020 Total cash & cash equivalents $ 21,581 $ 1 7,564 $ 1 7,401 Notes payable - short term $ 18,401 $ 14,383 $ 16,510 Current portion of finance leases 399 380 344 Notes payable - long term 1 0,089 1 2,684 13,625 Finance lease obligations - LT 3 ,822 3 ,931 4,221 Revolver, net 12,717 12,704 12,606 Total debt $ 45,428 $ 4 4,082 $ 47,306 Net debt $ 2 3,847 $ 2 6,518 $ 2 9,905 NASDAQ : MNTX 20
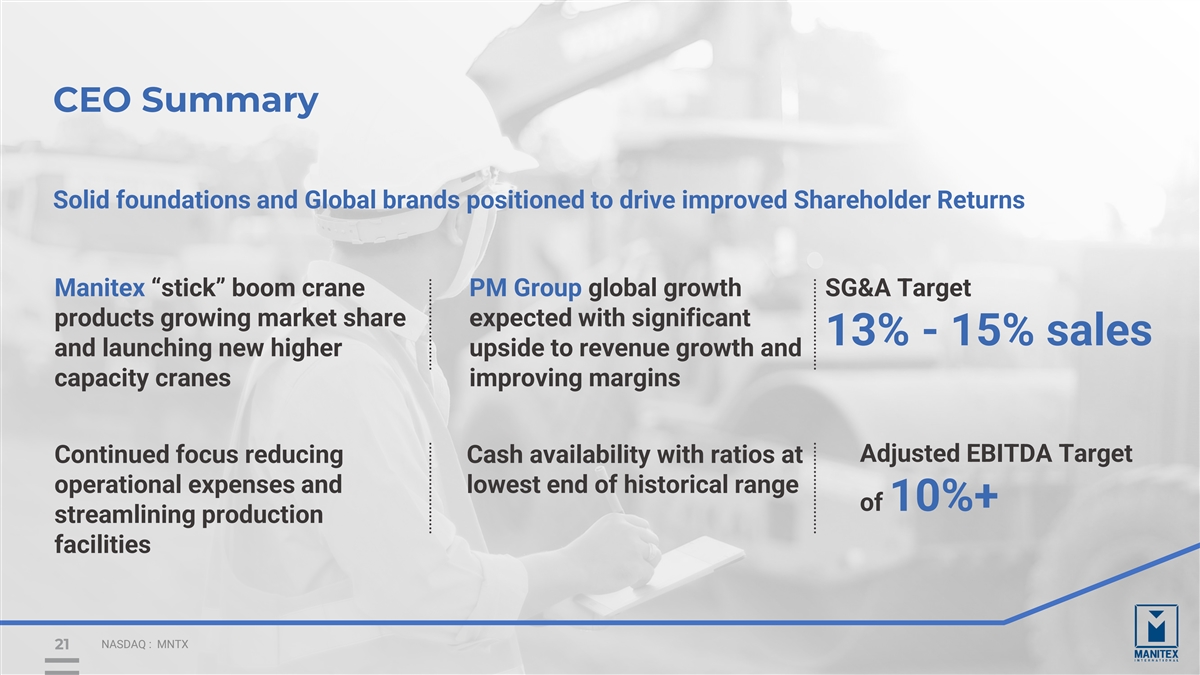
CEO Summary Solid foundations and Global brands positioned to drive improved Shareholder Returns Manitex “stick” boom crane PM Group global growth SG&A Target products growing market share expected with significant 13% - 15% sales and launching new higher upside to revenue growth and capacity cranes improving margins Adjusted EBITDA Target Continued focus reducing Cash availability with ratios at operational expenses and lowest end of historical range of 10%+ streamlining production facilities NASDAQ : MNTX 21
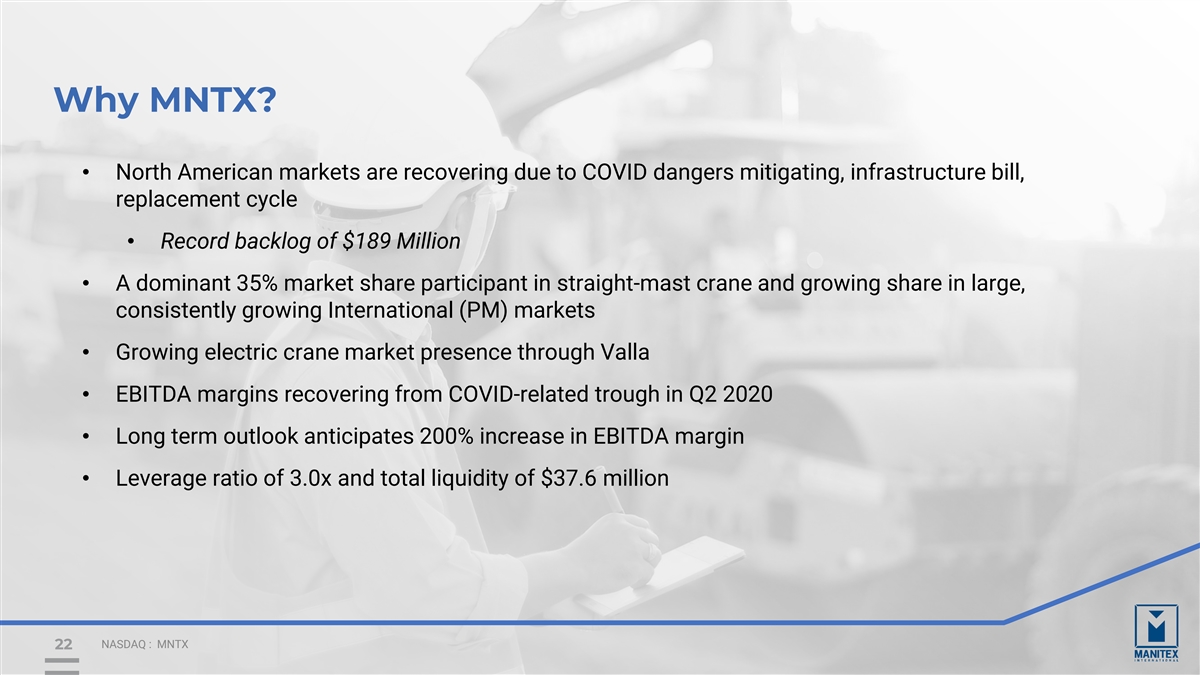
Why MNTX? • North American markets are recovering due to COVID dangers mitigating, infrastructure bill, replacement cycle • Record backlog of $189 Million • A dominant 35% market share participant in straight-mast crane and growing share in large, consistently growing International (PM) markets • Growing electric crane market presence through Valla • EBITDA margins recovering from COVID-related trough in Q2 2020 • Long term outlook anticipates 200% increase in EBITDA margin • Leverage ratio of 3.0x and total liquidity of $37.6 million NASDAQ : MNTX 22

MANITEX INTERNATIONAL, INC. NASDAQ: MNTX March 2022


