Exhibit 99.1 CORPORATE PRESENTATION August 2022 NASDAQ: MNTX NASDAQ CM: AGIL
Forward-Looking Statement and Non-GAAP Measures Safe Harbor Statement under the U.S. Private Securities Litigation Reform Act of 1995: This presentation contains statements that are forward-looking in nature which express the beliefs and expectations of management including statements regarding the Company’s expected results of operations or liquidity; statements concerning projections, predictions, expectations, estimates or forecasts as to our business, financial and operational results and future economic performance; and statements of management’s goals and objectives and other similar expressions concerning matters that are not historical facts. In some cases, you can identify forward-looking statements by terminology such as “anticipate,” “estimate,” “plan,” “project,” “continuing,” “ongoing,” “expect,” “we believe,” “we intend,” “may,” “will,” “should,” “could,” and similar expressions. Such statements are based on current plans, estimates and expectations and involve a number of known and unknown risks, uncertainties and other factors that could cause the Company's future results, performance or achievements to differ significantly from the results, performance or achievements expressed or implied by such forward-looking statements. These factors and additional information are discussed in the Company's filings with the Securities and Exchange Commission and statements in this presentation should be evaluated in light of these important factors. Although we believe that these statements are based upon reasonable assumptions, we cannot guarantee future results. Forward-looking statements speak only as of the date on which they are made, and the Company undertakes no obligation to update publicly or revise any forward-looking statement, whether as a result of new information, future developments or otherwise. Non-GAAP Measures: Manitex International from time to time refers to various non-GAAP (generally accepted accounting principles) financial measures in this presentation. Manitex believes that this information is useful to understanding its operating results without the impact of special items. See Manitex’s Q2 2022 earnings release on the Investor Relations section of our website www.manitexinternational.com for a description and/or reconciliation of these measures. NASDAQ: MNTX 2
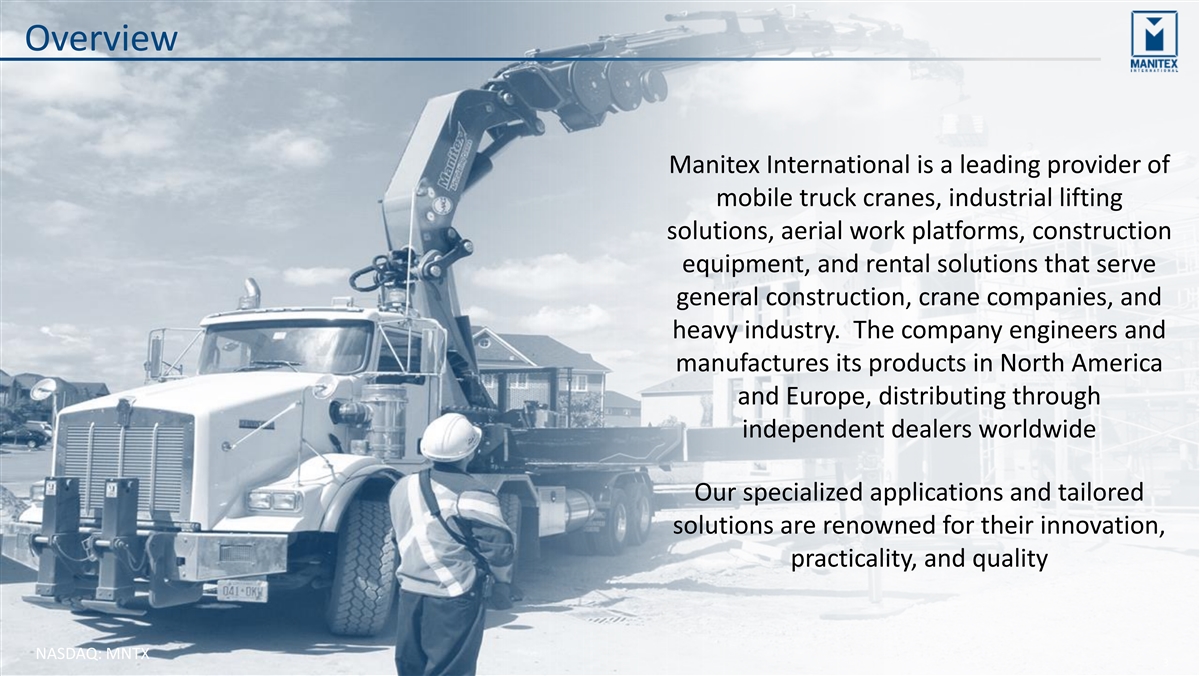
Overview Manitex International is a leading provider of mobile truck cranes, industrial lifting solutions, aerial work platforms, construction equipment, and rental solutions that serve general construction, crane companies, and heavy industry. The company engineers and manufactures its products in North America and Europe, distributing through independent dealers worldwide Our specialized applications and tailored solutions are renowned for their innovation, practicality, and quality NASDAQ: MNTX 3
2022 Corporate Milestones: Michael Coffey Named CEO, Acquisition of Rabern Rentals, April 2022 MICHAEL COFFEY ▪ 25 years of industry experience spanning operations management, strategic integrations, manufacturing, and M&A as Director, General Manager, Chief Executive Officer, and Chief Operating Officer ▪ Experience includes heavy equipment manufacturing and service providers such as H-E International (sold to Hitachi Construction Machinery in 2016), a private equity backed enterprise serving mining, oil & gas, and power generation markets; Old Castle Materials, a subsidiary of CRH International; and AMECO, a subsidiary of Fluor ▪ Worked with Manitex International management to identify, negotiate, and close Rabern Rentals transaction RABERN RENTALS ▪ Annual revenues in 2021 of $21 million and $8 million Adjusted EBITDA ▪ Three locations, currently adding fourth, all in Texas ▪ Fleet/Rentals include 1,700 machines ▪ Gross Margins and Adjusted EBITDA margins are multiples of Manitex currently NASDAQ: MNTX 4
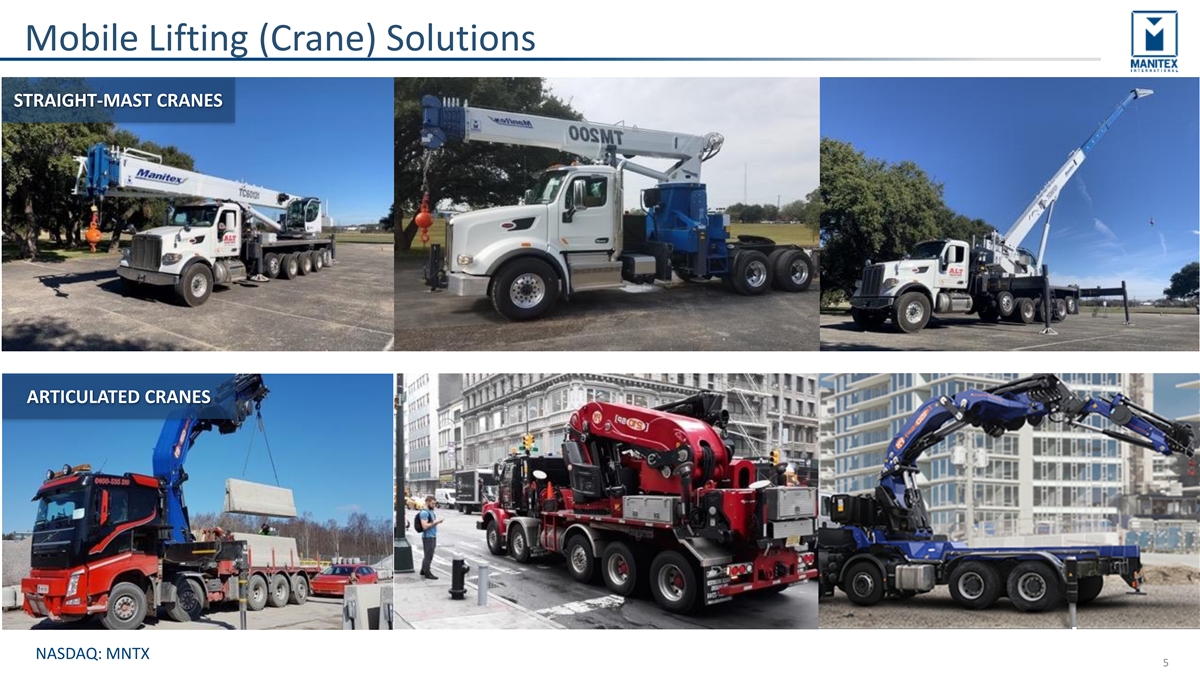
Mobile Lifting (Crane) Solutions STRAIGHT-MAST CRANES ARTICULATED CRANES NASDAQ: MNTX 5
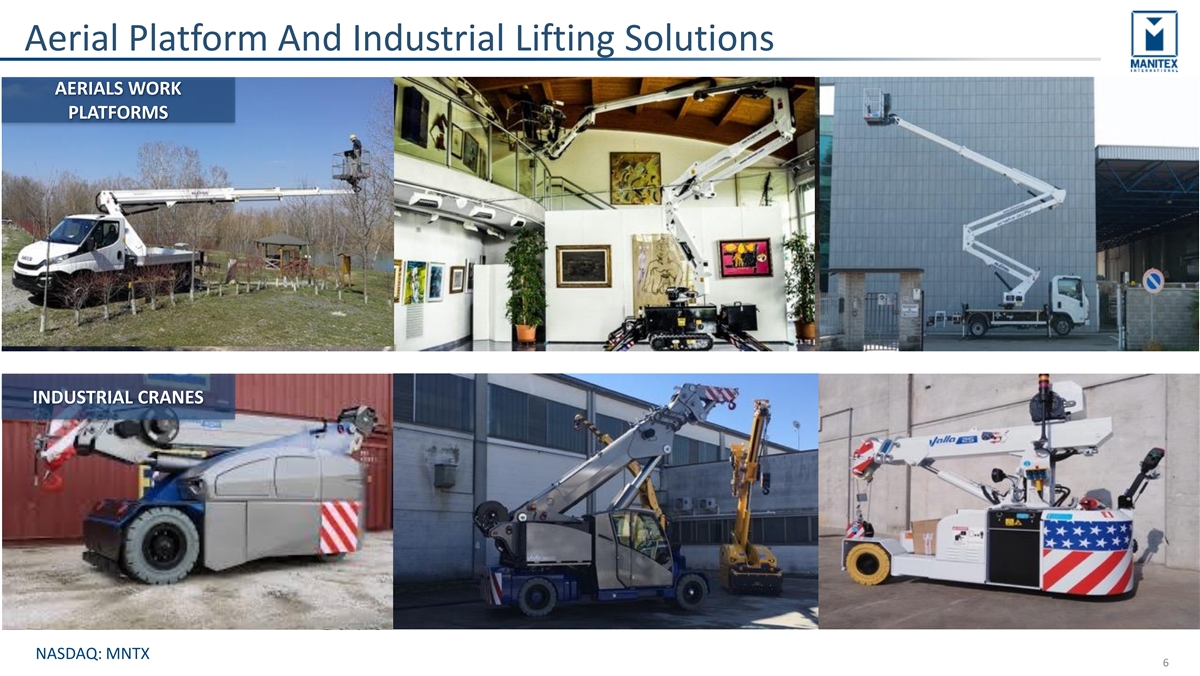
Aerial Platform And Industrial Lifting Solutions AERIALS WORK PLATFORMS INDUSTRIAL CRANES NASDAQ: MNTX 6
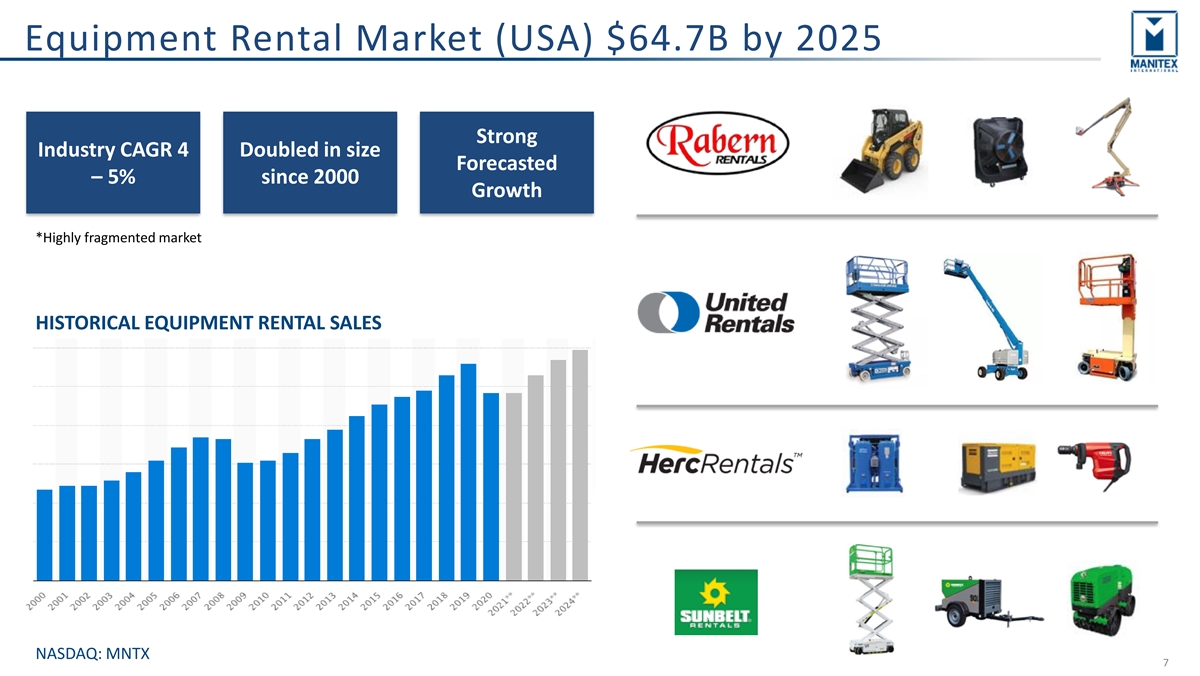
Equipment Rental Market (USA) $64.7B by 2025 Strong Industry CAGR 4 Doubled in size Forecasted – 5% since 2000 Growth *Highly fragmented market HISTORICAL EQUIPMENT RENTAL SALES NASDAQ: MNTX 7

Investment Highlights – 1H 2022 ▪ Q2 Highlights included 16% increase in net sales, 7.4% Adjusted EBITDA margin, and continued rise in backlog to a record $214 million as of 6/30/22 ▪ Continued dominant 35% estimated market share in straight-mast crane and growing share in large, consistently growing International (PM) markets ▪ Growing electric power/clean tech market presence through Valla Cranes and Oil & Steel AWP ▪ Margin recovery plan in place with Rabern Rental acquisition - announced 1H 2022 - leading the way ▪ $42 million in total liquidity (cash and credit line availability) as of 6/30/22 NASDAQ: MNTX 8
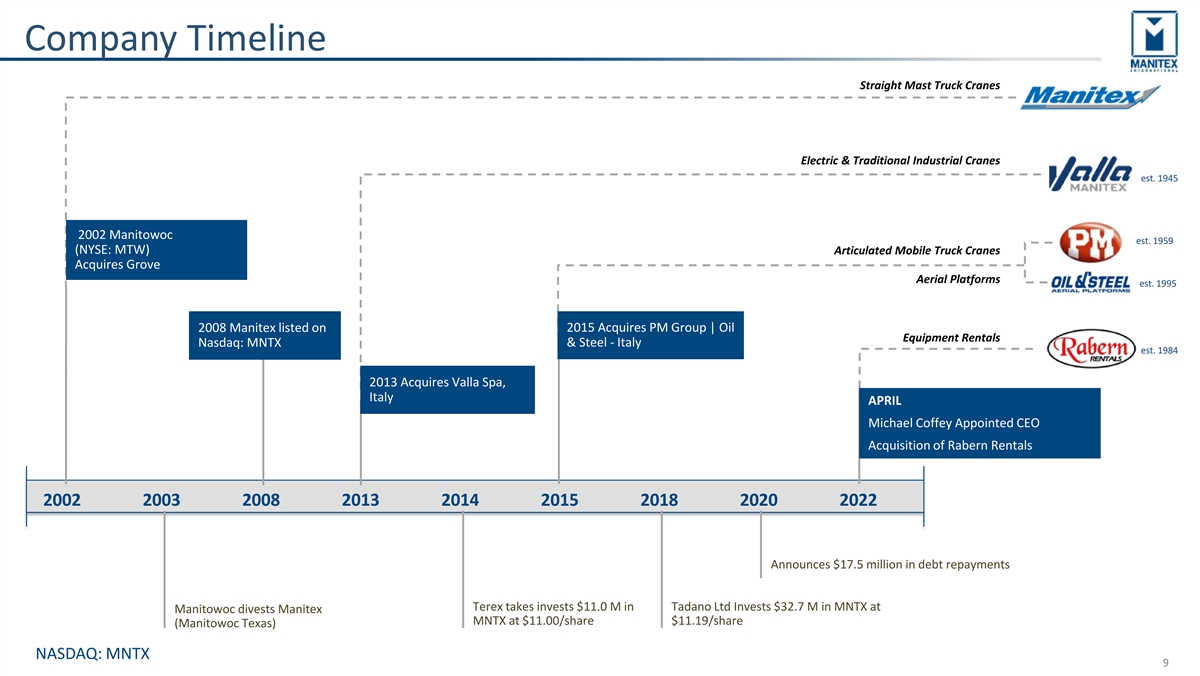
Company Timeline Straight Mast Truck Cranes Electric & Traditional Industrial Cranes est. 1945 2002 Manitowoc est. 1959 (NYSE: MTW) Articulated Mobile Truck Cranes Acquires Grove Aerial Platforms est. 1995 2008 Manitex listed on 2015 Acquires PM Group | Oil Equipment Rentals Nasdaq: MNTX & Steel - Italy est. 1984 2013 Acquires Valla Spa, Italy APRIL Michael Coffey Appointed CEO Acquisition of Rabern Rentals 2002 2003 2008 2013 2014 2015 2018 2020 2022 Announces $17.5 million in debt repayments Terex takes invests $11.0 M in Tadano Ltd Invests $32.7 M in MNTX at Manitowoc divests Manitex MNTX at $11.00/share $11.19/share (Manitowoc Texas) NASDAQ: MNTX 9
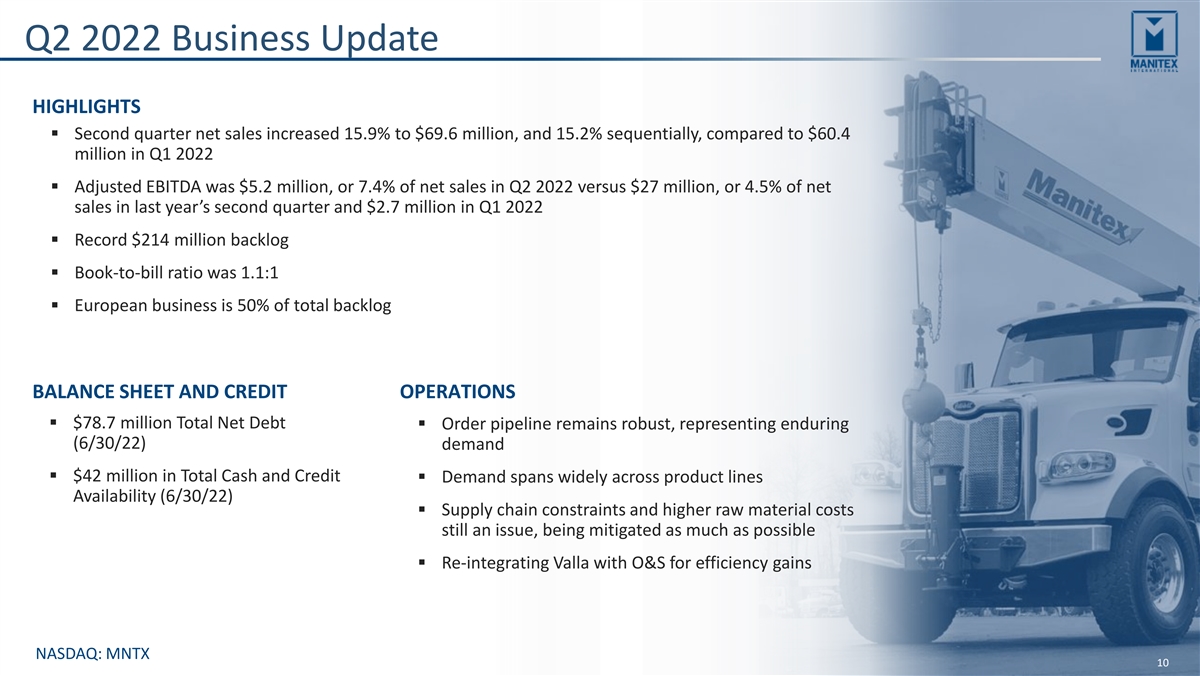
Q2 2022 Business Update HIGHLIGHTS ▪ Second quarter net sales increased 15.9% to $69.6 million, and 15.2% sequentially, compared to $60.4 million in Q1 2022 ▪ Adjusted EBITDA was $5.2 million, or 7.4% of net sales in Q2 2022 versus $27 million, or 4.5% of net sales in last year’s second quarter and $2.7 million in Q1 2022 ▪ Record $214 million backlog ▪ Book-to-bill ratio was 1.1:1 ▪ European business is 50% of total backlog BALANCE SHEET AND CREDIT OPERATIONS ▪ $78.7 million Total Net Debt ▪ Order pipeline remains robust, representing enduring (6/30/22) demand ▪ $42 million in Total Cash and Credit ▪ Demand spans widely across product lines Availability (6/30/22) ▪ Supply chain constraints and higher raw material costs still an issue, being mitigated as much as possible ▪ Re-integrating Valla with O&S for efficiency gains NASDAQ: MNTX 10

Company Growth Roadmap 2022 Q2 2023-2025 YR TARGET PM Group remains in growth mode with run- rated annual sales of approximately $110M $260M $300M - $320M ANNUAL RUN-RATE REVENUES REVENUES Manitex straight-mast cranes maintaining leading market share in North America Oil & Steel aerials growing at record pace with new self-propelled products 20% - 22% 17.8% GM GM Valla | Oil & Steel zero-emission cranes gaining share with new product development Continued growth expected for all products with new Infrastructure bill, utility expansions $214M $30M - $35M globally, and record commodity prices driving BACKLOG ADJUSTED EBITDA mining expansions $5.2M 10% ADJ. EBITDA ADJ. EBITDA MARGIN NASDAQ: MNTX 11
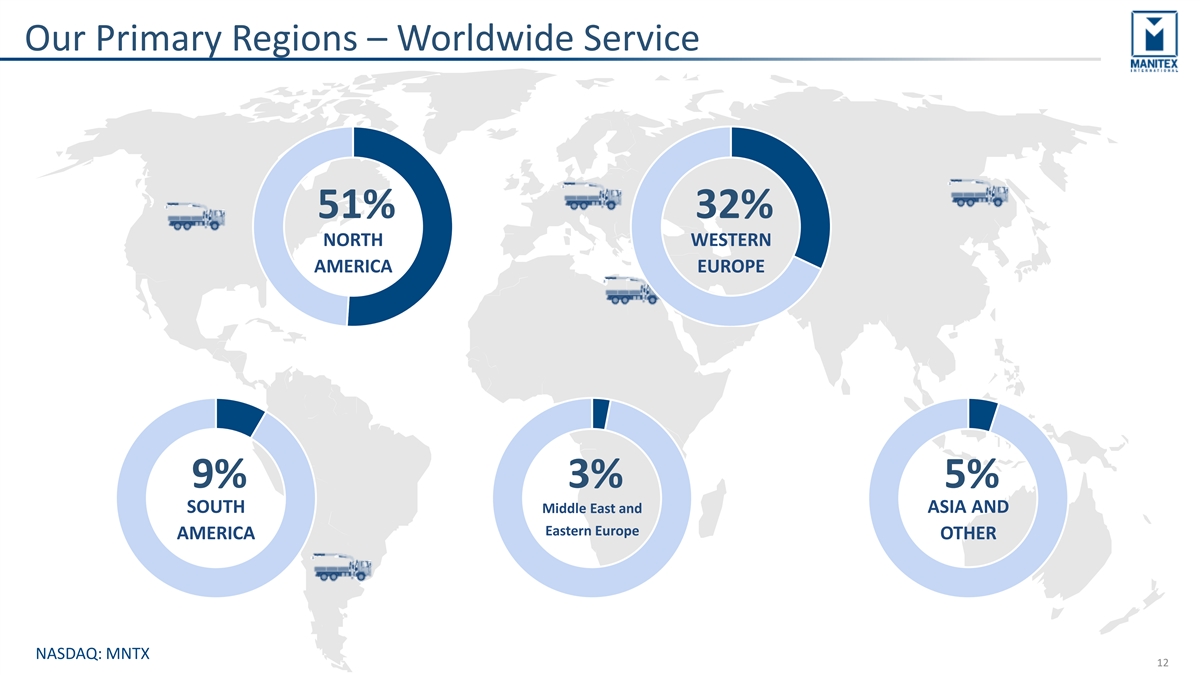
Our Primary Regions – Worldwide Service 51% 32% NORTH WESTERN AMERICA EUROPE 9% 3% 5% SOUTH Middle East and ASIA AND Eastern Europe AMERICA OTHER NASDAQ: MNTX 12
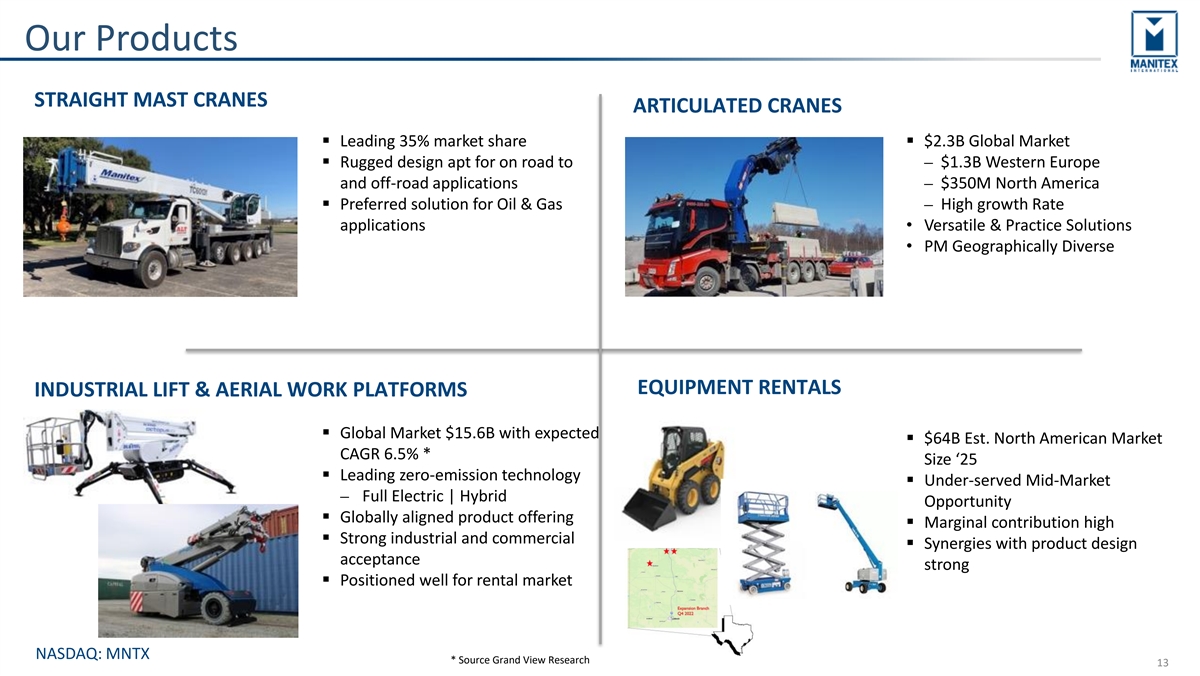
Our Products STRAIGHT MAST CRANES ARTICULATED CRANES ▪ Leading 35% market share▪ $2.3B Global Market ▪ Rugged design apt for on road to ⎼ $1.3B Western Europe and off-road applications⎼ $350M North America ▪ Preferred solution for Oil & Gas ⎼ High growth Rate applications• Versatile & Practice Solutions • PM Geographically Diverse EQUIPMENT RENTALS INDUSTRIAL LIFT & AERIAL WORK PLATFORMS ▪ Global Market $15.6B with expected ▪ $64B Est. North American Market CAGR 6.5% * Size ‘25 ▪ Leading zero-emission technology ▪ Under-served Mid-Market ⎼ Full Electric | Hybrid Opportunity ▪ Globally aligned product offering ▪ Marginal contribution high ▪ Strong industrial and commercial ▪ Synergies with product design acceptance strong ▪ Positioned well for rental market NASDAQ: MNTX * Source Grand View Research 13

Products Brands and End Markets PRODUCT SOLUTIONS MARKETS ▪ Oil & Gas (Upstream | Refining | Downstream) ▪ Mobile straight-Mast Cranes ⎼ North America | Mid-East ▪ Crane Mounted Aerial Work Platforms ▪ Energy Transmission ▪ Mobile lifting solutions to 65T ▪ Industrial | Transportation | Mining & Metals ▪ Versatile and highly serviceable ▪ Mobile Articulated Truck Cranes▪ Growing acceptance of articulated cranes in North American markets ▪ Specialty metro area solutions▪ Tailored to general construction, material delivery, waste removal semi or fully remote controlled ▪ Versatile with unique tailoring capabilities ▪ Highly serviceable ▪ Truck mounted & self-drive solutions▪ General construction ▪ Leading net-zero emissions technology▪ Industrial maintenance ▪ Universally accepted applications (EU / Americas▪ Mobile aerial maintenance ▪ Aerospace ▪ Zero-emissions precision pick & carry cranes ▪ Clean Room applications ▪ 2.5T – 90T solutions ▪ Industrial environments / Manufacturing ▪ Self-driven or remote ▪ Remanufacturing & Repair ▪ Ingenious crane to forklift, window glazing, multi- function attachments ▪ Heavy | Light Duty Equipment Rentals ▪ General Construction ▪ Construction Consumables ▪ Road / Highway and Civil ▪ Servicing Amarillo market ▪ Landscaping & Tree Care th ▪ 3 locations (4 currently being added in Lubbock, ▪ Highrise, shut-down and in plant maintenance TX) NASDAQ: MNTX 14
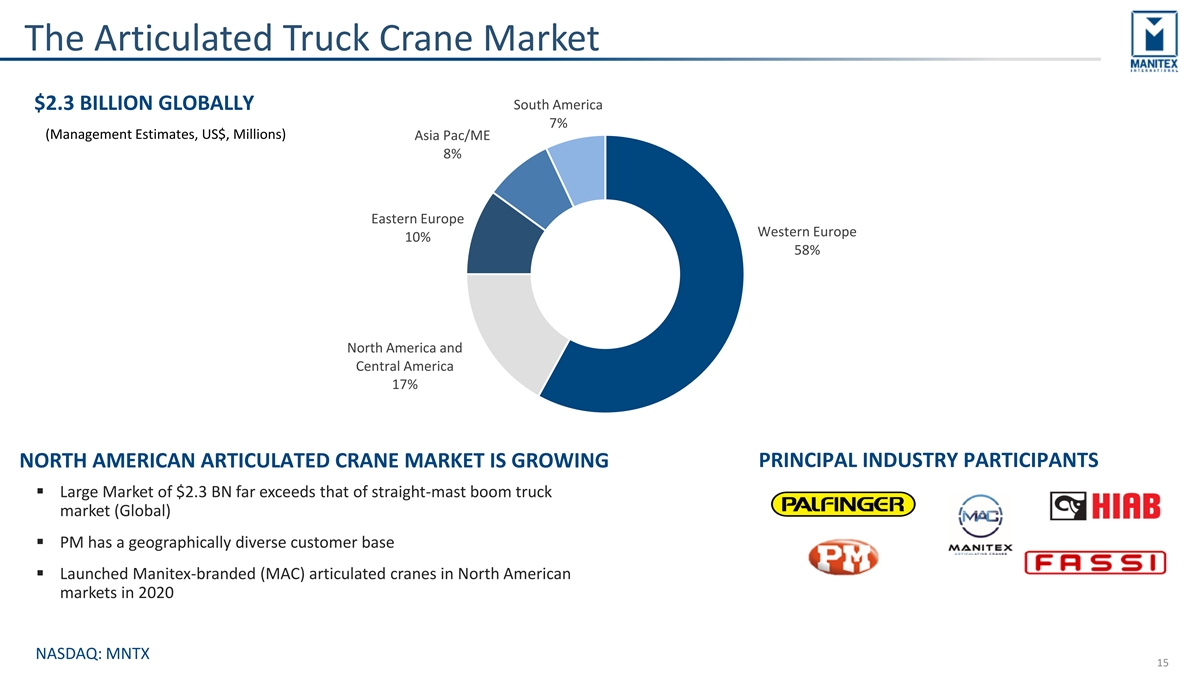
The Articulated Truck Crane Market $2.3 BILLION GLOBALLY South America 7% (Management Estimates, US$, Millions) Asia Pac/ME 8% Eastern Europe Western Europe 10% 58% North America and Central America 17% PRINCIPAL INDUSTRY PARTICIPANTS NORTH AMERICAN ARTICULATED CRANE MARKET IS GROWING ▪ Large Market of $2.3 BN far exceeds that of straight-mast boom truck market (Global) ▪ PM has a geographically diverse customer base ▪ Launched Manitex-branded (MAC) articulated cranes in North American markets in 2020 NASDAQ: MNTX 15
Replacements Parts & Service ▪ Consistent recurring revenue stream throughout the cycle ▪ Typically generates 10%-20% of net sales in a quarter/year ▪ Typically carries 2x gross margin of core equipment business ▪ Spares relate to swing drives, rotating components, cylinders, booms and other components, many of which are proprietary ▪ Serve additional brands ▪ Service team for crane equipment ▪ Proprietary e-commerce dealer system implemented in principal operations NASDAQ: MNTX 16

FINANCIAL OVERVIEW NASDAQ: MNTX 17
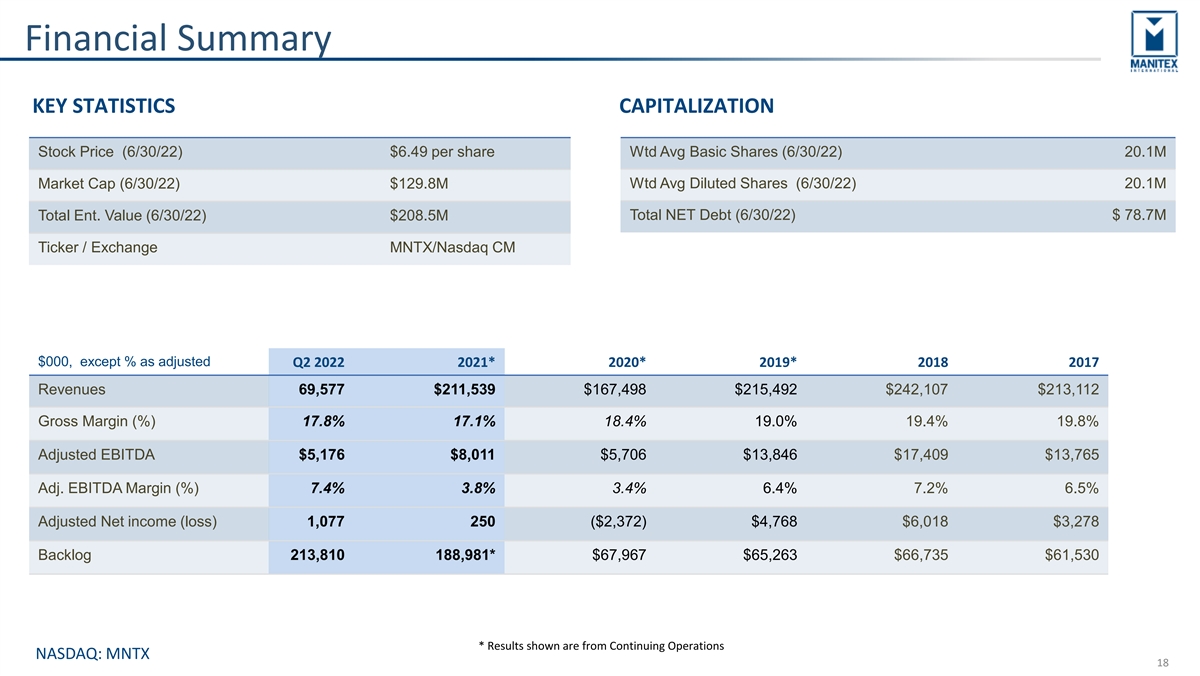
Financial Summary KEY STATISTICS CAPITALIZATION Stock Price (6/30/22) $6.49 per share Wtd Avg Basic Shares (6/30/22) 20.1M Market Cap (6/30/22) $129.8M Wtd Avg Diluted Shares (6/30/22) 20.1M Total Ent. Value (6/30/22) $208.5M Total NET Debt (6/30/22) $ 78.7M Ticker / Exchange MNTX/Nasdaq CM $000, except % as adjusted Q2 2022 2021* 2020* 2019* 2018 2017 Revenues 69,577 $211,539 $167,498 $215,492 $242,107 $213,112 Gross Margin (%) 17.8% 17.1% 18.4% 19.0% 19.4% 19.8% Adjusted EBITDA $5,176 $8,011 $5,706 $13,846 $17,409 $13,765 Adj. EBITDA Margin (%) 7.4% 3.8% 3.4% 6.4% 7.2% 6.5% Adjusted Net income (loss) 1,077 250 ($2,372) $4,768 $6,018 $3,278 Backlog 213,810 188,981* $67,967 $65,263 $66,735 $61,530 * Results shown are from Continuing Operations NASDAQ: MNTX 18

Q2 2022 Financial Update (in $millions except GM) SALES BACKLOG 69.6 $70 $250 213.8 60.4 60.0 205.7 189.0 $60 $200 53.4 50.9 $50 $150 113.6 111.2 $40 $100 $30 $50 $0 $20 Q2 21 Q3 21 Q4 21 Q1 22 Q2 22 Q2 21 Q3 21 Q4 21 Q1 22 Q2 22 GROSS MARGIN % ADJUSTED EBITDA $6 19.1% 20% 7.4% 17.8% 14.8% 16.8% 15.8% 7.1% adjusted $4 4.5% 10% 3.1% $2 8.7% 0.6% 0% $0 Q2 21 Q3 21 Q4 21 Q1 22 Q2 22 Q2 21 Q3 21 Q4 21 Q1 22 Q2 22 Adj EBITDA as % of Sales NASDAQ: MNTX 19
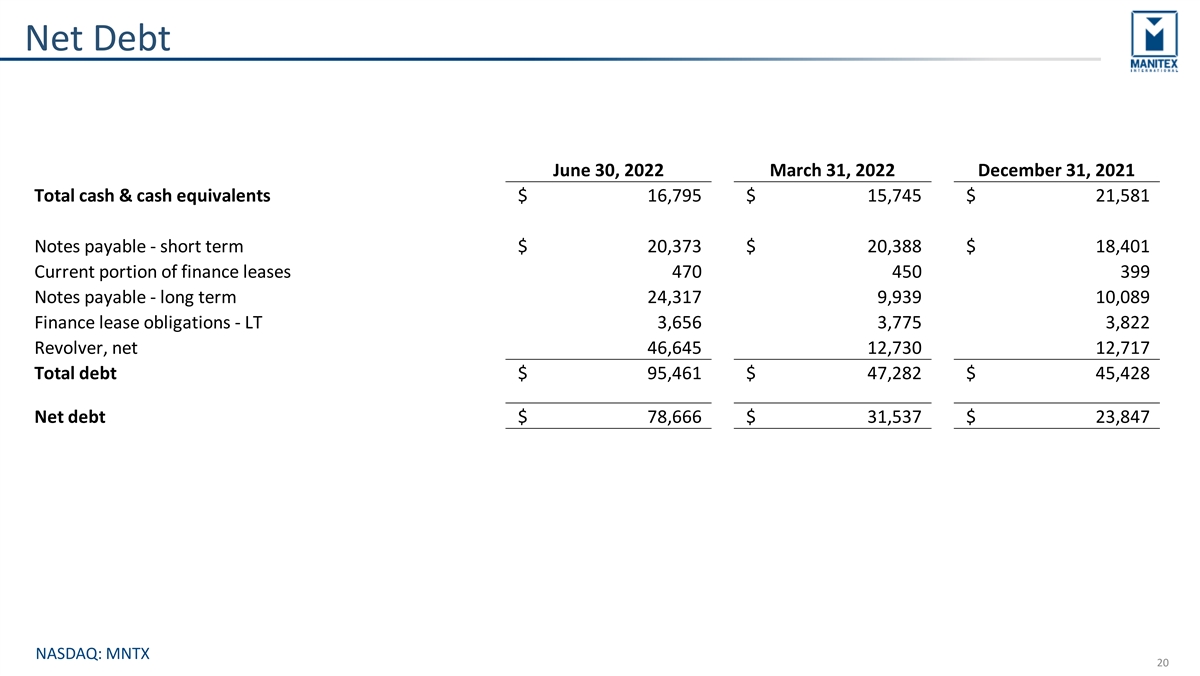
Net Debt June 30, 2022 March 31, 2022 December 31, 2021 Total cash & cash equivalents $ 1 6,795 $ 15,745 $ 2 1,581 Notes payable - short term $ 20,373 $ 20,388 $ 18,401 Current portion of finance leases 470 450 399 Notes payable - long term 2 4,317 9,939 10,089 Finance lease obligations - LT 3,656 3,775 3,822 Revolver, net 46,645 1 2,730 1 2,717 Total debt $ 9 5,461 $ 4 7,282 $ 4 5,428 Net debt $ 7 8,666 $ 31,537 $ 2 3,847 NASDAQ: MNTX 20
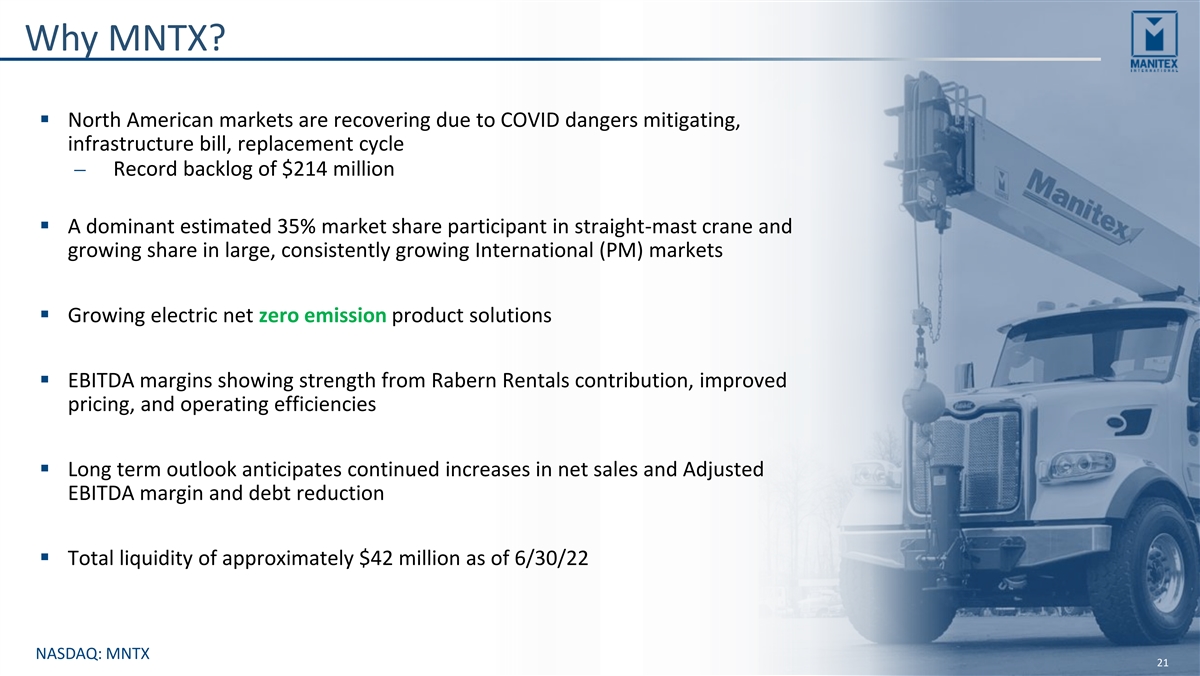
Why MNTX? ▪ North American markets are recovering due to COVID dangers mitigating, infrastructure bill, replacement cycle ⎼ Record backlog of $214 million ▪ A dominant estimated 35% market share participant in straight-mast crane and growing share in large, consistently growing International (PM) markets ▪ Growing electric net zero emission product solutions ▪ EBITDA margins showing strength from Rabern Rentals contribution, improved pricing, and operating efficiencies ▪ Long term outlook anticipates continued increases in net sales and Adjusted EBITDA margin and debt reduction ▪ Total liquidity of approximately $42 million as of 6/30/22 NASDAQ: MNTX 21
Click to edit Master title style THANK YOU NASDAQ: MNTX 22 NASDAQ: MNTX
APPENDIX NASDAQ: MNTX

Appendix – Reconciliations RECONCILIATION OF GAAP NET INCOME (LOSS) TO ADJUSTED NET INCOME (LOSS) ThreeT Mo hren et h Mo s En ntd he sd Ended June 3 Ju 0, n 2 e0 3 2 0 2 , 2022 March Ma 31 r,c 2 h0 3 21 2, 2022 June 3 Ju 0, n 2 e0 3 20 1, 2021 Net inN co em t ie n co (lo m ss e ) (loss) $ $ (2 , 1 0 3 (2 ) ,103$ ) $ 230 230 $ $ 5 , 3 6 5 5 ,365 Adjustm Ade ju n stm ts, ie nn cl ts, ud iin ncl g u nd eit ntax g n e im t tax pact impact 3,180 3,180 713 713 (3,134 (3 ) ,134) Adjuste Ad dju nste et id n n co em t ie n co (lo m ss e ) (loss) $ $ 1 , 0 7 7 1 ,077$ $ 943 943$ $ 2 , 2 3 1 2 ,231 Weigh W te e d ig d h ite lute d d di l sh ute ard e s sh oa urtstan es ou d tstan ing ding 20,05 8 2, 0 9 ,6 06 58,966 20,01 4 2, 0 1,8 00 14,180 19,98 8 1, 9 8,2 97 88,827 DiluteD di l e u ate rn d i n eg as rn (lio nss gs ) (l po ess r sh ) p ae rr e sh as arre ep a os rte red ported $ $ (0 . 1 0 ) (0.10$ ) $ 0 . 0 1 0.01$ $ 0 . 2 7 0.27 Total EPS effect $ 0 .15 $ 0.04 $ (0.16) Total EPS effect $ 0 .15 $ 0 .04 $ (0 .16) Adjuste Ad dju dste ilute d d di l e u ate rn d i n eg as rn (lio nss gs ) (l po ess r sh ) p ae rr e share $ $ 0 . 0 5 0 .05$ $ 0 . 0 5 0.05$ $ 0 . 1 1 0 .11 NASDAQ: MNTX 24

Appendix – Reconciliations RECONCILIATION OF GAAP NET INCOME (LOSS) TO ADJUSTED EBITDA (IN THOUSANDS) NASDAQ: MNTX 25