Exhibit 99.2 Third Quarter 2023 Results Conference Call November 2, 2023
Safe Harbor Statement Safe Harbor Statement under the U.S. Private Securities Litigation Reform Act of 1995: This presentation contains statements that are forward-looking in nature which express the beliefs and expectations of management including statements regarding the Company’s expected results of operations or liquidity; statements concerning projections, predictions, expectations, estimates or forecasts as to our business, financial and operational results and future economic performance; and statements of management’s goals and objectives and other similar expressions concerning matters that are not historical facts. In some cases, you can identify forward-looking statements by terminology such as “anticipate,” “estimate,” “plan,” “project,” “continuing,” “ongoing,” “expect,” “we believe,” “we intend,” “may,” “will,” “should,” “could,” and similar expressions. Such statements are based on current plans, estimates and expectations and involve a number of known and unknown risks, uncertainties and other factors that could cause the Company's future results, performance or achievements to differ significantly from the results, performance or achievements expressed or implied by such forward-looking statements. These factors and additional information are discussed in the Company's filings with the Securities and Exchange Commission and statements in this presentation should be evaluated in light of these important factors. Although we believe that these statements are based upon reasonable assumptions, we cannot guarantee future results. Forward-looking statements speak only as of the date on which they are made, and the Company undertakes no obligation to update publicly or revise any forward-looking statement, whether as a result of new information, future developments or otherwise. 2 2
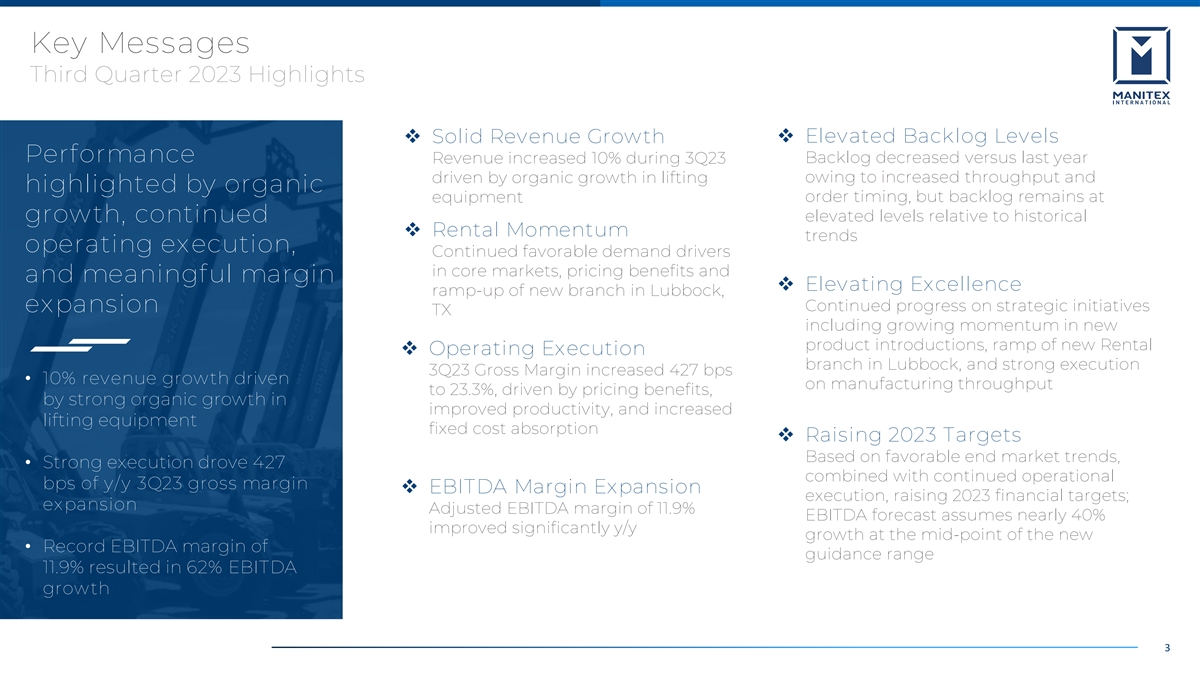
Key Messages Third Quarter 2023 Highlights ❖ Elevated Backlog Levels ❖ Solid Revenue Growth Performance Revenue increased 10% during 3Q23 Backlog decreased versus last year owing to increased throughput and driven by organic growth in lifting highlighted by organic equipment order timing, but backlog remains at elevated levels relative to historical growth, continued ❖ Rental Momentum trends operating execution, Continued favorable demand drivers in core markets, pricing benefits and and meaningful margin ❖ Elevating Excellence ramp-up of new branch in Lubbock, Continued progress on strategic initiatives expansion TX including growing momentum in new product introductions, ramp of new Rental ❖ Operating Execution branch in Lubbock, and strong execution 3Q23 Gross Margin increased 427 bps • 10% revenue growth driven on manufacturing throughput to 23.3%, driven by pricing benefits, by strong organic growth in improved productivity, and increased lifting equipment fixed cost absorption ❖ Raising 2023 Targets Based on favorable end market trends, • Strong execution drove 427 combined with continued operational bps of y/y 3Q23 gross margin ❖ EBITDA Margin Expansion execution, raising 2023 financial targets; expansion Adjusted EBITDA margin of 11.9% EBITDA forecast assumes nearly 40% improved significantly y/y growth at the mid-point of the new • Record EBITDA margin of guidance range 11.9% resulted in 62% EBITDA growth 3
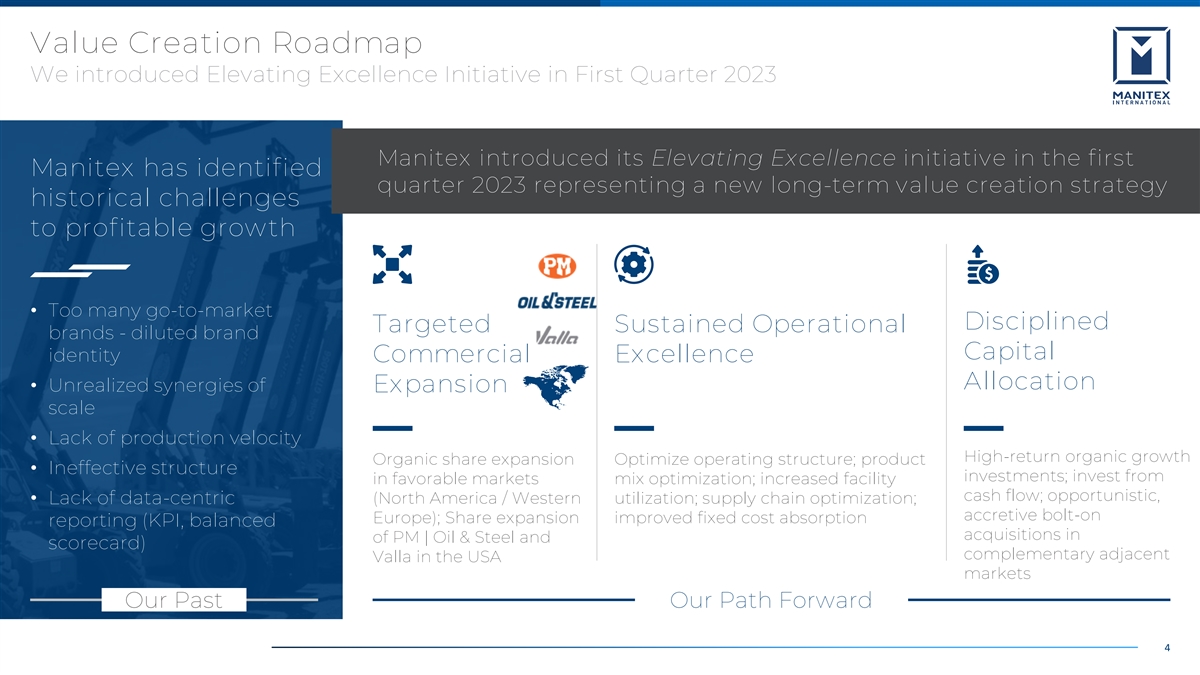
Value Creation Roadmap We introduced Elevating Excellence Initiative in First Quarter 2023 Manitex introduced its Elevating Excellence initiative in the first Manitex has identified quarter 2023 representing a new long-term value creation strategy historical challenges to profitable growth • Too many go-to-market Disciplined Targeted Sustained Operational brands - diluted brand Capital identity Commercial Excellence Allocation • Unrealized synergies of Expansion scale • Lack of production velocity High-return organic growth Organic share expansion Optimize operating structure; product • Ineffective structure investments; invest from in favorable markets mix optimization; increased facility cash flow; opportunistic, • Lack of data-centric (North America / Western utilization; supply chain optimization; accretive bolt-on Europe); Share expansion improved fixed cost absorption reporting (KPI, balanced acquisitions in of PM | Oil & Steel and scorecard) complementary adjacent Valla in the USA markets Our Past Our Path Forward 4

Targeted Commercial Expansion Drive above-market organic growth, leveraging incumbent position Retain leadership position within Straight Mast market, while investing Manitex will leverage in higher-growth, underpenetrated adjacent markets its incumbent, Delivering “One Driving balanced growth across Relative growth leadership position in new and existing markets Manitex” to the market contribution by product Straight Mast Cranes Market Share Expansion to expand across Market Share | Growth Leverage strong market share in Valla PM straight mast cranes to grow Articulated, Industrial articulated cranes, Industrial Cranes Straight Mast Manitex Lifting, and AWP share in N.A. Lift / AWP and Rental Simplify Brand Identity Markets Simplify our go-to-market branding, supporting our dealers with segmented brands serving • Manitex has 35% market share specific applications within the domestic Straight Enhanced Product Distribution Mast market O&S Consolidate distribution across AWP Articulated Rental targeted geographies • Brand consolidation, Industrial Lift & market positioning will help to Product Innovation AWPs drive organic share gains in Rentals Invest in new, adjacent markets customer-led innovation and Growth product development 5 Share
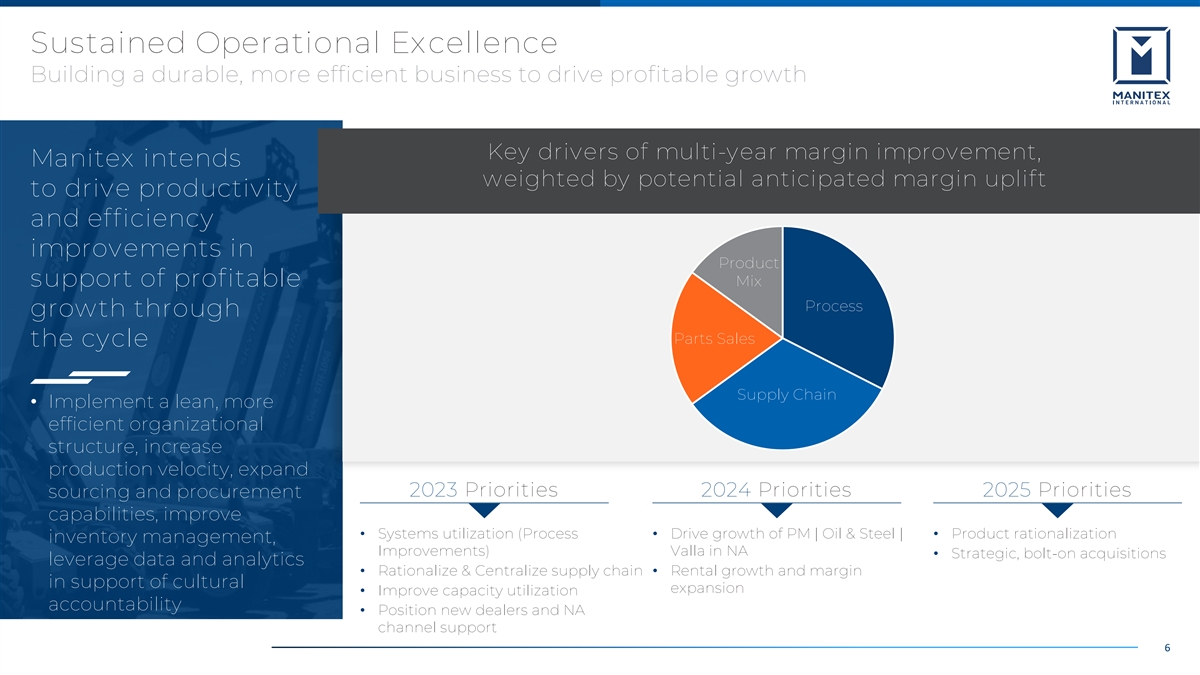
Sustained Operational Excellence Building a durable, more efficient business to drive profitable growth Key drivers of multi-year margin improvement, Manitex intends weighted by potential anticipated margin uplift to drive productivity and efficiency improvements in Product support of profitable Mix Process growth through Parts Sales the cycle Supply Chain • Implement a lean, more efficient organizational structure, increase production velocity, expand 2023 Priorities 2024 Priorities 2025 Priorities sourcing and procurement capabilities, improve • Systems utilization (Process • Drive growth of PM | Oil & Steel | • Product rationalization inventory management, Improvements) Valla in NA • Strategic, bolt-on acquisitions leverage data and analytics • Rationalize & Centralize supply chain• Rental growth and margin in support of cultural expansion • Improve capacity utilization accountability • Position new dealers and NA channel support 6
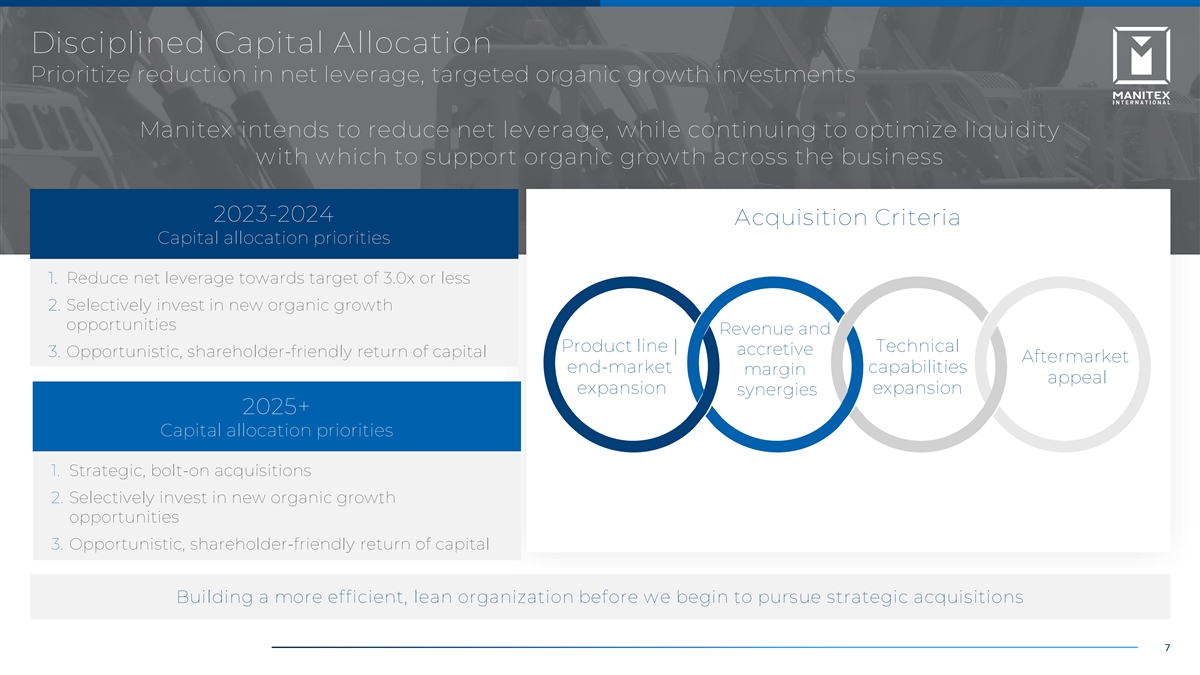
Disciplined Capital Allocation Prioritize reduction in net leverage, targeted organic growth investments Manitex intends to reduce net leverage, while continuing to optimize liquidity with which to support organic growth across the business 2023-2024 Acquisition Criteria Capital allocation priorities 1. Reduce net leverage towards target of 3.0x or less 2. Selectively invest in new organic growth opportunities Revenue and Product line | Technical accretive 3. Opportunistic, shareholder-friendly return of capital Aftermarket end-market capabilities margin appeal expansion expansion synergies 2025+ Capital allocation priorities 1. Strategic, bolt-on acquisitions 2. Selectively invest in new organic growth opportunities 3. Opportunistic, shareholder-friendly return of capital Building a more efficient, lean organization before we begin to pursue strategic acquisitions 7

2025 Financial Targets Positioned to drive significant organic growth and margin expansion 2022A-2025E Between YE 2022 and Revenue Bridge ($MM) EBITDA Bridge ($MM) EBITDA Margin (%) YE 2025, Manitex ~25% ~65-110% +300-500 bps intends to deliver revenue growth at EBITDA growth of margin expansion incremental growth mid-point of range 11% to 13% in revenue, EBITDA and EBITDA margin $325 to $360 $35 to $45 8% $274 realization through a $21 combination of commercial 2022 2025E 2022 2025E 2022 2025E expansion, sustained operational Revenue Drivers Margin Drivers (2024 and 2025 Focus on Growth) (2023 is a foundational year with focus on margins / process and systems) excellence and disciplined • End-market growth• Improved fixed-cost absorption through improved operating leverage • Improved capacity utilization• Reweight product mix toward higher-margin offering capital allocation • Product innovation / NPD• Centralization of procurement and supply chain • Market share gains 8

Third Quarter 2023 Results
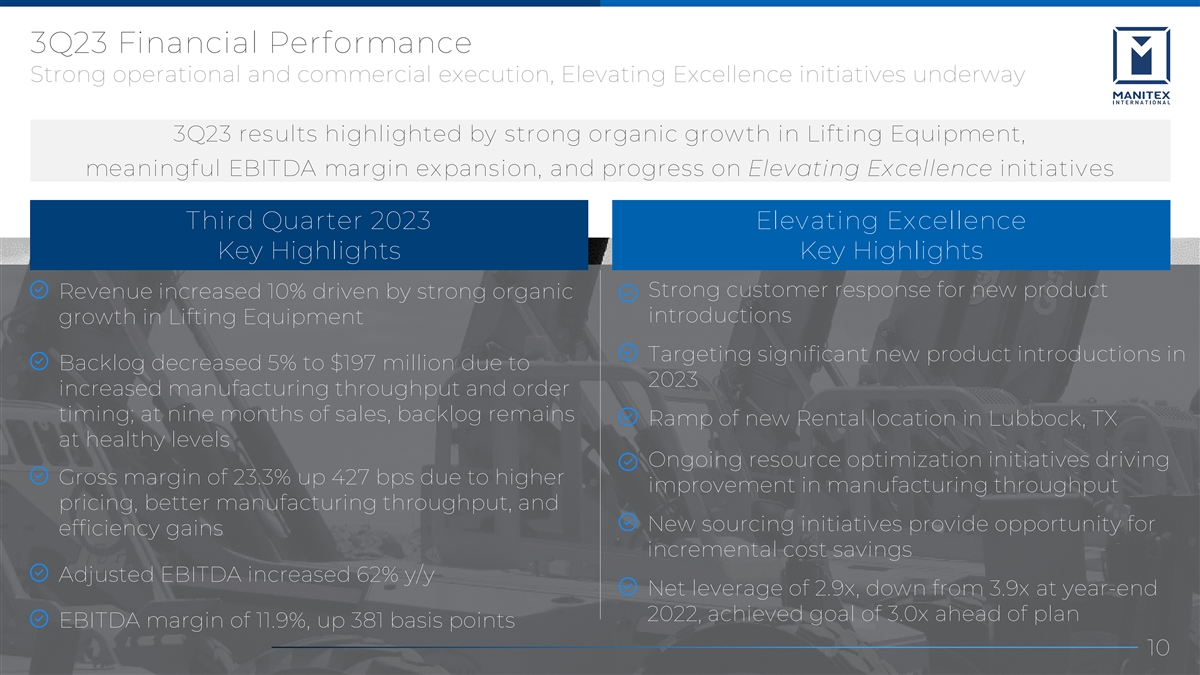
3Q23 Financial Performance Strong operational and commercial execution, Elevating Excellence initiatives underway 3Q23 results highlighted by strong organic growth in Lifting Equipment, meaningful EBITDA margin expansion, and progress on Elevating Excellence initiatives Third Quarter 2023 Elevating Excellence Key Highlights Key Highlights Strong customer response for new product Revenue increased 10% driven by strong organic introductions growth in Lifting Equipment Targeting significant new product introductions in Backlog decreased 5% to $197 million due to 2023 increased manufacturing throughput and order timing; at nine months of sales, backlog remains Ramp of new Rental location in Lubbock, TX at healthy levels Ongoing resource optimization initiatives driving Gross margin of 23.3% up 427 bps due to higher improvement in manufacturing throughput pricing, better manufacturing throughput, and New sourcing initiatives provide opportunity for efficiency gains incremental cost savings Adjusted EBITDA increased 62% y/y Net leverage of 2.9x, down from 3.9x at year-end 2022, achieved goal of 3.0x ahead of plan EBITDA margin of 11.9%, up 381 basis points 10 10

3Q23 Performance Summary Strong backlog growth, meaningful margin improvement 10% y/y Revenue Growth 5% y/y Backlog Decline Favorable end ($MM) ($MM) market trends and $78.8 $238.1 $230.2 strong execution $223.2 $73.5 $71.3 $207.0 $67.9 $196.9 $65.0 • Revenue growth due to favorable market trends benefitting Lifting Equipment 3Q22 4Q22 1Q23 2Q23 3Q23 3Q22 4Q22 1Q23 2Q23 3Q23 • 5% backlog decrease at 9/30/23 owing to increased throughput 427 bps y/y Gross Margin Expansion 62% y/y Adjusted EBITDA Growth • Gross margin improved 427 bps (%) ($MM) y/y due to operational 23.3% 21.2% improvement and more favorable $8.5 20.3% $8.1 19.3% 19.0% pricing $6.8 $6.3 $5.2 • Trailing twelve-month EBITDA of $29.7 million, up from $13.4 million in the prior twelve-month period. 3Q22 4Q22 1Q23 2Q23 3Q23 3Q22 4Q22 1Q23 2Q23 3Q23 11
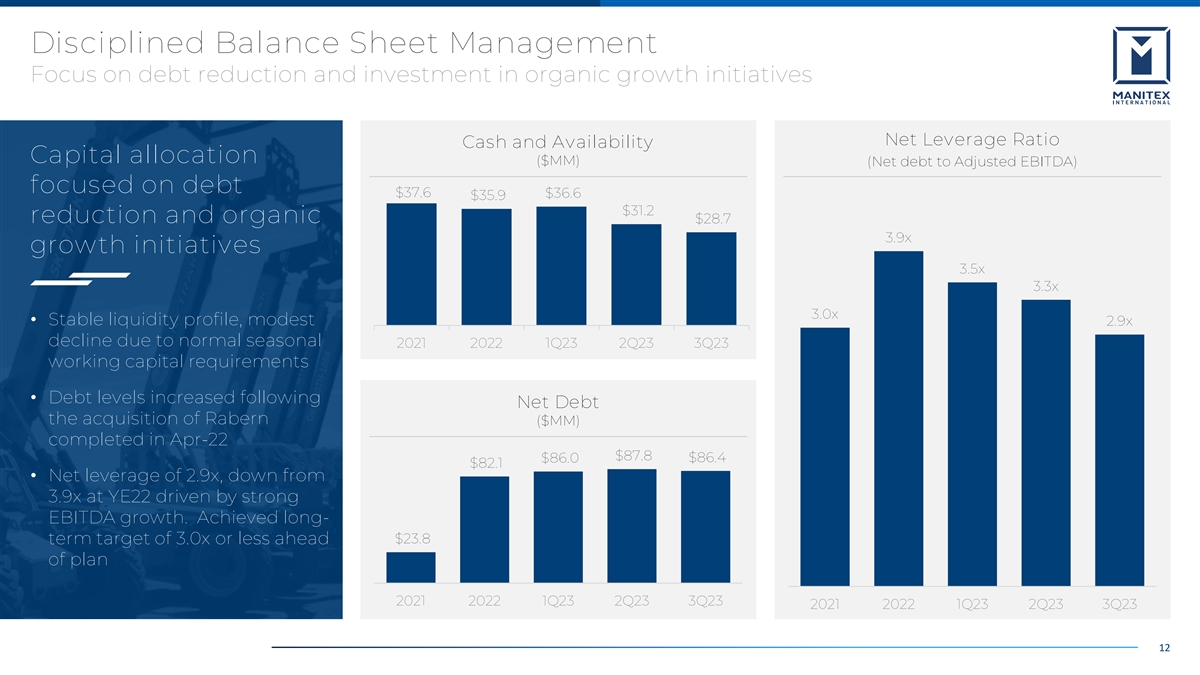
Disciplined Balance Sheet Management Focus on debt reduction and investment in organic growth initiatives Net Leverage Ratio Cash and Availability Capital allocation ($MM) (Net debt to Adjusted EBITDA) focused on debt $37.6 $36.6 $35.9 $31.2 reduction and organic $28.7 3.9x growth initiatives 3.5x 3.3x 3.0x • Stable liquidity profile, modest 2.9x decline due to normal seasonal 2021 2022 1Q23 2Q23 3Q23 working capital requirements • Debt levels increased following Net Debt the acquisition of Rabern ($MM) completed in Apr-22 $87.8 $86.0 $86.4 $82.1 • Net leverage of 2.9x, down from 3.9x at YE22 driven by strong EBITDA growth. Achieved long- $23.8 term target of 3.0x or less ahead of plan 2021 2022 1Q23 2Q23 3Q23 2021 2022 1Q23 2Q23 3Q23 12

Full-Year 2023 Financial Guidance Raising Outlook, reflects nearly 40% Adjusted EBITDA growth and continued margin expansion Raised Guidance reflects favorable end market trends and progress on Elevating Excellence initiatives $ in millions Fiscal Full-Year 2022 Fiscal Full-Year 2023 Revenue $273.9 $285 to $290 • Continued end market momentum and contribution Adjusted EBITDA $21.3 $28 to $30 from new products driving solid Adjusted EBITDA Margin 7.8% 9.7% to 10.5% revenue growth • Improved production velocity and operating efficiencies resulting in margin expansion and strong Adjusted EBITDA growth • Expect continued balance sheet de-leveraging 13
Appendix
Statement on Non-GAAP Financial Measures NON-GAAP FINANCIAL MEASURES AND OTHER ITEMS In this presentation, we refer to various non-GAAP (U.S. generally accepted accounting principles) financial measures which management uses to evaluate operating performance, to establish internal budgets and targets, and to compare the Company's financial performance against such budgets and targets. These non-GAAP measures, as defined by the Company, may not be comparable to similarly titled measures being disclosed by other companies. While adjusted financial measures are not intended to replace any presentation included in our consolidated financial statements under generally accepted accounting principles (GAAP) and should not be considered an alternative to operating performance or an alternative to cash flow as a measure of liquidity, we believe these measures are useful to investors in assessing our operating results, capital expenditure and working capital requirements and the ongoing performance of its underlying businesses. A reconciliation of Adjusted GAAP financial measures is included with this presentation. All per share amounts are on a fully diluted basis. The quarterly amounts described below are unaudited, are reported in thousands of U.S. dollars, and are as of the dates indicated. 15
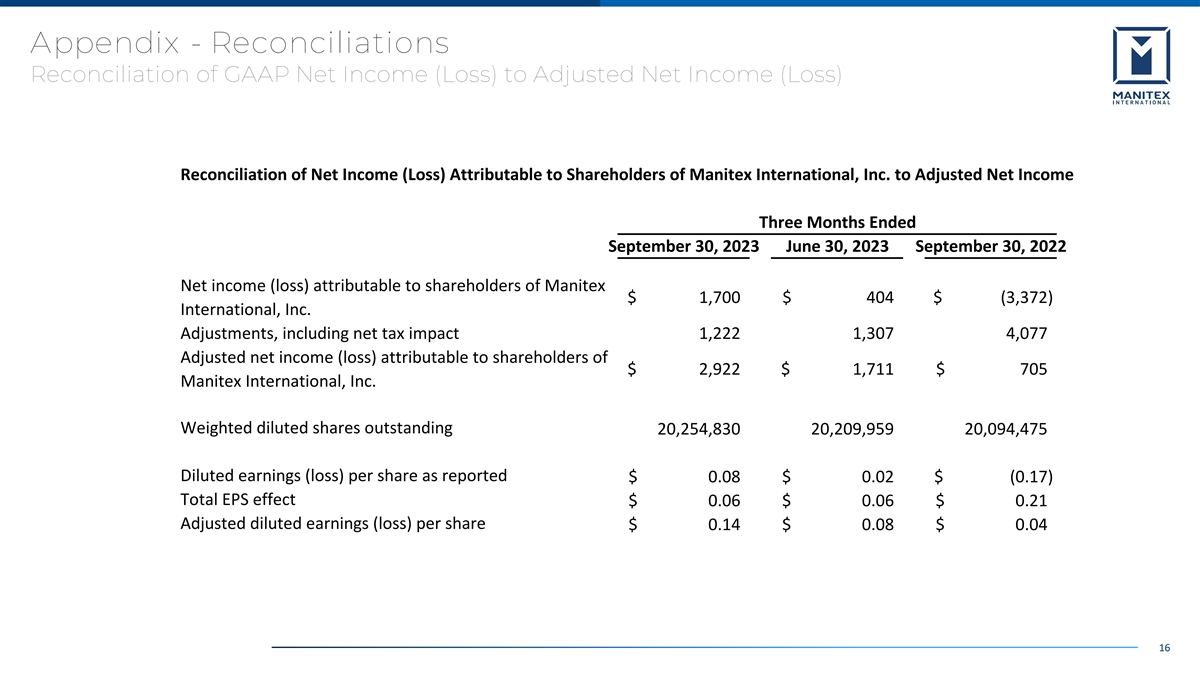
Appendix - Reconciliations Reconciliation of GAAP Net Income (Loss) to Adjusted Net Income (Loss) Reconciliation of Net Income (Loss) Attributable to Shareholders of Manitex International, Inc. to Adjusted Net Income Three Months Ended September 30, 2023 June 30, 2023 September 30, 2022 Net income (loss) attributable to shareholders of Manitex $ 1,700 $ 404 $ (3,372) International, Inc. Adjustments, including net tax impact 1,222 1,307 4,077 Adjusted net income (loss) attributable to shareholders of $ 2 ,922 $ 1,711 $ 705 Manitex International, Inc. Weighted diluted shares outstanding 20,254,830 20,209,959 20,094,475 Diluted earnings (loss) per share as reported $ 0 .08 $ 0 .02 $ (0.17) Total EPS effect $ 0.06 $ 0 .06 $ 0 .21 Adjusted diluted earnings (loss) per share $ 0.14 $ 0.08 $ 0 .04 16

Appendix - Reconciliations Reconciliation of GAAP Net Income (Loss) to Adjusted EBITDA Reconciliation of GAAP Net Income (Loss) to Adjusted EBITDA Three Months Ended September 30, 2023 June 30, 2023 September 30, 2022 Net Income (loss) $ 1,894 $ 532 $ (3,084) Interest expense 1,856 1,896 1,409 Tax expense 742 207 206 Depreciation and amortization expense 2,739 2,869 2,614 EBITDA $ 7,231 $ 5,504 $ 1,145 Adjustments: Stock compensation $ 457 $ 588 $ 749 FX 883 718 (175) Pension settlement (118) - - Litigation / legal settlement - - 3,171 Severance / restructuring costs - - 294 Rabern transaction costs - - 37 Other - - 5 Total Adjustments $ 1,222 $ 1,306 $ 4,081 Adjusted EBITDA $ 8,453 $ 6,810 $ 5,226 Adjusted EBITDA as % of sales 11.9% 9.3% 8.0% 17