
Exhibit 99.2 First Quarter 2024 Results Conference Call May 2, 2024
Safe Harbor Statement Safe Harbor Statement under the U.S. Private Securities Litigation Reform Act of 1995: This presentation contains statements that are forward-looking in nature which express the beliefs and expectations of management including statements regarding the Company’s expected results of operations or liquidity; statements concerning projections, predictions, expectations, estimates or forecasts as to our business, financial and operational results and future economic performance; and statements of management’s goals and objectives and other similar expressions concerning matters that are not historical facts. In some cases, you can identify forward-looking statements by terminology such as “anticipate,” “estimate,” “plan,” “project,” “continuing,” “ongoing,” “expect,” “we believe,” “we intend,” “may,” “will,” “should,” “could,” and similar expressions. Such statements are based on current plans, estimates and expectations and involve a number of known and unknown risks, uncertainties and other factors that could cause the Company's future results, performance or achievements to differ significantly from the results, performance or achievements expressed or implied by such forward-looking statements. These factors and additional information are discussed in the Company's filings with the Securities and Exchange Commission and statements in this presentation should be evaluated in light of these important factors. Although we believe that these statements are based upon reasonable assumptions, we cannot guarantee future results. Forward-looking statements speak only as of the date on which they are made, and the Company undertakes no obligation to update publicly or revise any forward-looking statement, whether as a result of new information, future developments or otherwise. 2 2

Key Messages First Quarter 2024 Highlights v Solid Revenue Growth v Healthy Backlog Levels Performance Backlog decline versus last year owing Lifting Equipment revenue increased 7.9% during 1Q driven by strong growth to increased throughput, product mix highlighted by solid at our North American manufacturing rationalization and market factors. organic growth, Current backlog is between 6-8 months dependent upon the product category continued operating v Rental Momentum and is at healthy levels Rental revenue increased 9.2% due to execution, strong strong demand drivers, pricing benefits v Elevating Excellence margin expansion and ramp-up of Lubbock branch Continued progress on strategic initiatives including growing momentum in new product introductions, ramp of new Rental v Operating Execution • 8.1% revenue growth during 1Q branch in Lubbock, and strong execution 1Q24 gross margin increased 179 bps, driven by solid growth in North on manufacturing throughput and supply- driven by product mix optimization and chain initiatives America and rental supply-chain driven cost improvements v 2024 Outlook • Strong execution drove 179 bps Reiterating 2024 outlook; forecast of y/y 1Q24 gross margin v EBITDA Margin Expansion assumes 8% EBITDA growth at the mid- 1Q24 adjusted EBITDA margin of 11.4%, expansion point of the guidance range driven by up 218 basis points yty; second highest end market strength, combined with quarterly margin in at least the last five • 1Q24 adjusted EBITDA continued operational improvements years despite seasonally slow first increased 33.5% to $8.4 million; quarter adjusted EBITDA margin expansion of 218 bps to 11.4% 3

Value Creation Roadmap We introduced Elevating Excellence Initiative in First Quarter 2023 Manitex introduced its Elevating Excellence initiative in the first Manitex is addressing quarter 2023 representing a new long-term value creation strategy historical challenges to profitable growth • Too many go-to-market Disciplined Targeted Sustained Operational brands - diluted brand Capital identity Commercial Excellence Allocation • Unrealized synergies of Expansion scale • Lack of production velocity High-return organic growth Organic share expansion Optimize operating structure; product • Ineffective structure investments; invest from in favorable markets mix optimization; increased facility cash flow; opportunistic, • Lack of data-centric (North America / Western utilization; supply chain optimization; accretive bolt-on Europe); Share expansion improved fixed cost absorption reporting (KPI, balanced acquisitions in of PM | Oil & Steel and scorecard) complementary adjacent Valla in the USA markets Our Past Our Path Forward 4
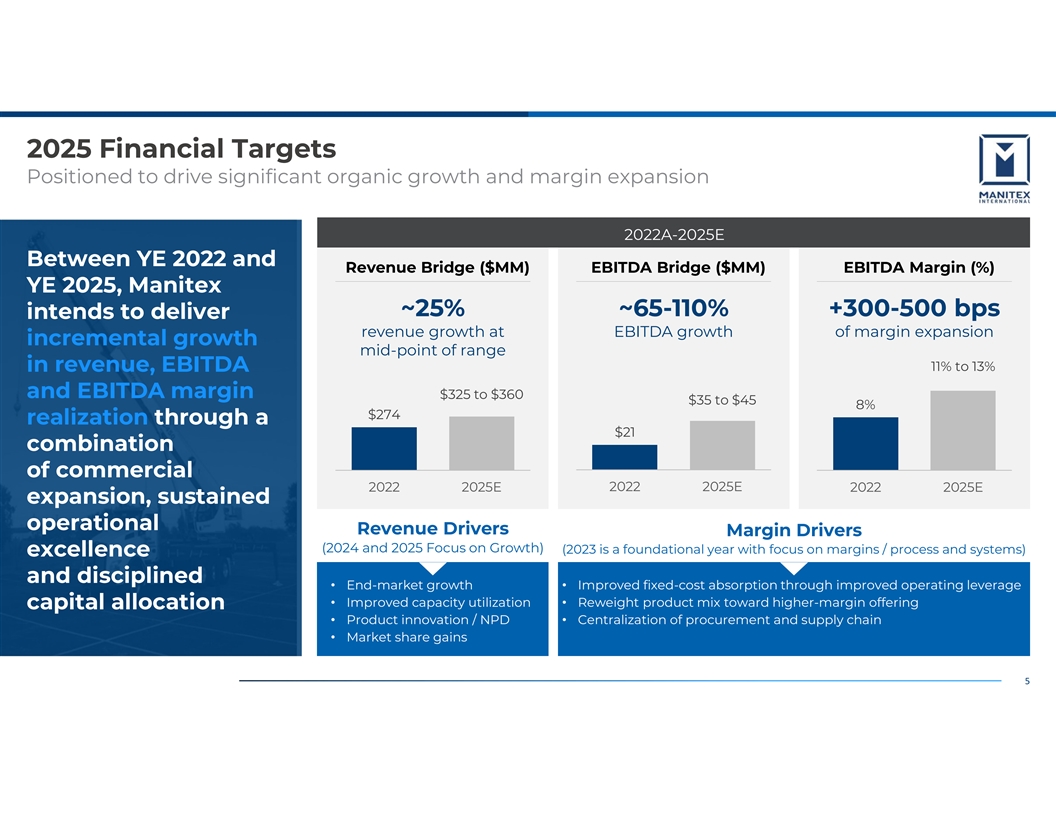
2025 Financial Targets Positioned to drive significant organic growth and margin expansion 2022A-2025E Between YE 2022 and Revenue Bridge ($MM) EBITDA Bridge ($MM) EBITDA Margin (%) YE 2025, Manitex ~25% ~65-110% +300-500 bps intends to deliver revenue growth at EBITDA growth of margin expansion incremental growth mid-point of range 11% to 13% in revenue, EBITDA and EBITDA margin $325 to $360 $35 to $45 8% $274 realization through a $21 combination of commercial 2022 2025E 2022 2025E 2022 2025E expansion, sustained operational Revenue Drivers Margin Drivers (2024 and 2025 Focus on Growth) (2023 is a foundational year with focus on margins / process and systems) excellence and disciplined • End-market growth• Improved fixed-cost absorption through improved operating leverage • Improved capacity utilization• Reweight product mix toward higher-margin offering capital allocation • Product innovation / NPD• Centralization of procurement and supply chain • Market share gains 5
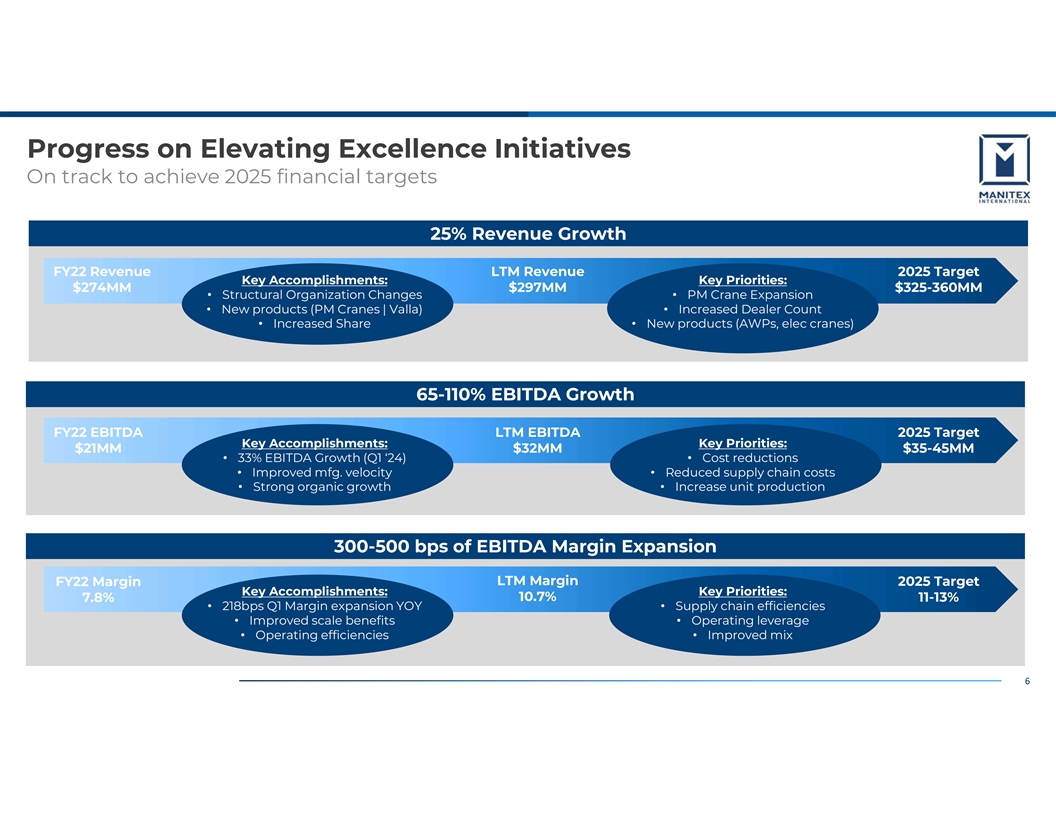
Progress on Elevating Excellence Initiatives On track to achieve 2025 financial targets 25% Revenue Growth FY22 Revenue LTM Revenue 2025 Target Key Accomplishments: Key Priorities: $274MM $297MM $325-360MM • Structural Organization Changes• PM Crane Expansion • New products (PM Cranes | Valla)• Increased Dealer Count • Increased Share• New products (AWPs, elec cranes) 65-110% EBITDA Growth FY22 EBITDA LTM EBITDA 2025 Target Key Accomplishments: Key Priorities: $21MM $32MM $35-45MM • 33% EBITDA Growth (Q1 ‘24)• Cost reductions • Improved mfg. velocity• Reduced supply chain costs • Strong organic growth• Increase unit production 300-500 bps of EBITDA Margin Expansion LTM Margin FY22 Margin 2025 Target Key Accomplishments: Key Priorities: 10.7% 11-13% 7.8% • 218bps Q1 Margin expansion YOY• Supply chain efficiencies • Improved scale benefits• Operating leverage • Operating efficiencies• Improved mix 6

First Quarter 2024 Results

First Quarter 2024 Financial Performance Strong operational and commercial execution, Elevating Excellence gaining momentum 1Q24 results highlighted by strong demand trends in Lifting Equipment, gross margin expansion, and progress on Elevating Excellence initiatives First Quarter 2024 Elevating Excellence Key Highlights Key Highlights Strong customer response for new product 1Q24 revenue grew 8% driven by strong growth introductions in Rental and Lifting Equipment Increased market share in targeted markets Backlog decreased due to increased manufacturing velocity and market uncertainty; Ramp of new Rental location in Lubbock, TX backlog healthy at 7 months of sales Ongoing resource optimization initiatives driving 1Q gross margin of 23.0% up 179 bps due to better improvement in manufacturing throughput manufacturing throughput, improved mix, and New sourcing partners driving incremental cost supply-chain initiatives savings 1Q adjusted EBITDA increased 33.5% to $8.4 Net leverage of 2.7x at end of 1Q24, down from million; margin of 11.4%, up 218 basis points 2.9x at year-end 2023, achieved goal of 3.0x ahead of plan 8 8

1Q24 Performance Summary Solid growth, meaningful margin improvement 8% y/y Revenue Growth Backlog Healthy at 7-Months of Sales Favorable end ($MM) ($MM) market trends and $78.7 $238.1 strong execution $223.2 $73.5 $73.3 $196.9 $170.3 $71.3 $154.2 $67.9 • Revenue growth due to favorable market trends benefitting Lifting Equipment, rental growth 1Q23 2Q23 3Q23 4Q23 1Q24 1Q23 2Q23 3Q23 4Q23 1Q24 • Gross margin improved 179 bps y/y due to improved mix, better throughput, and sourcing benefits 179 bps y/y Gross Margin Expansion 34% y/y Adjusted EBITDA Growth (%) ($MM) • Adjusted EBITDA of $8.4 million 23.3% 23.0% during 1Q24 was up 34% from last $8.5 $8.4 $8.0 year owing to operational $6.8 $6.3 21.2% improvements. 20.9% 20.3% • Trailing twelve-month EBITDA of $31.7 million, up 28% from prior TTM period; 10.7% TTM EBITDA margin 1Q23 2Q23 3Q23 4Q23 1Q24 1Q23 2Q23 3Q23 4Q23 1Q24 9

Disciplined Balance Sheet Management Focus on debt reduction and investment in organic growth initiatives Net Leverage Ratio Cash and Availability Capital allocation ($MM) (Net debt to Adjusted EBITDA) focused on debt $36.6 $31.2 $31.3 $29.7 $28.7 reduction and organic 3.9x growth initiatives 3.5x 3.3x 2.9x 2.9x • Stable liquidity profile, modest 2.7x increase in net debt due to 1Q23 2Q23 3Q23 4Q23 1Q24 quarter end timing of cash collections Net Debt • Expect improved free cash flow ($MM) conversion in 2024 as working $87.8 capital levels are worked down $86.4 $86.4 • Net leverage of 2.7x, down from $86.0 3.9x at YE22 driven by strong $85.5 EBITDA growth. Achieved long- term target of 3.0x or less ahead of plan 2022 1Q23 2Q23 3Q23 4Q23 1Q24 1Q23 2Q23 3Q23 4Q23 1Q24 10

Full-Year 2024 Financial Guidance Outlook reflects 8% Adjusted EBITDA growth* and continued margin expansion 2024 guidance reflects favorable end market trends and progress on Elevating Excellence initiatives $ in millions Fiscal Full-Year 2023 Fiscal Full-Year 2024 Revenue $291.4 $300 to $310 • Continued end market momentum and contribution Adjusted EBITDA $29.6 $30 to $34 from new products driving solid Adjusted EBITDA Margin 10.1% 10.5%* revenue growth • Improved production velocity and operating efficiencies resulting in margin expansion and strong Adjusted EBITDA growth • Expect continued balance sheet de-leveraging * At mid-point of guidance range 11

Appendix
Statement on Non-GAAP Financial Measures NON-GAAP FINANCIAL MEASURES AND OTHER ITEMS In this presentation, we refer to various non-GAAP (U.S. generally accepted accounting principles) financial measures which management uses to evaluate operating performance, to establish internal budgets and targets, and to compare the Company's financial performance against such budgets and targets. These non-GAAP measures, as defined by the Company, may not be comparable to similarly titled measures being disclosed by other companies. While adjusted financial measures are not intended to replace any presentation included in our consolidated financial statements under generally accepted accounting principles (GAAP) and should not be considered an alternative to operating performance or an alternative to cash flow as a measure of liquidity, we believe these measures are useful to investors in assessing our operating results, capital expenditure and working capital requirements and the ongoing performance of its underlying businesses. A reconciliation of Adjusted GAAP financial measures is included with this presentation. All per share amounts are on a fully diluted basis. The quarterly amounts described below are unaudited, are reported in thousands of U.S. dollars, and are as of the dates indicated. 13

Appendix - Reconciliations Reconciliation of Net Income to Adjusted Net Income Reconciliation of Net Income Attributable to Shareholders of Manitex International, Inc. to Adjusted Net Income Three Months Ended March 31, 2024 December 31, 2023 March 31, 2023 Net income attributable to shareholders of Manitex $ 2 ,283 $ 5 ,199 $ 5 3 International, Inc. Adjustments, including net tax impact 1 ,127 1 ,116 1,436 Adjusted net income attributable to shareholders of $ 3 ,410 $ 6 ,315 $ 1 ,489 Manitex International, Inc. Weighted diluted shares outstanding 2 0,363,642 2 0,306,534 20,122,054 Diluted earnings per share as reported $ 0.11 $ 0 .26 $ 0.00 Total EPS effect $ 0.06 $ 0 .05 $ 0.07 Adjusted diluted earnings per share $ 0.17 $ 0 .31 $ 0.07 14

Appendix - Reconciliations Reconciliation of Net Income to Adjusted EBITDA Reconciliation of Net Income to Adjusted EBITDA Three Months Ended March 31, 2024 December 31, 2023 March 31, 2023 Net Income $ 2,431 $ 5,457 $ (26) Interest expense 1,793 2,046 1 ,765 Tax expense 244 (3,357) 1 3 Depreciation and amortization expense 2,794 2,760 3 ,052 EBITDA $ 7,262 $ 6,906 $ 4 ,804 Adjustments: Stock compensation $ 633 $ 463 $ 7 66 FX 476 883 5 5 Severance / restructuring costs ( 51) - - Pension settlement - (230) 4 87 Litigation / legal settlement - - 3 24 Other 69 - (153) Total Adjustments $ 1,127 $ 1,116 $ 1 ,479 Adjusted EBITDA $ 8,389 $ 8,022 $ 6 ,283 Adjusted EBITDA as % of sales 11.4% 10.2% 9.3% 15