![[technical003.gif]](https://capedge.com/proxy/8-K/0001137171-10-000408/technical003.gif)
 |
Green Giant Property
Technical Report Update NI-43-101
Fotadrevo, Province of Toliara,
Prepared by
Pierre Desautels, P. GEO.
June 24, 2010
92 Caplan Avenue www.pegmining.com
|
![[technical002.jpg]](https://capedge.com/proxy/8-K/0001137171-10-000408/technical002.jpg)
GREEN GIANT PROJECT TECHNICAL REPORT UPDATE NI 43-101 | |
| Contents | |
| 1 | SUMMARY | 1-1 |
| 2 | INTRODUCTION AND TERMS OF REFERENCE | 2-1 |
| 2.1 Qualified Persons | 2-1 | |
| 2.2 Site Visits | 2-2 | |
| 3 | RELIANCE ON OTHER EXPERTS | 3-1 |
| 3.1 Mineral Tenure | 3-1 | |
| 3.2 Permitting | 3-1 | |
| 3.3 General | 3-1 | |
| 4 | PROPERTY DESCRIPTION AND LOCATION | 4-1 |
| 4.1 Location | 4-1 | |
| 4.2 Company Name Change | 4-1 | |
| 4.3 Property Title and Land Tenure | 4-3 | |
| 4.4 Environmental and Socioeconomic Issues | 4-7 | |
| 4.5 Government Policy and Outlook Regarding the Mining Industry | 4-7 | |
| 5 | ACCESSIBILITY, PHYSIOGRAPHY, CLIMATE, INFRASTRUCTURE, SECURITY | 5-1 |
| 5.1 Access | 5-1 | |
| 5.2 Physiography | 5-1 | |
| 5.3 Climate | 5-3 | |
| 5.4 Local Resources and Infrastructure | 5-3 | |
| 5.5 Security | 5-3 | |
| 6 | EXPLORATION HISTORY | 6-1 |
| 6.1 Property Scale Exploration History | 6-1 | |
| 7 | GEOLOGICAL SETTING | 7-1 |
| 7.1 Regional Geology | 7-1 | |
| 7.2 Property Geology | 7-5 | |
| 7.2.1 Lithological Descriptions of Individual Rock Formations | 7-6 | |
| 8 | DEPOSIT TYPES | 8-1 |
| 8.1 Metamorphosed Black Shale Deposit | 8-2 | |
| 8.2 Roll Front Deposit | 8-2 | |
| 9 | MINERALIZATION | 9-1 |
| 10 | EXPLORATION | 10-1 |
| 10.1 Diamond Drill Results | 10-1 | |
| 10.2 Soil XRF | 10-1 | |
| 10.3 Radiometrics | 10-1 | |
| 10.4 Trenching Program | 10-5 | |
TOC | i | |
GREEN GIANT PROJECT TECHNICAL REPORT UPDATE NI 43-101 | |
| 11 | DIAMOND DRILLING | 11-1 |
| 11.1 Energizer 2008 - 2009 Diamond Drill Program | 11-1 | |
| 11.1.1 Diamond Drill Contractor | 11-1 | |
| 11.1.2 Core Handling Procedures | 11-4 | |
| 11.1.3 Core Logging | 11-4 | |
| 11.1.4 Core Recovery | 11-4 | |
| 11.1.5 Core Photography | 11-5 | |
| 11.1.6 Collar Survey | 11-5 | |
| 11.1.7 Down Hole Surveys | 11-5 | |
| 11.1.8 Geotechnical Logging | 11-5 | |
| 11.1.9 Diamond Drill Results | 11-6 | |
| 12 | SAMPLING METHOD AND APPROACH | 12-1 |
| 12.1 X Ray Fluorescence Analysis | 12-1 | |
| 12.2 Standard Sampling | 12-1 | |
| 12.2.1 Trench Sampling | 12-1 | |
| 12.3 Diamond Drill Sampling | 12-2 | |
| 13 | SAMPLE PREPARATION, ANALYSIS, AND SECURITY | 13-1 |
| 14 | DATA VERIFICATION | 14-1 |
| 14.1 Collar and Down Hole Surveys | 14-1 | |
| 14.2 Drill Logs | 14-1 | |
| 14.3 Assays | 14-1 | |
| 14.4 Density | 14-2 | |
| 14.5 Assay QA/QC | 14-3 | |
| 14.5.1 Standard Reference Material | 14-3 | |
| 14.5.2 TH01 | 14-4 | |
| 14.5.3 TH02 | 14-5 | |
| 14.5.4 Duplicates | 14-5 | |
| 14.5.5 Blanks | 14-6 | |
| 14.6 XRF QA/QC Procedures | 14-7 | |
| 14.7 Site Visit Photos | 14-8 | |
| 15 | ADJACENT PROPERTIES | 15-1 |
| 16 | MINERAL PROCESSING AND METALLURGICAL TESTING | 16-1 |
| 16.1 Microlithics Heavy Liquid Separation Analysis | 16-1 | |
| 16.2 SGS Minerals Services (Lakefield) Work | 16-3 | |
| 16.2.1 Sample Preparation | 16-3 | |
| 16.2.2 Head Assay | 16-5 | |
| 16.2.3 Leaching Tests | 16-5 | |
| 16.3 Desktop Study Metallurgical Support Program | 16-11 | |
TOC | ii | |
GREEN GIANT PROJECT TECHNICAL REPORT UPDATE NI 43-101 | |
| 17 | MINERAL RESOURCE AND MINERAL RESERVE ESTIMATES | 17-1 |
| 17.1 Geological Interpretation | 17-1 | |
| 17.2 Exploratory Data Analysis | 17-6 | |
| 17.2.1 Assays | 17-6 | |
| 17.2.2 Trench Data Evaluation | 17-8 | |
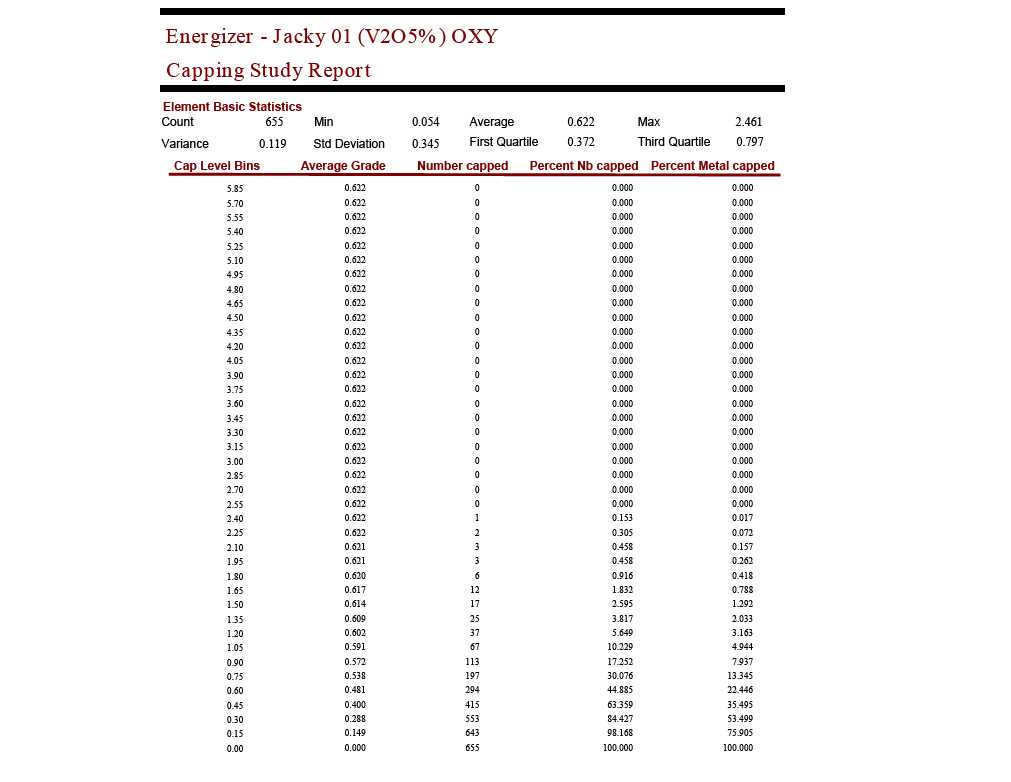
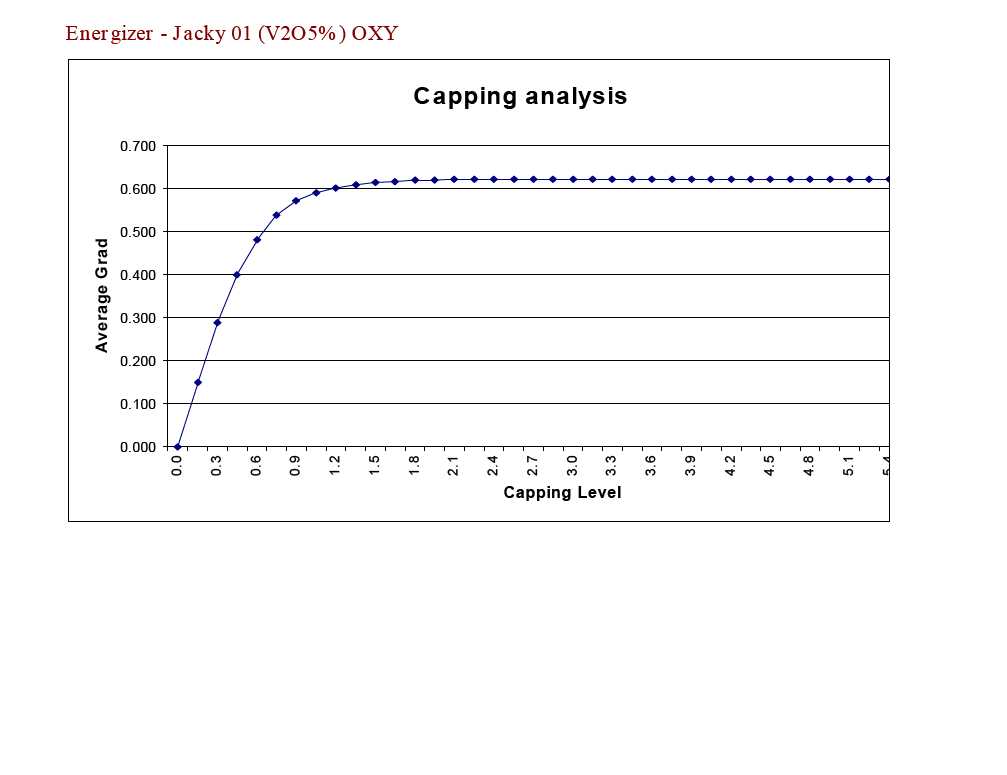
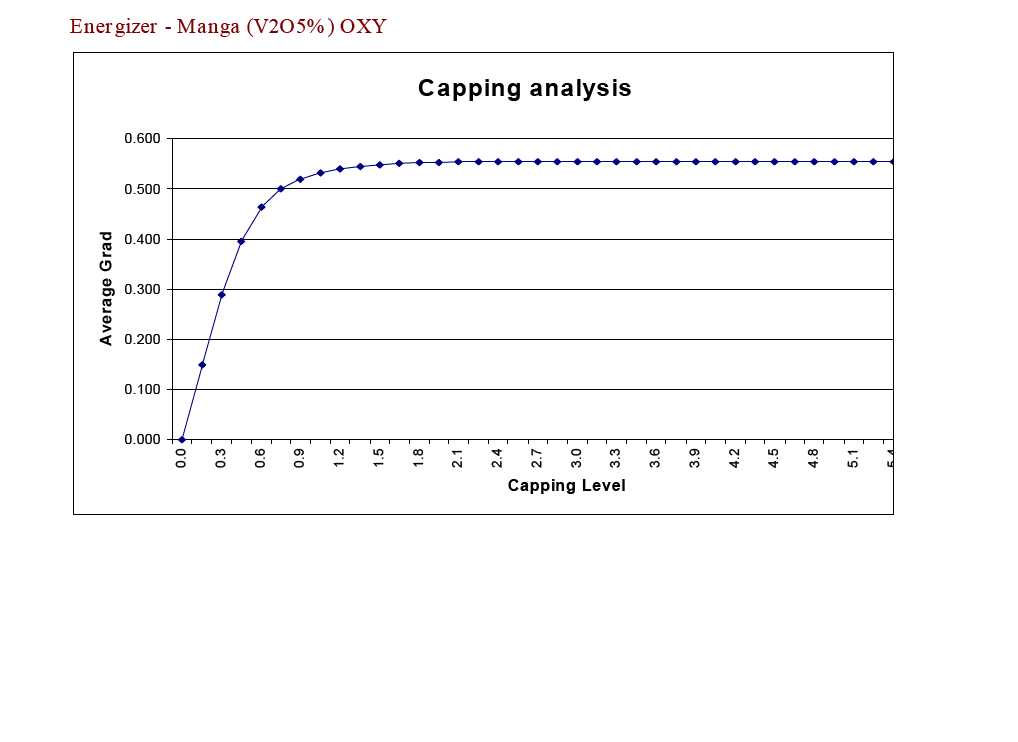
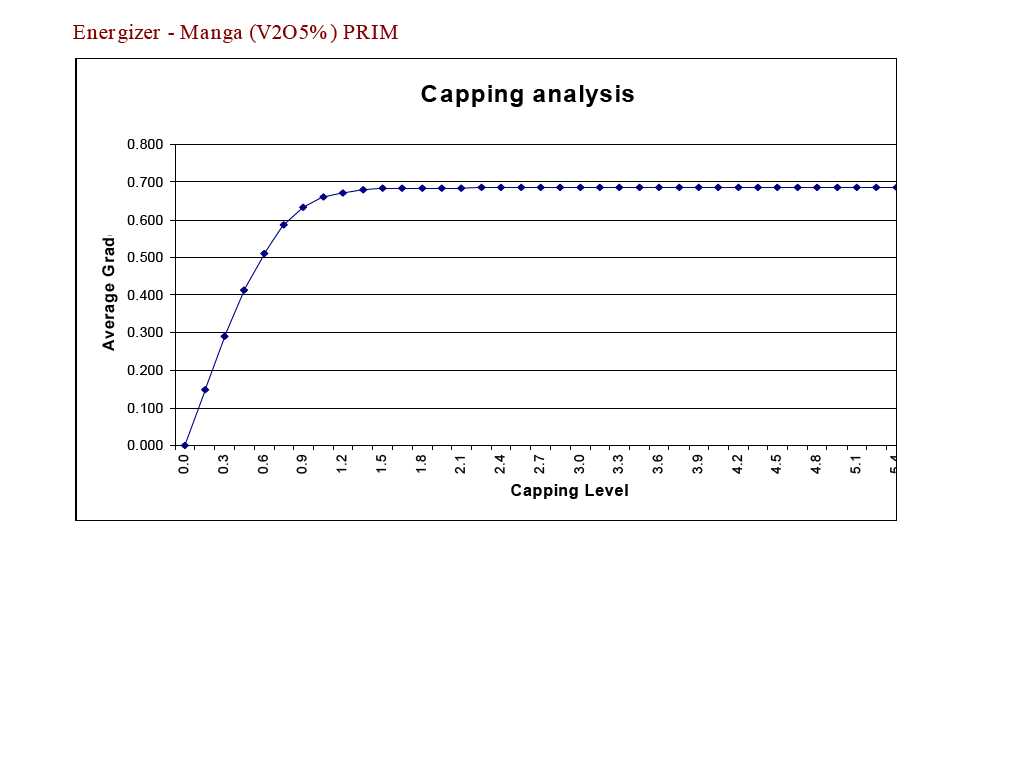
| 17.2.3 Capping | 17-10 | |
| 17.3 Composites | 17-11 | |
| 17.4 Bulk Density | 17-13 | |
| 17.5 Spatial Analysis | 17-13 | |
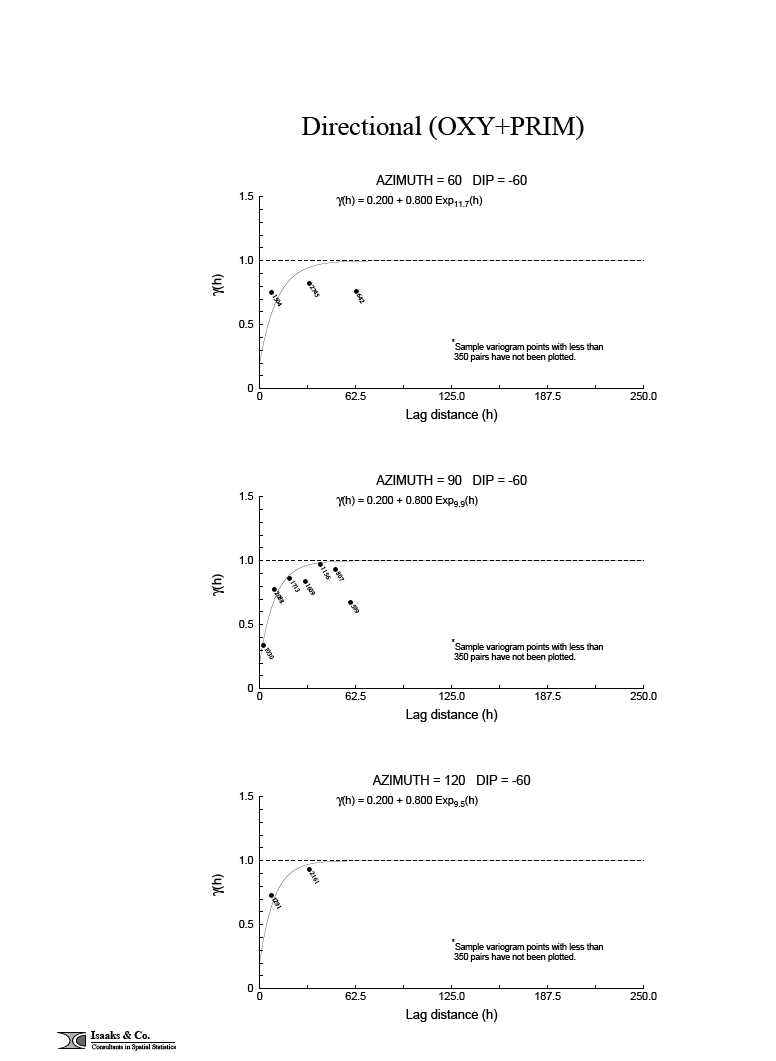
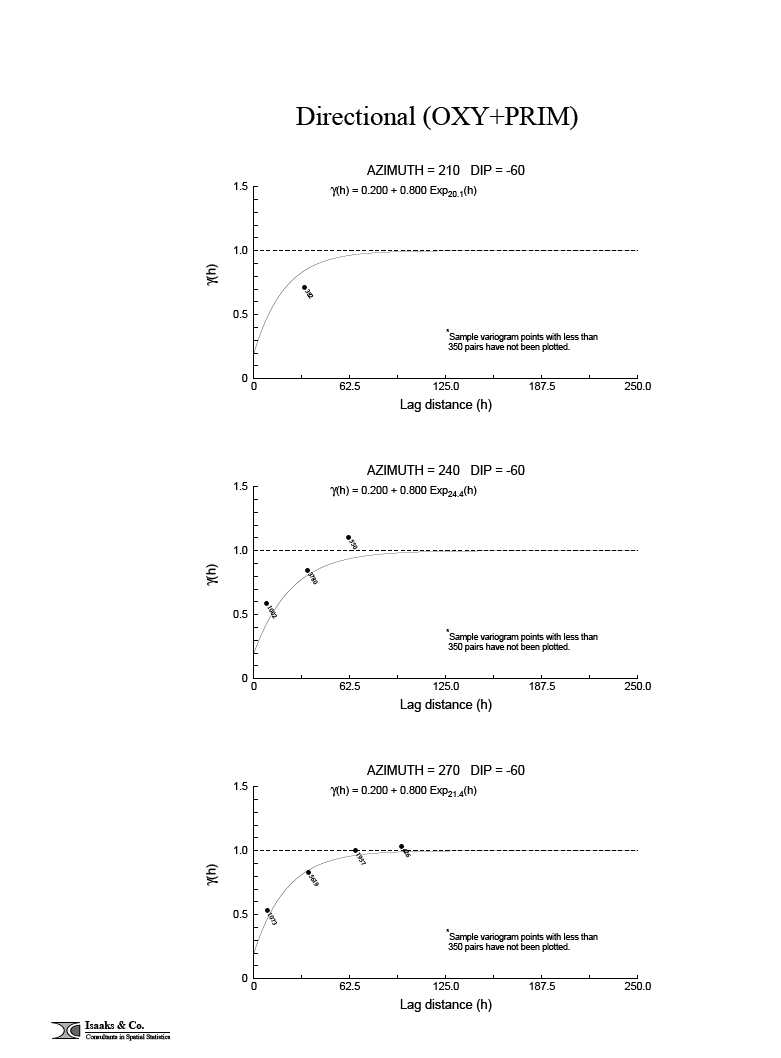
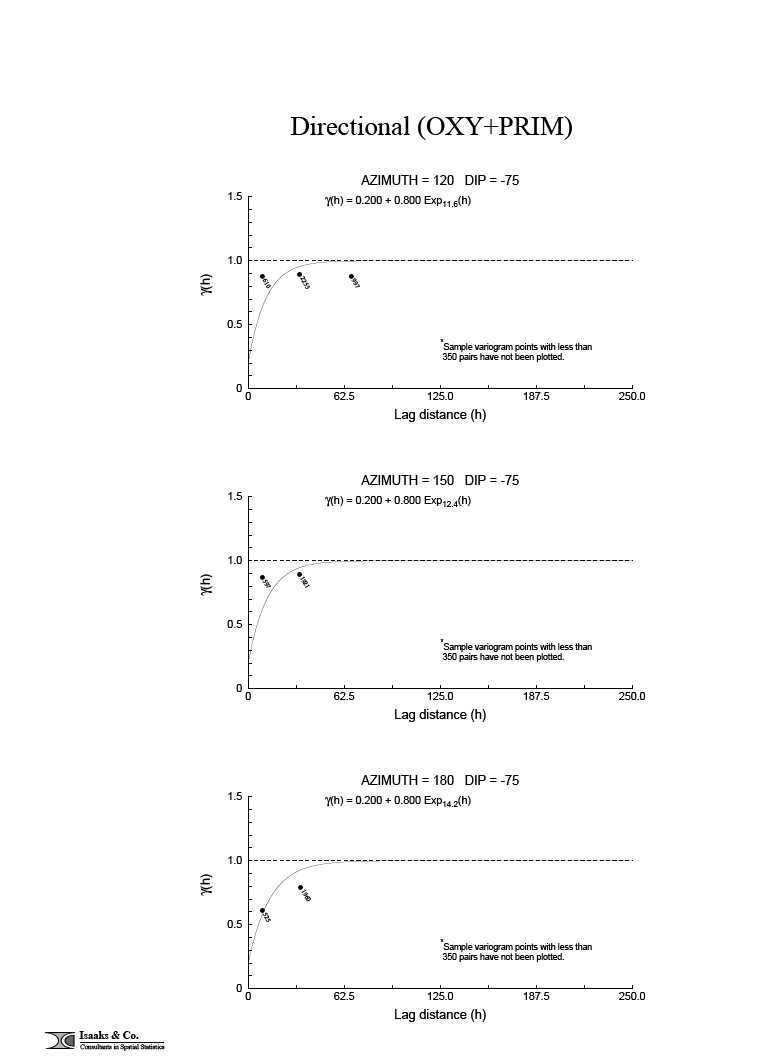
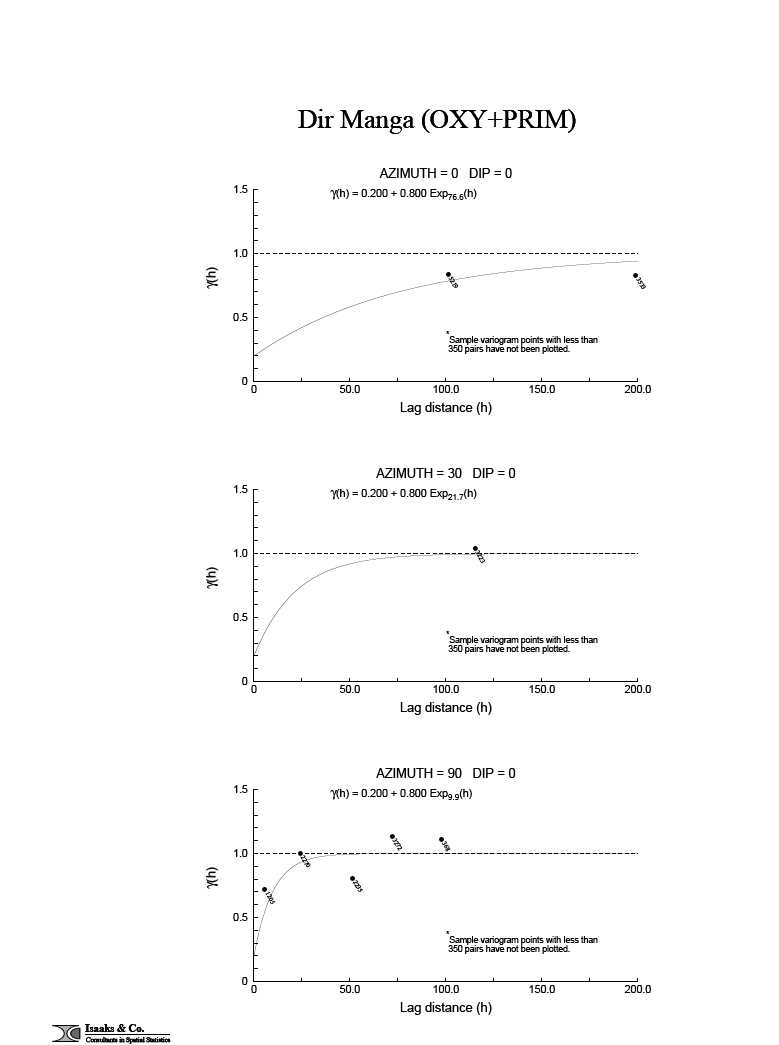
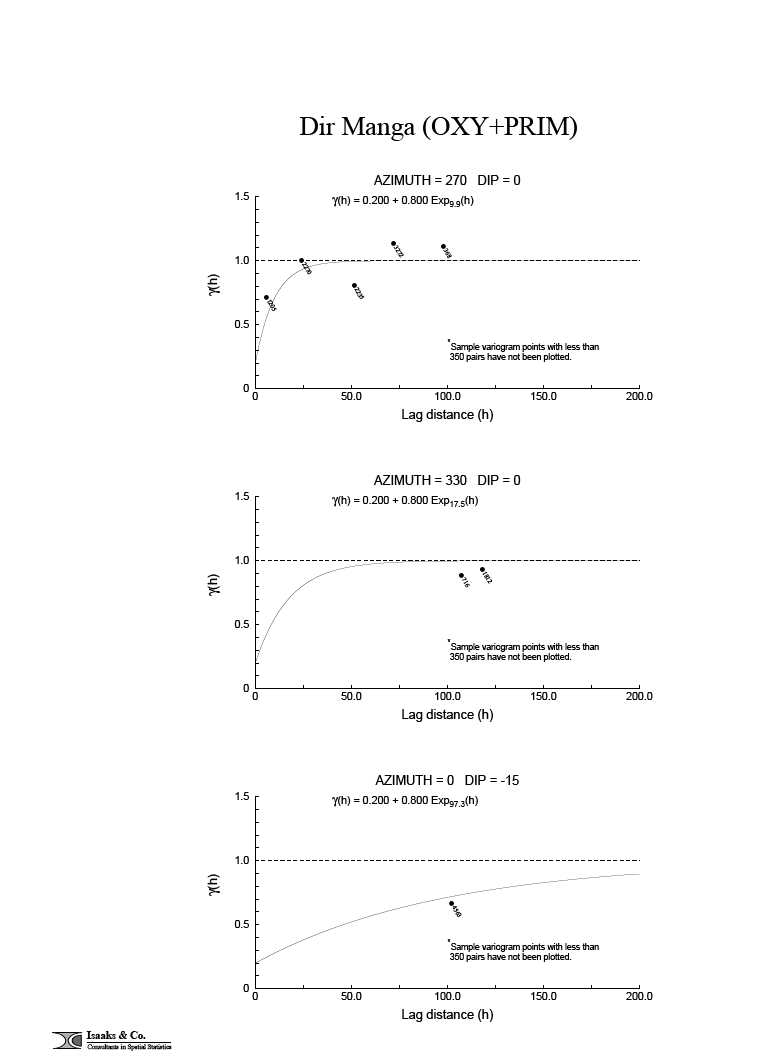
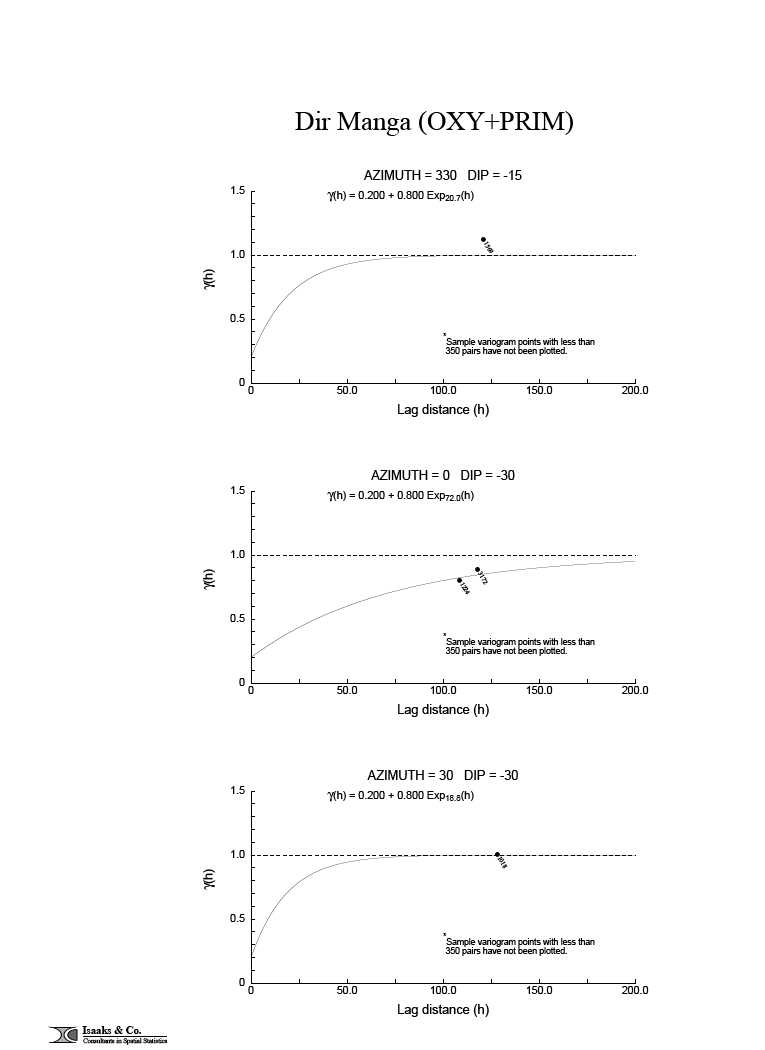
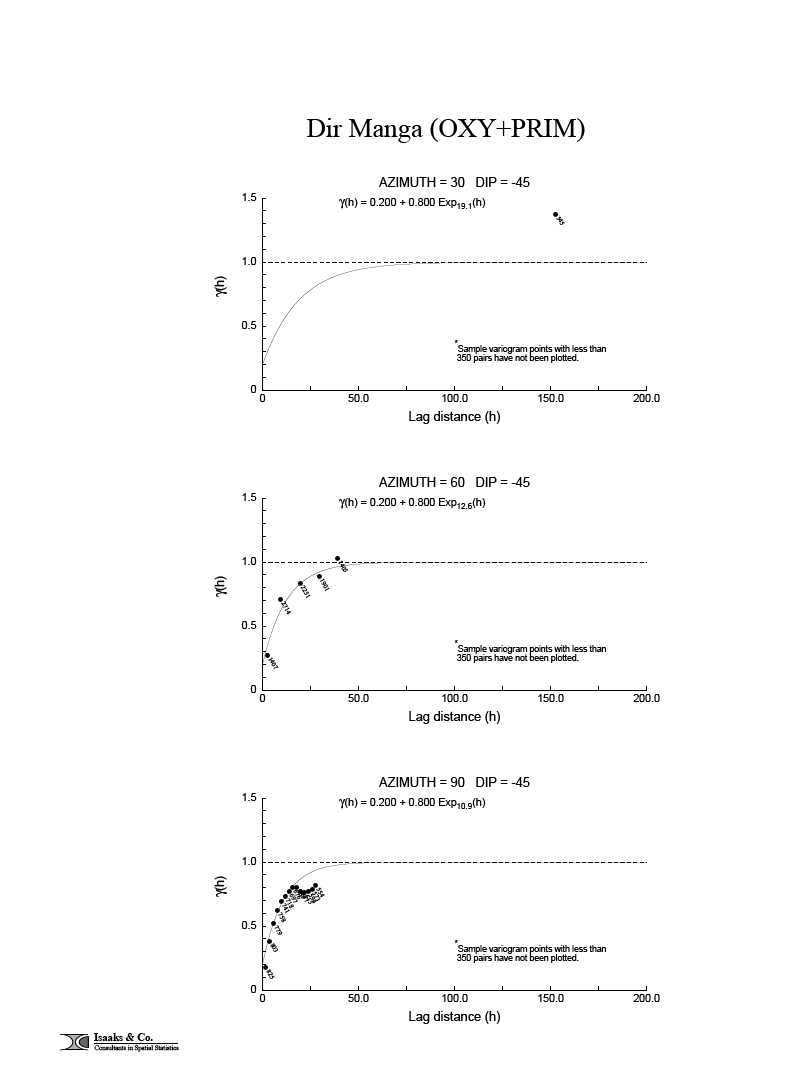
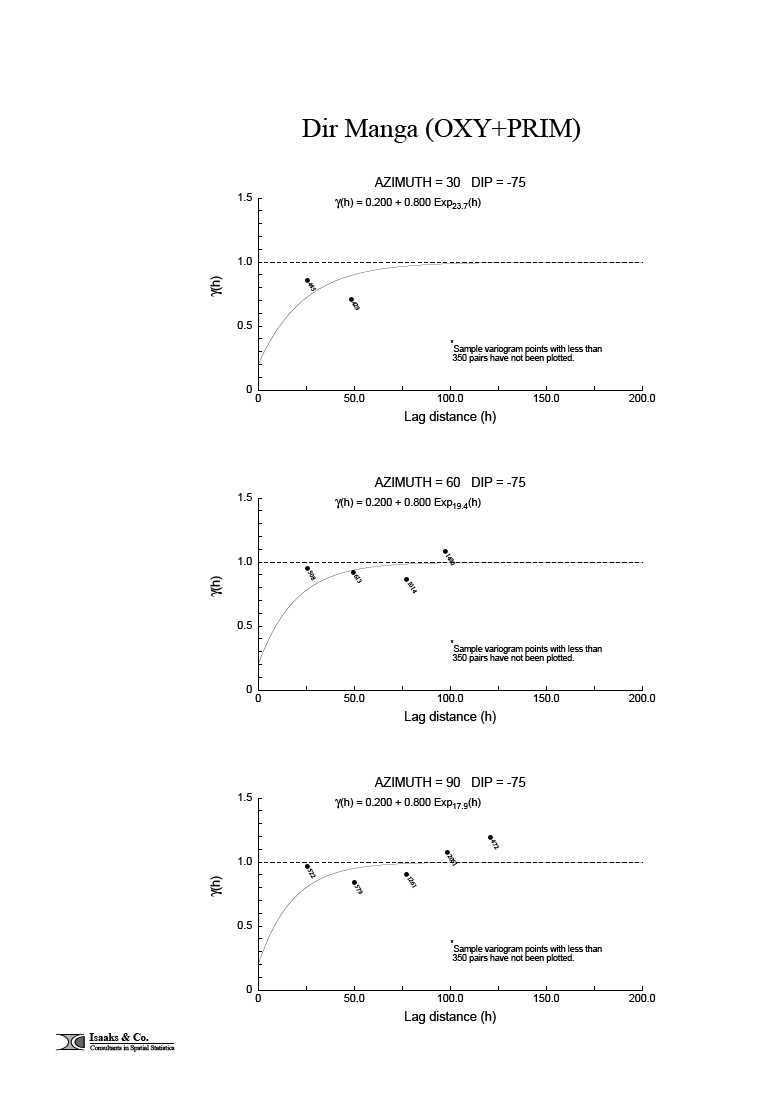
| 17.5.1 Variography | 17-13 | |
| 17.5.2 Search Ellipsoid Dimension and Orientation | 17-15 | |
| 17.6 Resource Block Model | 17-16 | |
| 17.7 Interpolation Plan | 17-17 | |
| 17.8 Mineral Resource Classification | 17-18 | |
| 17.9 Mineral Resource Tabulation | 17-20 | |
| 17.10 Block Model Validation | 17-27 | |
| 17.10.1 �� Visual Comparison | 17-27 | |
| 17.10.2 Global Comparisons | 17-27 | |
| 17.10.3 Local Comparisons - Grade Profile | 17-28 | |
| 17.10.4 Naïve Cross Validation Test | 17-30 | |
| 18 | OTHER RELEVANT DATA AND INFORMATION | 18-1 |
| 19 | ADDITIONAL NEEDS FOR DEVELOPMENT AND PRODUCTION PROPERTIES | 19-1 |
| 20 | INTERPRETATION AND CONCLUSIONS | 20-1 |
| 21 | RECOMMENDATIONS | 21-1 |
| 21.1 Proposed Budget | 21-3 | |
| 22 | CERTIFICATES OF QUALIFIED PERSONS | 22-1 |
| 22.1 Todd McCracken, P.Geo. | 22-1 | |
| 22.2 Joseph Rosaire Pierre Desautels, P.Geo. | 22-2 | |
| 22.3 Andy Holloway, P.Eng | 22-3 | |
| 23 | REFERENCES | 23-1 |
Tables
QPs Sections Review and Responsibility
Summary of the Trench Assay Data
TOC | iii | |
GREEN GIANT PROJECT TECHNICAL REPORT UPDATE NI 43-101 | |
ALS/Microlithics Analytical Results
Energizer Feed Batch Information
Particle Size and Specific Gravity
Impurity Solution Levels (final PLS only)
Vanadium Partial Residue Analyses
Summary of Drill Holes and Trench Data
Wireframe Final Volumes for Jaky and Manga Deposit
Descriptive V2O5 Raw Assays Statistics
Descriptive Statistics for Composites (drill hole and trenches)
Specific Gravity Used in the Resource Model
Ellipsoid Sample Search Parameters – Range
Ellipsoid Sample Search Parameters – Orientation
Block Model Definition (block edge)
Indicated Resources for the Green Giant Property at 0.5% V2O5 Cut-off
Global Comparisons – V2O5Grade at 0.00 Cut-off
Figures
Road Access to the Green Giant Property from the Town of Toliara
Country Geology – Geological Blocks
Tectono-Metamorphic Units of the Precambrian Terrain of Madagascar
Relative Mobility of Elements in a Secondary Environment (Levinson, 1974)
2009 Drill Holes Collar Location for Jaky
TOC | iv | |
GREEN GIANT PROJECT TECHNICAL REPORT UPDATE NI 43-101 | |
2009 Drill Holes Collar Locations for Manga
Vanadium Bearing Trend Location
Isometric View of the Jaky Wireframe
Isometric View of the Manga Wireframe
Probability Plot Comparing Trench and Drill Data
Metal Content Difference after Removing Trench Data
Jaky Indicated Resources Grade-Tonnage Curve
Jaky Inferred Resource Grade-Tonnage Curve
Manga Indicated Resources Grade-Tonnage Curve
Manga Inferred Resources Grade-Tonnage Curve
Green Giant Property – Global Grade Comparison at 0.00 Cut-off
Naïve Cross Validation Test Results at Jaky
Naïve Cross Validation Test Results at Manga
Appendices
APPENDIX A
Standards Certificates
APPENDIX B
Raw Assays Statistics
APPENDIX C
Capping and Composite Statistics
APPENDIX D
Bulk Density
APPENDIX E
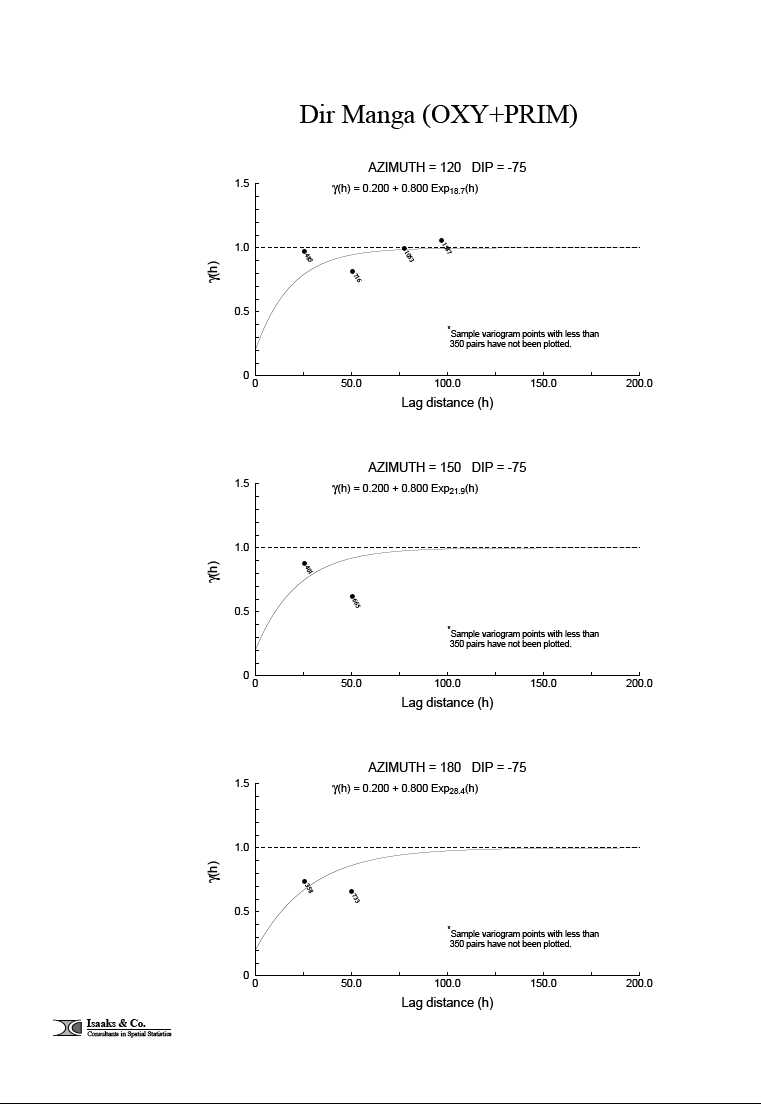
Variography Summary
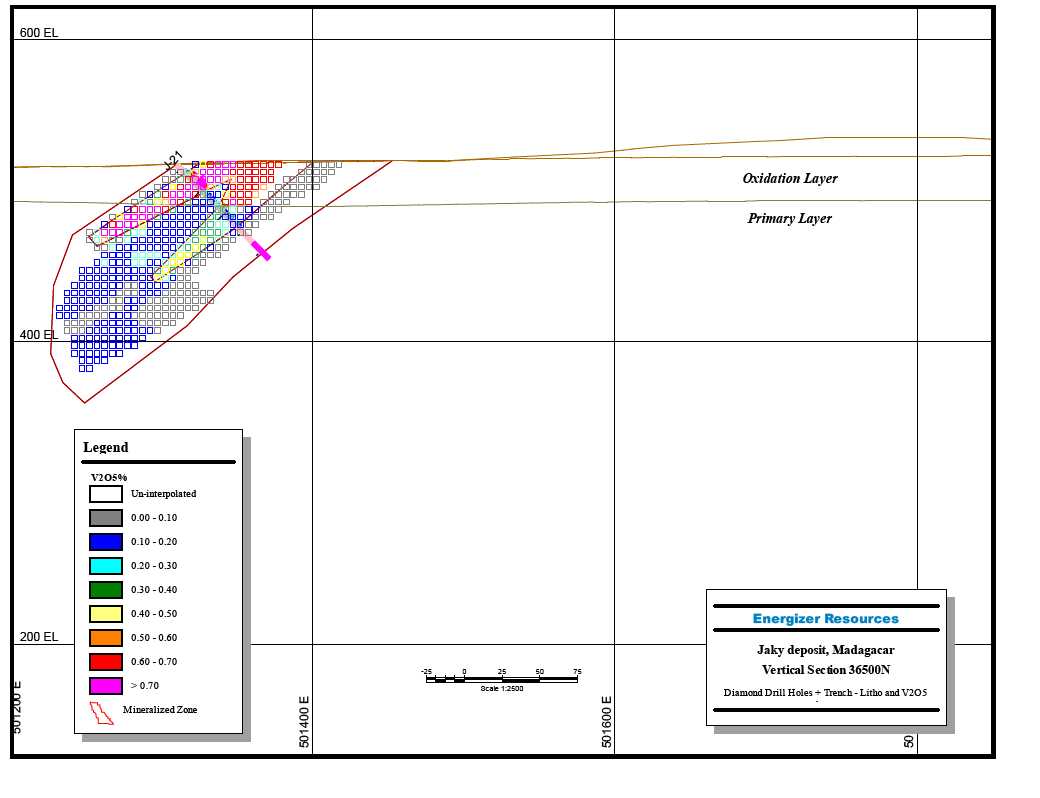
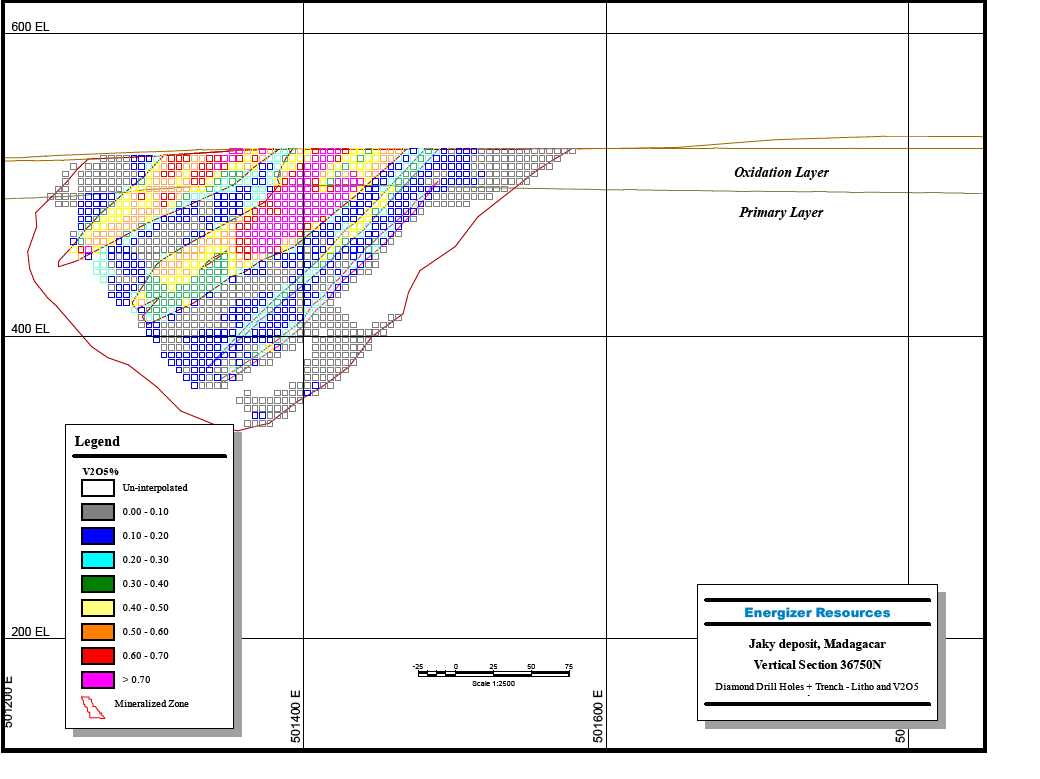
APPENDIX F
Drill Sections
APPENDIX G
SWATH Plots
TOC | v | |
GREEN GIANT PROJECT TECHNICAL REPORT UPDATE NI 43-101 | |
Glossary
Abbreviations, Symbols, and Acronyms
Agence de Promotion du Secteur Minier
ASPM
Ariary Madagascan Currency
MGA
Betsimisaraka Suture
BS
Bureau du Cadastre Minier de Madagascar
BCMM
Bureau de Recherches Géologiques et Minières (France)
BRGM
Cobalt
Co
Copper
Cu
Diamond Drill Hole
DDH
Free Acid Titration
FAT
Free Acid
FA
Gigaannum
Ga
Gold
Au
Hydrochloric Acid
HCl
Induced Coupled Plasma
ICP
Madagascar Minerals & Resources SARL
MMR
Environmental Commitment Permit
RIM
National Instrument 43-101
NI 43-101
Net Smelter Return
NSR
PEG Mining Consultants Inc.
PEG
Projet de Gouvernances des Ressources Minérales
PGRM program
Projet de Reforme du Secteur Minier
PRSM program
Qualified Persons
QPs
Quality Assurance/Quality Control
QA/QC
Rock Quality Description
RQD
Silver
Ag
Special Advisory Committee
SAC
Sulphuric Acid
H2SO4
Taiga Consultants Ltd.
Taiga
Three Dimensional
3D
Universal Transverse Mercator
UTM
Uranium Star Corporation
Uranium Star
Uranium Star Minerals SARL
USM
Uranium
U
TOC | vi | |
GREEN GIANT PROJECT TECHNICAL REPORT UPDATE NI 43-101 | |
Vanadium Pentoxide
V2O5
Vanadium
V
Volcanic Massive Sulphide
VMS
Whole Rock Analysis
WRA
X-Ray Fluorescence
XRF
Units of Measure
Centimetres
cm
Degrees
°
Degrees Celsius
°C
Feet
ft
Grams
g
Grams per litre
g/L
Hectares
ha
Kilogram per tonne
kg/t
Kilograms
kg
Kilovolt-amp
KVA
Metre
m
Metres above sea level
masl
Milligrams per litre
mg/L
Millilitres
mL
Million tonnes
Mt
Part per billion
ppb
Parts per million
ppm
10,000 parts per million = 1%
ppm vs. %
Percent
%
Tonne
t
TOC | vii | |
GREEN GIANT PROJECT TECHNICAL REPORT UPDATE NI 43-101 | |
1
SUMMARY
Energizer Resources Inc. (Energizer) (formerly Uranium Star Corp.) has commissioned PEG Mining Consultants Inc. (PEG) to update the independent NI 43-101 Technical Report for the Green Giant Property in Madagascar. This update is required since PEG has now completed a Mineral Resource estimate as press released by Energizer on May 11, 2010 (Section 17 of this report). The resources estimate information was not available at the time of the previous Technical report dated November 2009.
The Green Giant project comprises claims located in south-central Madagascar located in the UTM zone 38S on the WGS 84 datum at coordinates 510,000 E 7,350,000 N, 145 km southeast of the city of Toliara, in the Tulear region/Fotadrevo, covering an area of 225 km2situated in two separate blocks. The property is composed of two separate groups of four and two Research Permits respectively. Energizer Resources Inc. (Energizer) has acquired an indirect 100% interest in the property from Madagascar Minerals and Resources (MMR).
The property is located in an area that has abundant access via a network of seasonal secondary roads radiating outward from the village of Fotadrevo. Fotadrevo in turn has access to a regional road system that leads to the regional capital of Toliara. Dry semi-desert climate subjected to seasonal cyclonic rainfall characterize the region and the property. The rocks in the region are oxidized to a shallow depth, usually less than 10 m.
The property is underlain by highly metamorphosed and sheared quarto-feldspathic ± biotite ± garnet gneisses, metasedimentary rocks (marble, chert, quartzite, and iron formation), hornblende biotite gneiss and minor amphibolite, graphitic schist and granitoid generally striking 010o. Two main directions of faulting occur on the property, parallel to foliation and 320o. There are no known historic mineral occurrences on the property.
Energizer retained Taiga Consultants Ltd. (Taiga) to manage the exploration activities of the Green Giant Project and PEG Mining Consultants Inc. (PEG) to provide an independent Mineral Resource Estimate and Technical Report for the Green Giant Property. Work completed on the Green Giant Property in 2007 and 2008 by Taiga has been detailed in a report titled “Summary Report for the (April to July 2009 and September to December 2009) Exploration Programs on the Three Horses Property February, 2010” authored by Scherba, C, and Chisholm, R.E. (2008) and Scherba, C., and Aussant, C.H. (2009).
Energizer initially completed a Joint Venture agreement with Madagascar Minerals & Resources SARL (MMR) of Madagascar for a 75% interest in the Green Giant project. A subsequent purchase and sale agreement for the remaining 25% has resulted in Energizer now owning an indirect 100% interest in the property.
TOC | 1-1 | |
GREEN GIANT PROJECT TECHNICAL REPORT UPDATE NI 43-101 | |
The discovery of potentially economic vanadium mineralization on the property changed the focus of the 2008 diamond-drilling program. Through a combination of prospecting, ground based scintillometer surveying, and analysis of a published airborne radiometric survey, five extensive vanadium-bearing trends were identified during the 2008 exploration program. These vanadiferous trends are theorized to have formed in a black shale or paleo-roll-front environment before being subjected to regional granulite facies metamorphism. Energizer selected the Jaky and Manga vanadium-bearing trend as the most prospective targets on the property and focus the late 2009-drill program at delineating Inferred and Indicated resources on these two deposits.
A petrologic study of the primary mineralized material was completed which indicated that the majority of the vanadium is present in silicate minerals below the weathered zone. A heavy liquid mineral separation test was run to see if a vanadium concentrate could be extracted. It was found that vanadium minerals could not be preferentially concentrated by heavy liquid methods. Subsequently a series of preliminary metallurgical tests were completed on mineralized drill-core reject-material and this test work indicates that the silicate material preferentially liberates vanadium under acid attack. In the case of both oxidized and fresh material, it was found that the mineralization is not refractory although a final extraction process has not been determined. Energizer Resources is currently conducting metallurgical testing on samples from the Gr een Giant property. The results from this testing are not currently available and will be incorporated into a subsequent resource statement and economic evaluation.
Effective May 11, 2010, PEG has estimated the mineral resource for the Green Giant property in Madagascar. The mineral deposits on this property have been divided into two separate zones, which are referred to as the Jaky and Manga deposits. This mineral resource estimate utilized approximately 9,900 m of diamond drill hole data and was supplemented by approximately 3,600 m of trench data from the 2008 and 2009 exploration programs.
TOC | 1-2 | |
GREEN GIANT PROJECT TECHNICAL REPORT UPDATE NI 43-101 | |
The Jaky and Manga resource estimate comprises of Indicated and Inferred resources reported as vanadium pentoxide mineralization at a base case cut-off grade of 0.5% V2O5.
The method employed to select the base case cut-off grades was to consider the mineralogical characteristic, envisioned mining methods and comparable Vanadium projects worldwide.
The vanadium pentoxide (V2O5) deposit on the Green Giant property is characterized by two separate categories: oxide and primary. Within the oxide and primary zone of Jaky and Manga deposits, the total Indicated resource is 21.74 Mt at 0.759% V2O5 containing 363.8 Mlb of vanadium pentoxide. The total Inferred resource is 4.15 Mt at a grade of 0.655% V2O5 containing 59.8 Mlb of vanadium pentoxide.
Mineral resources at the Green Giant Property were classified using logic consistent with the CIM definitions referred to in NI 43-101 guidelines. This independent mineral resource estimate and review conducted by PEG supports the disclosure by Energizer of the mineral resource statement for the Jaky and Manga deposit dated May 11, 2010.
TOC | 1-3 | |
GREEN GIANT PROJECT TECHNICAL REPORT UPDATE NI 43-101 | |
2
INTRODUCTION AND TERMS OF REFERENCE
This report describes the results of a first mineral resource estimation of the Green Giant Project, located in southern Madagascar, which is owned by Energizer Resources Inc. (Energizer) based in Toronto, Canada. This report is written to comply with standards set out in National Instrument 43-101 (NI 43-101) by the Canadian Securities Administration. It was prepared at the request of Ms. Julie Lee Harrs, President and COO of Energizer.
Taiga Consultants Ltd. (Taiga) manages all exploration activities of the Green Giant Project since 2007. The project is in exploration stage and there are no known historical mineral resources of any kind within its boundaries.
Two technical reports have been filed on the Green Giant project. The oldest report titled “Geological Evaluation of the Three Horses Property Fotadrevo, Province of Toliara, Madagascar” was authored by Scherba and Chisholm and is dated June 26, 2008. The report was commission by Energizer under its former name of Uranium Star. The Three Horses Property has been renamed the Green Giant Property
The most recent report dated November 27, 2009, and titled “Technical Report Update NI 43-101, Fotadrevo, Province of Toliara, Madagascar” was authored by Mr T. McCracken and Mr. A Holloway of PEG Mining Consultants and filed on SEDAR. Much of the information presented in this report from Sections 4 through 13 and Sections 15 and 16 was sourced from this report. This information has been reproduced here for readability and updated when necessary by the author.
Unless specified, all measurements in this Technical Report use the metric system. Universal Transverse Mercator (UTM) coordinates are used within this report, and are reported in UTM zone 38S, WGS 84datum. The report currency is expressed in US dollars.
The sections on Mining Operations, Process Metal Recoveries, Markets, Contracts, Environmental Considerations, Other Relevant Data and Information, Taxes, Capital and Operating Cost Estimates, Economic Analysis, Payback, and Mine Life, are not applicable to this report. All Illustrations are embedded within the body of the report.
2.1
Qualified Persons
Table 2-1 shows a list of the Qualified Persons (QPs), as defined in NI 43–101 and in compliance with Form 43–101 F1 (the “Technical Report”), responsible for the preparation of this report.
TOC | 2-1 | |
GREEN GIANT PROJECT TECHNICAL REPORT UPDATE NI 43-101 | |
Table 2-1:
QPs Sections Review and Responsibility
Qualified Person | Site Visit | Report Sections of Responsibility |
Pierre Desautels | N/A | Section 1, 2, 3, 4, 5, 6, 7, 8, 9, 10, 11, 12, 13, 14.3, 14.5, 15, 17, 18, 19, 20, 21, 22, and 23, and those portions of the summary, conclusions, and recommendations that pertain to these sections |
Todd McCracken | October 7 to 16, 2009 | Site visit, Sections 14 with the exception of the assay and database validation and section 14.5 |
Andy Holloway | May 12 to 14, 2010 | Section 16 |
2.2
Site Visits
On behalf of PEG, Todd McCracken, P.Geo., visited the property to conduct an independent review during October 7 to 16, 2009. Andy Holloway, P.Eng., C.Eng., visited the property from May 12 to 14, 2010.
Only results up to September 2009 have been received and reviewed by Mr. McCracken.
TOC | 2-2 | |
GREEN GIANT PROJECT TECHNICAL REPORT UPDATE NI 43-101 | |
3
RELIANCE ON OTHER EXPERTS
PEG has followed standard professional procedures in preparing the content of this report. Data used in this report has been verified where possible, and this report is based on information believed to be accurate at the time of its completion.
The QPs, authors of this Technical Report, state that they are qualified persons for those areas as identified in the appropriate QP “Certificate of Qualified Person” attached to this report. The authors have relied on and disclaim responsibility for information derived from the following reports pertaining to mineral rights permitting issues.
3.1
Mineral Tenure
PEG’s QPs have not reviewed the mineral tenure nor have they independently verified the legal status or ownership of the Project area or underlying property agreements. PEG has relied on Energizer experts and independent experts retained by Energizer.
3.2
Permitting
Regarding the status of the current permits, PEG’s QPs have relied on information, opinions, and data supplied by Energizer representatives and by independent experts retained by Energizer.
3.3
General
Property information in this report is sourced from photocopies of official documents, which has been supplied by Energizer. The authors are not responsible for the accuracy of any property data, and do not make any claim or state any opinion as to the validity of the property disposition described herein.
For the preparation of this report, the authors have relied on maps, documents, and electronic files generated by the current and past exploration crews, contributing consultants, and service providers working under their supervision. To the extent possible under the mandate of a NI 43-101 review, the data has been verified with regard to the material facts relating to the prospectiveness of the property reviewed in this report.
TOC | 3-1 | |
GREEN GIANT PROJECT TECHNICAL REPORT UPDATE NI 43-101 | |
4
PROPERTY DESCRIPTION AND LOCATION
4.1
Location
The Green Giant Project is located in south-central Madagascar, 145 km southeast of the city of Toliara, in the Tulear region/Fotadrevo (Figure 4 1). The property comprises an area of 3,600 km2situated in two separate blocks. The project is centred on UTM coordinates 510,000 E 7,350,000 N (UTM WGS 84). Madagascar designates individual claims by a central LaBorde UTM location point, comprising a square with an area of 6.25 km2, the block area extending 1.25 km in all directions from this central point.
The village of Fotadrevo is situated within the southwestern edge of the southern Green Giant project block.
4.2
Company Name Change
During the course of the exploration programs, Energizer changed the name of the project from Three Horses to Green Giant in the spring of 2009. At the Special and Annual Shareholders’ meeting held on December 9, 2009, the Company’s shareholders approved a change of the Company’s name from Uranium Star Corp. (trading symbol “URST” on the OTC BB, now ENZR)to Energizer Resources Inc. Energizer Resources Inc. also commenced its trading on the TSX Venture Exchange (TSX-V) on May 5, 2010, under the trading symbol “EGZ.”
TOC | 4-1 | |
GREEN GIANT PROJECT TECHNICAL REPORT UPDATE NI 43-101 | |
Figure 4-1:
Property Location
![[technical007.jpg]](https://capedge.com/proxy/8-K/0001137171-10-000408/technical007.jpg)
TOC | 4-2 | |
GREEN GIANT PROJECT TECHNICAL REPORT UPDATE NI 43-101 | |
4.3
Property Title and Land Tenure
The claims were previously held in the name of MMR, controlled by Director Cyriaque Mamy Cheung of Antananarivo. A Joint Venture agreement was entered into with MMR in 2007, which resulted in Energizer owning a 75% interest in the Green Giant property.
Uranium Star Minerals SARL (USM) holder of the mining permits by way of an Extraordinary General Meeting dated April 6, 2010, approved a change of its name to Energizer Resources Minerals SARL (ERM). Mining rights to the property are shown in Table 4-1 and Figure 4-2.
The change of name was officially registered by the Registrar of Commerce and of Companies in Antananarivo Madagascar on May 12, 2010.
Shares held by MMR in USM/ERM were purchased entirely by THB Venture Limited (THB), a private company duly incorporated in Mauritius, bearing file number 079631 C2/GBL. Energizer Resources Inc. holds 100% of the shares in THB.
Energizer reports that URST and MMR completed a purchase and sale agreement on July 9, 2009, which gave URST the exclusive right to purchase the remaining 25% of the Green Giant project from MMR for the sum of US$100,000. In conjunction with the transaction, URST agreed to grant MMR a 2% Net Smelter Return (NSR) Royalty with URST having a “buyback” option, but not an obligation, to purchase the first 1% of the NSR for US$500,000. Upon exercising its option to purchase the first 1%, URST then has a further “buyback” option, but not an obligation, to purchase the second 1% of the NSR for US$1,000,000. Payments for the purchase of the NSR are payable in cash or equivalent shares at URST’s sole discretion.
USM, as a locally incorporated joint venture subsidiary, can apply directly under the LGIM (Law on large investment in Mining) for customs exemptions for importing exploration and development materials.
Table 4-2 shows the property according to the mining permits.
TOC | 4-3 | |
GREEN GIANT PROJECT TECHNICAL REPORT UPDATE NI 43-101 | |
Table 4-1:
Claims Status
Permit | Square # | LaBorde Projection | WGS 84, Zone 38 South | Date Granted | Expiration date | ||
X | Y | UTMX | UTMY | dd/mm/yyyy | |||
Green Giant Property | |||||||
PR12306 | 21275 | 253750 | 231250 | 500104.92 | 7341934.36 | 09/11/2004 | 09/11/2014 |
PR12306 | 21275 | 253750 | 233750 | 500127.07 | 7344434.45 | 09/11/2004 | 09/11/2014 |
PR12306 | 21275 | 256250 | 223750 | 502538.59 | 7334411.96 | 09/11/2004 | 09/11/2014 |
PR12306 | 21275 | 256250 | 226250 | 502560.72 | 7336912.05 | 09/11/2004 | 09/11/2014 |
PR12306 | 21275 | 256250 | 228750 | 502582.86 | 7339412.12 | 09/11/2004 | 09/11/2014 |
PR12306 | 21275 | 256250 | 231250 | 502605 | 7341912.21 | 09/11/2004 | 09/11/2014 |
PR12306 | 21275 | 256250 | 233750 | 502627.16 | 7344412.3 | 09/11/2004 | 09/11/2014 |
PR12306 | 21275 | 256250 | 236250 | 502649.32 | 7346912.39 | 09/11/2004 | 09/11/2014 |
PR12306 | 21275 | 256250 | 238750 | 502671.49 | 7349412.48 | 09/11/2004 | 09/11/2014 |
PR12306 | 21275 | 256250 | 241250 | 502693.66 | 7351912.57 | 09/11/2004 | 09/11/2014 |
PR12306 | 21275 | 256250 | 243750 | 502715.83 | 7354412.66 | 09/11/2004 | 09/11/2014 |
PR12306 | 21275 | 258750 | 223750 | 505038.66 | 7334389.84 | 09/11/2004 | 09/11/2014 |
PR12306 | 21275 | 258750 | 226250 | 505060.8 | 7336889.92 | 09/11/2004 | 09/11/2014 |
PR12306 | 21275 | 258750 | 228750 | 505082.94 | 7339389.99 | 09/11/2004 | 09/11/2014 |
PR12306 | 21275 | 258750 | 231250 | 505105.08 | 7341890.06 | 09/11/2004 | 09/11/2014 |
PR12306 | 21275 | 258750 | 233750 | 505127.24 | 7344390.14 | 09/11/2004 | 09/11/2014 |
PR12306 | 21275 | 258750 | 236250 | 505149.41 | 7346890.22 | 09/11/2004 | 09/11/2014 |
PR12306 | 21275 | 258750 | 238750 | 505171.57 | 7349390.31 | 09/11/2004 | 09/11/2014 |
PR12306 | 21275 | 258750 | 241250 | 505193.75 | 7351890.4 | 09/11/2004 | 09/11/2014 |
PR12306 | 21275 | 258750 | 243750 | 505215.93 | 7354390.48 | 09/11/2004 | 09/11/2014 |
PR12306 | 21275 | 261250 | 231250 | 507605.16 | 7341867.91 | 09/11/2004 | 09/11/2014 |
PR12306 | 21275 | 261250 | 233750 | 507627.32 | 7344367.99 | 09/11/2004 | 09/11/2014 |
PR12306 | 21275 | 261250 | 236250 | 507649.49 | 7346868.06 | 09/11/2004 | 09/11/2014 |
PR12306 | 21275 | 261250 | 238750 | 507671.65 | 7349368.14 | 09/11/2004 | 09/11/2014 |
PR12306 | 21275 | 261250 | 241250 | 507693.83 | 7351868.22 | 09/11/2004 | 09/11/2014 |
PR12306 | 21275 | 261250 | 243750 | 507716.02 | 7354368.29 | 09/11/2004 | 09/11/2014 |
PR12888 | 129 | 251250 | 231250 | 497604.82 | 7341956.51 | 26/01/2005 | 26/01/2015 |
PR12887 | 128 | 248750 | 228750 | 495082.58 | 7339478.55 | 26/01/2005 | 26/01/2015 |
PR12814 | 126 | 261250 | 223750 | 507538.73 | 7334367.7 | 26/01/2005 | 26/01/2015 |
PR12814 | 126 | 261250 | 226250 | 507560.86 | 7336867.77 | 26/01/2005 | 26/01/2015 |
PR12814 | 126 | 261250 | 228750 | 507583.01 | 7339367.83 | 26/01/2005 | 26/01/2015 |
Ianapera Property | |||||||
PR13020 | 132 | 261250 | 273750 | 507982.65 | 7384369.46 | 26/01/2005 | 26/01/2015 |
PR13021 | 133 | 261250 | 266250 | 507915.92 | 7376869.15 | 26/01/2005 | 26/01/2015 |
PR13021 | 133 | 261250 | 268750 | 507938.16 | 7379369.25 | 26/01/2005 | 26/01/2015 |
PR13021 | 133 | 263750 | 268750 | 510438.27 | 7379347.01 | 26/01/2005 | 26/01/2015 |
PR13021 | 133 | 263750 | 271250 | 510460.5 | 7381847.12 | 26/01/2005 | 26/01/2015 |
TOC | 4-4 | |
GREEN GIANT PROJECT TECHNICAL REPORT UPDATE NI 43-101 | |
Figure 4-2:
Land Claims
![[technical008.jpg]](https://capedge.com/proxy/8-K/0001137171-10-000408/technical008.jpg)
TOC | 4-5 | |
GREEN GIANT PROJECT TECHNICAL REPORT UPDATE NI 43-101 | |
Table 4-2:
Mining Permits
Permit Number | Number of Squares | Square Kilometres | |
PR 12306 | 416 | 2,600 | |
PR 12888 | 16 | 100 | |
PR 12887 | 16 | 100 | |
PR 12814 | 48 | 300 | |
PR 13020 | 16 | 100 | |
PR 13021 | 64 | 400 | |
Total | 576 | 3,600 |
The claims were acquired by MMR under the rules of the Code Minier 1999. Some limited amendments have been instituted to the Code byDecret 2005-021, which the Bureau du Cadastre Minier de Madagascar (BCMM), the administration body for mining permits, has published in a handout dated 2006, available in their office in Antananarivo. The amendments relate to the reduction of the permit duration (from 10 years to 5) and permittablesquare size (from 2.5 km x 2.5 km to 625 m x 625 m), and changes to the fees applied. Upon passage of the new decree, pre-existing old squares were converted to new squares, and pre-existing properties are now governed by the tenets ofDecret 2005-021.
The updated Decret requires the payment of annual administration fees of Permits Research of 15,000 Ariary (MGA). The conversion rate (as at 10 November 2009) is approximately 1,959 Ariary to one US dollar. Annual fees are equivalent to roughly US$9 for research permits and US$28 for exploitation permits in years one and two. Annual fees increase by multiplying by a factor equivalent to the number of years (plus 1) that the permit has been held by the company. Research permits have an updated duration of five years, with the possibility of two renewals of an additional three years each. Five of the permits (10 squares) are in Year 4, while one permit (26 squares) is in Year 5, therefore the next administration fee will be 30,000 MGA per square. Payments of the administration fees are due on March 31 of each year, along wit h the submission of an activity report.
Reporting requirements of exploration activities carried out by the titleholder on a Research Permit are relatively light. A titleholder must maintain a diary of events and record the names and dates present of persons active on the project. In addition, a site plan with a scale between 1/100 and 1/10,000 showing “a map of the work completed” must be presented.
Permit ownership is readily transferable. Upon establishment of a resource, Research Permits are readily transferable into Exploitation Permits by application.
TOC | 4-6 | |
GREEN GIANT PROJECT TECHNICAL REPORT UPDATE NI 43-101 | |
The properties have not been legally surveyed; however, since all claim boundaries conform to the predetermined rectilinear LaBorde Projection grid, these can be readily located on the ground by use of Global Positioning System instruments.
Most current GPS units and software packages do not offer LaBorde among their available options, and therefore defined shifts have to be employed to display LaBorde data in the WGS 84 system. For convenience, all Energizer positional data is collected in WGS 84, and if necessary converted back to LaBorde.
4.4
Environmental and Socioeconomic Issues
As far as PEG is aware, there are no known previously existing environmental liabilities on the Property. The history of mining and industrial development in the region is extremely limited.
All surface work requires provincial government permits, including camp construction permits. Exploration has been authorized by a minimum environmental commitment permit (RIM) issued by the Ministry of Mines.
4.5
Government Policy and Outlook Regarding the Mining Industry
The Malagasy Government embarked on an economic revival plan in 2000. The Ministry of Energy and Mines had already initiated reform through the PRSM program (Projet de Reforme duSecteur Minier) with the introduction of the new Mining Code in 1999 and the establishment of the Mining Titles (Cadastral) Registry (Bureau du Cadastre Minier de Madagascar, or BCMM) in 2000. These initiatives are already attracting new investors to Madagascar, including both junior and senior mining companies, to explore and develop the country’s mineral endowment within a stable, transparent legal and regulatory framework.
During 2003, in furtherance of its economic policy, the Ministry commenced the 5-year PGRM program (Projet de Gouvernances des Ressources Minérales) with the following objectives:
·
further improvement and enforcement of the legal and statutory framework, particularly with respect to mining
·
promoting investment in the minerals sector through a dedicated ASPM (Agence de Promotion du Secteur Minier)
·
improving the geoscientific knowledge of Madagascar through geophysical surveys, geological mapping, and remote sensing, with appropriate staff training to support mapping projects
·
certification of and improvements in marketing gems
TOC | 4-7 | |
GREEN GIANT PROJECT TECHNICAL REPORT UPDATE NI 43-101 | |
·
creating community based system for artisanal and small scale mining, called ‘Tan-tsoroka,’ intended to help finance and promote sustainable mining activity
·
together with addressing environmental health and safety issues, contribute to poverty reduction.
According to international news sources, in early November 2009 a power-sharing coalition government agreed to govern the country until the next election, scheduled for late 2010. Based on information provided by the Company, the Green Giant project has not been adversely affected by the political situation in Madagascar during this past year, nor are there any indications that it will be adversely affected going forward.
Energizer has established a Special Advisory Committee (SAC) to manage its Malagasy Government affairs in regard to the Green Giant vanadium project (29 June 2009, Energizer news release). The Committee is chaired by Brian Tobin, P.C., ICD.D, of Fraser Milner Casgrain LLP, who is expected to render political and financial advice to the Company. Contributing to the SAC will be Peter Harder, a former senior bureaucrat in the Department of Foreign Affairs and International Trade Canada. It is expected that the Committee will assist the Company to liaise with the Madagascar government and also provide direction and assistance in the search for strategic partners and project funding.
TOC | 4-8 | |
GREEN GIANT PROJECT TECHNICAL REPORT UPDATE NI 43-101 | |
5
ACCESSIBILITY, PHYSIOGRAPHY, CLIMATE, INFRASTRUCTURE, SECURITY
5.1
Access
Access is via a 70 km paved road from southeastern Madagascar’s administrative centre, Toliara, to the village of Andranovory. From Andranovory, secondary all-season roads are used to travel to Betioky, a distance of 93 km. From Betioky the property area can be reached by going via Ambatry to Fotadrevo, a distance of 105 km (268 km total), or from Betioky to Ejeda then onwards to Fotadrevo, a distance of 161 km (324 km total). This second route from Ejeda to Fotadrevo is used by heavy transports and during portions of the rainy season, as the other route quickly becomes impassable. At the height of the rainy season, both routes to Fotadrevo may be largely impassable. Figure 5-1 shows the road access to the Green Giant Property from the town of Toliara (also called Tulear).
With the construction of an all-weather airstrip at Fotadrevo during the 2008 program, the property is now accessible year-round by air using private aircraft out of Antananarivo. Flying times to the Property are roughly 2.5 h from Antananarivo and 45 min from Toliara.
The capital, Antananarivo, is currently serviced by Air France out of Paris, South African Airways services to Johannesburg, and Air Mauritius to Mauritius; Air Madagascar also provides services to Paris, Johannesburg, Mauritius, Nairobi, and Réunion. Air Madagascar also has infrequent flights to Bangkok and Milan; domestically, Air Madagascar has regularly scheduled jet and propjet flights throughout the country, including daily flights between Antananarivo and Toliara.
5.2
Physiography
The Green Giant project area is covered by sparse vegetation with scattered termite mounds fairly common, especially over the Fotadrevo Plateau, an area of laterite that dominates the central portion of the property. Grass cover is widespread and trees are widely spaced. Outcrop is fairly extensive. In areas of lower relief, alluvial cover is generally shallow and bedrock and/or float are readily observable. The property encompasses an area of primarily flat to rolling desert- and savannah-like plains, with the plateau of Fotadrevo composed of shallow iron-rich clay, overlying the east-central portion of the property. Elevations range between 500 and 550 masl.
TOC | 5-1 | |
GREEN GIANT PROJECT TECHNICAL REPORT UPDATE NI 43-101 | |
Figure 5-1:
Road Access to the Green Giant Property from the Town of Toliara
![[technical018.jpg]](https://capedge.com/proxy/8-K/0001137171-10-000408/technical018.jpg)
TOC | 5-2 | |
GREEN GIANT PROJECT TECHNICAL REPORT UPDATE NI 43-101 | |
Typical of the tropics, the surface is subject to lateritic type weathering; however, full laterite profiles are rarely developed within the south climatic zone. It is assumed that aggressive erosion occurs during the cyclone season, which strips weathered material from the profile and prevents fully developed laterite zones from forming. The recent drilling on the property indicated that the weathered profile is less than 10 m thick in the region, which is roughly one third of that seen in other parts of the island and on the adjacent African continent. This should be kept in mind as it is bound to have significant effects in regards to interpretation of exploration data.
5.3
Climate
Five climatic zones divide Madagascar. The Green Giant project falls within the semi-desertic South zone, with elevated temperatures year round peaking in the hot season at an average of over 30°C. The climate is dominated by southeastern trade winds originating in the Indian Ocean anticyclone, a centre of high atmospheric pressure that seasonally changes its position over the ocean. Madagascar has two seasons, a hot, rainy season from December to March/April, and a cooler dry season from April/May to November. Total rainfall is sparse within the property area, with yearly precipitation ranging from 30 cm to 50 cm. The rainy season causes difficulty in travels off the main highway.
5.4
Local Resources and Infrastructure
The village of Fotadrevo is located within the southwestern edge of the property area. The village has been a labour source during the exploration programs carried on the property, and would likely provide a workforce during any future exploration and development. A few basic goods are commercially available in the village; however, the main centre for support of exploration and development is the city of Toliara.
A cellular telephone tower is located in the village of Fotadrevo, which provides convenient coverage for much of the property.
No potable water is currently available within the project area. A water well of 123 mm in diameter has been drilled to a depth of 42 m within the camp compound. This well can provide the camp with non-potable water.
Two 40 kVA diesel-powered generators provide power to the camp facility.
5.5
Security
Madagascar is an island and as such, no border issues or conflicts are known that might affect operations, security, or title in the region. On 18 March 2009, the elected government
of Marc Ravalomanana of the TIKO party was ejected from office by a popular uprising supported by the Madagascar military. His government was replaced by an interim civilian government named the “High Authority for Transition” led by Andry Rajoelina. The authors are aware that initial plans for a presidential election are currently being formulated; however, a specific election date has not been set.
Security of personnel is a company policy directed by management. Considering that the area is predominantly rural, few police or other security patrols are common in the area. There is always a small possibility that local criminal activity might affect operations, and to mitigate this, the company employs the local military forces to accompany field parties away from secure areas. The Madagascar government provides a requested number of regular military troops, at minimum cost to Energizer, to ensure security on the property, on the work site, and for the company’s equipment.
TOC | 5-3 | |
GREEN GIANT PROJECT TECHNICAL REPORT UPDATE NI 43-101 | |
6
EXPLORATION HISTORY
In 1985, BRGM produced a country scale compilation of all exploration and mineral inventory data in their files in a three-volume set. Relatively little exploration and development work was completed in Madagascar after the BRGM work and therefore, the volumes are key to retracing historical and comprehensive work. Following independence in 1960, archival research did not reveal evidence of mineral exploration in modern times within the Green Giant region.
A series of excellent 1/100,000 scale geological maps (1952-53) are available for the region surrounding the property (Fotadrevo-Bekily, Ianapera, Sakamena-Sakoa). The property area is covered by 1/100,000 scale topographic map #H-60 Fotadrevo.
6.1
Property-Scale Exploration History
Prior to the exploration work completed by Energizer in 2007, there is no record of any previous mining or significant exploration activity within the Green Giant Project area. There is local evidence of minor artisanal works and of small exploratory pits for gems and gold made by the local population.
Energizer has retained Taiga Consultants Ltd. of Calgary (Taiga) since 2007, to manage exploration activities on the Green Giant Project. Table 6-1 shows a summary of the exploration activities on the Green Giant property.
Table 6-1:
Historical Activities
TOC | 6-1 | |
GREEN GIANT PROJECT TECHNICAL REPORT UPDATE NI 43-101 | |
7
GEOLOGICAL SETTING
7.1
Regional Geology
Madagascar can be described as formed by two geological entities, the Precambrian crystalline basement, and the much younger overlying Phanerozoic non-metamorphosed sedimentary formations. The central and eastern two-thirds of the island are mainly composed of Archean to Neoproterozoic-aged crystalline basement rocks, made up of metamorphic schist and gneiss intruded by granite and basic igneous rocks. The basement is ringed by a series of five sedimentary basins ranging in age from Permian to Quaternary. To the east, a narrow band of Cretaceous basalt and rhyolite also borders the basement, which is cut by large volcanic massifs of Jurassic basalt and rhyolite.
The geology of the basement of Madagascar is a complex mélange of intercontinental tectonic blocks made up of ancient poly-deformed high-grade metamorphic rocks and later igneous intrusions. The basement of north-central Madagascar is composed of two north-south trending Archean domains. In the northernmost part of the island, the Archean belts are overthrust by the east-west trending belt primarily composed of younger Neoproterozoic rocks metamorphosed up to granulite facies (high-grade) conditions during the Cambrian.
The tectonic and metallogenic framework of the basement has been subdivided (Besairie et al., 1964) into four blocks: the northern Bemarivo Block, the northeastern Antongil Block, the central Antananarivo Block, and the southern Bekily Block. The Green Giant project lies within the bounds of the Bekily Block (Figure 7-1). Later authors (Pitfield et al., 2006) divide the Precambrian basement of Madagascar in a somewhat different manner, with nine tectono-metamorphic units (Figure 7-2). In the case of the region around the Green Giant project both the tectonic block and the tectono-metamorphic unit cover nearly identical areas and therefore these divisions can be used interchangeably.
TOC | 7-1 | |
GREEN GIANT PROJECT TECHNICAL REPORT UPDATE NI 43-101 | |
Figure7-1:
Country Geology – Geological Blocks
![[technical024.jpg]](https://capedge.com/proxy/8-K/0001137171-10-000408/technical024.jpg)
TOC | 7-2 | |
GREEN GIANT PROJECT TECHNICAL REPORT UPDATE NI 43-101 | |
Figure 7-2:
Tectono-Metamorphic Units of the Precambrian Terrain of Madagascar
![[technical027.jpg]](https://capedge.com/proxy/8-K/0001137171-10-000408/technical027.jpg)
Note:
From Pitfield, 2006.
TOC | 7-3 | |
GREEN GIANT PROJECT TECHNICAL REPORT UPDATE NI 43-101 | |
From north to south, the blocks are described below:
·
The Bemarivo Block (Neoproterozoic-Mesoproterozoic) is considered a volcanic nappe sequence in the northern part of the country. This fold and thrust complex is composed of meta-sediments and calc-alkaline volcanic, granite, and gneiss that have collectively been thrust across north-central Madagascar during the Mesoproterozoic.
·
The Antongil Block (Middle to Late Archean) exposed along the northeast coast is a tectonic fragment derived from the breakup of the western Dharwar craton of southern India. It comprises a complex of foliated and unfoliated granite, tonalite orthogneiss (Paleoarchean protolith age 3,190 Ma), and variably migmatite gneisses with 100s metre-scale lenses of kyanite-grade metasedimentary rocks and sparse bodies of low-grade, ultramafic-intermediate rocks (greenstones). The undeformed granites yield ages in the range 2,540 to 2,510 Ma. Sahantaha shelf sediments of Neoproterozoic age with a Dharwar craton provenance were deposited on the NW passive margin of the Antongil basement.
·
The Antananarivo Block (NeoArchean to PaleoProterozoic) of central Madagascar consists of variably migmatitic paragneiss and granitoid orthogneiss with 2.75 to 2.5 Ga protoliths, intruded by voluminous magmatic rocks, formed within an active continental margin setting. The block was later affected by strain along the NNW-SSE Betsimisaraka Suture (BS) zone, a tens of kilometres-wide, high strain belt, comprising amphibolite-granulite facies metasediments associated with km-scale lensoid masses of mafic-ultramafic rocks. It marks the line of closure of the Paleo-Mozambique Ocean, separating Central Madagascar from the Antongil Block to the east as a result of westward subduction during the Neoproterozoic. The metasedimentary protoliths were sourced from the Dharwar craton and have depositional ages of 800 to 550 Ma. Eastward thrusting onto th e shelf-craton took place between 630 and 515 Ma (Cambrian age).
·
The Bekily Block, within which the Green Giant project lies, is situated in the southern part of the country and is thought to be of Proterozoic age. The block is dominated by high-grade metamorphism (Figure 7-1) and is bound by several prominent shear zones. Numerous syntectonic mafic and felsic intrusions occur in the region. The rocks contain frequent graphitic sequences. Two prominent N-S trending late-Neoproterozoic ductile shear zones, (the Ampanihy and Vorokafotra shears), bisect the region, with a third set of en-echelon shears forming part of the NW-striking, early Palaeozoic aged Ranotsara shear zone, which defines the northern edge of the Block. The Green Giant Property is situated within the NNE striking Ampanihy shear zone.
TOC | 7-4 | |
GREEN GIANT PROJECT TECHNICAL REPORT UPDATE NI 43-101 | |
The Tolagnaro-Ampanihy unit (Pitfield et al., 2006) is essentially a modern equivalent to the Bekily Block of Besairie (1964) in terms of area covered. To the west, it is defined as limited by the north-south trending Ampanihy shear zone and is bisected by other similar structures. The lithologies (gneiss, “leptynite” (translation: granulite), marble, and rare amphibolite) are interpreted to reflect a predominantly sedimentary origin with mainly acid volcanic intercalations. The age of the metamorphism and granites has been dated at 570 Ma in the eastern part of the unit. The Green Giant project appears to straddle the transition from high temperature-mid pressure rocks to the east, to high temperature-high pressure metamorphic facies rocks to the west. The Vohibory unit located in the south-western end of this granulite domain is lithologically characterized by the abundance of basic and ultrabasic rocks and by high temperature conditions. The metamorphism is dated at 650 to 630 Ma (Neoproterozoic).
The younger Phanerozoic sedimentary cover is largely restricted to the western side of the island where it covers much of the Ianapera property. The oldest Phanerozoic rocks are Permian-Triassic in age and are found in continental rift basins. Later, the Morondava Basin of Triassic to Miocene age formed along the continental margin, and deposited a coal-bearing transgressive-regressive sequence of arenaceous sediments. These later sediments correlate with the continental Karoo sequence of southern Africa, which was widespread in the former Gondwana Supercontinent.
7.2
Property Geology
The Green Giant project is underlain by supracrustal and plutonic rocks of Late Neoproterozoic age that are metamorphosed at upper amphibolite facies and deformed with upright NNE-trending structures. The supracrustal rocks involve migmatitic (± biotite, garnet) quartzofeldspathic gneiss, marble, chert, quartzite, and amphibolite gneiss. The metaplutonic rocks include migmatitic (± hornblende/diopside, biotite, garnet) feldspathic gneiss of monzodioritic to syenitic composition, biotite granodiorite, and leucogranite. An eastern region (occupying the southeastern part of the permit) contains a predominance of amphibolite gneiss that is regionally distinguishable from a western region (occupying most of the permit) containing a dominance of quartzofeldspathic gneiss with subordinate bands and discrete masses of amphibole-bearing gneis s. These appear to relate to the lithotectonic domains identified by Collins (2006) as the Androyen and Vohibory units, respectively, which are separated by a shear zone system.
Most rock types form relatively narrow, alternating, rectilinear bands, which trend NNE and dip steeply to the WNW, parallel to the regional gneissosity and foliation. Isoclinal folding of compositional/gneissic layering (S0-S1) observed in some supracrustal units (amphibolitic gneiss, quartzite) implies that the regional NNE-trending lithological structure and parallel foliation represents a composite S2 anisotropy. A mineral extension lineation (L2), defined mainly by elongate quartz, feldspar, and biotite, plunges shallowly to the SW. The regular straight-trending structure of the region (relative to adjacent, more irregularly structured regions) suggests an overall high strain state, and a limited number of kinematic indicator structures (rotated feldspar augen, lenticular gneissic “foliation fish”) imply ductile shearing involving dextral displacement across the regional foliation and oblique thrusting to the NE parallel to the mineral lineation.
TOC | 7-5 | |
GREEN GIANT PROJECT TECHNICAL REPORT UPDATE NI 43-101 | |
Several long, parallel, stratiform zones containing siliceous ferruginous gossan occur within a 2 km-wide corridor that passes through the eastern boundary of the Green Giant project, which coincides at least in part with the straight-trending shear zone system that separates the Androyen and Vohibory units of Collins (2006). These gossan occur as concordant to discordant masses within composite marble-chert bands, quartzite, quartzofeldspathic gneiss, and feldspathic gneiss.
The marble-hosted gossan zones are by far the most common, characterized by relatively narrow, white calcite marble bands intercalated with brown siliceous Fe-carbonate marble, associated with boudins of grey-white chert and brown Fe-carbonate chert, and with concordant to discordant masses of siliceous ferruginous gossan. The grey-white chert exhibits polyphase brecciation, involving an early breccia phase with a siliceous matrix, and a later breccia phase with siliceous Fe-carbonate and ferruginous gossan matrix. The discrete gossan zones, although narrow (several metres in width), may exceed 1 km in strike continuity.
The quartzite- and quartzofeldspathic gneiss-hosted gossan zones involve narrow, concordant ferruginous lenses or layers, as well as discordant ferruginous gossan breccia matrix and vein-like masses. Quartzofeldspathic gneiss-hosted gossan zones display a distinct alteration assemblage (± kaolinite, albite, hematite, Fe-carbonate, silica), which lacks evidence of the early (Fe-carbonate free) siliceous alteration observed in chert of the marble-hosted gossan zones.
Figure 7-3 shows the local geology identified over the Green Giant project area. Descriptions of individual lithologic units currently identified by Scherba & Aussant (2009) are included below.
7.2.1
Lithological Descriptions of Individual Rock Formations
Amphibolitic Gneiss [am]
Dark grey to black, mesocratic to melanocratic, medium- to coarse-grained, subequigranular to porphyroblastic amphibolitic gneiss and amphibolite. Amphibolitic gneiss forms one or more major continuous bands in the eastern part of the permit, intercalated with quartzofeldspathic gneiss and spatially associated with marble. In the central portion of the detailed map-area, amphibolitic gneiss forms local bands or lenses intercalated with quartzofeldspathic gneiss and marble.
TOC | 7-6 | |
GREEN GIANT PROJECT TECHNICAL REPORT UPDATE NI 43-101 | |
Figure 7-3:
Project Geology
![[technical029.jpg]](https://capedge.com/proxy/8-K/0001137171-10-000408/technical029.jpg)
TOC | 7-7 | |
GREEN GIANT PROJECT TECHNICAL REPORT UPDATE NI 43-101 | |
Quartzite [qzi]
White to greyish-white, weakly to moderately layered and foliated, coarse- to medium-grained quartzite. Brecciated quartzite with isoclinally folded layering is locally associated with dark brown ferruginous gossan. Unbrecciated quartzite very locally contains narrow, concordant, and discontinuous seams of gossan.
White Marble [mb]
White to greyish white, weakly to moderately layered and foliated, coarse- to medium-grained, subequigranular calcite marble. White marble is relatively homogeneous and contains ubiquitous small amounts (≤1%) of graphite and variable amounts of other accessory minerals (± biotite, diopside, feldspar, quartz, apatite, local asbestos, and serpentine). White marble forms long continuous bands that trend uniformly across the property, ranging between 5 m and 100 m wide.
Brown Marble [Femb]
Brown, weakly to moderately foliated, coarse- to medium-grained, subequigranular, siliceous Fe-carbonate marble. Brown marble is composed dominantly of Fe-carbonate (siderite-ankerite) with a fine, interlaced network of secondary silica and pervasively pitted interstices. The siliceous Fe-carbonate alteration producing brown marble appears to have developed through syntectonic to late syntectonic fluid dissolution processes largely parallel to layering and foliation and also occurring along fracture surfaces. Brown marble crosscuts white marble in places, following layering/foliation planes and transverse fracture planes, indicating a late-tectonic mobility of the altered rock.
Grey Marble [xmb]
Two varieties of fine-grained grey marble comprise a provisional map unit [xmb], namelyxenocrystic marble andintrusive calcareous rock, which are considered to reflect late syntectonic to post-tectonic carbonate mobility.
Grey-white Chert [ch]
Mottled greyish-white, massive to brecciated, hyalocrystalline graphite-bearing chert (or possibly siliceous rhyodacite). Grey-white chert displays evidence of polyphase brecciation, involving cm- to mm-scale, angular white siliceous fragments in a relatively early translucent grey siliceous (chalcedony) breccia matrix, and/or a later opaque brown ferruginous gossan breccia matrix.
Brown Fe-carbonate Chert [Fech]
Tawny (yellowish) brown to reddish brown and chocolate brown, massive, hyalocrystalline opaque, graphite-bearing Fe-carbonate chert, variable biotite, and/or specularite. Brown chert, like grey-white chert, contains a small amount (≤1%) of fine-grained disseminated graphite, as well as variably small amounts of fine-grained disseminated biotite and/or specularite. Brown chert represents a widespread Fe-carbonatized alteration facies of grey-white chert, and both occur within the same chert masses. Brown chert is intimately associated with brown marble and ferruginous gossan.
TOC | 7-8 | |
GREEN GIANT PROJECT TECHNICAL REPORT UPDATE NI 43-101 | |
Ferruginous Gossan [gos]
Dark purplish brown to black, dense, massive to brecciform and quasi-layered, aphanitic to fine-grained, siliceous ferruginous gossan. The gossan is variably highly siliceous to moderately siliceous and pitted, composed in part of Fe-carbonate (siderite-ankerite) and generally contains disseminated to clustered, fine-grained specularite, biotite, and/or graphite. Siliceous ferruginous gossan occurs as:
·
breccia matrix of late-stage chert breccia and quartzite breccia
·
concordant layers intercalated with chert and marble and discontinuous concordant seams in quartzite
·
discordant masses cutting regional structure in quartzofeldspathic gneiss and marble.
Siliceous ferruginous gossan is locally associated with cm-scale patchy masses of green, opaque calc-silicate or bright green amorphous and resinous calc-silicate mineral. In one area, cm- to dm-scale pods of massive to foliated (± biotite) calc-silicate rock occur enclosed within quartzofeldspathic gneiss along a horizon that extends 125 m parallel to a nearby contact with siliceous ferruginous gossan.
Quartzofeldspathic Gneiss [qfg]
Light grey to white, migmatitic, well foliated, and locally lineated, leucocratic to hololeucocratic, generally medium-grained (to fine- or coarse-grained), subequigranular to porphyroblastic, biotite-garnet quartzofeldspathic gneiss. The quartzofeldspathic gneiss comprises a mixture of fundamental constituent lithologies, dependent on the relative abundance or absence of biotite and garnet.
Granodiorite [grd]
Light grey, leucocratic, foliated, medium-grained, equigranular biotite granodiorite.
Feldspathic Gneiss [fdg]
Pinkish grey to pink, migmatitic, foliated, medium- to coarse-grained, leucocratic (± hornblende/diopside, biotite, garnet) feldspathic gneiss. The feldspathic gneiss is comprised of a mixture of quartz-poor constituent lithologies:
·
leucocratic biotite monzonitic to monzodioritic gneiss: “monzonitic gneiss”
·
hololeucocratic syenitic gneiss: “syenitic gneiss.”
Leucogranite [lgr]
Pale beige-white to light pink, foliated, medium- to very coarse-grained and commonly pegmatitic, hololeucocratic (± biotite, magnetite) granite. Massive pegmatitic leucogranite also forms late- or post-tectonic intrusive bodies and dykes, commonly displaying graphic quartz-K-feldspar intergrowth texture, and containing accessory biotite, magnetite, tourmaline, apatite, or locally garnet. The granitic pegmatite dykes generally trend WNW to NW.
TOC | 7-9 |
|
GREEN GIANT PROJECT TECHNICAL REPORT UPDATE NI 43-101 | |
8
DEPOSIT TYPES
The Green Giant project has the potential to host three different deposit types: 1) Algoma-type iron formation, 2) volcanogenic massive sulphides deposits (VMS), and 3) metamorphosed redox vanadium deposits.
The iron formation and VMS potential have been described in detail in a previous report (Scherba and Chisholm, 2008) and will not be discussed further here, as they are no longer considered material to the prospectivity of the property.
Vanadium is characterized as an element highly mobile in oxidizing acid-alkaline waters and immobile in reducing environments (Levinson, 1974) (see Figure 8-1).
Figure 8-1:
Relative Mobility of Elements in a Secondary Environment (Levinson, 1974)
Relative Mobility | Environmental Conditions | |||
| Oxidizing | Acid | Neutral to Alkaline | Reducing |
Very High | Cl, I, Bs S, B | Cl, I, Bs S, B | Cl, I, Bs S, B Mo, V, U, Sc, Re | Cl, I, Bs |
High | Mo, V, U, Sc, Re Ca, Na, Mg, F, Sr, Ra Zn | Mo, V, U, Sc, Re Ca, Na, Mg, F, Sr, Ra Zn Cu, Co, Ni, Hg, Ag, Au | Ca, Na, Mg, F, Sr, Ra | Ca, Na, Mg, F, Sr, Ra |
Medium | Cu, Co, Ni, Hg, Ag, Au As, Cd | As, Cd | As, Cd |
|
Low | Si, P, K Pb, Li, Rb, Ba, Be Bi, Sb, Ge, Cs, Ti | Si, P, K Pb, Li, Rb, Ba, Be Bi, Sb, Ge, Cs, Ti Fe, Mn | Si, P, K Pb, Li, Rb, Ba, Be Bi, Sb, Ge, Cs, Ti Fe, Mn | Si, P, K Fe, Mn |
Very Low to Immobile | Fe, Mn Al, Ti, Sn, Te, W Nb, Ta, Pt, Cr, Zr Th, Rare Earths | Al, Ti, Sn, Te, W Nb, Ta, Pt, Cr, Zr Th, Rare Earths | Al, Ti, Sn, Te, W Nb, Ta, Pt, Cr, Zr Th, Rare Earths Zn Cu, Co, Hi, Hg, Ag, Au | Al, Ti, Sn, Te, W Nb, Ta, Pt, Cr, Zr Th, Rare Earths S, B Mo, V, U, Se, Re Zn Cu, Co, Hi, Hg, Ag, Au As, Cd Pb, Li, Rb, Ba, Be Bi, Sb, Ge, Cs, Ti |
TOC | 8-1 |
|
GREEN GIANT PROJECT TECHNICAL REPORT UPDATE NI 43-101 | |
Two slightly different genetic models are presented below as possible deposit varieties. Currently the original source of the vanadium in the Green Giant deposit is uncertain. The mechanism for the formation of the vanadium mineralization is also somewhat enigmatic.
8.1
Metamorphosed Black Shale Deposit
The following is summarized from an internal memo (Barrie, 2009).
The Green Giant vanadium deposit may represent a form of a metamorphosed black shale vanadium deposit with similarities to the Mecca Quarry black shale in the central USA. The metallic suite of V-Mo-U-C is characteristic yet not unique to black shale deposits.
Initial vanadium enrichment of the sea floor sediment may have occurred in a euxenic marine environment similar to that of the present day Black Sea. Vanadium is adsorbed onto clays and settled to the organic-rich seafloor under anoxic conditions. Further vanadium enrichment occurred during burial and diagenesis, as basinal fluids under neutral to oxidized, low pH conditions transported vanadium, molybdenum, and uranium to the reduced, organic-rich sites where they precipitated.
The source of the vanadium, molybdenum, and uranium may have been volcanic rocks in the stratigraphy, and at least partly other black shales that had an initial seafloor metallic enrichment.
Vanadium initially bonds strongly in the organic material, but is progressively incorporated into clays and layered silicates with increasing pressure and temperature during burial, diagenesis, and metamorphism. The Green Giant project strata were subjected to amphibolite or higher metamorphic grade, given the presence of kyanite. At these metamorphic grades, all or nearly all of the organic material is converted to graphite, and the vanadium migrated from the carbon compounds into silicate phases (principally roscoelite (muscovite structure) and phlogopite), and oxide phases (principally titanite and rutile, at least where available).
8.2
Roll Front Deposit
Globally, primary vanadium mineralization is typically found in oxide-rich magmatic segregations within layered ultramafic intrusions, including those of anorthositic composition (Taner et al., 2000). This is currently the most important source of economic vanadium production. Prior to the early 1980s, however, the most prolific source of vanadium was as a byproduct of uranium mining in sedimentary or sandstone uranium deposits in western USA (Polyak, 2007).
TOC | 8-2 |
|
GREEN GIANT PROJECT TECHNICAL REPORT UPDATE NI 43-101 | |
In the classic roll-front model, mechanical breakdown associated with weathering of vanadium rich-host rock and subsequent dissolution of vanadium-bearing minerals releases the vanadium into the aqueous environment. The fluids are trapped as connate and general ground water, and contribute to gravity-driven, down-dip, basinal drainage along high porosity and permeable sandstone horizons within deltaic, continental, and marginal marine sedimentary sequences, leading to the transport and concentration of vanadium. The process is one of a continuous cycle of dissolution and transport, followed by fixation by reductants, followed by subsequent re-dissolution-transport-fixation as the basinal fluids migrate down-dip. As the cycle proceeds, the concentrations of vanadium and related mobile elements increases as vanadium-bearing minerals resident in the porous u nit dissolve and liberate additional metals to add to the mobile element budget. Vanadium is typically precipitated when it encounters a strongly reducing environment surrounding organic material, such as detrital organic trash or humates typically found in epicontinental sedimentary environments.
It is known that the classic roll-front model can be modified by large fault structures such as in the Niger uranium camp which is characterized by the Arlit-InAzawa and Madaouela faults found in the Tin Mersoi basin to form Tectonic-Lithologic type deposits of significant size (Cazoulat, 1985; Pagel, et al., 2005). In this case-type, the resulting uranium-zirconium-molybdenum-vanadium deposits take the form of stacked amorphous-shaped lensoid deposits of very large size. The interaction of migrating fluids within the major Arlit-InAzawa fault structure resulted in the creation of standing solution fronts which have allowed super giant deposits (>100,000 tonnes U) to form which are somewhat different than the more modestly sized classical western states-Colorado Plateau type of roll-front. Similar type uranium deposits are also found within south-centr al Kazakhstan (Jaireth, 2008). Pagel et al. (2005) postulates that the depositional system also involved a contribution of hot deep fluids circulating upwards along structures to meet descending ground water.
TOC | 8-3 |
|
GREEN GIANT PROJECT TECHNICAL REPORT UPDATE NI 43-101 | |
9
MINERALIZATION
Vanadium mineralization was recognized visually in the field within diamond drill core by the presence of some bright green minerals as well as the presence of distinctive bronzy coloured mica. Later the minerals were identified as vanadiferous with the aid of Innov-X-Systems’ X-50 mobile X-Ray Fluorescence (XRF) tabletop analyzer. It is to be noted that the use of the XRF machine was used for mineral identification and provided Energizer with an indication of the potential analytical results. At no time have XRF results been used in the reporting of results.
Limited petrographic and microprobe analysis by R.L. Barnett Geological Consulting Inc. (Barnett, 2009) and Mintex (2009) indicate that the vanadium occurs in several mineral phases including a high V content roscoelite, a low V content roscoelite, a V-bearing clay, V-rutile, a FE-V-Ti oxide, a V-Ti oxide, and two types of Fe-V oxides. With the exception of the roscoelite, the mineralization is not discernible to the naked eye and requires the use of analytical methods to identify. The presence of other redox minerals such as uranium bearing minerals assists with identifying the vanadium-rich horizons.
The mineralization occurs both in the upper oxidized horizon and lower down in the primary rock. Both the oxide and primary horizons contain substantial amounts of quartz and graphite, yet are distinct metallurgical units likely requiring different processing methods.
There has not been enough work conducted on the vanadium-bearing zones to determine if the zones have similar mineralogical characteristics or are distinct zones on the same horizon.
TOC | 9-1 |
|
GREEN GIANT PROJECT TECHNICAL REPORT UPDATE NI 43-101 | |
10
EXPLORATION
The original focus of the exploration on the Green Giant project was for VMS type base metals similar to the Besakoa property located to the north. To date, no significant occurrences of copper or zinc have been discovered within the project boundaries.
Following the discovery of vanadium using the portable XRF machine on diamond drill core, the exploration strategy changed focus to pursue the vanadium-rich results. This included reviewing previous results and interpretations of the past exploration programs.
10.1
Diamond Drill Results
The analytical results of the 2008 diamond drill program with a refocused priority on vanadium mineralization were returned in the spring of 2009. A complete description of the 2008 diamond drill program can be found in Section 11 along with a description of the most recent 2009 drill program.
10.2
Soil XRF
To follow up on the vanadium mineralization identified in drill core, an extensive XRF analysis of soils was undertaken in May 2009, on lines 200 m apart to cover a strike length of over 18 km. Figure 10‐1 is LandSat imagery of the property with the vanadium zones identified. Figure 10‐2 displays the results of the XRF survey and clearly defines significant zones of anomalous vanadium along an interpreted stratigraphic horizon. The gap in the soil anomaly through the middle portion of the property is due to a thick cover of laterite material that results in a masking effect, thus providing a poorly defined vanadium trend.
10.3
Radiometrics
In May 2009, ground scintillometer surveys were completed over the +18 km strike length of the interpreted vanadium mineralized trend in conjunction with the XRF analysis of soils on a regular 200 m line spacing basis. Figure 10-3 outlines the results of this survey work. It can be clearly seen that there is minor radioactivity directly associated with the XRF analysis of soils for vanadium. Obviously, the laterite-covered zone located in the west central part of the property does not exhibit a radiometric signature of any significance.
TOC | 10-1 |
|
GREEN GIANT PROJECT TECHNICAL REPORT UPDATE NI 43-101 | |
Figure 10-1:
Vanadium Targets
![[technical033.jpg]](https://capedge.com/proxy/8-K/0001137171-10-000408/technical033.jpg)
TOC | 10-2 |
|
GREEN GIANT PROJECT TECHNICAL REPORT UPDATE NI 43-101 | |
Figure 10-2:
Soil XRF Survey

TOC | 10-3 |
|
GREEN GIANT PROJECT TECHNICAL REPORT UPDATE NI 43-101 | |
Figure 10-3:
Radiometric Survey
![[technical035.jpg]](https://capedge.com/proxy/8-K/0001137171-10-000408/technical035.jpg)
TOC | 10-4 |
|
GREEN GIANT PROJECT TECHNICAL REPORT UPDATE NI 43-101 | |
10.4
Trenching Program
In early 2009, it was felt that the vanadiferous trends were insufficiently understood in terms of their areal extent, and because of the lack of sampling in the weathered zone by the 2008 drilling, little was known about the distribution of vanadium near surface.
As of December 2009, 140 trenches with a combined length of 17,105 m have been completed, as shown in Figure 10-4. Trenches were completed in the Jaky, Mainty, and Manga Zones. The layout of the trenches in the Mainty and Jaky Zones was designed to test for extensions of the vanadium mineralization found in the 2008 drill holes into these areas. Trenches in the Manga Zone were located to test the regional structure, which joins the Mainty and Jaky Zones.
Trenching was completed by two 28-ton Komatsu backhoes, followed by a crew hand-shovelling excess material out of the trench. This was in turn followed by a crew that swept the trench floor clean of the remaining fines. The trench depth varies from 0.5 m to 4 m depending on the thickness of the overburden material.
XRF instruments used during the soil survey are both Niton XL3t 500 XRF Analyzers manufactured by Thermo Scientific. Serial numbers of the units are 31899 and 31980.
Trenches were marked out using wooden pegs at 2 m intervals using a tape measure. The zero marker and end of trench marker were picked up using a hand held GPS. The trenches are assumed straight and are oriented in a general east-west fashion to crosscut stratigraphy.
XRF readings were conducted at a maximum interval of 2 m; unless the instrument reported anomalous high values, in which case the reading intervals are shortened. This was done to ensure that the highly anomalous value reported is accurate. Upon completion of the reading, the corresponding reading number was recorded internally within the unit and manually recorded on paper next to the appropriate trench station meterage.
Two-metre long continuous chip samples were then collected along the trench floor consisting of about 3 kg to 4 kg of material per sample. The samples are collected in numbered plastic bags with the sample location noted in the assay tag book. The trench samples are transported at the end of each day to camp and stored in a locked building. When sufficient sample material has been collected, the samples are trucked or flown to Genalysis in Antananarivo accompanied by an Energizer employee. Genalysis prepares the samples in Antananarivo and the pulps are then shipped to Genalysis Laboratory Services in Perth, Australia for final fusion analysis
TOC | 10-5 |
|
GREEN GIANT PROJECT TECHNICAL REPORT UPDATE NI 43-101 | |
Figure 11-1:
Trench Locations
![[technical036.jpg]](https://capedge.com/proxy/8-K/0001137171-10-000408/technical036.jpg)
TOC | 10-6 |
|
GREEN GIANT PROJECT TECHNICAL REPORT UPDATE NI 43-101 | |
In the case of the Jaky Zone, the anomalous vanadium values, which define the zone extend for over 1.1 km, and for the Mainty Zone for at least 1 km. The width of the zone defined by the assays is also in excess of that seen in the subsurface. Portions of the Jaky Zone are over 200 m wide, and for the Mainty Zone over 100 m wide.
Table 10-1 shows a summary of the significant composited vanadium mineralization encountered in the 2009 trenching program. The composites are based on a minimum 4 m width at a 0.3% V2O5 cutoff. A maximum of 4 m of continuous internal waste could be included within a composite.
Table 10-1:
Summary of the Trench Assay Data
Trench Name | From (m) | To (m) | Interval (m) | V2O5 (%) | Zone |
TR-09-001 | 0 | 58 | 58 | 0.54 | Jaky |
TR-09-001 | 68 | 90 | 22 | 0.73 | Jaky |
TR-09-001 | 102 | 116 | 14 | 0.39 | Jaky |
TR-09-002 | 54 | 64 | 10 | 0.38 | Jaky |
TR-09-002 | 76 | 92 | 16 | 0.59 | Jaky |
TR-09-002 | 102 | 172 | 70 | 0.66 | Jaky |
TR-09-002 | 180 | 244 | 64 | 0.63 | Jaky |
TR-09-003 | 58 | 64 | 6 | 0.32 | Jaky |
TR-09-003 | 72 | 78 | 6 | 0.31 | Jaky |
TR-09-003 | 86 | 154 | 68 | 0.79 | Jaky |
TR-09-003 | 186 | 190 | 4 | 0.31 | Jaky |
TR-09-003 | 206 | 242 | 36 | 0.44 | Jaky |
TR-09-004 | 82 | 100 | 18 | 0.35 | Jaky |
TR-09-004 | 112 | 164 | 52 | 0.75 | Jaky |
TR-09-004 | 184 | 198 | 14 | 0.42 | Jaky |
TR-09-006 | 28 | 48 | 20 | 0.42 | Jaky |
TR-09-006 | 54 | 68 | 14 | 0.30 | Jaky |
TR-09-006 | 116 | 122 | 6 | 0.41 | Jaky |
TR-09-007 EXT | -8 | -4 | 4 | 0.31 | Jaky |
TR-09-007 | 8 | 18 | 10 | 0.48 | Jaky |
TR-09-007 | 58 | 62 | 4 | 0.5 | Jaky |
TR-09-007 | 78 | 88 | 10 | 0.36 | Jaky |
TR-09-007 | 102 | 106 | 4 | 0.55 | Jaky |
TOC | 10-7 |
|
GREEN GIANT PROJECT TECHNICAL REPORT UPDATE NI 43-101 | |
TR-09-008 | 40 | 72 | 32 | 0.52 | Jaky |
TR-09-008 | 78 | 86 | 8 | 0.42 | Jaky |
TR-09-008 | 100 | 106 | 6 | 0.35 | Jaky |
TR-09-008 | 174 | 178 | 4 | 0.35 | Jaky |
TR-09-009 | 24 | 30 | 6 | 0.86 | Mainty |
TR-09-010 | 106 | 130 | 24 | 0.32 | Mainty |
TR-09-011 | 0 | 30 | 30 | 0.36 | Jaky |
TR-09-012 | 4 | 6 | 30 | 0.41 | Jaky |
TR-09-013 | 82 | 96 | 14 | 0.37 | Jaky |
TR-09-013 | 118 | 128 | 10 | 0.32 | Jaky |
TR-09-014 EXT | -14 | 6 | 20 | 0.56 | Manga |
TR-09-014 | 12 | 16 | 4 | 0.41 | Manga |
TR-09-014 | 26 | 32 | 6 | 0.41 | Manga |
TR-09-015 | 52 | 62 | 10 | 0.41 | Manga |
TR-09-016 | 44 | 56 | 12 | 0.45 | Manga |
TR-09-016 | 68 | 76 | 8 | 0.32 | Manga |
TR-09-016 | 84 | 88 | 4 | 0.36 | Manga |
TR-09-017 | 116 | 120 | 4 | 0.33 | Manga |
TR-09-017 | 134 | 140 | 6 | 0.41 | Manga |
TR-09-017 | 146 | 152 | 6 | 0.47 | Manga |
TR-09-018 | 22 | 30 | 8 | 0.49 | Mainty |
TR-09-018 | 86 | 100 | 14 | 0.92 | Mainty |
TR-09-018 | 116 | 122 | 6 | 0.32 | Mainty |
TR-09-019 | 150 | 194 | 44 | 0.47 | Mainty |
TR-09-019 | 200 | 204 | 4 | 1.32 | Mainty |
TR-09-020 | 24 | 30 | 6 | 0.56 | Mainty |
TR-09-020 | 50 | 56 | 6 | 0.44 | Mainty |
TR-09-020 | 62 | 76 | 14 | 0.47 | Mainty |
TR-09-020 | 96 | 104 | 8 | 0.46 | Mainty |
TR-09-021 | 32 | 38 | 6 | 0.42 | Mainty |
TR-09-021 | 44 | 82 | 38 | 0.37 | Mainty |
TR-09-022 | 26 | 100 | 74 | 0.38 | Mainty |
TR-09-023 | 24 | 28 | 4 | 0.31 | Mainty |
TR-09-023 | 38 | 72 | 34 | 0.37 | Mainty |
TR-09-025 | 70 | 74 | 4 | 0.33 | Fondrana |
TR-09-026 | 132 | 126 | 6 | 0.38 | Fondrana |
TR-09-027 | 8 | 16 | 8 | 0.40 | Manga |
TR-09-028 | 40 | 48 | 8 | 0.35 | Manga |
TR-09-028 | 78 | 104 | 26 | 0.48 | Manga |
TR-09-029 | 56 | 88 | 32 | 0.31 | Mainty |
TR-09-029 | 96 | 102 | 6 | 0.34 | Mainty |
TR-09-030 | 74 | 92 | 18 | 0.68 | Mainty |
TR-09-031 | 12 | 36 | 24 | 0.43 | Manga |
TR-09-032 | 54 | 100 | 46 | 0.46 | Manga |
TR-09-033 | 18 | 62 | 44 | 0.44 | Manga |
TR-09-034 | 42 | 84 | 42 | 0.45 | Manga |
TOC | 10-8 |
|
GREEN GIANT PROJECT TECHNICAL REPORT UPDATE NI 43-101 | |
TR-09-035 | 20 | 64 | 44 | 0.43 | Manga |
TR-09-036 | 8 | 52 | 44 | 0.47 | Manga |
TR-09-037 | 8 | 62 | 53 | 0.5 | Manga |
TR-09-038 | 40 | 48 | 8 | 0.37 | Jaky |
TR-09-038 | 64 | 86 | 22 | 0.56 | Jaky |
TR-09-038 | 96 | 130 | 34 | 0.64 | Jaky |
TR-09-038 | 140 | 212 | 72 | 0.65 | Jaky |
TR-09-039 | 38 | 92 | 54 | 0.45 | Jaky |
TR-09-039 | 114 | 192 | 78 | 0.74 | Jaky |
TR-09-039 | 200 | 220 | 20 | 0.53 | Jaky |
TR-09-039 | 234 | 242 | 8 | 0.3 | Jaky |
TR-09-040 | 8 | 70 | 62 | 0.57 | Manga |
TR-09-040 | 98 | 104 | 6 | 0.31 | Manga |
TR-09-041 | 20 | 24 | 4 | 0.37 | Manga |
TR-09-041 | 32 | 162 | 130 | 0.56 | Manga |
TR-09-042 | 62 | 100 | 38 | 0.39 | Manga |
TR-09-042 | 106 | 168 | 62 | 0.52 | Manga |
TR-09-042 | 194 | 202 | 8 | 0.35 | Manga |
TR-09-043 | 98 | 130 | 32 | 0.53 | Manga |
TR-09-043 | 136 | 150 | 14 | 0.31 | Manga |
TR-09-043 | 168 | 172 | 4 | 0.38 | Manga |
TR-09-044 | 38 | 48 | 10 | 0.36 | Manga |
TR-09-044 | 56 | 84 | 28 | 0.60 | Manga |
TR-09-045 EXT | -50 | -24 | 28 | 0.40 | Manga |
TR-09-045 | 4 | 8 | 4 | 0.36 | Manga |
TR-09-045 | 22 | 28 | 6 | 0.48 | Manga |
TR-09-045 | 40 | 54 | 14 | 0.33 | Manga |
TR-09-049 | 28 | 62 | 34 | 0.47 | Manga |
TR-09-050 | 16 | 40 | 24 | 0.41 | Manga |
TR-09-050 | 46 | 78 | 32 | 0.58 | Manga |
TR-09-051 | -26 | 26 | 52 | 0.41 | Manga |
TR-09-052 | -6 | 42 | 48 | 0.49 | Manga |
TR-09-053 | 12 | 16 | 4 | 0.42 | Manga |
TR-09-053 | 22 | 28 | 6 | 0.49 | Manga |
TR-09-053 | 34 | 54 | 20 | 0.35 | Manga |
TR-09-054 | 46 | 52 | 6 | 0.45 | Jaky |
TR-09-054 | 70 | 134 | 64 | 0.68 | Jaky |
TR-09-054 | 178 | 186 | 8 | 0.33 | Jaky |
TR-09-054 | 208 | 216 | 8 | 0.44 | Jaky |
TR-09-055 | 0 | 10 | 10 | 0.38 | Jaky |
TR-09-055 | 36 | 64 | 28 | 0.49 | Jaky |
TR-09-055 | 70 | 80 | 10 | 0.40 | Jaky |
TOC | 10-9 |
|
GREEN GIANT PROJECT TECHNICAL REPORT UPDATE NI 43-101 | |
11
DIAMOND DRILLING
Thirty-one diamond drill holes, TH-08-01 to TH-08-31, comprising 4,073.3 m of diamond drilling were completed from 7 October to 20 November 2008 on the Green Giant Property. The objective of the drill program was to investigate several geochemical, geophysical, and/or geological targets defined during the course of exploration programs completed on the property.
Between October and December 2009, Energizer focused their attention at delineating vanadium resources on two of the most promising target evaluated during the 2008 drill campaign. Thirty drill holes were completed on the Jaky deposit totalling 4,510 m, of these, three were large diameter core used for metallurgical samples. On the Manga deposit, 24 holes were drilled totalling 4,422 m. Selected drill holes were oriented with point load test and orientation measurements were recorded. The 2009 drill holes collar locations are shown in Figure 11-1 for Jaky and in Figure 11-2 for Manga.
11.1
Energizer 2008 – 2009 Diamond Drill Program
11.1.1
Diamond Drill Contractor
The diamond drilling was carried out using a CDI 500 skid-mounted wire-line drill owned and operated by Cartwright Drilling, a full service contractor out of Goose Bay, Labrador, Canada. Drilling was completed using thin wall BTW core (~42 mm diameter).
Drill moves were completed using rental water trucks servicing the drill. Drill pads and access road construction was prepared using a rental grader, and drill sumps were dug by manual labourers. While drilling, a funnel and hose line returned overflow fluids to the mud tank. This measure was taken to conserve drill fluids and to prevent site contamination by drilling additives or metals liberated by the drilling. Water for the drill program was trucked from small pools located sporadically along the many drainages on the property, and stored at the drill site in a 10,000 L wheeled tank.
In 2009, the diamond drilling was carried out using a Longyear 44 skid-mounted wire-line rig, and a Lonygear LF-90 skid-mounted wire-line rig, owned and operated by Boart Longyear, a full service contractor with worldwide locations. Most of the diamond drilling completed at the Jaky target was carried out with HQ diameter core due to the fractured nature of the rock in this area. At the Manga target, the initial 70 m to 100 m of drilling was completed with HQ core (63.5 mm diameter). Once reasonably competent rock was encountered a reduction to NQ sized core (47.6 mm diameter) was undertaken.
TOC | 11-1 |
|
GREEN GIANT PROJECT TECHNICAL REPORT UPDATE NI 43-101 | |
Figure 11-1:
2009 Drill Holes Collar Location for Jaky
![[technical040.jpg]](https://capedge.com/proxy/8-K/0001137171-10-000408/technical040.jpg)
TOC | 11-2 |
|
GREEN GIANT PROJECT TECHNICAL REPORT UPDATE NI 43-101 | |
Figure 11-2:
2009 Drill Holes Collar Locations for Manga
![[technical041.jpg]](https://capedge.com/proxy/8-K/0001137171-10-000408/technical041.jpg)
TOC | 11-3 |
|
GREEN GIANT PROJECT TECHNICAL REPORT UPDATE NI 43-101 | |
The drill moves were completed using Longyear’s John Deere skidder equipped with a blade and winch. Drill pads and sumps were prepared using a rental CAT 420D backhoe/loader. While drilling all fluids were pumped directly from the sumps, with all overflow fluids directed back to the sumps. These measures were taken in order to conserve drill fluids and to prevent site contamination by drill additives or metals liberated by the drilling. Water for the drill program was trucked to the drill from ponds sporadically located along the main drainages crossing the property, and stored at the drill site until required.
11.1.2
Core Handling Procedures
The core is delivered from the drill site to the camp by pickup truck under the supervision of the drilling company or an official designated by Energizer at the end of every 12-hour shift. Drill core is stored in galvanized-steel core boxes 1 m in length holding 6 m BTW core (2008) and 5 m HQ core or 7 m NQ core (2009). The core boxes are laid out on the benches in order. A general review of the core takes place, looking at the overall condition and recovery of the core. Errors in run markers are noted. Technicians wash mud and debris from the core with the use of hand pump sprayers and brushes. All drill core is stored at Energizer’s Fotadrevo campsite within a 20 m x 25 m fenced enclosure.
11.1.3
Core Logging
Energizer is using a logging system developed by Taiga. At this early stage of exploration, there is no restricted list of rock units for core logging as the stratigraphy is still being developed. Taiga contracted a geologist graduated from an accredited university who logged the drill core.
Core logging is recorded onto paper logs with subsequent transfer to computer. No hand-written logs were available for recent drilling. Core logs contain observations of geology, structure, mineralogy, alteration, and sample interval descriptions.
The drill program manager checked the logs and limited programming within the computer file to avoid overlapping intervals or interval gaps.
11.1.4
Core Recovery
Trained technicians are responsible for collecting geotechnical data such as rock quality description (RQD) and core recovery. The data is recorded onto paper forms with entry into computer logs at the end of the day.
TOC | 11-4 |
|
GREEN GIANT PROJECT TECHNICAL REPORT UPDATE NI 43-101 | |
Core recovery from the 2008 drill program logs indicate that recovery was poor to fair in the weathered rock zones, and fair to good in the fresh rock recovery. PEG personnel on-site visually confirmed this observation.
PEG has confirmed that recovery has improved during the fall 2009 drill program, which took place during the site visit. This is likely due to the use of a larger core diameter, more efficient use of drilling mud, and possibly due to a change in the drill contractor.
11.1.5
Core Photography
The core was photographed in groups of two boxes and then forwarded for cutting. Core was typically photographed wet.
11.1.6
Collar Survey
Hole collar locations were initially established in the field using global positioning system (GPS) instruments. Collar locations were re-measured using a hand-held GPS following hole completion. Nominal accuracy of these positions, as stated by the manufacturer of the GPS units, is ±3 m.
All drill collar sites have been reclaimed and collar markings were wither not left in the ground or have been removed by the local population. It was recommended for Energizer to plug the drill holes approximately one metre down the hole, fill the hole with cement up to surface level, then insert a one-metre piece of rebar into the cement. This makes the removal of the stake difficult and allows the collar to be located with the use of a metal detector if required. Upon completion of each drill hole, Energizer now pours a concrete marker to mark the location of the hole.
11.1.7
Down Hole Surveys
In 2008, there were no down hole azimuths or declinations recorded for any of the drill holes. In 2009, Boart Longyear used single shot Reflex equipment on all diamond drill holes to measure down hole azimuths and inclinations. Measurements were taken after the surface casing (generally 10 m to 15 m depth) and every 50 m thereafter unless hole conditions dictated otherwise.
11.1.8
Geotechnical Logging
Geotechnical logging consisted of RQD measurements and core recovery calculations. The data was collected on paper forms and later transcribed into an Excel spreadsheet.
TOC | 11-5 |
|
GREEN GIANT PROJECT TECHNICAL REPORT UPDATE NI 43-101 | |
RQD measurements were calculated using a minimum 10 cm core length according to the following formula.
![]()
Due to the poor core recoveries, the rock strength and weathered properties were not considered in the calculation.
Core recovery was a function of actual measured core in the run divided by the expected core length.
11.1.9
Diamond Drill Results
During the course of drilling VMS targets, vanadium mineralization was identified with the aid of Innov-X-Systems’ X-50 mobile XRF analyzer. Subsequently, 12 diamond drill holes designed to test vanadiferous mineralization were drilled (TH-08-11 through 14, TH-08-24 through 29, and TH-08-31).
Five vanadium-bearing trends were identified during the course of the exploration program. Figure 11-3 shows these areas, which have been given Malagasy names and are listed below with the meaning of their names in parentheses:
·
Mainty(black) – Named after its preponderance of sooty black gossan. Tested with holes TH-08-11, 12, 13, and 14
·
Manga(blue) – Tested with one hole (Th-08-08), but is believed to be continuous with the Mainty and Jaky target areas
·
Jaky(red) – Named after the red laterite on its northern boundary. Tested with holes TH-08-01, 02, 24, 25, 26, 27, 28, 29, and 31
·
Fondrana(yellow) – Tested with one hole (TH-08-10)
·
Maitso (green) – Named after the mysterious emerald green mineral that initiated vanadium exploration efforts. Tested with holes TH-08-5, 6, 7, and 9.
In addition to the five areas listed above, trace levels of vanadium were detected via XRF analysis in the remaining drill holes, over four additional areas not related to radiometric trends. These areas are:
·
Whaleback – Named after the resemblance of the resistant brecciated chert to the back of a whale. Tested with hole TH-08-18
·
Soap – Named after the acidified rock encountered in core. Tested with holes TH-08-20, 21, and 22
TOC | 11-6 |
|
GREEN GIANT PROJECT TECHNICAL REPORT UPDATE NI 43-101 | |
·
Baobab – Named after the baobab trees found in the area. Tested with holes TH-08-15, 16, and 18
·
Ironhat – Named after the ‘Iron Hat’ gossan that was drill tested with hole TH-08-19.
Figure 11-3:
Vanadium Bearing Trend Location
![[technical044.jpg]](https://capedge.com/proxy/8-K/0001137171-10-000408/technical044.jpg)
TOC | 11-7 |
|
GREEN GIANT PROJECT TECHNICAL REPORT UPDATE NI 43-101 | |
Drill core sampling returned significant vanadium mineralization from the Mainty and Jaky target areas. The elevated vanadium implied in the other areas was not reproduced.
The Jaky vanadium enriched target area has been investigated by nine diamond drill holes in 2008 (TH-08-01, TH-08-02, TH-08-24 through -29, and TH-08-31) and has been traced over a strike length of 1,800 m. The southern portion of the target area has been drill tested by several ~300 m spaced drill holes. Two incomplete sections (2 holes per section line) were drilled across the southern part of the target. These early sections indicate that there may be at least two mineralized zones.
Results from the 2009 program on the Jaky deposit indicated an increase southward of the vanadium mineralization both in strength and in depth with a possible southward plunge. The only mapable units on the sections are the calcareous gneiss and the garnetiferous gneiss intersected in the footwall by the drill holes. The mineralization intersected at Jaky appears strataform, dipping shallowly (35 to 40 degrees) to the west, consisting of at least two parallel-mineralized zones, the grade of vanadium quite variable. The mineralized zone is bounded by a garnetiferous gneiss along the footwall, and a narrow coarsely crystalline marble unit along the hanging wall, striking 10 degrees.
The Jaky mineralized zone extend southward onto the neighbouring property and has been closed off to the north by the current drilling program. There is no further drilling recommended.
The second target area, which returned significant vanadium mineralization (Mainty), is located 16 km north of the northernmost drill hole drilled on the Jaky target. This area was tested by four diamond drill holes (TH-08-11 through -14) over a strike length of 750 m. Additional diamond drilling is required to more adequately test this target area. No further drilling was conducted in 2009 on this target.
The Manga vanadium target area is located between the Jaky and Mainty occurrences, and should be drill tested, as similar geophysical and geochemical signatures were detected in this area. One diamond drill hole targeting possible VMS mineralization was completed near this prospect; however, it was collared too far to the west to intersect the possible trend of vanadium mineralization.
The 2009 drill program indicated that the Manga mineralization appears to be a large funnel shaped boudin dipping at 60 to 65 degrees west, plunging to the north, extending to a depth of at least 175 m. The mineralized body has a central high-grade core (>0.8% V2O5) surrounded by an envelope of lower grade material. The zone is open along strike north and south and at depth.
Additional drilling along 200 m spaced section lines, coincident with trench locations, along strike both north and south of the current drilled area should be completed with the possibility of extending the mineralization over a known strike length of 3 km.
TOC | 11-8 |
|
GREEN GIANT PROJECT TECHNICAL REPORT UPDATE NI 43-101 | |
12
SAMPLING METHOD AND APPROACH
12.1
X-Ray Fluorescence Analysis
The XRF method is a well-known standard laboratory analysis procedure with a long history in mineral exploration. The use of portable XRF units, however, is much more recent. Originally, the units were developed for use in the steel industry to analyze for product consistency, and to test for unknown metals in the scrap business. Only recently has the mineral industry employed this technology on a wide scale. Generally, the units are well suited for material where the elements to be measured are present in quantities of at least 100s of PPM, and preferably in the percent levels. Care must be taken to calibrate machines often and to ensure that they are in good working order. The machines cannot measure all elements, and have particular difficulty in measuring light elements. Because the machines are measuring spectra an d there is spectra overlap between certain elements, it can sometimes be difficult to differentiate a response between adjacent elements on the elemental periodic table, which have spectra overlap. Energizer employs reference standards supplied by the XRF manufacturers and calibration according to Energizer’s own in-house standards. XRF units are a valuable tool for mineral exploration; however, they do not duplicate the sample and laboratory analysis procedure, and so are not a replacement for standard industry sampling and analysis procedures.
12.2
Standard Sampling
Energizer employs standard geochemical and channel-sampling procedures and does not process its own samples.
12.2.1
Trench Sampling
Continuous two-metre chip samples approximately 4 cm wide were taken along the northern edge of the trench floor. The following procedural steps were taken during the sampling process:
·
Plastic sample bags are sequentially numbered with a unique series from pre-printed sample books. The QA/QC sample numbers are flagged at this point for later insertion.
·
The trench floor is swept clean with hand brooms to ensure there is no contamination from rubble or fines.
·
Two technicians use hammers and moils (chisels) to gently dislodge the weathered rock along the channel profile.
TOC | 12-1 |
|
GREEN GIANT PROJECT TECHNICAL REPORT UPDATE NI 43-101 | |
·
A third technician follows behind to collect the sample material, first verifying the sample tag is in the bag, then matching the sample bag number and the sample book interval.
·
The sample bag is sealed with a zip tie with the sample tag inside the bag.
·
All samples are brought back to the camp at night for storage in a secure facility until shipment.
12.3
Diamond Drill Sampling
PEG did not observe the 2008 sampling program. The methodology was determined by core and log observation as well as discussions with the geologist on site. At the time the site visit was conducted, the 2009 drilling program was just started.
The following procedure was used for the diamond-drill core sampling:
·
Sample intervals were set at 10 ft (run length), at times shortened to 5 ft sample intervals.
·
Sampling did not respect lithological boundaries or contacts.
·
Sample intervals were recorded in the drill log and in pre-printed sample books. The QA/QC samples numbers were flagged at this point for later insertion.
·
Plastic sample bags were numbered sequentially with the appropriate sample number
·
Core was cut by a technician using a clean water spray table rock saw. No preferred orientation was indicated to the technician.
·
Both halves of the sawn core were placed back in the box.
·
The geologist who logged the core verified the sample tag with the sample book and placed half of the cut core into the sample bag.
·
The sample bag was sealed with a zip tie with the sample tag inside the bag.
·
All the samples were stored in a secure facility until shipment.
TOC | 12-2 |
|
GREEN GIANT PROJECT TECHNICAL REPORT UPDATE NI 43-101 | |
13
SAMPLE PREPARATION, ANALYSIS, AND SECURITY
All of the stream sediment, soil, and rock samples collected in 2007 and 2008 were analyzed by ALS Chemex in Gauteng, a suburb of Johannesburg, South Africa, and later during the program, the samples were analyzed by ALS Chemex in Perth, Australia or Vancouver. All ALS Chemex facilities are ISO 9001:2000 certified.
The analytical methods used in 2008 were fire assay with atomic absorption or gravimetric finish used for gold and silver. Induced Coupled Plasma (ICP) was used for silver trace values. The analytical methods used for base metals (Cu, Pb, Zn) were aqua-regia digestion and either atomic absorption finish or ICP for trace level values. The ICP analysis included: As, B, Ba, Be, Bi, Ca, Cd, Co, Cr, Cu, Fe, Ga, Hg, K, La, Mg, Mn, Mo, Na, Ni, P, S, Sb, Sc, Sn, Ti, Tl, U, V, W, and Zn. The results were posted to a secure website as CSV files and downloaded by Energizer personnel utilizing a secure client key number obtained directly from ALS Chemex.
Trenching samples were prepared at Genalysis Laboratory Services’ Antananarivo facility, and the pulps were then shipped by air to Genalysis in Perth, Australia for final analysis. Genalysis Laboratory Services Pty. Ltd. is accredited to operate in accordance with ISO/IEC 17025, which includes the management requirements of ISO 9001: 2000.
Digestion was by oxidative alkaline fusion, using sodium peroxide as the flux in zirconium crucibles, and hydrochloric acid to dissolve the melt. This results in a total dissolution for virtually all minerals. The analytical methods used in 2009 were ICP-OEM for Cu, Ni, V, and Zn, and ICP-MS for the following elements: As, Pb, Th, and U. The results were posted on a secure website and downloaded by Energizer personnel using a secure username and password.
At all times during sample collection, storage, and shipment to the laboratory facility, the samples are in the control of Energizer or their agents.
It is PEG’s opinion that samples were prepared and analyzed according to industry standards and that the results are secure.
TOC | 13-1 |
|
GREEN GIANT PROJECT TECHNICAL REPORT UPDATE NI 43-101 | |
14
DATA VERIFICATION
Taiga geological staff (under contract by Energizer) have made a strong commitment to the geological and assay database for Energizer resources and have, as far as it is possible, produced a database that is complete and well documented.
14.1
Collar and Down Hole Surveys
PEG randomly selected six drill collars to validate (2% of the drill hole dataset). Five of the six drill hole collars were physically located and plotted within the accuracy of the handheld GPS unit being used for validation.
14.2
Drill Logs
During the site visit, PEG randomly selected six drill holes to review the log’s data against the drill core. The holes were not relogged, just checked to verify that the intervals in the logs matched the drill core. No discrepancies were observed.
14.3
Assays
PEG collected a set of trench samples and quartered drill core in an effort to duplicate the results provided by Taiga, Energizer's field contractor. At the time this report was authored, the trench samples have been lost in shipment. Table 10-1 displays a comparison between the original Energizer split core samples and PEG’s quarter core samples. Borehole TH-08-24 was the only core not sampled during the metallurgical program containing significant vanadium mineralization available for sampling. The PEG samples duplicated the Energizer samples, and indicated that the results are reproducible within this dataset (8% of the samples within borehole TH-08-24).
Table 14-1:
Drill Core Assay Duplicates
Uranium Star Sample (1/2 core) | V (ppm) | PEG Sample (1/4 core) | V (ppm) | Abs. Relative Diff. % |
TH-08-24 20033 | 4970 | 00917 | 4350 | 12 |
TH-08-24 20036 | 5780 | 00918 | 6450 | 10 |
TH-08-24 20037 | 4060 | 00919 | 4090 | 1 |
TH-08-24 20038 | 4960 | 00920 | 5240 | 5 |
TH-08-24 20043 | 6780 | 00921 | 7250 | 6 |
TOC | 14-1 |
|
GREEN GIANT PROJECT TECHNICAL REPORT UPDATE NI 43-101 | |
PEG carried out an internal validation of the drill holes in the Green Giant Property database used in the May 11, 2010, resource estimate. Assay certificates were selected for validation according to the following criteria:
·
highest vanadium grade
·
the certificates with the highest average vanadium grade
·
certificates with the highest assay count
·
distribution of the assays in the deposits.
Requests for the certificates were forwarded to Genalysis who issued 36 certificates in comma delimited format directly to PEG’s e-mail account.
A total of 72 drill holes and 43 trenches were either partially or completely validated amounting to 3,344 individual samples out of 10,212 that were checked against the electronic version of the certificate provided by the issuing laboratory. The validation rate amounted to 33% of the total assay database.
Vanadium, uranium, thorium, lead, zinc, copper, nickel, and arsenic assays were validated with no errors encountered in the data as shown in Table 14-2.
Table 14-2:
Assay Validation Rate
| No. of Assays in | No. of | Percent of | Nb Errors |
DDH | 3,883 | 2,070 | 53% | 0 |
Trench | 6,327 | 1,274 | 20% | 0 |
Total | 10,210 | 3,344 | 33% | 0 |
The drill database was also validated for out of sequence, overlapping, and zero length intervals using the tools supplied by GEMS. Minor errors were reported by the application and all were corrected prior to the resource estimation.
14.4
Density
Samples were not collected for density measurement during the 2008-drill program; however, the equipment to measure the specific gravity was already on-site during the site visit in preparation for the fall 2009 drill program.
TOC | 14-2 |
|
GREEN GIANT PROJECT TECHNICAL REPORT UPDATE NI 43-101 | |
The process to be instituted was as follows: · Pieces of whole core are collected and the rock types documented. · Pieces of core are dipped into wet paraffin wax and allowed to dry; this seals the core to avoid the absorption of moisture. · The pieces of core are weighed dry, followed by weighing in a water bath (see Photo 1). · All data is collected on paper forms and transferred to a spreadsheet for future calculations.
|
Photo 1: SG Scale |
![[technical049.gif]](https://capedge.com/proxy/8-K/0001137171-10-000408/technical049.gif)
At the completion of the 2009 drill campaign, an additional 230 samples were added to the 72 measurements previously recorded in the database.
14.5
Assay QA/QC
14.5.1
Standard Reference Material
During the 2008 exploration program, Energizer began implementing protocols for a QA/QC program, which consisted of the insertion of standards within the sample streams. Base metal and precious metal certified standard reference material (SRM) was inserted within both the stream and core sampling completed during the 2008 program. Vanadium standards were not used in the 2008 drill program as the exploration was at that time focused on VMS targets.
In 2008, Energizer used two certified standards purchased from Ore Research & Exploration Pty Ltd. of Bayswater North, Australia. Ore research provides reference material with a range of low-grade, mid-grade, and high-grade precious and base metal standards with known values and within statistically acceptable limits. Uranium Star used low- to high-iron multi-element geochemical standards OREAS 43P and 44P. These samples are composites, having been prepared from several source materials (gold-bearing greywacke, gossan, laterite, etc.) to optimize metal concentrations and retain gold homogeneity.
A total of 38 certified standards (5% of samples) were inserted within the diamond drill core sample sequence: 18 OREAS 43P and 20 OREAS 44P samples. PEG has not reviewed the results of the SRM used during the 2008 drill program since neither SRM is certified for vanadium.
Due to the lack of commercially available vanadium certified reference standards, Energizer has created two vanadium reference standards, TH01 and TH02, from material sourced on the property. CDN Resources Labs of Delta, BC, prepared the two standards and the material has completed Round Robin assaying and was certified by Dr. Barry (see Appendix A).
TOC | 14-3 |
|
GREEN GIANT PROJECT TECHNICAL REPORT UPDATE NI 43-101 | |
Both SRM samples are certified for fusion-XRF analysis, while the current V analysis done by Genalysis is ICP-OES. A failure of an SRM is considered any result outside the certified mean ±3 standard deviations.
14.5.2
TH01
TH01 is a low-grade V SRM and had an insertion rate of 6%. The grade of this SRM is potentially well below any cutoff grade to be utilized in future resource calculations.
The TH01 samples submitted during the 2009 trenching and drilling program had a failure rate of 54% or 224 samples (Figure 14-1) with five of the failures likely related to mislabelling of the standard. This is an extremely high error rate. The 0.341% V2O5 mean of the 422 TH01 samples submitted was outside the +3 standard deviations of the certified mean. The standard deviation of this SRM is extremely low at 0.0025%, and it was noted in the round robin for this SRM that the results from Genalysis were at the higher end of the dataset.
Figure14 1-:
TH01
The likely cause of the high failure rate is the different analytical procedure. Energizer is strongly recommended to consult with Genalysis to verify this assumption and to discuss the merit of switching analytical procedure. PEG also recommends re-assaying a series of pulps to a secondary laboratory for check assays.
TOC | 14-4 |
|
GREEN GIANT PROJECT TECHNICAL REPORT UPDATE NI 43-101 | |
14.5.3
TH02
TH02 is a medium grade V SRM and had an insertion rate of 5%. The failure rate was 4% or 18 samples (Figure 14-2) with four of the failures likely related to mislabelling of the standard. This is only slightly lower than the industry accepted 5%. The 0.639% V2O5mean value of the analytical results was the very close the expected SRM value of 0.636% V2O5.
Figure 14-2:
TH02

14.5.4
Duplicates
No duplicate core samples were collected during the 2008 diamond drill program.
During the spring 2009 drilling and trenching program, 287 duplicate samples were collected, representing an insertion rate of 5%, which is acceptable industry standard.
Regression line shows excellent correlation between the original value and the duplicate with a R2value of 0.94 (Figure 14-3). The removal of six outliers improves the R2value to 0.98.
TOC | 14-5 |
|
GREEN GIANT PROJECT TECHNICAL REPORT UPDATE NI 43-101 | |
Figure 14-3:
Duplicate Pass-Fail
![[technical055.gif]](https://capedge.com/proxy/8-K/0001137171-10-000408/technical055.gif)
14.5.5
Blanks
No blank samples were submitted into the sample streams for the 2008 diamond drill program or the spring 2009 trenching program. During the 2009 drill program, Energizer has now implemented this additional protocol. A total of 204 blank samples were inserted in the sample stream. The blank material used was marble. Results from the analysis indicated that nine samples out of 204 exceeded five times the detection limit (Figure 14-4). This amounted to a failure rate of 4.4%, which is considered by PEG to be high, but still within acceptable range considering the material used.
TOC | 14-6 |
|
GREEN GIANT PROJECT TECHNICAL REPORT UPDATE NI 43-101 | |
Figure 14-4:
Blank Results for 2009
![[technical057.gif]](https://capedge.com/proxy/8-K/0001137171-10-000408/technical057.gif)
14.6
XRF QA/QC Procedures
During field use, each Niton XRF unit is calibrated daily using the internal calibration function to verify each unit is functioning correctly. The unit measures a small grain of silver located on the back of the X-ray tube’s shutter and generates spectra, which are then compared with the internally stored spectra for silver. If the calibration reading differs greatly from the stored number, it is an indication that the unit’s optics are out of alignment, and subsequent sample readings will be highly suspect.
After each shutdown and restart of the instrument throughout the day, the operator also conducts a calibration.
Following the initial daily calibration, six samples contained within XRF sample cups are analyzed:
·
20029
·
20073
·
21245
·
TH01 (prepared for program)
·
TH02 (prepared for program)
·
SiO2 Blank (supplied by Elemental Controls Ltd.).
TOC | 14-7 |
|
GREEN GIANT PROJECT TECHNICAL REPORT UPDATE NI 43-101 | |
While not certified standard material, samples 20029, 20073, and 21245 were measured daily in order to provide an additional verification of the equipment used. The units have been found to provide highly consistent readings during field testing.
TH01, TH02, and the SiO2 Blank are prepared sample standards. Reported vanadium values can be verified and/or corrected when these samples have been analyzed. The SiO2 Blank has a known value of 55 ppm vanadium.
None of the XRF data was used in the resource estimation; Taiga uses the equipment to assist in the exploration program.
14.7
Site Visit Photos
A series of selected photographs from the site visit are included below. The author would like to illustrate via these photos (Figure 14-5) the robust trenching program on the Green Giant property.
Figure 14-5:
Site Visit Photos
Trenches on the Green Giant property | Sampling at the bottom of the trench |
|
|
Diamond drilling | Core cutting area |
|
|
TH08-24 at 36.9 m grading 0.89% V2O5 - Jaky | Core logging on the Green Giant property |
|
|
![[technical059.gif]](https://capedge.com/proxy/8-K/0001137171-10-000408/technical059.gif)
![[technical061.gif]](https://capedge.com/proxy/8-K/0001137171-10-000408/technical061.gif)
![[technical063.gif]](https://capedge.com/proxy/8-K/0001137171-10-000408/technical063.gif)
![[technical065.gif]](https://capedge.com/proxy/8-K/0001137171-10-000408/technical065.gif)
![[technical067.gif]](https://capedge.com/proxy/8-K/0001137171-10-000408/technical067.gif)
![[technical069.gif]](https://capedge.com/proxy/8-K/0001137171-10-000408/technical069.gif)
TOC | 14-8 |
|
GREEN GIANT PROJECT TECHNICAL REPORT UPDATE NI 43-101 | |
15
ADJACENT PROPERTIES
From the air, PEG observed three stone quarries located to the northeast of the Green Giant Property, only one of which is currently in production. This quarry produces labradorite blocks for export to Italy through the port of Toliara. PEG has not confirmed the ownership or resources of the quarries. The occurrence of labradorite does not influence the known vanadium mineralization encountered on the Green Giant project.
There are no previous reports of vanadium mineralization in the area.
TOC | 15-1 |
|
GREEN GIANT PROJECT TECHNICAL REPORT UPDATE NI 43-101 | |
16
MINERAL PROCESSING AND METALLURGICAL TESTING
When it was established in 2008 that a group of significant vanadium deposits existed within the Green Giant property, a preliminary series of petrographic studies and preliminary metallurgical tests were completed on a selection of reject samples from the original laboratory analyses. A summary of this initial work is described below.
As the economic parameters of vanadium production were not well known to Energizer, it was felt that the Company should seek specialist advice to establish economic benchmarks that could help the Company direct its exploration efforts.
Given the bulk of the mineralization was contained in silicate minerals, the first goal was to establish whether the mineralization is refractory, and if in fact the vanadium could be extracted under conditions which could be reasonably expected to be practical under normal commercial constraints. Current test results are very preliminary in nature and this work is ongoing. Testing is directed towards selection of a preliminary vanadium extraction process and, using this data as a base, PEG will provide plant operating and capital cost estimates for a desktop study of the project.
The results of recent metallurgical testwork are discussed below.
16.1
Microlithics Heavy Liquid Separation Analysis
In order to establish the type of mineralogy that hosted the vanadium mineralization, Bob Barnett of R.L. Geological Consulting conducted microprobe petrologic analysis for selected Green Giant drill core samples. Visual observation by field personnel indicated that vanadium was predominantly in silicate mineral phases. Subsequent to the release of his report, however, Barnett verbally stated that he felt the vanadium budget was concentrated in the oxide minerals and micas, and that this would most likely enable Energizer to prepare a vanadium-rich concentrate using gravity concentration techniques.
Using Barnett’s recommendations as guidance, twelve crushed drill core samples from ALS Chemex were submitted by Energizer for heavy liquid separation by Microlithics Laboratories Inc. in Thunder Bay, Ontario.
Upon receipt, Microlithics further crushed the samples before establishing three size fractions per sample: +2 mm, -2 mm +0.25 mm, and -0.25 mm.
Only the middle size fraction (-2 mm +0.25 mm) was selected for heavy liquid processing. On average, 34% of the initial sample mass fell into this size category, with a range between 24% and 47%.
TOC | 16-1 |
|
GREEN GIANT PROJECT TECHNICAL REPORT UPDATE NI 43-101 | |
The heavy liquid separation flowsheet was as follows:
|
The LD Concentrate consisted of oxide and micaceous minerals. This concentrate was then separated further using a heavy liquid with a specific gravity of 3.35 to separate the micaceous minerals (HD Float) from the oxide minerals (HD Concentrate).
The HD Float and HD Concentrate splits for each sample were then resubmitted to ALS Chemex for analysis to determine where the vanadium budget of the samples resides.
Table 16-1 shows a summary of the analytical results.
Contrary to what was originally postulated by Bob Barnett, the vanadium budget of these samplesdoes notappear to reside predominantly in the oxide minerals and/or micas.
The HD Float data indicates that on average roughly 5% (with a range between 0.5 and 11%) of the vanadium budget is within micas (or equivalent density material). The HD Concentrate data indicates that on average roughly 7.5% (with a range between 0.9 and 14%) of the vanadium budget resides within the oxide minerals (or equivalent density material). If the lower density liquid (SG=2.88) is used for establishing a concentrate (LD concentrate), roughly 11% (with a range between 0.5 and 22%) of the vanadium budget is accounted for.
As a result of the work completed on these samples, it can be concluded that a vanadium-rich oxide concentrate cannot easily be produced using conventional gravity separation methods.
TOC | 16-2 |
|
GREEN GIANT PROJECT TECHNICAL REPORT UPDATE NI 43-101 | |
Table 16-1:
ALS/Microlithics Analytical Results
Sample Number | Original | Recovery (%) | |||
ALS | Microlithics | HD Float | HD Concentrate | LD Concentrate (HD Flot+HD Conc.) | |
20070 | R083 | 0.52 | 0.51 | NSS | 0.51 |
20071 | R084 | 0.48 | 1.74 | NSS | 1.74 |
20093 | R005 | 1.00 | 10.81 | 0.90 | 11.71 |
20094 | R006 | 0.67 | 4.67 | NSS | 4.67 |
20591 | R091 | 0.38 | 1.92 | 2.16 | 4.08 |
20592 | R092 | 0.43 | 1.52 | 3.64 | 5.17 |
20706 | R206 | 0.74 | 5.00 | 7.15 | 12.15 |
20707 | R207 | 0.70 | 6.30 | 7.82 | 14.12 |
21018 | R018 | 0.56 | 10.70 | 11.31 | 22.01 |
21019 | R019 | 0.41 | 9.70 | 10.78 | 20.48 |
21220 | R220 | 0.70 | 5.08 | 14.19 | 19.27 |
21221 | R221 | 0.56 | 4.24 | 9.41 | 13.65 |
Note:
NSS = not sufficient sample.
16.2
SGS Minerals Services (Lakefield) Work
After completion of the Microlithics HLS work, Energizer directed SGS Minerals Services to prepare a scope of work for a preliminary hydrometallurgical test program to determine the extractability of vanadium from two composite samples.
On delivery of sample material early in 2009, SGS completed the metallurgical testing as described below.
16.2.1
Sample Preparation
SGS Minerals Services received a 150 kg shipment from ALS Chemex in Vancouver, Canada on March 20, 2009. This shipment consisted of 70 small samples contained in 16 rice bags. Each sample bag contained between 100 g and 4 kg (gross weight) of processed drill core, with a maximum particle size of approximately 4 mm.
The samples identified by Mr. C. Scherba of Taiga were inventoried and sorted into five batches. The definition of the five batches is given below, with grades and descriptions also presented in Table 16-2.
·
Batch 1 is primarily silicate portions of the Mainty Zone
·
Batch 2 is primarily silicate portions of the Mainty Zone
·
Batch 3 is from the oxide portion of the Jaky Zone
·
Batch 4 is from the unoxidized, presumably silicate portion of the Jaky Zone
·
Batch 5 is from 100 m west of the Jaky Zone and represents oxidized material.
TOC | 16-3 |
|
GREEN GIANT PROJECT TECHNICAL REPORT UPDATE NI 43-101 | |
Table 16-2:
Energizer Feed Batch Information
Batch | Hole | Sample Start | Sample End | Meterage | Meterage | V2O5 | Interval | Ore Type |
1 | TH-08-12 | 20549 | 20561 | 53.3 | 76.2 | 0.391 | 22.86 | silicate |
2 | TH-08-12 | 20572 | 20589 | 88.4 | 114.3 | 0.447 | 25.91 | silicate |
3 | TH-08-24 | 20021 | 20037 | 4.57 | 36.6 | 0.713 | 32 | oxide |
4 | TH-08-24 | 20038 | 20045 | 36.6 | 60.96 | 1.02 | 24.38 | silicate |
5 | TH-08-27 | 20163 | 20166 | 9.14 | 28.89 | 0.63 | 19.81 | oxide |
These samples were combined to produce three blends and two composite feeds as per Table 16-3. These composite samples were then ground in 2 kg charges in a laboratory ball mill to achieve a maximum particle size of 150 µm (100% passing 100-mesh). Particle size distribution of the composite feed samples (before and after grinding) together with specific gravity analyses are summarized in Table 16-4 and shown in Figure 16-1.
Table 16-3:
Ore Compositing Details
Identification | Components | Ore Type | Mass (kg) |
Blend A | Batch 1, Batch 2 | Silicate | 26.1 |
Blend B | Batch 3, Batch 5 | Oxide | 14.5 |
Blend C | Batch 4 | Silicate | 4.8 |
Silicate Comp | Blend A, Blend C | Silicate | 30.9 |
Oxide Comp | Blend B | Oxide | 14.5 |
Table 16-4:
Particle Size and Specific Gravity
| Silicate Composite | Oxide Composite |
Feed (as received K80 µm) | 749 | 703 |
Feed to leach tests K80 µm | 104 | 72 |
SG (relative to water) | 2.72 | 2.69 |
1 V2O5 grade determined by ALS Chemex and provided to SGS by Taiga.
TOC | 16-4 |
|
GREEN GIANT PROJECT TECHNICAL REPORT UPDATE NI 43-101 | |
Figure 16-1:
Particle Size Distributions
![[technical071.gif]](https://capedge.com/proxy/8-K/0001137171-10-000408/technical071.gif)
16.2.2
Head Assay
The silicate and oxide composites were analyzed for metals content by ICP-OES following a strong acid digestion and by Whole Rock Analysis (WRA) by X-Ray Fluorescence (XRF) expressing major elements as oxides. Each composite was also analyzed for total sulphur and total carbon contents by Leco. Table 16-5 presents the results from these analyses.
16.2.3
Leaching Tests
A series of four simple bench-scale leach tests were performed using the ground Silicate Composite and Oxide Composite samples as described above. The leach feed charge for each test was 290 g of dry ore. Each test was run at 25% (w/w) solids at 80°C for 24 hours. The free acid (FA) of the tests was maintained by addition of concentrated (96%) sulphuric acid and checked by free acid titration (FAT).
TOC | 16-5 |
|
GREEN GIANT PROJECT TECHNICAL REPORT UPDATE NI 43-101 | |
Table 16-5:
Head Assays
| Silicate Composite | Oxide Composite |
V2O5, % | 0.57 | 0.95 |
SiO2, % | 56.4 | 61.6 |
Al2O3, % | 11.4 | 12.3 |
Fe2O3, % | 6.26 | 7.86 |
MgO, % | 2.61 | 0.47 |
CaO, % | 2.56 | 0.13 |
Na2O, % | 0.15 | 0.17 |
K2O, % | 1.87 | 1.9 |
TiO2, % | 0.58 | 0.63 |
P2O5, % | 0.77 | 1.32 |
MnO, % | 0.13 | 0.01 |
Cr2O3, % | 0.04 | 0.05 |
LOI, % | 14.7 | 12.9 |
Sum, % | 98.1 | 100.3 |
S, % | 3.56 | 1.39 |
C(t), % | 6.2 | 3.64 |
Ag, g/t | <2 | <2 |
As, g/t | <30 | <30 |
Ba, g/t | 4,000 | 1,600 |
Be, g/t | 1.8 | 1.6 |
Bi, g/t | <20 | <20 |
Cd, g/t | <20 | <20 |
Co, g/t | 30 | <20 |
Cu, g/t | 648 | 242 |
Li, g/t | <20 | <20 |
Mo, g/t | 130 | 68 |
Ni, g/t | 220 | 42 |
Pb, g/t | 27 | 29 |
Sb, g/t | <20 | <20 |
Se, g/t | <30 | <30 |
Sn, g/t | <20 | <20 |
Sr, g/t | 140 | 220 |
TI, g/t | <30 | <30 |
U, g/t | <50 | <50 |
Y, g/t | 49 | 50 |
Zn, g/t | 170 | 32 |
TOC | 16-6 |
|
GREEN GIANT PROJECT TECHNICAL REPORT UPDATE NI 43-101 | |
One test for each composite was maintained at 20 g/L H2SO4, while the remaining two tests were maintained at 100 g/L H2SO4. Time zero of the leach was the point at which the free acid target was achieved. The oxidation potential for each test (ORP, measured vs. Ag|AgCl with saturated KCl electrode) was monitored and recorded throughout the leach period. Each test was run in a 2 L Pyrex reaction kettle equipped with reflux condenser, and agitated with a 5 cm diameter four-blade Teflon impeller with 45° pitch rotating at 400 rpm. The slurry from each test was sampled at 1, 3, 6, and 12 hours.
The pregnant leach solution from each of these samples was analyzed for vanadium content while the residue was submitted for an ICP scan after two consecutive 60 mL deionized water displacement washes. At the conclusion of the tests, the entire reactor contents were weighed and filtered through a 185 mm diameter Whatman #1 filter paper. A sub-sample of the pregnant leach solution was submitted for vanadium, silicon, and a full ICP scan. The entire final residue was submitted for an ICP scan after one 300 mL de-ionized water repulp wash and one 300 mL deionized water displacement wash.
Material from the FA titration samples was disposed of.
Average conditions for tests L1-L4 are included in Table 16-6, and average recoveries are graphically shown in Figure 16-2 and tabulated in Tables 16-7 to 16-10. Leach residue tenors are graphically shown in Figure 16-3.
Table 16-6:
Average Test Conditions
Test ID | L1 | L2 | L3 | L4 |
Sample | Oxide | Oxide | Silicate | Silicate |
Avg. T, °C | 82 | 81 | 81 | 81 |
Feed % solids | 25 | 25 | 25 | 25 |
Avg. FAT, g/L H2SO4 | 101 | 20 | 103 | 20 |
Avg. pH | -0.2 | 0.8 | -0.3 | 0.5 |
Avg. ORP, mV | 630 | 516 | 865 | 731 |
Acid Consumption | 250 | 102 | 179 | 52 |
TOC | 16-7 |
|
GREEN GIANT PROJECT TECHNICAL REPORT UPDATE NI 43-101 | |
Figure 16-2:
Vanadium Extraction vs. Time
![[technical073.gif]](https://capedge.com/proxy/8-K/0001137171-10-000408/technical073.gif)
Figure 16-3:
Residue Assay vs. Time
![[technical075.gif]](https://capedge.com/proxy/8-K/0001137171-10-000408/technical075.gif)
TOC | 16-8 |
|
GREEN GIANT PROJECT TECHNICAL REPORT UPDATE NI 43-101 | |
Table 16-7:
Metal Extraction Data
Test ID | L1 | L2 | L3 | L4 |
1 h | 27.9 | 13.6 | 50.5 | 20.3 |
3 h | 33.1 | 17.7 | 61.1 | 26.8 |
6 h | 45.5 | 22.6 | 66.7 | 31.0 |
12 h | 62.0 | 32.2 | 71.0 | 36.5 |
24 h | 69.9 | 34.5 | 78.2 | 39.9 |
Table 16-8:
Vanadium Solution Analyses
Test ID | L1 | L2 | L3 | L4 |
1 h | 170 | 84 | 510 | 190 |
3 h | 210 | 100 | 620 | 250 |
6 h | 280 | 130 | 670 | 290 |
12 h | 420 | 180 | 750 | 350 |
24 h | 500 | 220 | 800 | 390 |
Table 16-9:
Impurity Solution Levels (final PLS only)
Test ID | L1 | L2 | L3 | L4 |
Al | 5,600 | 1,500 | 3,800 | 930 |
Fe | 5,300 | 2,500 | 9,500 | 2,100 |
K | 1,100 | 380 | 1,100 | 270 |
Mg | 2,400 | 1,100 | 370 | 170 |
P | 830 | 560 | 1,000 | 110 |
Si | 180 | 480 | 250 | 280 |
Cu | 140 | 120 | 47 | 38 |
Ti | 160 | 19 | 140 | 7.7 |
Mn | 220 | 170 | 23 | 16 |
Table 16-10:
Vanadium Partial Residue Analyses
Test ID | L1 | L2 | L3 | L4 |
0 h (feed) | 0.32 | 0.32 | 0.53 | 0.53 |
1 h | 0.22 | 0.26 | 0.27 | 0.37 |
3 h | 0.21 | 0.25 | 0.22 | 0.36 |
6 h | 0.18 | 0.22 | 0.20 | 0.34 |
12 h | 0.14 | 0.19 | 0.17 | 0.30 |
24 h | 0.11 | 0.20 | 0.14 | 0.30 |
TOC | 16-9 |
|
GREEN GIANT PROJECT TECHNICAL REPORT UPDATE NI 43-101 | |
From these results, the following observations can be made:
·
High free acid levels of 100 g/L H2SO4 led to higher V extraction in both samples than the test performed under 20 g/L H2SO4 conditions
·
The tests performed with 100 g/L free acid concentrations seemed to continue leaching at 24 hours (based on increasing extraction observed in Figure 16-2 and decreasing residue assays in Figure 16-3)
·
Overall extraction of vanadium from the silicate sample is higher (78.2%) than from the oxide sample (69.9%)
·
Despite the higher extraction of vanadium from the silicate samples, acid consumption (using the 100 g/L series of tests) is generally lower with the silicate sample (179 kg/t) than with the oxide sample (250 kg/t). This can be attributed to higher co-extraction of acid consuming elements such as aluminum, magnesium, and manganese in the silicate sample
It was observed that a precipitate formed in the filtrate of the Silicate Composite leaches if the pulp was filtered hot. These filtrate samples were filtered again and the precipitate from all of the filtrate samples was combined to be analyzed (Table 17-1). At 23% Ca, this precipitate is presumed to be mainly gypsum:
·
Maximum vanadium extraction accomplished in this scoping study was 69.9% (oxide sample) and 78.2% (silicate sample). Main conditions included an acid concentration of 100 g/L H2SO4, test temperature of 80°C, and test duration of 24 h
·
Leach recovery may be improved by increasing acid concentration and extending the leach retention time; further test work is required to confirm this
·
Given the fact that reasonable vanadium extraction appears feasible, it is recommended to look into physical upgrading methods such as gravity separation and flotation.
Table 16-11:
Precipitate Analysis
| Al | Fe | Mg | Ca | K | Ti | Mn | Cr | V | Na | P |
Precipitate % | 1.7 | 0.094 | 0.013 | 23 | 0.012 | 0.048 | 0.0025 | 0.0007 | 0.0012 | 0.0034 | 0.02 |
In general, considering the preliminary nature of these tests, the results can be considered encouraging and suggest that further improvements may be achieved through additional testing.
Contrary to initial expectations, the silicate samples were more reactive to leaching by sulphuric acid than the oxide samples, and a higher vanadium component was extracted from the silicate samples than from the oxide samples.
TOC | 16-10 |
|
GREEN GIANT PROJECT TECHNICAL REPORT UPDATE NI 43-101 | |
On the negative side, acid consumption was judged to be quite high. Extraction of vanadium by SGS was sufficiently elevated to indicate that the material is not refractory, although the reader is advised that it has not yet been established if a commercial grade extractive process can be devised for this project.
16.3
Desktop Study Metallurgical Support Program
With preliminary hydrometallurgical results indicating that vanadium is not refractory to leaching, it was decided to expand the metallurgical test program to provide sufficient data to allow production of a desktop level study including order of magnitude capital and operating cost estimates. This desktop study is presently in progress.
Two lots of samples totalling approximately 280 kg of oxide mineralization and 340 kg of Primary (silicate) mineralization from Manga and Jacky Zones have been sent to Mintek Metallurgical test facilities in Johannesburg, South Africa. An extensive program of metallurgical testwork and mineralogical characterisation has been outlined and is currently in progress. In addition, approximately 200 kg of oxide mineralization and 200 kg of silicate mineralization from the Manga Zone has been shipped to SGS Canada (Lakefield) for additional testing. The Program has been designed to examine the following:
· Mineralogical Characterization | To further understand the distribution and association of vanadium-rich minerals within samples of Silicate and oxide mineralization. The results of this work are expected to assist in the development of preconcentration and hydrometallurgical processes. |
· Leaching | To develop the initial acid leaching work conducted at SGS, testing longer acid leaches, alternative lixiviants (alkaline, chloride), the use of oxidants and higher temperatures and pressures. |
· Preconcentration | A program of physical and chemical separation techniques (such as flotation, screening, and gravity concentration) will be tested to determine if the Green Giant mineralization is amenable to preconcentration techniques as a means of upgrading prior to leaching. |
The final results from this work program will be communicated in future technical reports.
TOC | 16-11 |
|
GREEN GIANT PROJECT TECHNICAL REPORT UPDATE NI 43-101 | |
17
MINERAL RESOURCE AND MINERAL RESERVE ESTIMATES
PEG has produced a resource estimate of the Green Giant Deposit for Energizer Resources. Gemcom software GEMS 6.2.3.2™ was used for the resource estimate, along with Sage 2001 for the variography. The metal of interest at the Green Giant Deposit is vanadium.
As stated earlier, Energizer retained Taiga Consultants Ltd. (Taiga) to manage the exploration activities of the Green Giant Project, and all information provided for the resource estimate originated from them. Taiga provided a digital drill hole database in Microsoft Access dated February 5, 2010, containing a series of tables describing the collar, survey, major and minor lithological intervals, and assay results. Tables containing alterations, mineralization, structure, QA/QC, XRF assays, and geotechnical data were also present in the database. The topography was provided as elevated contour lines (5 m) in DXF format. A series of GeoSoft™ cross sections and maps illustrated the geology. Additional information provided consisted of original logs in XLS format, core photo s, and laboratory certificates.
The complete Green Giant drill database includes 87 diamond drill holes, totalling 13,006 m of core drilling, supplemented by a total of 140 surface trenches. Of this data, 62 holes were used in the resource estimate along with 19 surface trenches, as shown in
Table 17-1. The remaining holes were drilled on various exploration targets and the remaining trenches were part of the regional exploration program.
The resource described in this section is 65% supported by diamond drill core assay and 35% by trench assays.
Table 17-1:
Summary of Drill Holes and Trench Data
17.1
Geological Interpretation
The main-ore bearing lithological units on the Green Giant property are logged as gneiss and graphitic gneiss. PEG analyzed the population distribution for these two units separately and found them to be different enough to justify further investigation. Contact plots indicated sharp boundaries between the gneiss and graphitic gneiss in the primary unit. In the oxidation layer, the contact was found to be gradational. In 3D, the lithological units were difficult to separate. Taiga field geologists indicated that the vanadium can be in both units. The decision to classify a rock as graphitic gneiss versus gneiss is based on visual observation of the graphite content by the geologist logging the core, and is therefore subject to interpretation. For that reason, the 3D wireframes developed to control the grade interpolation of the resource model were generally based on a 0.2% V2O5 cut-off grade, as opposed to using a lithological envelope. Based on the statistical work, PEG believes that the graphite content of the core should be evaluated further, since it may bear a control on the mineralization and may also have an effect on the metallurgical properties of the ore. PEG suggests using a down hole resistivity probe in order to accurately quantify the graphite content of the rock. Following the data acquisition, the statistical work can be redone and the model could be adjusted if needed.
TOC | 17-1 |
|
GREEN GIANT PROJECT TECHNICAL REPORT UPDATE NI 43-101 | |
The grade shell wireframe was constructed using all drill hole intercepts and surface trench assays within the Jaky and Manga Zones. During construction of the wireframe, continuous zones of mineralization where V2O5exceeded 0.2% were incorporated in the model. Exceptions were made when necessary, to include lower grade intercepts to allow for zonal continuity. The grade shell contacts were drawn on set vertical cross-sections spaced 100 m apart. The wireframe construction was carried out in multiple steps as follows:
·
Polylines describing the upper and lower contacts of the zones were digitized on the sections using a 0.2% V2O5 cut-off grade as the primary guiding principle snapping to all drill hole and trench intercepts.
·
The sectional polylines were reconciled in plan view and wireframed into a temporary solid.
·
The mineralization was generally projected between 50 m to 60 m down-dip past the last drill hole. The projection distance could reach up to 90 m if the mineralization was extremely strong (i.e., 0.6% V2O5over multiple samples).
·
At Jaky, the thinly bedded footwall zones were expanded 12.5 m laterally beyond the last drill fence to complete the model. The main zone at Jaky was projected laterally half way to the next section, or 50 m beyond the last drill fence.
·
Based on trench data, the mineralization at Manga was continuous for 600 m to the south and 400 m to the north of the last drill fence. Mineralization supported solely by trench data was kept near surface and does not extend much below topography in the down-dip direction.
·
For Jaky alone, a low-grade mineralized envelope was also constructed in order to capture any mineralization that was left out of the higher-grade wireframes. This step was unnecessary at Manga, as the mineralization appeared in one single entity.
·
The models were wireframed and verified.
·
During the verification process, grades less than 0.3% V2O5on the very edge of the wireframe were dropped from the mineralized envelope.
TOC | 17-2 |
|
GREEN GIANT PROJECT TECHNICAL REPORT UPDATE NI 43-101 | |
·
The model was validated for triangulation errors, checked against the drill holes, and adjusted as necessary for one final iteration.
The topography surface was constructed using the elevated contour lines distributed by Taiga and wireframed into a 3D surface.
A bedrock surface was constructed by selecting the last overburden interval in the drill holes and wireframing the data points using a Laplace transformation, which tends to smooth the surface. The resulting surface is sufficiently close to the data points while not necessarily honouring all point locations. Areas protruding above the topography were corrected to include a minimal amount (0.5 m) of overburden.
The oxidation layer on the Green Giant property ranges between 40 m to 60 m in depth, and based on the data available appears to be planar with very few spikes. Taiga reported a poorly developed mix zone between the oxidation and the primary material, therefore a mixed bottom contact was not modelled. The bottom of the oxidation layer was constructed by selecting the last oxidation interval in the drill hole. For holes that terminated within the oxidation layer, a point 5 m to 10 m lower than the end of the hole was added to the dataset. The complete oxidation dataset was wireframed using a Laplace transformation as with the overburden layer.
The final wireframes consisted of twelve high-grade mineralized solids along with one low-grade envelope on the Jaky deposit and one single wireframe for Manga, as shown in
Table 17-2. Figure 17-1 illustrates the Jaky model in an isometric view without the Jaky low-grade solid visible and Figure 17-2 the Manga model.
Table 17-2:
Wireframe Final Volumes for Jaky and Manga Deposit
Mineralization Volume Clipped to Overburden | Block Model Code | (m3) |
Jaky-3 | 130 | 4,937 |
Jaky-9 | 190 | 4,041 |
Jaky-12 | 170 | 2,699 |
Jaky-10 | 170 | 4,754 |
Jaky-11 | 170 | 4,542 |
Jaky-6 | 160 | 170,625 |
Jaky-6a | 160 | 19,394 |
Jaky-1 | 110 | 4,767,665 |
Jaky-2 | 120 | 320,810 |
Jaky-2a | 120 | 25,039 |
Jaky-4 | 140 | 89,180 |
Jaky-5 | 150 | 1,098,947 |
Jaky Low-grade Envelope | 300 | 28,427,583 |
Manga | 200 | 10,931,970 |
TOC | 17-3 |
|
GREEN GIANT PROJECT TECHNICAL REPORT UPDATE NI 43-101 | |
Figure 17-1
Isometric View of theJaky Wireframe
![[technical082.jpg]](https://capedge.com/proxy/8-K/0001137171-10-000408/technical082.jpg)
TOC | 17-4 |
|
GREEN GIANT PROJECT TECHNICAL REPORT UPDATE NI 43-101 | |
Figure 17-2:
Isometric View of the Manga Wireframe
![[technical083.jpg]](https://capedge.com/proxy/8-K/0001137171-10-000408/technical083.jpg)
TOC | 17-5 |
|
GREEN GIANT PROJECT TECHNICAL REPORT UPDATE NI 43-101 | |
17.2
Exploratory Data Analysis
Exploratory data analysis is the application of various statistical tools to characterize the statistical behaviour or grade distributions of the data set. In this case, the objective is to understand the population distribution of the grade elements in the various units using such tools as histograms, descriptive statistics, and probability plots.
17.2.1
Assays
PEG evaluated the raw assay statistics, grouping all assays within the Jaky and Manga wireframes, and separating the dataset between the oxidation and primary units.
The mean value of the vanadium pentoxide for the Manga deposit is noticeably higher in the primary layer than in the oxidation unit. For Jaky the grade difference is not as large as with Manga, but the vanadium grade is in general also higher in the primary layer than in the oxidation layer.
Frequency distribution in the Jaky oxidation domain shows a near normal distribution, with 90% of the V2O5 values below 1%. In the primary domain, the distribution is not as clean and the histogram indicates the presence of a bi-population. There is a peak at about 0.3% to 0.4% V2O5 and a second peak at about 0.7% to 0.8% V2O5, which is reflected in the graphitic gneiss distribution. At Manga, the frequency distribution is similar to Jaky indicating that the grade distribution in the vanadium trend is likely very uniform. The bi-population of the vanadium assay for Jaky and Manga should be investigated further, as it could indicate a change in the mineralogical assemblages, or could simply be related to graphite content of the rock, which is currently not quantified in sufficient deta il to allow for the separation of the population. Once the bi-population is explained, the domains may need to be separated in future resource estimates via discrete wireframes or by using indicators. Table 17-3 provides descriptive statistics for the trench and drill hole samples within the oxidation and primary domains. Appendix B includes the complete raw assay statistics.
Correlation tables show poor correlation between most elements. The highest overall correlation factor R2 of 0.561 is between vanadium and uranium. When separated by the oxidation and primary domain it become evident that a strong correlation only exists in the primary zone, with an R2 of 0.823, which is not reflected in the oxidation zone.
Vanadium also shows a weak correlation with copper.
TOC | 17-6 |
|
GREEN GIANT PROJECT TECHNICAL REPORT UPDATE NI 43-101 | |
Table 17-3:
Descriptive V2O5 Raw Assays Statistics
| Jaky | Manga | Jaky and Manga | ||
Oxide | Primary | Oxide | Primary | ||
Valid Cases | 1,166 | 1,783 | 447 | 917 | 4,313 |
Mean | 0.43 | 0.31 | 0.55 | 0.69 | 0.45 |
Std. Error of Mean | 0.01 | 0.01 | 0.01 | 0.01 | 0.01 |
Variance | 0.12 | 0.08 | 0.09 | 0.10 | 0.12 |
Std. Deviation | 0.35 | 0.28 | 0.31 | 0.32 | 0.34 |
Variation Coefficient | 0.80 | 0.91 | 0.55 | 0.47 | 0.77 |
Rel. V. Coefficient (%) | 2.36 | 2.15 | 2.61 | 1.56 | 1.17 |
Skew | 1.54 | 1.40 | 2.01 | 0.64 | 1.14 |
Kurtosis | 3.43 | 1.47 | 6.37 | 1.14 | 1.73 |
Minimum | 0.00 | 0.02 | 0.07 | 0.00 | 0.00 |
Maximum | 2.46 | 1.56 | 2.28 | 2.60 | 2.60 |
Range | 2.46 | 1.55 | 2.21 | 2.60 | 2.60 |
Sum | 503 | 555 | 248 | 628 | 1,934 |
1st Percentile | 0.03 | 0.02 | 0.13 | 0.07 | 0.03 |
5th Percentile | 0.06 | 0.04 | 0.22 | 0.23 | 0.05 |
10th Percentile | 0.10 | 0.06 | 0.26 | 0.31 | 0.08 |
25th Percentile | 0.17 | 0.10 | 0.36 | 0.42 | 0.17 |
Median | 0.33 | 0.21 | 0.49 | 0.69 | 0.36 |
75th Percentile | 0.62 | 0.43 | 0.66 | 0.88 | 0.68 |
90th Percentile | 0.89 | 0.75 | 0.91 | 1.08 | 0.91 |
95th Percentile | 1.08 | 0.91 | 1.12 | 1.25 | 1.08 |
99th Percentile | 1.71 | 1.21 | 1.83 | 1.57 | 1.49 |
Geom. Mean | 0.31 | 0.20 | 0.49 | 0.60 | 0.31 |
Contact plot studies conducted on the assays within the Jaky and Manga wireframes show a typical gradational contact between the oxidation and primary zones at Jaky. At the Manga deposit, the transition between these two layers appears statistically more abrupt and could be described as a semi-soft boundary.
The 3D high-grade envelopes at Jaky capture most of the mineralization, leaving very little high-grade material outside the wireframe. Contact plots also show that the grade distribution is not gradational near the contacts, allowing the interpolation parameters to treat all boundaries between the high-grade and low-grade envelope as sharp in the model.
TOC | 17-7 |
|
GREEN GIANT PROJECT TECHNICAL REPORT UPDATE NI 43-101 | |
17.2.2
Trench Data Evaluation
Considerable effort was carried out to assess the impact of using the trench data with the diamond drill holes in the resource estimate. Trench assay data was matched with the nearest down-dip diamond drill hole assays as illustrated in Figure 17-3. These pseudo twin samples are considered by PEG to be statistically representative.
Figure 17-3:
Trench Assays Pseudo Twin
![[technical087.jpg]](https://capedge.com/proxy/8-K/0001137171-10-000408/technical087.jpg)
The analysis included descriptive statistics, box plots, regression analysis, histograms and QQ-plots, and a re-run of the resources with and without the trench data.
The descriptive statistics indicated that the mean value of the trench samples is very close to the mean value of matching drill hole samples, with 0.535% V2O5 for the trench versus 0.590% V2O5 for the drill holes. Box plots show a 0.16% higher grade in the upper third quartile of the drill hole assays when compared to the trench assays. A simple regression curve between the paired samples shows poor correlation at Manga with an R2 of 0.128, despite the scatter appearing evenly distributed on either side of the regression line. For Jaky, an R2 of 0.290 is shown, slightly better than Manga. Again, the scatter of the paired data appears evenly distributed on either side of the regression line.
TOC | 17-8 |
|
GREEN GIANT PROJECT TECHNICAL REPORT UPDATE NI 43-101 | |
The probability plot in Figure 17-4 shows that the trench and diamond drill assays populations are very similar. The trench data tended to return higher grades than the drill hole assays below the 70th percentile of the distribution below 0.6% V2O5. This trend is reversed for assays above the 80th percentile of the distribution above 0.7% V2O5, where the drill hole grades indicated higher values, especially between the 0.8% to 1.1% V2O5range. This trend was mirrored on the QQ plots.
Figure 17-4:
Probability Plot Comparing Trench and Drill Data
![[technical088.jpg]](https://capedge.com/proxy/8-K/0001137171-10-000408/technical088.jpg)
PEG concluded from these results that the trench samples will not introduce a significant bias in the resource estimate, especially for grades ranging between 0.5% to 0.8% V2O5. To verify the impact of the trench data on the overall resource, the models were re-interpolated without the trench composites and the results were compared.
At Jaky, the removal of the trench data reduced the global total metal content of the Indicated resources by 7.8% in the oxidation zone and by 0.0% in the primary zone. At the 0.5% V2O5 cut-off, the removal of the trench data reduces the metal content by 1.9% in the oxide layer and 0.0% in the primary zone. PEG noted that the overall change in the metal content is heavily influenced by higher drill hole grades.
TOC | 17-9 |
|
GREEN GIANT PROJECT TECHNICAL REPORT UPDATE NI 43-101 | |
At Manga, the removal of the trench data reduced the global metal content of the Indicated resources by 0.2% in the oxidation layer and increased it by 0.1% in the primary zone. At the 0.5% V2O5 cut-off, the removal of the trench data increased the overall metal content in the oxidation and primary zones by 2.9% and 0.1% respectively. Metal content differences at various cut-off bins are shown in Figure 17-5.
The difference in metal content in the Inferred resources category at Manga could not be accurately evaluated because of the large volume of the resource supported only by trench data, which once removed, significantly altered the statistics.
Figure 17-5:
Metal Content Difference after Removing Trench Data

17.2.3
Capping
A combination of decile analysis and a review of probability plots were used to determine the potential risk of grade distortion from higher-grade assays. A decile is any of the nine values that divide the sorted data into ten equal parts so that each part represents one tenth of the sample or population. In a mining project, high-grade outliers can contribute excessively to the total metal content of the deposit.
TOC | 17-10 |
|
GREEN GIANT PROJECT TECHNICAL REPORT UPDATE NI 43-101 | |
Typically, in a decile analysis, capping is warranted if:
·
the last decile has more than 40% metal
·
the last decile contains more than 2.3 times the metal quantity contained in the penultimate decile the last centile contains more than 10% metal
·
the last centile contains more than 1.75 times the metal quantity contained in penultimate decile.
The decile analysis indicated that grade capping was not warranted for any of the zones. This is not uncommon in these types of deposits where the grade tends to be uniformly distributed with very few outliers.
During the block model validation, the global krige model grade of the Manga deposit was slightly elevated when compared to the average of all composites. Because of concerns with high-grade smearing, a 15 m x 15 m x 15 m search restriction on values above 1.7% V2O5 was added to the interpolation parameters before the model was finalized. This additional parameter allows high-grade values to be retained by the model while restricting their influence to a localized area. Capping statistics are available in Appendix C.
17.3
Composites
Sampling intervals on the Green Giant property average 1.66 m. Sampling at 1.5 m and 3.0 m intervals is common, creating a gap in the sampling length distribution between 1.5 and 3.0 m. The upper third quartile of the sampling length shows a value of 1.5 m. PEG elected to use a composite length of 2.0 m, generating about two data points per block in the 5 m x 5 m x 5 m block matrix selected, while allowing grade variations to be represented.
Assays below detectable limits used half the detection limit. Assays were length-weighted averaged and no grade capping was applied to the raw assay data prior to compositing. Gaps in sampling (if present) were composited at zero grade.
Composite intervals were created down from the collar of the holes toward the hole bottoms within the mineralized wireframes, leaving small remnants at the lower intersections of the wireframes. The compositing methodology restarted the compositing interval at each intersection with the wireframes in the Jaky deposit. No composites were created outside the wireframes in Manga or outside the low-grade shell wireframe in Jaky. The trench composites used the same procedures as the drill hole composites and were appended to the Green Giant composite file.
The methodology employed to create the composite intervals resulted in intervals less than 2.0 m in length. Statistical analysis of these composite remnants indicates that intervals less than 0.5 m in length could be safely eliminated from the dataset without introducing a bias in the remaining composites. A total of 69 composite remnants were eliminated.
TOC | 17-11 |
|
GREEN GIANT PROJECT TECHNICAL REPORT UPDATE NI 43-101 | |
An additional 47 zero (or near zero) grade composites created in the overburden layer were eliminated from the composite file.
The resulting composite file contains a total of 4,423 composites with 75% distributed in Jaky and 23% in Manga. Table 17-4 shows the descriptive composite statistics. Complete composite statistics are provided in Appendix C.
Table 17-4:
Descriptive Statistics for Composites (drill hole and trenches)
| Jaky | Manga | Jaky + Manga | ||
Oxidation | Primary | Oxidation | Primary | ||
Valid Cases | 1,149 | 2,187 | 362 | 725 | 4,423 |
Mean | 0.39 | 0.22 | 0.54 | 0.68 | 0.36 |
Std. Error of Mean | 0.01 | 0.01 | 0.01 | 0.01 | 0.01 |
Variance | 0.12 | 0.07 | 0.07 | 0.10 | 0.12 |
Std. Deviation | 0.34 | 0.27 | 0.27 | 0.31 | 0.34 |
Variation Coefficient | 0.88 | 1.24 | 0.51 | 0.46 | 0.94 |
Rel. V. Coefficient (%) | 2.61 | 2.66 | 2.66 | 1.69 | 1.42 |
Skew | 1.44 | 1.68 | 1.83 | 0.68 | 1.14 |
Kurtosis | 2.94 | 2.62 | 5.73 | 0.92 | 1.40 |
Minimum | 0.00 | 0.00 | 0.07 | 0.06 | 0.00 |
Maximum | 2.46 | 1.55 | 2.02 | 2.32 | 2.46 |
Range | 2.46 | 1.55 | 1.95 | 2.26 | 2.46 |
Sum | 443 | 474 | 196 | 491 | 1,603 |
1st Percentile | 0.00 | 0.00 | 0.11 | 0.13 | 0.00 |
5th Percentile | 0.00 | 0.00 | 0.23 | 0.26 | 0.00 |
10th Percentile | 0.04 | 0.00 | 0.27 | 0.32 | 0.00 |
25th Percentile | 0.13 | 0.00 | 0.35 | 0.42 | 0.08 |
Median | 0.28 | 0.12 | 0.49 | 0.68 | 0.27 |
75th Percentile | 0.56 | 0.30 | 0.64 | 0.87 | 0.57 |
90th Percentile | 0.85 | 0.63 | 0.85 | 1.05 | 0.85 |
95th Percentile | 1.02 | 0.80 | 1.05 | 1.21 | 1.01 |
99th Percentile | 1.51 | 1.14 | 1.71 | 1.54 | 1.39 |
Geom. Mean | - | - | 0.48 | 0.60 | - |
TOC | 17-12 |
|
GREEN GIANT PROJECT TECHNICAL REPORT UPDATE NI 43-101 | |
17.4
Bulk Density
A total of 302 specific gravity (SG) readings were collected on the Green Giant Property averaging 2.50 g/cm3. PEG conducted a statistical analysis of the data provided and concluded that the SG is primarily controlled by the oxidation and primary domain. From the result of the statistical analysis included in Appendix D, as shown in Table 17-5, PEG assigned SG to the wireframe outlining the mineralization.
Table 17-5:
Specific Gravity Used in the Resource Model
Domain | Area | SG (g/cm3) |
Oxide Domain | Jaky Background Outside Wireframe | 2.28 |
Jaky (All Wireframe but excluding J-01) | 2.28 | |
Jaky – J-01 Wireframe | 2.18 | |
Manga Background Outside Wireframe | 2.24 | |
Manga Wireframe | 2.24 | |
Primary Domain | Jaky Background Outside Wireframe | 2.68 |
Jaky (All Wireframe but Excluding J-01) | 2.68 | |
Jaky – J-01 Wireframe | 2.34 | |
Manga Background Outside Wireframe | 2.61 | |
Manga Wireframe | 2.61 |
17.5
Spatial Analysis
17.5.1
Variography
Geostatisticians use a variety of tools to describe the pattern of spatial continuity, or strength of the spatial similarity of a variable with separation distance and direction. The correlogram measures the correlation between data values as a function of their separation distance and direction. If we compare samples that are close together, it is common to observe that their values are quite similar, and the correlation coefficient for closely spaced samples is near 1.0. As the separation between samples increases, there is likely to be less similarity in the values, and the correlogram tends to decrease toward 0.0. The distance at which the correlogram reaches zero is called the “range of correlation,” or simply the “range.” The range of the correlogram corresponds roughly to the more qualitative notion of th e “range of influence” of a sample; it is the distance over which sample values show some persistence or correlation. The shape of the correlogram describes the pattern of spatial continuity. A very rapid decrease near the origin indicates short scale variability. A more gradual decrease moving away from the origin suggests longer-scale continuity.
TOC | 17-13 |
|
GREEN GIANT PROJECT TECHNICAL REPORT UPDATE NI 43-101 | |
Variography was conducted for the Green Giant property using Sage 2001 software. Directional sample correlograms were calculated for V2O5 for Jaky and Manga in the oxide and primary domains along horizontal azimuths of 0, 30, 60, 90, 120, 150, 180, 210, 240, 270, 300, and 330 degrees. For each azimuth, a series of sample correlograms were also calculated at 15° dip increments. Lastly, a correlogram was calculated in the vertical direction. Using the complete suite of correlograms, an algorithm determined the best-fit model. The model is described by the nugget (C0) which was derived using down hole variograms, one structure variance contribution (C1), ranges for the variance contributions, and the model type (traditional exponential). After fitting the variance parameters, the algorithm th en fits an ellipsoid to all ranges from the directional models for each structure. The lengths and orientations of the axes of the ellipsoids give the final models of anisotropy. For the Jaky deposit, the data was filtered on the composites contained within the Jaky-01 wireframe, since it offered the largest and most continuous domain. Variography on the other domains was assumed to be similar to the Jaky-01.
All anisotropy models generated by Sage 2001 were visually inspected in Gems and compared with the expected geological controls on the mineralization.
Table 17-6 shows a summary of the variography results for the domains that returned a conclusive variogram. The traditional exponential range in the tables is defined as Gam(3R) = 0.95 x Sill as defined by the first edition of GSLIB (Deutsch and Journel). Traditionally, the order and rotation parameters are derived from the variography.
Table 17-6:
Variogram Parameters
In general terms, the variogram models were adequate for Jaky. The Manga variogram could use more data points, as it was more difficult to obtain a valid model due in part to the widely spaced grid-drilling pattern. Despite these difficulties, reasonable variograms were obtained for the Jaky and Manga deposits, showing a preferred northeast orientation between 20° to 30° in azimuth at Jaky and 0° to 10° at Manga. Both zones show a moderate to steeply dipping variogram to the northwest of 52° at Jaky and 70° at Manga. The C1 component axis oriented more or less with the mineralized zone at Jaky when plotted in GEMS. At Manga, the orientation was about 10 degree off in strike direction from the true orientation of the zone.
TOC | 17-14 |
|
GREEN GIANT PROJECT TECHNICAL REPORT UPDATE NI 43-101 | |
17.5.2
Search Ellipsoid Dimension and Orientation
The variogram is the key function in geostatistics, as it is used to fit a model of the temporal/spatial correlation of the observed phenomenon, and ultimately sets the weights that will be applied to the samples during the grade interpolation. While it is common to use the variogram modelas a guide to set the search ellipsoids’ range and attitude, the geologist modelling the deposit must consider both the strike and dip of the mineralized horizon and the drill hole spacing and distribution. PEG used the result of the variography as one of the guiding principles for setting the sample-search ellipsoid-dimension.
The first pass was sized to reach at least the next drill section spacing along the main axis of the mineralization as expressed by the variograms. A second and third multiplier was used to set the subsequent search dimensions for Pass 2 and Pass 3, leaving the ratio between the X, Y, and Z-axes consistent with the results of the variography. The maximum range of the third pass search ellipsoid was set to approximately 90% of the sill value on the best exponential “traditional” variogram.
The deposit is very linear in orientation, therefore only one search ellipsoid orientation was necessary.
Table 17-7 lists the final values used in the resource model for the range of the major, semi-major, and minor axes. Table 17-8 lists the search ellipsoids axis orientations. Variography summary and search ellipsoid orientations are available in Appendix E.
TOC | 17-15 |
|
GREEN GIANT PROJECT TECHNICAL REPORT UPDATE NI 43-101 | |
Table 17-7:
Ellipsoid Sample Search Parameters – Range
Sample Search Ellipsoid – Range | Pass 1 | Multiplier | Pass 2 | Multiplier | Pass 3 |
Jaky |
|
|
|
|
|
Range X | 92 | 1.6 | 147 | 1.4 | 206 |
Range Y | 26 | 1.6 | 42 | 1.4 | 58 |
Range Z | 12 | 1.6 | 19 | 1.4 | 27 |
Manga |
|
|
|
|
|
Range X | 90 | 1.4 | 126 | 1.4 | 176 |
Range Y | 53 | 1.4 | 74 | 1.4 | 104 |
Range Z | 20 | 1.4 | 28 | 1.4 | 39 |
Table17-8:
Ellipsoid Sample Search Parameters – Orientation
Sample Search Ellipsoid – Orientation | Jaky | Manga |
Anisotropy angles are defined by Rotation ZXZ |
|
|
Rotation about Z from X towards Y | 66 | 85 |
Rotation about X from Y towards Z | -35 | -68 |
Rotation about Z from X towards Y | 0 | 0 |
17.6
Resource Block Model
Two block models were constructed using Gemcom’s GEMS version 6.2.3™ software. A 5 x 5 x 5 m block size was selected based on mining selectivity considerations and the density of the dataset for Jaky and Manga.
The block models were defined on the project coordinate system (UTM zone 38S, WGS 84datum) with no rotation. Table 17-9 lists the upper southeast corner of the models and is defined on the block edge.
The rock type model was coded by combining the oxide/primary codes of 1,000 and 2,000 respectively with the geology/wireframe model codes 110 to 190 (Table 17-9) to allow control of the interpolation parameters.
TOC | 17-16 |
|
GREEN GIANT PROJECT TECHNICAL REPORT UPDATE NI 43-101 | |
Table 17-9:
Block Model Definition (block edge)
Model Parameters | Jaky | Manga |
Easting (m) | 501,175 | 503,125 |
Northing (m) | 7,336,400 | 7,344,950 |
Top Elevation (m) | 600 | 600 |
Rotation Angle (degrees) | 0 | 0 |
Block Size (X, Y, Z) (m) | 5 x 5 x 5 | 5 x 5 x 5 |
Number of Blocks in the X Direction | 145 | 63 |
Number of Blocks in the Y Direction | 230 | 345 |
Number of Blocks in the Z direction | 70 | 70 |
17.7
Interpolation Plan
Both resource models were created in GEMS using a single-folder setup. At Jaky, the low-grade model was interpolated separately from the high-grade and combined into a final grade model by weighting the V2O5 tenor based on the percentage of the block occupied by the high-grade according to the following block manipulation equation:
Final V2O5grade = ((HG x Perc) + (LG x (100 – Perc)))/100
where
HG = V2O5 grade inside the high-grade wireframe
LG = V2O5 grade inside the low-grade envelope
Perc = Percentage of the block inside the high-grade wireframe
The grade model was interpolated using ordinary kriging, with inverse distance square and nearest neighbour check models.
The interpolation was carried out in a multi-pass approach, with an increasing search dimension coupled with decreasing sample restriction.
Pass 1
uses an ellipsoid search with six samples minimum, and 15 maximum. A maximum of five samples per hole was imposed on the data selection, forcing a minimum of two holes.
TOC | 17-17 |
|
GREEN GIANT PROJECT TECHNICAL REPORT UPDATE NI 43-101 | |
Pass 2
uses an ellipsoid search with four samples minimum, and 15 maximum. A maximum of three samples per hole was imposed on the data selection, forcing a minimum of two holes.
Pass 3
uses an ellipsoid search with two samples minimum, and 15 maximum. A maximum of three samples per hole was imposed on the data selection, allowing a block to be interpolated by a single hole.
On the Jaky deposit, boundaries between the high-grade wireframe and the low-grade envelope were treated as hard boundaries, not allowing samples from one domain to be used with the samples of the other domain. For both Jaky and Manga, the boundary between the oxidation and primary domain was treated as a soft boundary, allowing samples from the oxide to use samples from the primary domain (and vice versa) in the most restrictive Pass 1 interpolation only. For Passes 2 and 3 the boundary was considered hard. No blocks were interpolated unrestricted, outside the wireframe.
17.8
Mineral Resource Classification
Several factors are considered in the definition of a resource classification:
·
Canadian Institute of Mining (CIM) requirements and guidelines
·
experience with similar deposits
·
spatial continuity
·
confidence limit analysis
·
geology.
No environmental, permitting, legal, title, taxation, socioeconomic, marketing, or other relevant issues are known to the author that may currently affect the estimate of mineral resources. Mineral reserves can only be estimated on the basis of an economic evaluation that is used in a prefeasibility or feasibility study of a mineral project. Thus, no reserves have been estimated. As per NI 43-101, mineral resources, which are not mineral reserves, do not have demonstrated economic viability.
Two confidence categories exist in the model. The usual CIM guidelines of Indicated and Inferred classes are Coded 2 and 3, respectively.
Typically, confidence level for a grade in the block model is reduced with increases in the search ellipsoid size, along with diminishing restrictions on the number of samples used for the grade interpolation. This is essentially controlled via the pass number of the interpolation plan described in the previous section. A common technique is to categorize a model based on the pass number and distance to the closest sample.
TOC | 17-18 |
|
GREEN GIANT PROJECT TECHNICAL REPORT UPDATE NI 43-101 | |
Variograms indicated that at 97% of the sill value, the range for Jaky and Manga is close to 220 m on strike, and in the down-dip direction close to 70 m at Jaky and 125 at Manga. At 60% of the sill value, the range is much shorter, showing approximately 45 m and 54 m for Jaky and Manga, respectively. For classification purposes, PEG chose a distance to the closest sample of less than 75 m for the Indicated category, and a maximum distance of up to 206 m and 176 m for Jaky and Manga respectively for the Inferred category.
Resource classification was also affected by the pass number, where a block would not be classified as Indicated if the interpolation used only one hole, unless the distance to the closest sample was less than 15 m.
Table 17-10 shows a summary of the classification parameters used for the Green Giant resource statement.
Table 17-10:
Classification Parameters
Deposit | Measured | Indicated | Inferred |
Jaky | Not used | < 15 m distance to closest composite, with blocks interpolated from 1 or more holes. (Passes 1, 2, or 3) OR < 75 m distance to closest composite, with blocks interpolated with a minimum of 2 or more holes (Passes 1 and 2) | ≥75 m and < 206 m distance to closest composite, with blocks interpolated from 1 or more holes. (Passes 1, 2, or 3) |
Manga | Not used | < 15 m distance to closest composite, with blocks interpolated from 1 or more holes. (Passes 1, 2, or 3) OR < 75 m distance to closest composite, with blocks interpolated with a minimum of 2 or more holes (Passes 1 and 2) | ≥ 75 m and < 176 m distance to closest composite, with blocks interpolated from 1 or more holes. (Passes 1, 2, or 3) |
Based on the criteria outlined in Table 17-10, approximately 55% of the blocks estimated on the Jaky deposit are Indicated resources. Inferred resources accounted for 37% of the total volume, with 8% of the blocks left uninterpolated. At Manga, approximately 76% of the blocks estimated are Indicated resources. Inferred resources accounted for 21% of the total volume, with 3% of the blocks left uninterpolated. No resources were classified as Measured.
TOC | 17-19 |
|
GREEN GIANT PROJECT TECHNICAL REPORT UPDATE NI 43-101 | |
17.9
Mineral Resource Tabulation
Effective May 11, 2010, PEG has estimated the mineral resources for the Green Giant property in Madagascar. The mineral deposits on this property have been divided into two separate zones, which are referred to as the Jaky and Manga deposits. This mineral resource estimate utilized approximately 9,900 m of diamond drill hole data and was supplemented by approximately 3,600 m of trench data from the 2008 and 2009 exploration programs.
The Jaky and Manga resource estimate comprises Indicated and Inferred resources reported as vanadium pentoxide mineralization at a base case cut-off grade of 0.5% V2O5.
The method employed to select the base case cut-off grades was to consider the mineralogical characteristics, envisioned mining methods, and comparable vanadium projects worldwide. Energizer Resources is currently conducting metallurgical testing on samples from the Green Giant property. The results from this testing are not currently available, but will be incorporated into a subsequent resource statement and economic evaluation. Rounding of tonnes as required by reporting guidelines in all tables below may result in apparent differences between tonnes, grades, and contained metal.
The vanadium deposits on the Green Giant property are split into two separate categories: oxide and primary. The following resource values were determined at a 0.5% V2O5 cut-off. Within the oxide and primary zones of the Jaky and Manga deposits, the total Indicated resource (Table 17-11) is 21.74 Mt at 0.759% V2O5, containing 363.8 Mlb of vanadium pentoxide. The total Inferred resource (Table 17-11) is 4.15 Mt at a grade of 0.655% V2O5, containing 59.8 Mlb of vanadium pentoxide.
Table 17-11:
Indicated Resources for the Green Giant Property at 0.5%V2O5 Cut-off
Category | Deposit | Tonnage | V2O5 | V2O5 |
Indicated | Jaky | 5.4 | 0.724 | 86.4 |
Manga | 16.3 | 0.770 | 277.4 | |
Jaky + Manga | 21.7 | 0.759 | 363.8 | |
Inferred | Jaky | 0.7 | 0.619 | 9.0 |
Manga | 3.5 | 0.662 | 50.9 | |
Jaky + Manga | 4.1 | 0.655 | 59.9 |
Within the oxide and primary zones of the Jaky deposit, the total Indicated resource is 5.4 Mt at 0.724% V2O5, containing 86.4 Mlb of vanadium pentoxide. The total Inferred resource is 0.7 Mt at a grade of 0.619 % V2O5, containing 9.0 Mlb of vanadium pentoxide.
TOC | 17-20 |
|
GREEN GIANT PROJECT TECHNICAL REPORT UPDATE NI 43-101 | |
The Manga resource is larger than Jaky. Within the oxide and primary zones of the Manga deposit, the total Indicated resource is 16.3 Mt at 0.770% V2O5, containing 277.4 Mlb of vanadium pentoxide. The total Inferred resource is 3.5 Mt at a grade of 0.662% V2O5, containing 50.9 Mlb of vanadium pentoxide.
Tables 17-12 and 17-13 show summaries of the mineral resource estimates for Jaky at various cut-off grades in the Indicated and Inferred categories, respectively. These findings have also been illustrated in Figures 17-6 and 17-7, respectively.
Table17-12:
Jaky Indicated Resources
Category | V2O5 Cut-off | Volume | Density | Tonnage | V2O5 | V2O5 |
Oxidation Zone | > 1.0 | 0.1 | 2.18 | 0.2 | 1.172 | 5.8 |
> 0.9 | 0.2 | 2.18 | 0.4 | 1.074 | 9.3 | |
> 0.8 | 0.3 | 2.18 | 0.6 | 0.987 | 14.0 | |
> 0.7 | 0.5 | 2.18 | 1.1 | 0.884 | 21.9 | |
> 0.6 | 0.8 | 2.18 | 1.8 | 0.793 | 32.0 | |
> 0.5 | 1.2 | 2.18 | 2.6 | 0.720 | 41.4 | |
> 0.4 | 1.61 | 2.18 | 3.5 | 0.649 | 50.5 | |
> 0.3 | 2.05 | 2.19 | 4.5 | 0.586 | 57.8 | |
> 0.2 | 2.64 | 2.20 | 5.8 | 0.508 | 64.9 | |
Primary Zone | > 1.0 | 0.10 | 2.34 | 0.2 | 1.066 | 5.3 |
> 0.9 | 0.2 | 2.34 | 0.5 | 0.998 | 11.9 | |
> 0.8 | 0.4 | 2.34 | 0.9 | 0.939 | 18.2 | |
> 0.7 | 0.6 | 2.34 | 1.4 | 0.867 | 27.3 | |
> 0.6 | 0.8 | 2.34 | 2.0 | 0.807 | 34.9 | |
> 0.5 | 1.2 | 2.36 | 2.8 | 0.729 | 45.1 | |
> 0.4 | 1.7 | 2.40 | 4.1 | 0.639 | 57.9 | |
> 0.3 | 2.5 | 2.43 | 6.0 | 0.548 | 72.1 | |
> 0.2 | 3.57 | 2.47 | 8.8 | 0.450 | 87.6 |
TOC | 17-21 |
|
GREEN GIANT PROJECT TECHNICAL REPORT UPDATE NI 43-101 | |
Table17-13:
Jaky Inferred Resources
Category | V2O5 Cut-off | Volume | Density | Tonnage | V2O5 | V2O5 |
Oxidation Zone | > 1.0 | 0.00 | 2.18 | 0.0 | 1.059 | 0.0 |
> 0.9 | 0.00 | 2.18 | 0.0 | 0.970 | 0.1 | |
> 0.8 | 0.00 | 2.18 | 0.0 | 0.894 | 0.2 | |
> 0.7 | 0.01 | 2.18 | 0.0 | 0.778 | 0.5 | |
> 0.6 | 0.05 | 2.18 | 0.1 | 0.690 | 1.6 | |
> 0.5 | 0.08 | 2.18 | 0.2 | 0.638 | 2.4 | |
> 0.4 | 0.11 | 2.19 | 0.3 | 0.578 | 3.2 | |
> 0.3 | 0.20 | 2.21 | 0.4 | 0.478 | 4.6 | |
> 0.2 | 0.36 | 2.23 | 0.8 | 0.368 | 6.5 | |
Primary Zone | > 1.0 | 0.00 | 2.34 | 0.0 | 1.043 | 0.1 |
> 0.9 | 0.01 | 2.34 | 0.0 | 0.984 | 0.3 | |
> 0.8 | 0.02 | 2.34 | 0.0 | 0.879 | 0.7 | |
> 0.7 | 0.04 | 2.35 | 0.1 | 0.810 | 1.6 | |
> 0.6 | 0.08 | 2.37 | 0.2 | 0.719 | 2.9 | |
> 0.5 | 0.20 | 2.39 | 0.5 | 0.612 | 6.6 | |
> 0.4 | 0.43 | 2.42 | 1.0 | 0.525 | 11.9 | |
> 0.3 | 0.74 | 2.45 | 1.8 | 0.447 | 18.0 | |
> 0.2 | 1.83 | 2.55 | 4.7 | 0.314 | 32.3 |
TOC | 17-22 |
|
GREEN GIANT PROJECT TECHNICAL REPORT UPDATE NI 43-101 | |
Figure 17-6:
Jaky Indicated Resources Grade-Tonnage Curve
![[technical092.gif]](https://capedge.com/proxy/8-K/0001137171-10-000408/technical092.gif)
Figure 17-7:
Jaky Inferred Resource Grade-Tonnage Curve
![[technical094.gif]](https://capedge.com/proxy/8-K/0001137171-10-000408/technical094.gif)
TOC | 17-23 |
|
GREEN GIANT PROJECT TECHNICAL REPORT UPDATE NI 43-101 | |
Tables 17-14 and 17-15 show summaries of the mineral resource estimates for Manga at various cut-off grades in the Indicated and Inferred category, respectively. These findings have also been illustrated in Figures 17-8 and 17-9, respectively.
Table17-14:
Manga Indicated Resources
Category | V2O5 Cut-off | Volume | Density | Tonnage | V2O5 | V2O5 |
Oxidation Zone | > 1.0 | 0.0 | 2.24 | 0.1 | 1.159 | 2.7 |
> 0.9 | 0.1 | 2.24 | 0.2 | 1.040 | 5.2 | |
> 0.8 | 0.3 | 2.24 | 0.7 | 0.905 | 14.4 | |
> 0.7 | 0.7 | 2.24 | 1.5 | 0.822 | 27.8 | |
> 0.6 | 1.1 | 2.24 | 2.6 | 0.753 | 42.3 | |
> 0.5 | 1.5 | 2.24 | 3.5 | 0.700 | 53.3 | |
> 0.4 | 2.06 | 2.24 | 4.6 | 0.636 | 64.8 | |
> 0.3 | 2.46 | 2.24 | 5.5 | 0.590 | 71.7 | |
> 0.2 | 2.57 | 2.24 | 5.8 | 0.577 | 73.2 | |
Primary Zone | > 1.0 | 0.49 | 2.61 | 1.3 | 1.128 | 32.0 |
> 0.9 | 1.1 | 2.61 | 2.8 | 1.028 | 63.5 | |
> 0.8 | 2.2 | 2.61 | 5.8 | 0.935 | 119.6 | |
> 0.7 | 3.4 | 2.61 | 8.9 | 0.871 | 170.8 | |
> 0.6 | 4.2 | 2.61 | 11.1 | 0.828 | 202.1 | |
> 0.5 | 4.9 | 2.61 | 12.9 | 0.789 | 224.0 | |
> 0.4 | 5.5 | 2.61 | 14.5 | 0.752 | 239.7 | |
> 0.3 | 6.1 | 2.61 | 15.8 | 0.718 | 250.5 | |
> 0.2 | 6.13 | 2.61 | 16.0 | 0.714 | 251.6 |
TOC | 17-24 |
|
GREEN GIANT PROJECT TECHNICAL REPORT UPDATE NI 43-101 | |
Table17-15:
Manga Inferred Resources
Category | V2O5 Cut-off | Volume | Density | Tonnage | V2O5 | V2O5 |
Oxidation Zone | > 1.0 | 0.00 | 0.00 | 0.0 | 0.000 | 0.0 |
> 0.9 | 0.00 | 2.24 | 0.0 | 0.951 | 0.2 | |
> 0.8 | 0.03 | 2.24 | 0.1 | 0.839 | 1.1 | |
> 0.7 | 0.11 | 2.24 | 0.2 | 0.773 | 4.1 | |
> 0.6 | 0.34 | 2.24 | 0.8 | 0.696 | 11.6 | |
> 0.5 | 0.80 | 2.24 | 1.8 | 0.619 | 24.4 | |
> 0.4 | 1.16 | 2.24 | 2.6 | 0.569 | 32.7 | |
> 0.3 | 1.31 | 2.24 | 2.9 | 0.544 | 35.2 | |
> 0.2 | 1.34 | 2.24 | 3.0 | 0.538 | 35.5 | |
Primary Zone | > 1.0 | 0.02 | 2.61 | 0.0 | 1.089 | 0.9 |
> 0.9 | 0.06 | 2.61 | 0.2 | 0.978 | 3.3 | |
> 0.8 | 0.16 | 2.61 | 0.4 | 0.891 | 8.4 | |
> 0.7 | 0.32 | 2.61 | 0.8 | 0.821 | 15.0 | |
> 0.6 | 0.46 | 2.61 | 1.2 | 0.769 | 20.2 | |
> 0.5 | 0.65 | 2.61 | 1.7 | 0.706 | 26.5 | |
> 0.4 | 0.73 | 2.61 | 1.9 | 0.679 | 28.4 | |
> 0.3 | 0.75 | 2.61 | 2.0 | 0.670 | 28.9 | |
> 0.2 | 0.75 | 2.61 | 2.0 | 0.669 | 29.0 |
TOC | 17-25 |
|
GREEN GIANT PROJECT TECHNICAL REPORT UPDATE NI 43-101 | |
Figure 17-8:
Manga Indicated Resources Grade-Tonnage Curve
![[technical096.gif]](https://capedge.com/proxy/8-K/0001137171-10-000408/technical096.gif)
Figure 17-9:
Manga Inferred Resources Grade-Tonnage Curve
![[technical098.gif]](https://capedge.com/proxy/8-K/0001137171-10-000408/technical098.gif)
TOC | 17-26 |
|
GREEN GIANT PROJECT TECHNICAL REPORT UPDATE NI 43-101 | |
17.10
Block Model Validation
The Jaky and Manga grade models were validated by four methods:
·
visual comparison of colour-coded block model grades with composite grades on section plots
·
comparison of the global mean block grades for ordinary kriging, inverse distance, nearest neighbour models, composite, and raw assay grades
·
comparison using grade profiles to investigate local bias in the estimate
·
naïve cross-validation test.
17.10.1
Visual Comparison
The visual comparison of block model grades with composite grades showed a reasonable correlation between values. No significant discrepancies were apparent from the plans and sections reviewed. The orientations of the estimated grades on sections more or less followed the projection angles defined by the search ellipsoid. Representative drill sections are shown in Appendix F.
17.10.2
Global Comparisons
Table 17-16 shows the grade statistics for the raw assays, composites, ordinary kriging, nearest neighbour and inverse distance models. Figure 17-10 shows the differences. At Jaky, statistics for the vanadium pentoxide composite mean grade compare well to raw assay grade, with a normal reduction in value due to smoothing related to volume variance, and also partly due to the addition of zero grade composite assigned to unsampled intervals during the compositing process. At Manga, vanadium pentoxide grade saw a minor increase in value between the composite and the interpolated grade model possibly indicating high-grade smearing, which was investigated by PEG. The abnormality was deemed to be related to a number of high-grade V2O5 assays. PEG elected to re-run the model with a high-grade search restriction to te mper the smearing of these high-grade values. The new model performed slightly better and was used for the final resource statement following the swath plot validation described in Section 17.10.3.
For both Jaky and Manga, the grade of the nearest neighbour, inverse distance, and ordinary kriging at 0.00 cut-off are all very close to each other, showing that no global bias was introduced from the interpolation method used.
TOC | 17-27 |
|
GREEN GIANT PROJECT TECHNICAL REPORT UPDATE NI 43-101 | |
Table17-16:
Global Comparisons – V2O5Grade at 0.00 Cut-off
Methodology | Jaky | Manga |
Raw Assays | 0.567 | 0.642 |
Composite | 0.558 | 0.631 |
Nearest Neighbour | 0.471 | 0.650 |
Inverse Distance | 0.484 | 0.650 |
Ordinary Kriging | 0.476 | 0.650 |
Figure 17-10:
Green Giant Property – Global Grade Comparison at 0.00 Cut-off
![[technical100.gif]](https://capedge.com/proxy/8-K/0001137171-10-000408/technical100.gif)
17.10.3
Local Comparisons – Grade Profile
The comparison of the grade profiles (swath plots) of the raw assays, composites, and estimated grades allows for a visual verification of an over- or under-estimation of the block grades at the global and local scales. A qualitative assessment of the smoothing and variability of the estimates can also be observed from the plots. The output consists of three swath plots generated at 25 m intervals in the X-axis, 100 m in the Y-axis, and 24 m vertically for Jaky. At Manga, output consists of three swath plots generated at 27 m intervals in the X direction, 101 m in the Y direction, and 23 m vertically.
TOC | 17-28 |
|
GREEN GIANT PROJECT TECHNICAL REPORT UPDATE NI 43-101 | |
The kriged estimate should be smoother than the nearest neighbour estimate, thus the nearest neighbour estimate should fluctuate around the kriged estimate on the plots or display a slightly higher grade. The composite line is generally located between the assay and the interpolated grade. A model with good composite distribution should show very few crossovers between the composite and the interpolated grade line on the plots. In the fringes of the deposits, as composite data points become sparse, crossovers are often unavoidable. The swath size also controls this effect to a certain extent; if the swaths are too small then fewer composites will be encountered, which usually results in a very erratic line on the plots.
Due to the orientation of the Green Giant deposit, the swath plots in the Y-axes and Z-axes should show the best results for this model.
In general, the swath plots show good agreement, with all three methodologies showing no major local bias, except at Manga between 7,345,900 m and 7,346,100 m where the composite line is located below the interpolated grade. This specific area of the model was visually inspected on both plans and sections with the composite and raw assays and no evidence of grade smearing was apparent. The trend observed was attributed as an artefact of the drilling density. In this specific area of the model, the holes in the primary zone average higher grade than the trench sample and the two holes located in the oxidation zone, which reduced the overall average of the composite grade. Grade profiles for V2O5Y-axis are presented in Figures 17-11 and 17-12. The remaining profiles are included in Appendix G.
Figure 17-11:
Y-Axis Swath Plots at Jaky
![[technical102.gif]](https://capedge.com/proxy/8-K/0001137171-10-000408/technical102.gif)
TOC | 17-29 |
|
GREEN GIANT PROJECT TECHNICAL REPORT UPDATE NI 43-101 | |
Figure 17-12:
Y Axis Swath Plots at Manga
![[technical104.gif]](https://capedge.com/proxy/8-K/0001137171-10-000408/technical104.gif)
17.10.4
Naïve Cross-Validation Test
A comparison of the average grade of the composites within a block with the estimated grade of that block provides an assessment of the estimation process close to measured data. Pairing of these grades on a scattered plot gives a statistical valuation of the estimates. This methodology differs from “Jack Knifing,” which replaces a composite with a pseudo-block at the same location. Jack knifing evaluates and compares the estimated grade of the pseudo-block against that of the composite grade.
It is anticipated that the estimated block grades should be similar to the composited grades within the block, without being exactly the same value.
A high correlation coefficient indicates satisfactory results in the interpolation process, while a medium to low correlation coefficient indicates larger differences in the estimates, and may suggest a further review of the interpolation process, or might be simply related to low data density. Results from the pairing of the composited and estimated grades within blocks pierced by a drill hole are presented in Figures 17-13 and 17-14 for Jaky and Manga, respectively. The R2value at Jaky is 0.920 (maximum 1) indicating a great fit.
At Manga, the R2value is lower than at Jaky, but is still good at 0.869.
TOC | 17-30 |
|
GREEN GIANT PROJECT TECHNICAL REPORT UPDATE NI 43-101 | |
Figure 17-13:
Naïve Cross Validation Test Results at Jaky

Figure 17-14:
Naïve Cross Validation Test Results at Manga

TOC | 17-31 |
|
GREEN GIANT PROJECT TECHNICAL REPORT UPDATE NI 43-101 | |
18
OTHER RELEVANT DATA AND INFORMATION
The author is not aware of any other information on the properties that would affect their interpretations or conclusions regarding the subject properties.
TOC | 18-1 |
|
GREEN GIANT PROJECT TECHNICAL REPORT UPDATE NI 43-101 | |
19
ADDITIONAL NEEDS FOR DEVELOPMENT AND PRODUCTION PROPERTIES
This item does not apply to the Green Giant Project at this time.
TOC | 19-1 |
|
GREEN GIANT PROJECT TECHNICAL REPORT UPDATE NI 43-101 | |
20
INTERPRETATION AND CONCLUSIONS
The Green Giant Project is located in south-central Madagascar, 145 km southeast of the city of Toliara, in the Tulear region/Fotadrevo. The property can be accessed through an extensive network of paved and/or gravel roads from southeastern Madagascar’s administrative centre, Toliara. Since the 2008 program, Energizer constructed an all-weather airstrip at Fotadrevo, and the property is now accessible year-round by air using private aircraft out of Antananarivo.
The project is centred on UTM coordinates 510,000 E 7,350,000 N (UTM WGS 84) and comprises 36 individual “old style” squares.
The geology of the basement of Madagascar is a complex mélange of intercontinental tectonic blocks made up of ancient poly-deformed high-grade metamorphic rocks and later igneous intrusions. The tectonic and metallogenic framework of the basement of Madagascar has been subdivided into four blocks. The Bekily Block, within which the Green Giant project lies, is situated in the southern part of the country and is thought to be of Proterozoic age. The block is dominated by high-grade metamorphism and is bound by several prominent shear zones. The Green Giant Property is situated within the NNE striking Ampanihy shear zone.
The Green Giant project is underlain by supracrustal and plutonic rocks of Late Neoproterozoic age that are metamorphosed at upper amphibolite facies and deformed with upright NNE-trending structures. The supracrustal rocks involve migmatitic (± biotite, garnet) quartzofeldspathic gneiss, marble, chert, quartzite, and amphibolite gneiss. The metaplutonic rocks include migmatitic (± hornblende/diopside, biotite, garnet) feldspathic gneiss of monzodioritic to syenitic composition, biotite granodiorite, and leucogranite.
Vanadium occurs in several mineral phases including a high V-content roscoelite, a low V-content roscoelite, a V-bearing clay, V-rutile, a FE-V-Ti oxide, a V-Ti oxide, and two types of Fe-V oxides. With the exception of the roscoelite, the mineralization is not discernible to the naked eye and requires the use of analytical methods to identify.
Energizer completed initial airborne and ground-based exploration on the Green Giant project in Madagascar with the intent of evaluating the potential of the property to host Volcanogenic Massive Sulphide (VMS) mineralization. When targets were drill tested in 2007, no significant base metal mineralization was encountered, but Taiga did encounter a number of zones with vanadium and other anomalous concentrations of multi-elements.
The discovery of potentially economic vanadium mineralization on the property changed the focus of the diamond-drilling program. Through a combination of prospecting, ground-based scintillometer surveying, and analysis of airborne radiometric survey data, five extensive vanadium-bearing trends were identified over the course of the 2008 exploration program. These vanadiferous trends are believed to have formed in a black shale or paleo-roll-front environment before being subjected to regional granulite facies metamorphism.
TOC | 20-1 |
|
GREEN GIANT PROJECT TECHNICAL REPORT UPDATE NI 43-101 | |
The 2009 trenching program was designed to test further the surficial extent of the recently discovered vanadium zones, to pinpoint the areal extent of the vanadium trends at surface, and provide information on the vanadium mineralization in the oxidized zone above known subsurface vanadium trends.
The early 2009 trench data confirms the vanadium mineralization identified during the 2008 drill program. Both the Jaky and Mainty Zones were found to extend at surface for over 1 km in length each, with the Jaky Zone having a width in excess of 200 m, while the Mainty Zone exceeds widths of 100 m. Based upon the encouraging results of the early trenching program, Energizer followed up with additional trenching and a diamond drill program targeting the Jaky and Manga deposits in late 2009.
Preliminary metallurgical testing on sample reject material indicates that the silicate and oxide mineralization types are not refractory, and that vanadium can be extracted under acid attack. The material tested was primarily silicate in nature; however, for the one oxide sample tested the extractability of vanadium was somewhat less than for silicate material. Further metallurgical study is required to establish the practicability of vanadium extraction from both types of mineralization.
A total of 87 drill holes and 140 trenches existed in the Energizer database prior to the resource estimation. Of this data, 62 holes were used in the resource estimate, along with 19 surface trenches.
PEG performed data verification through a site visit, the collection of independent character samples, and a database audit prior to mineral resource estimation. PEG validated 33% of the entire assay database and found no errors.
A total of 302 specific gravity (SG) measurements were collected on the Green Giant Property, averaging 2.50 g/cm3. Following a statistical analysis of the data provided, PEG concluded that the SG is primarily controlled by the oxidation and primary domains.
Mineral resources at the Green Giant Property were classified using logic consistent with the CIM definitions referred to in NI 43-101 guidelines. At Jaky and Manga, the mineralization, density, and position of the drill holes satisfies sufficient criteria to be classified in the Indicated and Inferred categories. This independent mineral resource estimate and review by PEG supports the May 11, 2010, disclosure by Energizer of the mineral resource statements for the Jaky and Manga deposits.
TOC | 20-2 |
|
GREEN GIANT PROJECT TECHNICAL REPORT UPDATE NI 43-101 | |
21
RECOMMENDATIONS
The property merits an aggressive exploration program consisting of exploratory and infill diamond drilling over vanadium-bearing zones identified by diamond drilling in 2008 and 2009, and in trenching completed in the first half of 2009. Following the completion of the mineral resource estimates of the deposit, and assuming a possible large-scale open pit scenario, PEG recommends the following:
·
Future drill campaigns should focus on the following areas:
-
PEG believes that the drilling done near the surface is currently sufficient for delineating a sizeable open pit with the majority of material in the Indicated category. The drill program should be delineated with a drill spacing of 100 m in a diamond pattern to define additional inferred resources, with the main goal of the program to discover the true strike length of both deposits and delineate additional tonnes that can be included in a preliminary economic assessment.
-
The resource model of the Manga deposit between sections 46200N and 46600N and between sections 44900N and 45500N is currently supported mainly by trench data. PEG consider these areas as high priority targets for diamond drilling that should be conducted in Phase I of the exploration program.
-
Energizer should also focus on extending the resources on the Manga deposit north of section 46600N and south of section 44900N with additional drilling and trenching. At Jaky, the deposit appears to be closed to the north; therefore, PEG recommends additional drilling and trenching south of section 36400N.
·
Energizer should continue the trenching program since the assay from the trenches provides valuable information, especially in the oxidation zone, which is more difficult and expensive to collect using drill data.
·
Collection of SG data should be incorporated in the future drill program. SG determination should be carried out automatically at a rate of one sample every 5 m. The SG data collection should also incorporate waste rocks for those areas that are likely to be within the reach of an open pit around the perimeter of the deposit.
·
As part of the next drill campaign, PEG recommends Energizer continue with the collection of geotechnical data in preparation for a preliminary economic assessment study.
·
In addition to the normal data collected during the drilling campaign, it is recommended to continue recording the oxide/fresh rock contact down hole in order to profile this boundary for any future resource evaluation.
TOC | 21-1 |
|
GREEN GIANT PROJECT TECHNICAL REPORT UPDATE NI 43-101 | |
·
PEG also recommends using a down-hole geophysical instrument in order to quantify the graphitic content of the rock in preparation for a new statistical analysis of the deposit. If this information is found to be useful in the domain definition of the resource, the program can be integrated into the standard core logging procedures and expanded to include all accessible holes from the 2008-2009 drill program.
Following the site visit, audit of the project database, and review of the QA/QC program, PEG recommends the following:
·
Energizer should re-submit a selected suite of samples using fusion-XRF analysis instead of the current ICP-OES procedure done by Genalysis, in order to verify the high failure rate of the low-grade vanadium standards and assess the impact of the analytical procedure with vanadium grades ranging from 0.2% to 0.8% V2O5. The samples should be submitted to a secondary laboratory not previously used by Energizer.
·
It is also recommended that Energizer modify the insertion of blank samples into the sample stream, it is preferred that samples be inserted following samples that return high-grade vanadium from the XFR analyzer.
·
Coarse rejects and pulps from earlier assays should be inserted in the sample stream with a new tag number in order to incorporate a blind coarse and pulp duplicate procedure into the QA/QC protocol. This recommendation assumes that rejects and pulp samples are shipped back from the laboratory in a timely fashion. This additional protocol is optional, and should be considered on larger drill programs. Obviously, the additional cost of adding this procedure to the QA/QC program should be weighed against the benefit obtained.
The economic potential of the Green Giant project rests upon the ability to extract vanadium using reasonable, potentially economic parameters. The Company is encouraged to carry out further larger sample tests and more complete metallurgical testing of vanadium ores to establish the technological and economic parameters of vanadium processing. The goal of this work is to identify a potentially economic processing method to extract vanadium from both the silicate and oxide ore types that are known to exist on the property. Given that little is currently known regarding the amenability of oxide material for processing, the Company is advised to treat primary material as a priority for study.
Given that the project is looking increasingly more substantial, the Company is advised to begin the collection of weather, environmental, and socioeconomic data, which would be required in any engineering and socioeconomic prefeasibility studies. In terms of weather, at least two years of complete year-round data is required to establish climatic baselines. In areas where mineralization comes in close contact to habitation, the Company is advised to set up liaison with local civic groups, and at the earliest possible opportunity complete a local census to establish population levels.
TOC | 21-2 |
|
GREEN GIANT PROJECT TECHNICAL REPORT UPDATE NI 43-101 | |
21.1
Proposed Budget
Table 21-1 and Figure 21-1 show the proposed data drill plan targeting resource definition on the Manga deposit. Six holes are targeting the southern extension of the Manga deposit currently defined only by trench samples. Eleven holes are designed to extend the resources in a northerly direction, and three holes target the down-dip extension of existing resources.
A total of 4,000 m is budgeted at an all-in cost of US$115.00/m excluding camp costs, travel, and corporate or other head office overhead. Total costs for the program including assay charges and contingency are US$736,000, as shown in Table 21-2.
Table 21-1:
Drill Hole Plan
Hole_ID | Easting | Northing | Length | Azimuth | Dip | Target |
10-01 | 502975 | 7345200 | 250 | 90 | -45 | Southern extension - addition to resource |
10-02 | 503000 | 7345900 | 325 | 90 | -45 | Down-dip extension to resource |
10-03 | 503025 | 7346200 | 300 | 90 | -45 | Northern down-dip extension to resource |
10-04 | 503050 | 7346100 | 300 | 90 | -45 | Down-dip extension to resource |
10-05 | 503075 | 7345400 | 200 | 90 | -45 | Southern extension - addition to resource |
10-06 | 503075 | 7346300 | 300 | 90 | -45 | Northern down-dip extension to resource |
10-07 | 503125 | 7345500 | 150 | 90 | -45 | Down-dip extension to resource |
10-08 | 503125 | 7345300 | 175 | 90 | -45 | Southern extension - addition to resource |
10-09 | 503125 | 7345100 | 175 | 90 | -45 | Southern extension - addition to resource |
10-10 | 503125 | 7345200 | 175 | 90 | -45 | Southern extension - addition to resource |
10-11 | 503125 | 7346300 | 250 | 90 | -45 | Northern down-dip extension to resource |
10-12 | 503200 | 7345400 | 100 | 90 | -45 | Southern extension - addition to resource |
10-13 | 503200 | 7346200 | 175 | 90 | -45 | Northern extension to resource |
10-14 | 503225 | 7346700 | 250 | 90 | -45 | Northern extension to resource |
10-15 | 503250 | 7346400 | 200 | 90 | -45 | Northern extension to resource |
10-16 | 503300 | 7346500 | 150 | 90 | -45 | Northern extension to resource |
10-17 | 503300 | 7346800 | 150 | 90 | -45 | Northern extension to resource + Twin TH-08-08 |
10-18 | 503300 | 7346600 | 125 | 90 | -45 | Northern extension to resource |
10-19 | 503325 | 7346400 | 150 | 90 | -45 | Northern extension to resource |
10-20 | 503375 | 7346700 | 100 | 90 | -45 | Northern extension to resource |
TOC | 21-3 |
|
GREEN GIANT PROJECT TECHNICAL REPORT UPDATE NI 43-101 | |
Figure 21-1:
Drill Hole Plan
![[technical120.gif]](https://capedge.com/proxy/8-K/0001137171-10-000408/technical120.gif)
TOC | 21-4 |
|
GREEN GIANT PROJECT TECHNICAL REPORT UPDATE NI 43-101 | |
Table 21-2 outlines the expected cost of US$1,202,000 for the recommended program.
Table 21-2:
Exploration Budget
Category | Unit Cost | Total Cost |
Drilling (all up) - 4,000 m | $115/m | 460,000 |
Assay cost - 3,000 samples | $50 | 150,000 |
Report writing | - | 30,000 |
Contingency (15%) | - | 96,000 |
Total | - | 736,000 |
TOC | 21-5 |
|
GREEN GIANT PROJECT TECHNICAL REPORT UPDATE NI 43-101 | |
22
CERTIFICATES OF QUALIFIED PERSONS
22.1
Todd McCracken, P.Geo.
I, Todd McCracken, P.Geo., of Sudbury, Ontario, do hereby certify that as one of the authors of this updated technical report titled “National Instrument 43-101 (NI 43-101) Resource Estimate Technical Report for the Green Giant Vanadium Project, Fotadrevo, Province of Toliara, Madagascar,” dated June 24, 2010, I hereby make the following statements:
·
I am a Senior Geologist withWardrop Engineering with a business address at 101-957 Cambrian Heights, Sudbury, Ontario, P3C 5M6 Canada.
·
I am a graduate of University of Waterloo (B.Sc. Hons., 1992).
·
I am a member in good standing of the Association of Professional Geoscientists of Ontario (Registration #0631).
·
I have practiced my profession in the mining industry continuously since graduation.
·
I visited the property from October 7 to 16, 2009.
·
I have read the definition of “qualified person” set out in National Instrument 43-101 (NI 43-101) and certify that, by reason of my education, affiliation with a professional association (as defined in NI 43-101) and past relevant work experience, I fulfill the requirements to be a “qualified person” for the purpose of NI 43-101.
·
My relevant experience with respect to exploration and resource modelling includes 17 years experience in the mining sector covering exploration, mine geology, grade control, and resource modelling. I was involved in numerous projects around the world in both base metals and precious metals deposits.
·
I am responsible for much of the content of Section 14 with the exception of the assay validation in Section 14.3 and the QA/QC in Section 14.5 of this technical report titled “Technical Report Update NI 43-101 for the Green Giant Project, Fotadrevo, Province of Toliara, Madagascar, dated June 24, 2010.
·
I have no prior involvement with the property that is the subject of the Technical Report.
·
As of the date of this Certificate, to my knowledge, information, and belief, this technical report contains all scientific and technical information that is required to be disclosed to make the technical report not misleading.
·
I am independent of the Issuer as defined by Section 1.4 of the Instrument.
·
I have read NI 43-101 and the Technical Report has been prepared in compliance with NI 43-101 and Form 43-101F1.
Signed and dated this 24th day of June 2010.
“Original Document Signed and Sealed by Todd McCracken, P.Geo.” |
Signature |
TOC | 22-1 |
|
GREEN GIANT PROJECT TECHNICAL REPORT UPDATE NI 43-101 | |
22.2
Joseph Rosaire Pierre Desautels, P.Geo.
I, Joseph Rosaire Pierre Desautels of Barrie, Ontario, do hereby certify that as one of the authors of this updated technical report titled “National Instrument 43-101 (NI 43-101) Resource Estimate Technical Report for the Green Giant Vanadium Project, Fotadrevo, Province of Toliara, Madagascar,” dated June 24, 2010, I hereby make the following statements:
·
I am a Principal Resource Geologist with PEG Mining Consultants Inc. with a business address at 92 Caplan Avenue, Suite 610, Barrie, Ontario, Canada, L4N 0Z7.
·
I am a graduate of Ottawa University (B.Sc. Hons., 1978).
·
I am a member in good standing of the Association of Professional Geoscientists of Ontario (Registration #1362).
·
I have practiced my profession in the mining industry continuously since graduation.
·
I did not visit the property
·
I have read the definition of “qualified person” set out in NI 43-101 and certify that, by reason of my education, affiliation with a professional association (as defined in NI 43-101), and past relevant work experience, I fulfill the requirements to be a “qualified person” for the purpose of NI 43-101.
·
My relevant experience with respect to resource modelling includes 30 years experience in the mining sector covering database, mine geology, grade control, and resource modelling. I was involved in numerous projects around the world in both base metals and precious metals deposits.
·
I am responsible for the content of Sections 1.1, 2-13, a portion of Section 14.3 dealing with the assay validation, Sections 14.5, 15, 17, 18, 20, and 21 of this updated technical report titled “NI 43-101 Resource Estimate Technical Report for the Green Giant Vanadium Project, Madagascar,” dated June 24, 2010.
·
I have no prior involvement with the property that is the subject of the Technical Report.
·
As of the date of this Certificate, to my knowledge, information, and belief, this technical report contains all scientific and technical information that is required to be disclosed to make the technical report not misleading.
·
I am independent of the Issuer as defined by Section 1.4 of the Instrument.
·
I have read NI 43-101 and the Technical Report has been prepared in compliance with NI 43-101 and Form 43-101F1.
Signed and dated this 24th day of June 2010.
“Original Document Signed and Sealed by Pierre Desautels, P.Geo.” |
Signature |
TOC | 22-2 |
|
GREEN GIANT PROJECT TECHNICAL REPORT UPDATE NI 43-101 | |
22.3
Andy Holloway, P.Eng.
I, Andy Holloway, P.Eng., of Peterborough, Ontario, do hereby certify that as one of the authors of this updated technical report titled “National Instrument 43-101 (NI 43-101) Resource Estimate Technical Report for the Green Giant Vanadium Project, Fotadrevo, Province of Toliara, Madagascar,” dated June 24, 2010, I hereby make the following statements:
·
I am a Principal Process Engineer with PEG Mining Consultants Inc. with a business address at 92 Caplan Ave., Ste. #610, Barrie, Ontario, Canada, L4N 0Z7.
·
I am a graduate of the University of Newcastle upon Tyne, England, B.Eng. (Hons.), 1989, and I have practiced my profession continuously since then.
·
I am a Professional Engineer licensed by Professional Engineers Ontario (Membership Number 100082475).
·
I visited the property fromMay 7 to 16, 2010.
·
I have read the definition of “qualified person” set out in National Instrument 43-101 (NI 43-101) and certify that, by reason of my education, affiliation with a professional association (as defined in NI 43-101) and past relevant work experience, I fulfill the requirements to be a “qualified person” for the purpose of NI 43-101.
·
My relevant experience with respect to mineral processing and metallurgy includes 19 years experience in the mining sector covering mineral processing, process plant operation, design engineering, and management. I have been involved in numerous projects around the world in both base metals and precious metals deposits.
·
I am responsible for the content of Section 16.0 of this technical report titled “Technical Report Update NI 43-101 for the Green Giant Project, Fotadrevo, Province of Toliara, Madagascar, dated June 24, 2010.
·
I have no prior involvement with the property that is the subject of the Technical Report.
·
As of the date of this Certificate, to my knowledge, information, and belief, this technical report contains all scientific and technical information that is required to be disclosed to make the technical report not misleading.
·
I am independent of the Issuer as defined by Section 1.4 of the Instrument.
·
I have read NI 43-101 and the Technical Report has been prepared in compliance with NI 43-101 and Form 43-101F1.
Signed and dated this 24th day of June 2010.
“Original Document Signed and Sealed by Andy Holloway, P.Eng.” |
Signature |
TOC | 22-3 |
|
GREEN GIANT PROJECT TECHNICAL REPORT UPDATE NI 43-101 | |
23
REFERENCES
Barnett, R.L. (2009). Petrographic-electron microprobe investigation of selected samples from the Three Horses Vanadium Prospect, Madagascar. Private report for Uranium Star; 13 pp.
Barrie, T.C., Ph.D., P.Geo.,(Sep. 2009). Memo: Genesis of the Green Giant Vanadium Deposit.
Besairie, H. (1964). Madagascar, Carte Géologique 1/1,000,000. In three sheets, Antananarivo.
BRGM (1985). Plan Directeur d’Actions Pour la Mise en Valeur des Ressources du Sol et du Sous-Sol de Madagascar, Direction des Mines et de la Géologie, Contrat d’etude No 01/84/MIEM-DME/FED, Three volumes: Premier Phase-Premier partie 573 pp; -Deuxieme partie 418 pp; Deuxieme Phase 146 pp.
Cazoulat, M. (1985). Geologic Environment of the Uranium Deposits in the Carboniferous and Jurassic Sandstone of the Western Margin of the Air Mountains in the Republic of Niger: International Atomic Energy Agency TECDOC 328, pp. 247-263.
Claude H. Aussant, P.Geol. C. Scherba, P. Geol, and R. Maynard. Summary Report for the (April to July 2009 and September to December 2009) Exploration Programs on the Three Horses Property February, 2010.
Collins, Alan S. (2006). Madagascar and the amalgamation of Central Gondwana. Gondwana Research 9, pp. 3-16.
Fugro Airborne Surveys Corp. (2008). DIGHEM Survey for Madagascar Mining Investments, Three Horse Property, Tulear, Madagascar Map Sheets G59, C60, H59, H60, April 23, 2008, Report #07090.
Levinson, A.A. (1974). Introduction to Exploration Geochemistry. Applied Publishing, Wilmette, IL, 924 pp.
McCracken, T., Holloway, A., (Nov. 2009). Technical Report Update NI 43-101, Fotadrevo, Province of Toliara, Madagascar.
Pagel, M.; Cavellec, S.; Forbes, P.; Gerbaud, Vergley, P.; Wagani, I.; Mathieu, R. (2005). Uranium Deposits in the Arlit Area (Niger), Min. Dep. Res.: Meeting the Global Challenge, Proc. of the 8th Biennial SGA Meeting, Beijing, August 2005. pp 304-306.
Pitfield, P.; Bauer, W.; Schofield, D.; Tusky, T.; Randriamananjana, T. (2006). Reappraisal of the geology and structural evolution of the Precambrian basement in north and east-central Madagascar. Geophysical research Abstracts, Vol. 8.
Polyak, D.E. (2007). Vanadium, USGS Minerals Yearbook, publication April 2007, pp 80-1 to 80-11.
Scherba, C.; Aussant, C.H. (2009). Exploration Report on the Three Horses Property; unfinished draft prepared for Uranium Star Corporation; 86 pp.
Scherba, C.S.; Chisholm, R.E. (2008). Geological Evaluation of the Three Horses Property. Private report prepared for Uranium Star Corporation; 81 pp.
Taner, M.F.; Gault, A.; Ercit, T.S., (2000). Vanadium mineralization and its industry in Canada. The Gangue; 65: pp 3-9.
TOC | 23-1 |
|