EXHIBIT 99.3

NextSource Materials Inc.
Management’s Discussion and Analysis (MD&A)
For the years ended June 30, 2021, and 2020
Expressed in US Dollars
| 1 |
NEXTSOURCE MATERIALS INC.
MANAGEMENT’S DISCUSSION AND ANALYSIS
For the years ended June 30, 2021, and 2020
CAUTIONARY STATEMENT REGARDING FORWARD-LOOKING INFORMATION
Certain statements contained in this document constitute forward-looking information within the meaning of applicable Canadian securities legislation. Generally, forward-looking information can be identified by the use of forward-looking terminology such as “plans,” “expects,” or “does not expect,” “is expected,” “budget,” “scheduled,” “goal,” “estimates,” “forecasts,” “intends,” “anticipates,” or “does not anticipate,” or “believes” or variations of such words and phrases or statements that certain actions, events or results “may,” “could,” “would,” “might,” or “will be taken,” “occur,” or “be achieved”.
Forward-looking information includes, but is not limited to, information with respect to certain expectations regarding obtaining necessary permits; construction timelines and costs; anticipated production volumes; anticipated operating costs and capital spending; supply, demand and pricing outlook in the graphite market; sources of funding for the Molo Graphite Mine and the Green Giant Vanadium Project; exploration drill results; metallurgical drill results; environmental assessment and rehabilitation costs and amounts of certain other commitments; and the Company’s business objectives and targeted milestones (and timing thereof).
Forward-looking information is subject to known and unknown risks, uncertainties and other factors that may cause the actual results, level of activity, performance or achievements of the Company to be materially different from those expressed or implied by such forward-looking information. Such factors include, among others; uncertainty due to the Covid-19 Pandemic; development projects are uncertain, and it is possible that actual capital and operating costs and economic returns will differ significantly from those estimated for a project prior to production; the Company’s development and exploration projects are in the African country of Madagascar and are subject to country political and regulatory risks; economic dependence on the Molo Graphite Mine; additional permits and licenses are necessary to complete the development of the Molo Graphite Mine; fluctuations in the market price of graphite and other metals may adversely affect and the value of the Company’s securities, revenue projections and the ability of the Company to develop Phase 2 of the Molo Graphite Mine; estimates of mineral resources and mineral reserves may not be realized; the Company may not have access to sufficient capital to develop Phase 2 of the Molo Graphite Mine and value-added processing facilities; the Company has a limited operating history and expects to incur operating losses for the foreseeable future; due to the speculative nature of mineral property exploration, there is substantial risk that the Company’s assets will not go into commercial production and the business will fail; mining companies are increasingly required to consider and provide benefits to the communities and countries in which they operate, and are subject to extensive environmental, health and safety laws and regulations; because of the inherent dangers involved in mineral exploration, there is a risk that the Company may incur liability or damages as the Company conducts business; the Company has no insurance for environmental problems; should the Company lose the services of key executives, the Company’s financial condition and proposed expansion may be negatively impacted; because access to the Company’s properties may be restricted by inclement weather or proper infrastructure, its exploration programs are likely to experience delays; climate change and related regulatory responses may impact the Company’s business; compliance with changing regulation of corporate governance and public disclosure will result in additional expenses and pose challenges for management; tax risks; because from time to time the Company holds a significant portion of cash reserves in Canadian dollars, the Company may experience losses due to foreign exchange translations; the Company’s business is subject to anti-corruption and anti-bribery laws, a breach or violation of which could lead to civil and criminal fines and penalties, loss of licenses or permits and reputational harm; the Company is exposed to general economic conditions, which could have a material adverse impact on its business, operating results and financial condition; the market price for the Common Shares is particularly volatile given the Company’s status as a company with a small public float, limited operating history and lack of profits which could lead to wide fluctuations in the market price for the Common Shares; the Company does not intend to pay dividends in the foreseeable future; and the Company’s ability to meet other factors listed from time to time in the Company’s continuous disclosure documents, including but not limited to, the Annual Information Form (AIF).
Forward-looking information is based on the reasonable assumptions, estimates, analysis and opinions of management and/or “qualified persons” (as such term is defined under National Instrument 43-101 – Standards of Disclosure for Mineral Projects (““NI 43-101”)) made in light of their experience and their perception of trends, current conditions and expected developments, as well as other factors that management and/or qualified persons believe to be relevant and reasonable in the circumstances at the date that such statements are made, but which may prove to be incorrect. Although the Company believes that the assumptions and expectations reflected in such forward-looking information are reasonable, undue reliance should not be placed on forward-looking information because the Company can give no assurance that such expectations will prove to be correct. In addition to the assumptions discussed herein the material assumptions upon which such forward-looking statements are based include, among others, that: the Company will be successful in its financing activities; the demand for graphite will develop as anticipated; graphite prices will remain at or attain levels that would make the Molo Graphite Mine economic; that any proposed operating and capital plans will not be disrupted by operational issues, title issues, loss of permits, environmental concerns, power supply, labour disturbances, financing requirements or adverse weather conditions; the Company will continue to have the ability to attract and retain skilled staff; and there are no material unanticipated variations in the cost of energy or supplies. Readers are cautioned that the foregoing list is not exhaustive of all factors and assumptions which may have been used. Although the Company has attempted to identify important factors that could cause actual results to differ materially from those contained in forward-looking information, there may be other factors that cause results not to be as anticipated, estimated or intended. There can be no assurance that such information will prove to be accurate, as actual results and future events could differ materially from those anticipated in such information. Accordingly, readers should not place undue reliance on forward-looking information. The forward-looking information contained herein is presented for the purposes of assisting investors in understanding the Company’s expected financial and operating performance and the Company’s plans and objectives and may not be appropriate for other purposes.
The Company does not undertake to update any forward-looking information, except in accordance with applicable securities laws.
This MD&A includes market, industry and economic data and projections obtained from various publicly available sources and other sources believed by the Company to be true. Although the Company believes these to be reliable, it has not independently verified the information from third party sources, or analyzed or verified the underlying reports relied upon or referred to by the third parties, or ascertained the underlying economic and other assumptions relied upon by the third parties. The Company believes that the market, industry and economic data and projections are accurate and that the estimates and assumptions are reasonable, but there can be no assurance as to their accuracy or completeness. The accuracy and completeness of the market, industry and economic data and projections in this MD&A are not guaranteed and the Company does not make any representation as to the accuracy or completeness of such information.
| 2 |
NEXTSOURCE MATERIALS INC.
MANAGEMENT’S DISCUSSION AND ANALYSIS
For the years ended June 30, 2021, and 2020
INTRODUCTION
This Management’s Discussion and Analysis (MD&A) dated September 28, 2021 of NextSource Materials Inc. (“NextSource”, “we”, “our” or “the Company”) should be read in conjunction with Company’s audited consolidated financial statements for the years ended June 30, 2021 and 2020 that were prepared in accordance with International Financial Reporting Standards (“IFRS”) issued by International Accounting Standards Board (“IASB”) (the “Annual Financial Statements”).
The Annual Financial Statements and this MD&A are presented United States dollars (“USD” or “$”). Certain information in this MD&A is presented in Canadian dollars (“CAD$”). The term “NSR” stands for net smelter royalty. The term “tpa” stands for tonnes per annum. Additional information relating to the Company is available on the Canadian Securities Administrators’ (the “CSA”) SEDAR website at www.sedar.com and on the United States Securities and Exchange Commission’s (the “SEC”) website at www.sec.gov.
EXECUTIVE SUMMARY
NextSource was continued under the Canada Business Corporations Act from the State of Minnesota to Canada on December 27, 2017 and has a fiscal year end of June 30. The Company’s registered head office and primary location of records is 130 King Street West, Exchange Tower, Suite 1940, Toronto, Ontario Canada, M5X 2A2. The Company’s common shares are listed on the Toronto Stock Exchange (the “TSX”) under the symbol “NEXT” and the OTCQB under the symbol “NSRCF”.
NextSource is principally engaged in the development of mineral resources and value-added processing of flake graphite and other minerals into materials used in the manufacturing of batteries and other applications. The Company accepts the risks which are inherent to mineral exploration and development programs and exposure to the cyclical nature of mineral and commodity prices. These risks are discussed in greater detail in the Risk Factors section of this MD&A.
The Company does not currently operate any mines and has not completed the construction of any mines. No commercial revenue has been generated to date.
On February 15, 2019, the Company obtained a mining permit for its Molo Graphite Mine, located in Madagascar. On February 8, 2021, the Company announced a binding financing package totaling USD$29.5 million for the construction of Phase 1 of the Molo Graphite Mine. On March 29, 2021, the Company initiated the construction process for the mine with the awarding of the engineering, procurement, and construction management contract.
Site works are expected to begin in late 2021 and commissioning of the plant is expected to begin in May 2022 followed by a ramp up to the Phase 1 processing plant capacity of 240,000 tpa of ore over a period of two to three months. At full Phase 1 capacity, the Molo Graphite Mine is expected to produce approximately 17,000 tpa of high-quality SuperFlake® graphite concentrate.
The Company has initiated a technical study for a Molo Graphite Mine Phase 2 production capacity expansion to target 150,000 tonnes per annum (“tpa”) of SuperFlake®. The Company has also initiated technical study related to its Green Giant Vanadium Project and in collaboration with its partners, has initiated a technical study related to value-added processing facilities capable of producing coated, spheronized and purified graphite.
Corporate Structure
NextSource owns 100% of NextSource Materials (Mauritius) Ltd. (“MATMAU”), a Mauritius subsidiary, and 2391938 Ontario Inc., an Ontario Company. MATMAU owns 100% of NextSource Minerals (Mauritius) Ltd. (“MINMAU”), a Mauritius subsidiary, NextSource Graphite (Mauritius) Ltd (“GRAMAU”), a Mauritius subsidiary, and NextSource Materials (Madagascar) SARLU (“MATMAD”), a Madagascar subsidiary. MINMAU owns 100% of NextSource Minerals (Madagascar) SARLU (“MINMAD”), a Madagascar subsidiary. GRAMAU owns 100% of ERG (Madagascar) SARLU (“ERGMAD”), a Madagascar.
Canada |
|
|
|
|
|
|
|
|
|
|
| NextSource Materials Inc. |
|
| |||||
|
|
|
| 100.0% |
| 100.0% |
|
|
|
|
|
|
|
|
| 2391938 Ontario Inc. |
| ||
Mauritius |
|
|
|
|
|
|
|
|
|
|
| NextSource Materials (Mauritius) Ltd. |
|
| |||||
|
|
|
|
|
|
| "MATMAU" |
|
|
|
| 100% |
|
|
| 100% |
|
|
|
NextSource Graphite (Mauritius) Ltd. |
|
| NextSource Minerals (Mauritius) Ltd. | ||||||
|
|
| "GRAMAU" |
|
|
|
|
| "MINMAU" |
Madagascar |
|
| 100% |
|
|
|
|
| |
|
|
| NextSource Materials (Madagascar) SARLU |
|
|
| |||
|
|
|
|
|
| "MATMAD" |
|
|
|
| 100% |
|
|
|
|
| 100% |
|
|
ERG (Madagascar) SARLU |
|
| NextSource Minerals (Madagascar) SARLU | ||||||
|
|
| "ERGMAD" |
|
|
|
|
| "MINMAD" |
| 3 |
NEXTSOURCE MATERIALS INC.
MANAGEMENT’S DISCUSSION AND ANALYSIS
For the years ended June 30, 2021, and 2020
Dividends and Distributions
The Company has yet to pay any dividends since inception and is unlikely to do so in the immediate or foreseeable future.
Employees and Contractors
The Company relies on the geological and industry expertise of its management team and engages contractors to complete certain aspects of its mine development, mineral exploration and evaluation programs, and development of value-added processing facilities.
As of June 30, 2021, in addition to the Board of Directors, President & Chief Executive Officer, Chief Financial Officer, Chief Operating Officer and SVP Corporate Development, the Company had 2 employees. Certain professional, administrative, mine development and mineral exploration and evaluation services are provided to the Company by independent contractors, including corporations and/or individuals who may be officers or directors of NextSource. No assurance can be given that qualified employees can be retained by NextSource when necessary.
Cautionary Note about Operating Losses
As of June 30, 2021, the Company had incurred recurring operating losses resulting in an accumulated deficit of $146,893,550. We anticipate incurring further operating losses until the completion of construction and successful commissioning of Phase 1 of the Molo Graphite Mine.
Operating cash flows from Phase 1 of the Molo Graphite Mine are not expected to be sufficient to fund the construction of the Phase 2 capacity expansion and construction of value-added processing facilities. Our future financial results are uncertain due to a number of factors, some of which are outside our Company’s control. These factors include, but are not limited to: (a) our ability to complete construction of Phase 1 of the Molo Graphite Mine on time and on budget; (b) our ability to raise funding to cover potential working capital shortfalls, subsequent Molo Graphite Mine capacity expansions, the construction of value-added processing facilities, the completion of new mineral exploration and evaluation programs, and the potential acquisition of new mineral exploration and evaluation projects; (c) the market price for graphite and vanadium, which could impact expected revenues following the commissioning of the Molo Graphite Mine; (d) the results of the exploration programs and metallurgical analysis of our mineral properties; (e) the political instability and/or environmental regulations that may adversely impact construction and operating costs for the Molo Graphite Mine and our ability to operate in Madagascar; and (f) our ability to find joint venture and/or off-take partners in order to advance the development of our mineral properties and value-added processing facilities. Any future equity financing will cause existing shareholders to experience dilution of their ownership interest in our Company.
If operating cash flows from the Molo Graphite Mine are insufficient to fund operations and we are not successful in raising additional financing, we anticipate the Company will not be able to proceed with all or part of its existing business plan. In which case the Company may decide to discontinue or modify the current business plan and seek other business opportunities. As a public company, the Company needs to maintain periodic filings with the appropriate regulatory authorities and will continue to incur legal, accounting, administrative and listing costs. In the event the Company cannot raise additional capital to sustain operations, and cannot find other business opportunities, we may be forced to discontinue the business. We do not have any specific alternative business opportunities under consideration and have not planned for any such contingency.
GENERAL DEVELOPMENT OF THE BUSINESS
Strategy
The Company is focused on becoming a key producer of raw and value-added materials used in the manufacturing of batteries and other applications. To achieve this, the Company’s strategy is to:
| · | Deliver on growth expectations by developing and operating mining projects and value-added materials processing facilities that will generate long-term free cash flows |
| · | Build and maintain a high-quality project pipeline to ensure we advance and develop successful projects |
| · | Adhere to the highest environmental, social and governance standards |
Three-Year History
On August 17, 2018, the Company closed a non-brokered private placement offering of 2,105,927 units at a price of $0.53 (CAD$0.70) per unit for aggregate gross proceeds of $1,120,385 (CAD$1,474,149). Each unit consisted of one common share and one-half common share purchase warrant, with each warrant exercisable into one common share at an exercise price of $0.76 (CAD$1.00) for a period of two years.
| 4 |
NEXTSOURCE MATERIALS INC.
MANAGEMENT’S DISCUSSION AND ANALYSIS
For the years ended June 30, 2021, and 2020
On October 16, 2018, the Company announced the signing of an Offtake Agreement with the primary graphite supplier to a major Japanese electric vehicle anode producer. The Offtake Agreement is for a period of ten (10) years and activates on the commencement of commercial production at the Molo project, with an automatic renewal for an additional five (5) years. The Japanese Partner will have the exclusive right to import and sell SuperFlake® graphite concentrate in Japan. Provided that commercial production commences within 3 years, following the ramp up period, the Japanese Partner will purchase 20,000 tonnes of SuperFlake® graphite per annum. Product prices will be negotiated on a per order basis between the parties and will be based on the floating market prices (FOB basis) prevailing in the region.
On February 15, 2019, the Company announced the Madagascar Government granted a 40-year mining license for the Molo Graphite Mine and that the mining license does not limit mining to any specific volume.
On March 7, 2019, the Company closed a non-brokered private placement offering of 1,608,643 common shares at a price of $0.80 (CAD$1.10) per common share for aggregate gross proceeds of $1,323,630 (CAD$1,769,507).
On April 11, 2019, the Company announced it had received the Global Environmental Permit for the Molo Graphite Mine from the Madagascar Ministry of Environment’s Office National pour l’Environnement (the National Office for the Environment; or “ONE”). This follows the completion of the Environmental & Social Impact Assessment (“ESIA”) and Relocation Action Plan (“RAP”) to International Finance Corporation (IFC) performance standards and World Bank standards, the completion of local and regional stakeholder and community engagement, and the completion of negotiations and signed agreements with all potentially affected land occupants to accept compensation for any affected crops and grazing land and relocation if needed.
On September 27, 2019, the Company reported the results of a new Feasibility Study (“FS”) for its 100%-owned Molo Graphite Project in southern Madagascar. The FS outlines a phased development approach with Phase 1 producing 17,000 tonnes per annum (“tpa”) over the first two years of production and Phase 2 producing a total of 45,000 tpa by year 3. Over the modelled life of mine (30 years), the production plants will have a pre-tax internal rate of return (“IRR”) of 43.1%, and a post-tax IRR of 36.2%. The pre-tax Net Present Value (“NPV”) at 8% discount rate will be US$237.1M, and the post-tax NPV will be US$184.3M. The FS results are summarized in further detail in the Mineral Development Projects section.
On October 24, 2019, the Company announced the successful registration of Molo SuperFlake® as a trademark in Canada. The successful registration of this trademark means that NextSource has the exclusive right to brand all of its natural flake graphite sold in Canada as Molo SuperFlake® from its Molo Graphite Project in Madagascar.
On October 25, 2019, the Company closed a non-brokered private placement offering of 2,907,777 units at a price of $0.34 (CAD$0.45) per unit for aggregate gross proceeds of $998,620 (CAD$1,308,500). Each unit consisted of one common share and one-half common share purchase warrant, with each warrant exercisable into one common share at an exercise price of $0.70 (CAD$0.90) for a period of two years. There were no finder’s fees in relation to the private placement.
On September 27, 2019, Quentin Yarie resigned as a director of the Company.
On December 2, 2019, Christopher Kruba and David McNeely became directors of the Company.
On January 23, 2020, John Sanderson and Dalton Larson resigned as directors of the Company and Dean Comand was appointed as Chair of the Board of Directors.
On April 9, 2020, the Company announced that it executed a Letter of Agreement (“LOI”) with its Japanese offtake partner and a leading Chinese processor of graphite anode material to collaborate on the construction of a value-add, battery anode plant in a jurisdiction that is proximal to the Company’s Molo Graphite Mine project in Madagascar.
On July 2, 2020, the Company completed a non-brokered private placement of 6,157,887 units at a price of $0.24 (CAD$0.325) per unit for gross proceeds of $1,476,571 (CAD$2,001,310). Each unit consisted of one common share of the Company and one-half of one common share purchase warrant, with each full warrant entitling the holder to acquire one additional common share of the Company at a price of $0.48 (CAD$0.65) per share for a period of 24 months. No finder fees or commissions were paid in association with the private placement. In connection with the non-brokered private placement, the Company incurred $9,293 in share issuance costs.
On July 20, 2020, Brett Whalen became a director of the Company. On August 24, 2020, the Company announced the appointment of Brett Whalen as Chair of the Board of Directors.
| 5 |
NEXTSOURCE MATERIALS INC.
MANAGEMENT’S DISCUSSION AND ANALYSIS
For the years ended June 30, 2021, and 2020
On February 8, 2021, the Company announced that it entered into a binding agreement with Vision Blue Resources Limited (“Vision Blue”) to provide a financing package (the “Financing Package”) for total gross proceeds of USD$29.5M. The proceeds of the Financing Package will be used to complete construction of Phase 1 of the Company’s Molo Graphite Mine. The Financing Package consisted of an initial private placement of $6.0 million that was completed on March 15, 2021, a second private placement for $12.5 million that was completed on May 19, 2021, and a royalty financing that was completed on June 28, 2021, when the Company received an initial $8.0 million, less a $1.5 million royalty financing fee, and will receive another $3.0 million once it has reached 80% of capital expenditures related to the construction of the Molo Graphite Mine. The Molo Graphite Mine will be subject to minimum royalty payments and a 3.0% royalty. The Green Giant Vanadium Project will be subject to a 1.0% royalty. In connection with the initial private placement, the Company granted Vision Blue the right to appoint two directors to the Board of the Company. The Chairman of Vision Blue, Sir Mick Davis, was appointed as Chair of the Board of Directors of the Company on March 15, 2021. The second Vision Blue appointee, Ian Pearce, was appointed to the Board of Directors of the Company on July 14, 2021. Vision Blue was granted a right of first refusal to finance the Phase 2 expansion of the Molo Graphite Mine, and if Vision Blue holds common shares representing at least 10% of the issued and outstanding common shares, a right to participate in future equity financings on the same terms as such financing to maintain its ownership percentage in the Company. Vision Blue is subject to a 1-year lock-up from the closing of the Initial Private Placement with a periodic release schedule. In addition, each of the Directors and Officers of the Company have agreed to similar lock-up periods for the securities they hold.
On March 15, 2021, the Company completed the initial private placement with Vision Blue consisting of 12,000,000 common shares at a price of CAD$0.65 per share for total gross proceeds of $6,000,000 (CAD$7,800,000). In connection with the non-brokered private placement, the Company incurred $16,367 in share issuance costs. The Company also announced the appointment of Mick Davis as Chair of the Board of Directors.
On March 29, 2021, the Company announced the initiation of the construction process for the Molo Graphite Mine in Madagascar with the awarding of the engineering, procurement, and construction management contract.
On April 12, 2021, the Company announced a binding partnership agreement to construct and operate its own turnkey spheronized and purified graphite (“SPG”) production facility. SPG is a key component of lithium-ion batteries such as those used in electric vehicle (“EV”) and hybrid vehicle applications. The partnership involves Japanese and Chinese companies that currently operate their own SPG facilities that provide SPG to leading Japanese lithium-ion battery makers that are within the supply chains of Tesla and other major EV automotive companies. Proposed locations for the facility include South Africa, Europe, or North America. The Company will determine the initial production capacity and will then initiate a technical study to determine capital and operating costs for the proposed locations. Construction of one or more of these SPG production facilities will be subject to obtaining a positive technical study and securing sufficient funding for construction and initial working capital. Commissioning of the first SPG production facility is being targeted for Q4 2022. The Chinese partner will design and develop the process flowsheets, source all necessary graphite processing equipment, and will provide all the necessary training and operational know-how necessary for the production SPG material. In return, the Chinese partner will receive a 3% licensing fee based on the total annual sales value of anode material sold. The Japanese partner will leverage its sales relationships and will act as NextSource’s exclusive agent for sales, marketing and trading of anode battery materials sold to OEM anode suppliers and to OEMs directly. In return, the Japanese partner will receive a 5% sales commission based on the total annual sales value of anode battery material sold.
On May 11, 2021, the Company announced it initiated the procurement of processing plant equipment for the Molo Graphite Mine.
On May 19, 2021, the Company completed the second private placement with Vision Blue consisting of 23,214,286 units at a price of CAD$0.65 per unit for total gross proceeds of $12,500,000 (CAD$15,089,286). Each unit consisted of one common share of the Company and one common share purchase warrant, with each warrant entitling the holder to acquire one additional common share of the Company at a price of CAD$1.00 per share for a period of 24 months. No finder fees or commissions were paid in association with the private placement. In connection with the non-brokered private placement, the Company incurred $87,788 in share issuance costs.
On May 25, 2021, the Company announced that following a multi-year verification process, thyssenkrupp entered into a long-term partnership with NextSource and signed an offtake agreement to secure SuperFlake® graphite concentrate for their refractories/foundries, expandable graphite (graphite foil) and battery anode production businesses. The key highlights are:
| · | Commercial agreement for the sale of 35,000 tpa of SuperFlake® graphite concentrate from the Molo mine |
| · | 10-year term with an automatic 5-year extension |
| · | Products under the agreement pertain to refractory, battery anode production and expandable graphite (graphite foil) markets |
| · | Geographical regions include, but are not limited to, Europe, the UK, North America, Mexico, China and South Korea |
| · | Minimum 7,300 tpa during Phase 1 initial production |
| · | Ramp up to 35,000 tpa in Phase 2 |
| · | Shipments in Phase 1 will be used to verify run-of-mill production to trigger the larger volume expansion |
On June 23, 2021, the Company announced the initiation of a technical study for a Phase 2 production capacity to target 150,000 tpa of SuperFlake® for its Molo Graphite Mine in Madagascar. This is an increase from the 2019 Feasibility Study hat considered a Phase 2 production capacity of 45,000 tpa. The new minimum targeted capacity was determined after recent discussions with our flake graphite offtake partners and with our partnership for the construction of a battery anode facility (“BAF”) to produce spheronized and purified graphite (“SPG”). The purpose of the technical study is to determine the project economics pertaining to this increase in targeted production for Phase 2.
On June 28, 2021, the Company received the royalty funding from Vision Blue consisting of $8.0 million, less a US$1.5 million royalty financing fee. The Company will receive a further $3.0 million upon achieving 80% of capital expenditures related to the construction of the mine, which is expected to be reached on or around December 31, 2021. In return for the royalty funding, the Company will pay to Vision Blue the greater of: (i) US$1.65 million per annum or (ii) 3% of the gross revenues from SuperFlake® concentrate sales (the “GSR”). Once Vision Blue has received a cumulative royalty payment of US$16.5 million, the GSR will be calculated as 3% of the gross revenues from the Company’s SuperFlake® sales. NextSource will have the option at any time to reduce the GSR to 2.25% upon payment to Vision Blue of US$20 million. The Company may delay the first-year minimum repayments, which will become subject to accrued interest of 15% per annum. Vision Blue will also receive a royalty of 1.0% of the gross revenues from sales of vanadium pentoxide (“V2O5”) from the Green Giant Vanadium Project for a period of 15 years following commencement of production of V2O5.
| 6 |
NEXTSOURCE MATERIALS INC.
MANAGEMENT’S DISCUSSION AND ANALYSIS
For the years ended June 30, 2021, and 2020
On July 14, 2021, the Company announced the appointment of Ian Pearce to the Board of Directors and the resignation of David McNeely as a Director of the Company.
On July 22, 2021, the Company announce that it has been accepted as a member of both the European Battery Alliance (“EBA”) and the European Raw Materials Alliance (“ERMA”).
On September 8, 2021, the Company announced it intends to assess emerging opportunities to accelerate expansion through the potential acquisition and development of additional metals and mineral assets that are expected to play a vital role in clean energy technologies.
MINERAL DEVELOPMENT PROJECTS
The following section contains “forward-looking statements” and “forward-looking information” within the meaning of applicable securities laws. The Company continues to monitor the implications of the Covid-19 Pandemic. The manner and extent that the pandemic, and measures taken as a result of the pandemic by governments and others, will affect the Company in ways that cannot be predicted with certainty. See the Cautionary Statement Regarding Forward-Looking Information and Uncertainty due to the Covid-19 Pandemic in this MD&A for a discussion of assumptions and risks relating to such statements and information and a discussion of certain risks facing the Company relating to the pandemic.
Molo Graphite Mine, Southern Madagascar Region, Madagascar
Overview and Project Plan
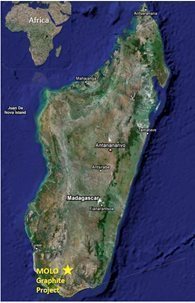
The Molo Graphite Mine project is located near the town of Fotadrevo in the Province of Toliara, Madagascar.
On February 15, 2019, the Company announced the Madagascar Government granted a 40-year mining license for the Molo Graphite Mine and that the mining license does not limit mining to any specific volume.
On March 29, 2021, the Company announced the initiation of the construction process for the Molo Graphite Mine in Madagascar with the awarding of the engineering, procurement, and construction management contract.
On May 11, 2021, the Company announced it initiated the procurement of processing plant equipment for the Molo Graphite Mine.
| 7 |
NEXTSOURCE MATERIALS INC.
MANAGEMENT’S DISCUSSION AND ANALYSIS
For the years ended June 30, 2021, and 2020
Total construction costs excluding working capital have been estimated at $21.7 million. All construction activities are expected to be completed by June 30, 2022. As of June 30, 2021, the Company had already incurred $3.6 million in capital costs and the remaining construction costs were estimated at approximately $18.4 million, mine working capital requirements were estimated at approximately $1.3 million, and general and administrative expenditures until June 30, 2022 were estimated at $3.0 million. As part of the royalty financing agreement, the Company will receive a further $3.0 million from Vision Blue upon achieving 80% of capital expenditures related to the construction of the mine, which is expected to be reached on or around December 31, 2021. As a result, the Company believes its capital resources will be sufficient to complete construction of the mine and to fund mine working capital and general and administrative expenditures.
The processing plant equipment is currently being assembled offshore and is expected to begin arriving in Madagascar in late 2021 and will then be transported overland and installed at the mine site in Q1 2022. Mine-site construction activities are expected to begin in late 2021. Open pit pre-production mining activities are expected to begin in Q1 2022. Commissioning of the plant is expected to begin in May 2022, followed by a ramp up over a period of two to three months to the Phase 1 nameplate capacity of 240,000 tpa of ore. At full Phase 1 capacity, the Molo Graphite Mine is expected to produce approximately 17,000 tpa of high-quality SuperFlake® graphite concentrate.
The application for all necessary permits to construct and operate the mine, including water use, facilities construction, mineral processing, transportation, export, and labour have been initiated and are expected to be obtained as they are required.
The following is a rendering of the completed Phase 1 processing plant:

Phase 2 Expansion
On June 23, 2021, the Company announced the initiation of a technical study for a Phase 2 production capacity to target 150,000 tpa of SuperFlake® for its Molo Graphite Mine in Madagascar. This is an increase from the 2019 Feasibility Study, which considered a Phase 2 production capacity of 45,000 tpa.
The expanded Phase 2 production capacity was determined after recent discussions with our flake graphite offtake partners and with our partnership for the construction of a value-added processing facility to produce spheronized graphite (“SPG”). The purpose of the technical study is to determine the project economics for the expanded Phase 2.
Construction of the Phase 2 expansion is expected to begin after completion of Phase 1 and is subject to the technical report supporting positive economics and obtaining sufficient funding to complete construction.
Global market for and supply of flake graphite
Benchmark Intelligence estimated that global flake graphite demand in 2020 was approximately 900,000 tonnes and is expected to increase significantly over the next ten years due to increasing demand for lithium-ion batteries used in electric vehicles. A rule of thumb is that approximately 1.1 tonnes of flake graphite (2,500 lbs) is required for each 1GWh of electric vehicle capacity. Benchmark Intelligence has further estimated that global battery manufacturing capacity in 2020 was approximately 755 GWh and is set to increase by 2030 to 3,400 GWh through the construction of up to 200 new gigafactories. As a result, global flake graphite demand in 2030 is estimated at approximately 4,000,000 tonnes, which exceeds the existing global supply.
| 8 |
NEXTSOURCE MATERIALS INC.
MANAGEMENT’S DISCUSSION AND ANALYSIS
For the years ended June 30, 2021, and 2020
Benchmark Intelligence estimated that the global flake graphite market was in relative balance in recent years but has moved from an oversupply of 226,000 tpa in 2018 to a deficit of approximately 60,000 tpa in 2021. Flake graphite demand is forecast to exceed global supply by approximately 430,000 tpa by 2026 and increasing to approximately 1,888,000 tpa by 2030. The supply response for natural flake graphite is expected to be constrained by technical challenges, capital costs, development timelines and operating economics. The supply response for synthetic flake graphite is expected to be constrained by the economics and availability of petroleum needle coke, which is its primary raw material feedstock for synthetic graphite and is also in demand for use in the steel making industry.
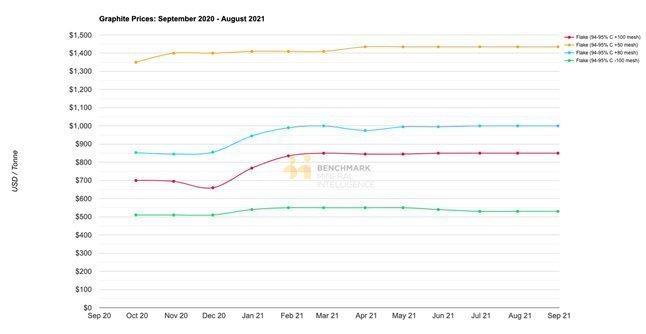
As an industrial mineral, flake graphite pricing is determined by three factors: 1) flake size, 2) carbon purity and 3) industry-specific technical attributes of the flakes. Flake sizing is broadly classified into four ranges: small (-100 mesh, or <75µm) medium (-80 to 100 mesh, or 75µm to 180µm), large (-50 to 80 mesh, or 180µm to 300µm), and extra-large or jumbo (+50 mesh, or >300µm). These flake sizes are in turn classified by carbon content (“C”), and are typically sold in ranges of 88-93% C, 94-95% C, and 95-97% C. The specific technical attributes of the flakes are then defined by end-user parameters such as expansion coefficient, thermal and electrical conductivity, and charge-discharge stability and efficiency. Larger flake size is generally sold at a premium to smaller flake sizes, and higher purity products (e.g., above 94%) are sold at a premium to lower purity products. Pricing is further impacted by the regional location of supply.
Transactions in the flake graphite market are generally based on private negotiations between buyers and sellers, as a result there is no spot or forward market. Research companies such as Benchmark Mineral Intelligence (“Benchmark”) and Roskill Information Services (“Roskill”) estimate current and historical pricing based on their proprietary market research and publish forward estimates for select grades and product types. Benchmark has estimated the following average FOB China 94-95% C flake graphite market prices for different mesh sizes during the past 12 months. Benchmark has not estimated the flake graphite market prices for 96-98% C flake graphite, which is the yield expected to be produced by the Molo Graphite Mine and is typically sold at a premium to 94-95% C flake graphite.
Sales, Marketing and Offtakes of SuperFlake® Graphite
Independent testing by various third-party end users of flake graphite was announced by the Company in 2015 that confirmed that flake graphite concentrates from the Molo Graphite Mine meets or exceeds quality requirements for all major end-markets of natural flake graphite. The major end-markets for flake graphite include refractories, graphite anode materials used in lithium-ion batteries, specialty graphite foils used as essential components in the chemical, aeronautical and fire-retardant industries, and graphene used in high-end ink and substrate applications.
The Feasibility Study confirmed that Molo flake graphite concentrate has an excellent flake size distribution that is well above the global average, with 46.4% classified as +80 mesh (large), +65 mesh (extra-large) and +48 mesh (jumbo) mesh in flake size, which includes 23.6% as +48 mesh and greater in flake size. The concentrate also has excellent thermal expansion, can be upgraded to 99.97% purity and contains no deleterious substances and has high crystallinity.
In response, NextSource has registered SuperFlake® as a trademark for the Molo flake graphite concentrate in the United States, Canada, Japan, South Korea, U.K. and the European Union. These are the top demand markets for flake graphite and the countries where NextSource intends to sell its SuperFlake® graphite material.
| 9 |
NEXTSOURCE MATERIALS INC.
MANAGEMENT’S DISCUSSION AND ANALYSIS
For the years ended June 30, 2021, and 2020
The Company expects to sell most of the flake graphite produced at the Molo Graphite Mine through offtakes with several key customers.
On October 16, 2018, the Company announced a binding offtake agreement for the supply of SuperFlake® graphite concentrate with a prominent Japanese Trading Company that is a primary supplier of flake graphite to a major Japanese electric vehicle anode producer. To protect certain confidential aspects of the agreement, the Japanese Trading Company and the Japanese electric vehicle anode producer requested not to be identified. The key highlights are:
| · | Offtake is for a period of ten (10) years, beginning at the start of commercial production at the Molo Graphite Mine, with an automatic renewal for an additional five (5) years. |
| · | Exclusive right to import and sell SuperFlake® graphite concentrate in Japan. |
| · | Provided that commercial production commences within 3 years, following the ramp up period, the Japanese Partner will purchase 20,000 tonnes of SuperFlake® graphite per annum. |
| · | Product prices will be negotiated on a per order basis between the parties and will be based on the market prices (FOB basis) prevailing in the region. |
On May 25, 2021, the Company announced that following a multi-year verification process, thyssenkrupp entered into a long-term partnership with NextSource and signed an offtake agreement to secure SuperFlake® graphite concentrate for their refractories/foundries, expandable graphite (graphite foil) and battery anode production businesses. The key highlights are:
| · | Commercial agreement for the sale of 35,000 tpa of SuperFlake® graphite concentrate from the Molo mine |
| · | 10-year term with an automatic 5-year extension |
| · | Products under the agreement pertain to refractory, battery anode production and expandable graphite (graphite foil) markets |
| · | Geographical regions include, but are not limited to, Europe, the UK, North America, Mexico, China and South Korea |
| · | Minimum 7,300 tpa during Phase 1 initial production |
| · | Ramp up to 35,000 tpa in Phase 2 |
| · | Shipments in Phase 1 will be used to verify run-of-mill production to trigger the larger volume expansion |
Royalty
On June 28, 2021, the Company received the royalty funding from Vision Blue consisting of $8.0 million, less a US$1.5 million royalty financing fee. The Company will receive a further $3.0 million upon achieving 80% of capital expenditures related to the construction of the mine, which is expected to be reached on or around December 31, 2021. In return for the royalty funding, the Company will pay to Vision Blue the greater of: (i) US$1.65 million per annum or (ii) 3% of the gross revenues from SuperFlake® concentrate sales (the “GSR”). Once Vision Blue has received a cumulative royalty payment of US$16.5 million, the GSR will be calculated as 3% of the gross revenues from the Company’s SuperFlake® sales. NextSource will have the option at any time to reduce the GSR to 2.25% upon payment to Vision Blue of US$20 million. The Company may delay each individual minimum payments for a period of 12 months, whereby each deferred payment will be subject to accrued interest of 15% per annum. At this time, the Company expects to defer the minimum payments and as a result, the first minimum payment is expected to be completed on June 30, 2023.
Exploration and Evaluation
The Molo Graphite Project is one of seven surficial graphite trends discovered and drill tested by NextSource in late 2011 and announced to the market in early January 2012. The Molo deposit itself occurs in a flat, sparsely populated and dry savannah grassland region that has easy access via a network of seasonal secondary roads.
The Molo Graphite Project graphitic zone consists of multi-folded graphitic strata at surface with an exposed strike length of over two kilometres. Outcrop mapping and trenching on the Molo Graphite Project has shown the surface geology to be dominated by resistant ridges of graphitic schist and graphitic gneiss, as well as abundant graphitic schist float. Geological modeling has shown that the Molo Graphite Project deposit consists of various zones of mineralized graphitic gneiss, with a barren footwall composed of garnetiferous gneiss. The host rock of the mineralized zones on the Molo Graphite Project is graphitic gneiss.
Resource delineation, drilling and trenching on the Molo Graphite Project took place between May and November of 2012. This resulted in a maiden mineral resource estimate that formed the basis for the Company’s Preliminary Economic Assessment (the “PEA”), which was undertaken by DRA Mineral Projects and released in 2013.
The positive outcome of the PEA led NextSource to undertake another phase of exploratory drilling and sampling in 2014 to upgrade the deposit and its contained mineral resources to mineral reserves. The process included an additional 32 diamond drill holes (totaling 2,063 metres) and 9 trenches (totaling 1,876 metres). The entire database upon which the upgraded resource estimate was based contained 80 drill holes (totaling 11,660 metres) and 35 trenches (totaling 8,492 metres). This mineral resource formed the basis of the first feasibility study, which was released in February 2015, and for the September 2019 Feasibility Study.
The resource remains open along strike and to depth. The Company does not have any immediate plans to complete any further drilling to expand the resource.
| 10 |
NEXTSOURCE MATERIALS INC.
MANAGEMENT’S DISCUSSION AND ANALYSIS
For the years ended June 30, 2021, and 2020
Resource and Reserve Estimate
The current mineral resource estimate for the Molo Graphite Project is summarised below consisting of the resource categories, the tonnage, the carbon grade (“C%”) and the contained graphite (“C”) tonnage. A cut-off grade of 4% C was used for the “higher grade” zones and 2% C for the “lower grade” zones. The mineral resources are classified in the Measured, Indicated and Inferred categories as defined by the Canadian Institute of Mining, Metallurgy and Petroleum definition standards.
Classification | Tonnage (Mt) | Grade (C%) | Graphite (C Mt) |
Measured | 23.62 | 6.32% | 1.49 |
Indicated | 76.75 | 6.25% | 4.80 |
Measured & Indicated | 100.37 | 6.30% | 6.29 |
Inferred | 40.91 | 5.78% | 2.36 |
The Mineral Resources above are inclusive of the Mineral Reserves below.
Classification | Tonnage (Mt) | Grade (C%) |
Proven | 14.17 | 7.00% |
Probable | 8.37 | 7.04% |
Proven & Probable | 22.44 | 7.02% |
Readers are cautioned to refer to the 2019 Feasibility Study for all the material assumptions, qualifications and verification procedures relating to the current mineral resource and mineral reserve estimate for the Molo Graphite Project.
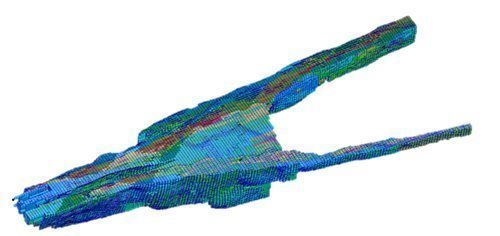
The following is a graphical representation of the shape of the mineral resource, which has been extracted from the 2019 Feasibility Study.
History
On December 14, 2011, the Company entered into a Definitive Joint Venture Agreement (“JVA”) with Malagasy Minerals Limited (“Malagasy”), a public company listed on the Australian Stock Exchange, to acquire a 75% interest in a property package for the exploration and development of industrial minerals, including graphite, vanadium and 25 other minerals. The land position consisted of 2,119 permits covering 827.7 square kilometers and is mostly adjacent towards the south and east with the Company’s 100% owned Green Giant Vanadium Project. Pursuant to the JVA, the Company paid $2,261,690 and issued 750,000 common shares that were valued at $1,350,000.
On April 16, 2014, the Company signed a Sale and Purchase Agreement and a Mineral Rights Agreement (together “the Agreements”) with Malagasy to acquire the remaining 25% interest, subject to Malagasy retaining a 1.5% net smelter royalty. Pursuant to the Agreements, the Company paid $364,480 (CAD$400,000), issued 250,000 common shares subject to a 12-month voluntary vesting period that were valued at $325,000 and issued 350,000 common share purchase warrants, which were valued at $320,950 using Black‑Scholes, with an exercise price of $0.14 and an expiry date of April 15, 2019. On May 20, 2015, upon completion of a bankable feasibility study (“BFS”) for the Molo Graphite Property, the Company paid $546,000 (CAD$700,000) and issued 100,000 common shares, which were valued at $100,000. A further cash payment of approximately $771,510 (CAD$1,000,000) will be due within five days of the commencement of commercial production. The Company also acquired a 100% interest in the industrial mineral rights on approximately 1 ½ additional claim blocks covering 10,811 hectares adjoining the east side of the Molo Graphite Property. Prior to becoming a Director of the Company, Brett Whalen purchased an option to acquire the 1.5% NSR from Malagasy, upon the mine achieving commercial production, in return for a further payment to Malagasy.
| 11 |
NEXTSOURCE MATERIALS INC.
MANAGEMENT’S DISCUSSION AND ANALYSIS
For the years ended June 30, 2021, and 2020
The Molo Graphite Project is located within Exploration Permit #3432 (“PR 3432”) as issued by the Bureau de Cadastre Minier de Madagascar (“BCMM”) pursuant to the Mining Code 1999 (as amended) and its implementing decrees. The Molo Graphite Project exploration permit PR 3432 is currently held under the name of our Madagascar subsidiary, which has paid all taxes and administrative fees to the Madagascar government and its mining ministry with respect to all the mining permits held in country. These taxes and administrative fee payments have been acknowledged and accepted by the Madagascar government.
On June 1, 2017, we released the results of an updated Molo Feasibility Study utilizing a fully modular approach which was based on the FEED Study and subsequent detailed engineering studies.
During fiscal 2017, the Company applied to the BCMM to have the exploration permit for the Molo Graphite Project converted into a mining permit.
Following an Environmental Legal Review and an Environmental and Social Screening Assessment, which provided crucial information to align the project’s development and design with international best practice on sustainable project development, the Company completed a comprehensive Environmental and Social Impact Assessment (“ESIA”), which was developed to local Madagascar (“Malagasy”), Equator Principles, World Bank and International Finance Corporation (“IFC”) standards. The ESIA was submitted to the Office National d’Environment (“ONE”) (the Madagascar Environment Ministry) during fiscal 2018.
On February 15, 2019, the Company announced the Madagascar Government granted a 40-year mining license for the Molo Graphite Mine and that the mining license does not limit mining to any specific volume.
On April 11, 2019, the Company announced it had received the Global Environmental Permit (“GEP”) for the Molo Graphite Mine from the Madagascar Ministry of Environment’s Office National pour l’Environnement (the National Office for the Environment; or “ONE”). The GEP was based on ESIA and a Relocation Action Plan (“RAP”) that involved the completion of local and regional stakeholder and community engagement, and the completion of negotiations and signed agreements with all potentially affected land occupants to accept compensation for any affected crops and grazing land and relocation if needed.
On September 27, 2019, the Company reported the results of an updated Feasibility Study (“FS”) consisting of two phases:
PHASE 1: Production of 17,000 tpa of graphite concentrate
The first phase of production will consist of a fully operational and sustainable graphite mine with a permanent processing plant capable of processing 240,000 tpa of ore producing approximately 17,000 tpa of graphite concentrate per year over a 30-year life of mine. The estimated capital costs for Phase 1 including contingencies were estimated at US$21.0 million and construction was expected to take approximately 12 months to complete. Phase 1 costs including contingency and working capital were estimated at US$24.1 million.
PHASE 2: Production expansion to 45,000 tpa of graphite concentrate in Year 3
Phase 2 assumes that Phase 1 is achieved and operates for two years followed by the completion of the Phase 2 expansion in the third year resulting in a combined 720,000 tpa of ore producing 45,000 tpa of graphite concentrate per year over a 30-year life of mine. The Phase 2 expansion is based on the construction of two additional Phase 1 processing plant modules over a construction period of 12 months. Phase 2 capital costs including all Phase 1 capital costs and contingency were estimated at US$60.1 million. Phase 2 capital costs including all Phase 1 capital costs, contingency and working capital were estimated at US$67.4 million. Additional sustaining capital for equipment replacement over the 30-year life of mine and closure costs was estimated at $3.3 million.
On February 8, 2021, the Company announced that it entered into a binding agreement with Vision Blue to provide the Financing Package for total gross proceeds of USD$29.5M. The proceeds of the Financing Package will be used to complete construction of Phase 1 of the Company’s Molo Graphite Mine. The Financing Package consisted of an initial private placement of $6.0 million that was completed on March 15, 2021, a second private placement for $12.5 million that was completed on May 19, 2021, and a royalty financing agreement that was completed on June 28, 2021, when the Company received an initial $8.0 million, less a $1.5 million royalty financing fee, and will receive another $3.0 million once it has reached 80% of capital expenditures related to the construction of the Molo Graphite Mine. The Molo Graphite Mine will be subject to minimum royalty payments and a 3.0% royalty. Vision Blue was granted a right of first refusal to finance the Phase 2 expansion of the Molo Graphite Mine.
On March 29, 2021, the Company announced the initiation of the construction process for the Molo Graphite Mine in Madagascar with the awarding of the engineering, procurement, and construction management contract.
On May 11, 2021, the Company announced it initiated the procurement of processing plant equipment, which will be assembled offshore then shipped to Madagascar in late 2021.
| 12 |
NEXTSOURCE MATERIALS INC.
MANAGEMENT’S DISCUSSION AND ANALYSIS
For the years ended June 30, 2021, and 2020
Feasibility Study Summary
On September 27, 2019, the Company reported the results of an updated Feasibility Study (“FS”) consisting of two phases. Phase 1 consisted of production of 17,000 tpa of finished SuperFlake® concentrate for the first two years of production, followed by an expansion to Phase 2 production of 45,000 tpa. The FS considered mine capital equipment and mining costs, as well as the 12-month rolling flake graphite pricing on a Freight-on-Board (“FOB”) China basis, supplied by UK-based battery mineral commodities research firm, Benchmark Minerals Intelligence. The FS incorporated the procurement of all mining equipment, off-site modular fabrication and assembly, factory acceptance testing, module disassembly, shipping, plant infrastructure construction, onsite module re-assembly, commissioning, project contingencies and working capital. All capital and operating costs expressed for Phase 1 are accurate to +/- 10%, and Phase 2 are accurate to +/- 12.5%.
Description |
| Phase 1 and 2 |
| |||||
|
| Pre-Tax |
|
| Post-Tax |
| ||
NPV (8% Discount Cash Flow)(1)(2) |
| $237.1 million |
|
| $184.3 million |
| ||
IRR (1)(2) |
|
| 43.1 | % |
|
| 36.2 | % |
Payback (2) |
| 3.4 years |
|
| 3.8 years |
| ||
Capital cost (“CAPEX”) |
| $ | 60,082,340 |
|
|
|
|
|
Owners Contingency |
| $ | 6,670,430 |
|
|
|
|
|
On-site Mining Costs (“OPEX”) per tonne of concentrate, (year 3 onward) |
| $ | 82.69 |
|
|
|
|
|
On-site Processing Costs (“OPEX”) per tonne of concentrate, (year 3 onward) |
| $ | 270.27 |
|
|
|
|
|
Transportation per tonne of concentrate (mine site to Madagascar Port year 3 onward) |
| $ | 133.01 |
|
|
|
|
|
Average annual production of concentrate |
| 45,136 tonne |
|
|
|
|
| |
Life of Mine (“LOM”) |
| 30 years |
|
|
|
|
| |
Graphite concentrate sale price (US$/tonne at Start Up - 2017) |
| $ | 1,208 |
|
|
|
|
|
Average Head Grade |
|
| 7.1 | % |
|
|
|
|
Average ore mined per annum over Life of Mine |
| 720,000 tonne |
|
|
|
|
| |
Average stripping ratio |
| 0.53:1 |
|
|
|
|
| |
Average carbon recovery |
|
| 88.30 | % |
|
|
|
|
Notes:
(1) Assumes Project is financed with 100% equity. Unless otherwise noted, all monetary figures presented are expressed in US dollars (USD).
(2) CAPEX includes process equipment, civil & infrastructure, mining, buildings, electrical infrastructure, project & construction services. Values shown are based on real graphite sales pricing
CAPEX and Working Capital |
| Phase 1 (240ktpa) |
|
| Phase 1 and 2 (720ktpa) |
| ||
Process Equipment |
| $ | 8,438,609 |
|
| $ | 25,315,827 |
|
Civil & Infrastructure |
| $ | 2,103,672 |
|
| $ | 6,661,016 |
|
Tailings |
| $ | 0.00 |
|
| $ | 0.00 |
|
Mining |
| $ | 2,574,143 |
|
| $ | 4,913,341 |
|
Buildings |
| $ | 1,154,609 |
|
| $ | 2,886,523 |
|
Electrical Infrastructure |
| $ | 128,804 |
|
| $ | 386,412 |
|
Project Services/EPCM |
| $ | 931,481 |
|
| $ | 2,794,445 |
|
Construction Services |
| $ | 1,474,775 |
|
| $ | 3,686,937 |
|
Indirect Costs |
| $ | 372,750 |
|
| $ | 1,118,250 |
|
Environmental & Permitting costs |
| $ | 729,827 |
|
| $ | 1,459,655 |
|
Owner’s Costs |
| $ | 1,197,000 |
|
| $ | 4,189,500 |
|
Sub-total |
| $ | 19,105,673 |
|
| $ | 53,411,909 |
|
Contingency (10%/12.5%) |
| $ | 1,910,567 |
|
| $ | 6,676,488 |
|
3 Months Working Capital |
| $ | 3,100,000 |
|
| $ | 7,300,000 |
|
CAPEX AND WORKING CAPITAL TOTAL |
| $ | 24,116,241 |
|
| $ | 67,388,398 |
|
Sustaining CAPEX over Life of Mine |
|
|
|
|
| $ | 3,300,000 |
|
| 13 |
NEXTSOURCE MATERIALS INC.
MANAGEMENT’S DISCUSSION AND ANALYSIS
For the years ended June 30, 2021, and 2020
Operating Costs |
| Phase 1 |
|
| Phase 2 |
| ||
|
| Operating cost |
| |||||
Mining (US$/T) |
|
| 102.81 |
|
|
| 65.34 |
|
Processing (US$/T) |
|
| 265.82 |
|
|
| 265.82 |
|
Trucking to local port / Ft. Dauphin (US$/T) |
|
| 133.01 |
|
|
| 133.01 |
|
General and Administration (US$/T) |
|
| 64.29 |
|
|
| 50.00 |
|
TOTAL |
| $ | 565.93 |
|
| $ | 514.17 |
|
The 2019 Feasibility Study technical report has been filed under the Company’s profile and on SEDAR at www.sedar.com, and is posted on NextSource’s website at www.nextsourcematerials.com. Please see “Molo Feasibility Study, National Instrument 43-101 Technical Report on the Molo Graphite Project located near the village of Fotadrevo in the Province of Toliara, Madagascar Prepared by Erudite Strategies (Pty) Ltd” dated May 31, 2019 for certain other details and assumptions relating to the above mineral resource and reserve estimates and data verification procedures.
The 2019 Feasibility Study was prepared in accordance with National Instrument 43-101 standards by Mr. Johann de Bruin, Pr. Eng. Mr. de Bruin is the Qualified Person who verified the technical data using industry acceptable standards and signed off on the relevant sections in the 43-101 report filed on SEDAR.
VALUE-ADDED MATERIAL PROCESSING FACILITY
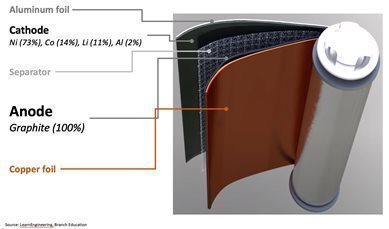
The Company is currently evaluating the construction of value-added processing facilities that can convert flake graphite into spheronized and purified graphite (“SPG”) and coated spheronized graphite (“CSPG”). The coated spheronized purified graphite is then sold to battery manufacturers, where it is rolled into an anode and is assembled with other components into a finished battery. The following is a representation of a conversion process and the typical battery with the approximate composition of the primary components:

The SPG and CSPG produced from the value-added processing facilities can be sold at significantly greater prices per tonne than flake graphite. Transactions in the SPG and CSPG market are generally based on private negotiations between buyers and sellers, as a result there is no spot or forward market. Research companies such as Benchmark and Roskill estimate current and historical pricing based on their proprietary market research and publish forward estimates for select grades and product types. According to Roskill, the average price of CSPG imported into China in 2019 and 2020 were USD$7,157 per tonne and USD$7,307 per tonne, respectively.
On April 12, 2021, the Company announced a binding partnership agreement to construct and operate its own turnkey spheronized and purified graphite (“SPG”) production facility. SPG is a key component of lithium-ion batteries such as those used in electric vehicle (“EV”) and hybrid vehicle applications. The partnership involves Japanese and Chinese companies that currently operate their own SPG and CSPG facilities that provide SPG and CSPG to leading Japanese lithium-ion battery makers that are within the supply chains of Tesla and other major EV automotive companies.
| 14 |
NEXTSOURCE MATERIALS INC.
MANAGEMENT’S DISCUSSION AND ANALYSIS
For the years ended June 30, 2021, and 2020
| · | The Chinese partner will design and develop the process flowsheets, source all necessary graphite processing equipment, and will provide all the necessary training and operational know-how necessary for the production SPG material. In return, the Chinese partner will receive a 3% licensing fee based on the total annual sales value of anode material sold. |
|
|
|
| · | The Japanese partner will leverage its sales relationships and will act as NextSource’s exclusive agent for sales, marketing and trading of battery (graphite) anode material sold to OEM anode suppliers and to OEMs directly. In return, the Japanese partner will receive a 5% sales commission based on the total annual sales value of anode battery material sold. |
The Company is currently working with its partners to determine the initial production capacity and will complete a technical study to determine capital and operating costs based on proposed locations. Proposed locations for the value-added facility include South Africa, Europe, or North America.
Construction of one or more of these SPG production facilities will be subject to obtaining a positive technical study and securing sufficient funding for construction and initial working capital. Completion of the technical report is expected in late 2021 with a construction decision in early 2022. Construction of the first value-added production facility could begin in mid-2022 followed by commissioning in late 2022.
MINERAL EXPLORATION PROJECTS
Green Giant Vanadium Project, Province of Toliara, Madagascar
Overview and Project Plan
The Green Giant Vanadium Project is located 15 kilometres from the Molo Graphite Project and hosts a large sedimentary-hosted vanadium deposit.
Since early 2012, the Company has focused its efforts on the Molo Graphite Project and as such only limited work has been completed on the Green Giant Vanadium Project since that time.
The Company plans to complete additional metallurgical evaluation of the property during the next 12 months to establish a mineral processing flow sheet.
Royalty
On June 28, 2021, the Company received the royalty funding from Vision Blue for the construction of the Molo Graphite Mine. As part of the royalty agreement, Vision Blue will receive a royalty of 1.0% of the gross revenues from sales of vanadium pentoxide (“V2O5”) from the Green Giant Vanadium Project for a period of 15 years following commencement of production of V2O5.
History
In 2007, the Company entered into a joint venture agreement with Madagascar Minerals and Resources SARL (“MMR”) to acquire a 75% interest in the Green Giant property. Pursuant to the agreement, the Company paid $765,000 in cash, issued 250,000 common shares and issued 100,000 common share purchase warrants, which have now expired.
On July 9, 2009, the Company acquired the remaining 25% interest by paying $100,000. MMR retains a 2% NSR. The first 1% NSR can be acquired at the Company’s option by paying $500,000 in cash or common shares and the second 1% NSR can be acquired at the Company’s option by paying $1,000,000 in cash or common shares.
The Green Giant property is located within exploration permits issued by the Bureau de Cadastre Minier de Madagascar (“BCMM”) pursuant to the Mining Code 1999 (as amended) and its implementing decrees. The Green Giant property exploration permits are currently held under the name of our Madagascar subsidiary.
Exploration and Evaluation
A comprehensive diamond-drill program confirmed five vanadium-bearing trends on the property. The Jaky and Manga trends were deemed the most prospective and were the focus of the 2009 and 2010 drill programs. The complete exploration program included of 131 diamond drill holes totalling 21,957 metres, 140 trenches totalling 17,105 metres, 11,035 soil samples and 7,843-line kilometres of airborne surveys.
The exploration work resulted in a National Instrument 43-101 compliant (NI 43-101) resource estimate dated January 14, 2011.
| 15 |
NEXTSOURCE MATERIALS INC.
MANAGEMENT’S DISCUSSION AND ANALYSIS
For the years ended June 30, 2021, and 2020
Mineral Resource Estimate
The current mineral resource estimate for the Green Giant Project is summarised below consisting of the resource categories, the tonnage, the vanadium grade (“V2O5%”) and the contained vanadium (“V2O5”) pounds. A cut-off grade of 0.5% V2O5 was used. The mineral resources are classified in the Indicated and Inferred categories as defined by the Canadian Institute of Mining, Metallurgy and Petroleum definition standards.
Classification | Tonnage (Mt) | Grade (V2O5%) | V2O5 (million pounds) |
Indicated | 49.5 | 0.693% | 756.3 |
Inferred | 9.7 | 0.632% | 134.5 |
Readers are cautioned to refer to the technical study for certain other details and assumptions relating to the above mineral resource and reserve estimates and data verification procedures.
The Technical Report for the Green Giant Project has been filed under the Company’s profile and on SEDAR at www.sedar.com, and is posted on NextSource’s website at www.nextsourcematerials.com. Please see “Green Giant Project, Fotadrevo, Province of Toliara, Madagascar, Technical Report Update NI 43-101. Prepared by AGP Mining Consultants” dated January 14, 2011 for certain other details and assumptions relating to the above mineral resource estimates and data verification procedures.
Sagar Project, Labrador Trough Region, Quebec, Canada
Overview and Project Plan
In 2006, the Company purchased from Virginia Mines Inc. (“Virginia”) a 100% interest in 369 claims located in northern Quebec, Canada. Virginia retains a 2% net smelter royalty (“NSR”) on certain claims within the property. Other unrelated parties also retain a 1% NSR and a 0.5% NSR on certain claims within the property, of which half of the 1% NSR can be acquired by the Company by paying $200,000 and half of the 0.5% NSR can be acquired by the Company by paying $100,000.
Since early 2012, the Company has focused its efforts on the Molo Graphite Project and as such only minimal work has been completed on the Sagar Property since that time.
As of June 30, 2021, the Sagar property consisted of 184 claims covering a total area of 8,539.58 ha.
The Company does not have any immediate plans to complete any further exploration on this property.
| 16 |
NEXTSOURCE MATERIALS INC.
MANAGEMENT’S DISCUSSION AND ANALYSIS
For the years ended June 30, 2021, and 2020
RESULTS OF OPERATIONS
Financial Results for the year ended June 30, 2021 and 2020
|
| For the year ended |
|
| For the year ended |
|
| For the year ended |
| |||
|
| June 30, |
|
| June 30, |
|
| June 30, |
| |||
|
| 2021 |
|
| 2020 |
|
| 2019 |
| |||
Revenues |
| $ | - |
|
| $ | - |
|
| $ | - |
|
Mine development expenses |
|
|
|
|
|
|
|
|
|
|
|
|
Mineral claims (Madagascar) |
|
| 3,335 |
|
|
| 93,954 |
|
|
| 81,969 |
|
Payroll and benefits |
|
| - |
|
|
| - |
|
|
| 13,490 |
|
Engineering and metallurgical (Canada, South Africa) |
|
| 38,598 |
|
|
| 64,850 |
|
|
| 171,210 |
|
Consulting fees (Madagascar) |
|
| 265,635 |
|
|
| - |
|
|
| 686,212 |
|
Travel |
|
| 16,100 |
|
|
| 20,452 |
|
|
| 12,587 |
|
Commercial production success fee |
|
| - |
|
|
| - |
|
|
| - |
|
Total mine development expenses |
|
| 323,668 |
|
|
| 179,256 |
|
|
| 965,468 |
|
Exploration and evaluation expenses |
|
|
|
|
|
|
|
|
|
|
|
|
Mineral claims (Canada) |
|
| 15,335 |
|
|
| 6,623 |
|
|
| 15,469 |
|
Mineral claims (Madagascar) |
|
| 4,449 |
|
|
| 50,000 |
|
|
| 39,875 |
|
Exploration Camp and Admin (Madagascar) |
|
| 27,031 |
|
|
| 9,487 |
|
|
| 82,582 |
|
Total exploration and evaluation expenses |
|
| 46,815 |
|
|
| 66,110 |
|
|
| 137,926 |
|
General and administrative expenses |
|
|
|
|
|
|
|
|
|
|
|
|
Payroll and benefits |
|
| 483,519 |
|
|
| 436,337 |
|
|
| 459,553 |
|
Consulting Fees |
|
| 383,841 |
|
|
| 358,503 |
|
|
| 368,345 |
|
Legal Fees |
|
| 99,316 |
|
|
| 29,344 |
|
|
| 239,366 |
|
Professional Fees |
|
| 155,108 |
|
|
| 95,397 |
|
|
| 111,711 |
|
Public filing expenses |
|
| 131,923 |
|
|
| 72,137 |
|
|
| 87,093 |
|
Travel expenses |
|
| 23,399 |
|
|
| 34,004 |
|
|
| 140,414 |
|
Investor relation expenses |
|
| 31,610 |
|
|
| 22,993 |
|
|
| 49,711 |
|
Insurance expenses |
|
| 30,816 |
|
|
| 22,624 |
|
|
| 18,315 |
|
Rent expenses |
|
| 19,857 |
|
|
| 19,111 |
|
|
| 34,303 |
|
Office and admin |
|
| 37,412 |
|
|
| 23,637 |
|
|
| 24,704 |
|
Total general and administrative expenses |
|
| 1,396,801 |
|
|
| 1,114,087 |
|
|
| 1,533,515 |
|
Share-based compensation |
|
| 3,744,172 |
|
|
| - |
|
|
| 651,692 |
|
Amortization of plant and equipment |
|
| 6,592 |
|
|
| 6,053 |
|
|
| - |
|
Finance costs |
|
| 1,317 |
|
|
| - |
|
|
| - |
|
Foreign currency translation (gain) loss |
|
| 101,252 |
|
|
| 3,552 |
|
|
| (4,565 | ) |
Interest (income) |
|
| (104 | ) |
|
| - |
|
|
| - |
|
Interest expense |
|
| 273 |
|
|
| 2,098 |
|
|
| - |
|
Royalty Fee |
|
| - |
|
|
| - |
|
|
| - |
|
Flow through provision (gain) or loss |
|
| (146,814 | ) |
|
| - |
|
|
| - |
|
Foreign taxes |
|
| 92 |
|
|
| 772 |
|
|
| - |
|
Sub-total before other items |
|
| 5,474,064 |
|
|
| 1,371,928 |
|
|
| 3,284,036 |
|
Change in value of warrant liability |
|
| 36,486,420 |
|
|
| (386,940 | ) |
|
| (73,532 | ) |
Government assistance |
|
| - |
|
|
| (7,353 | ) |
|
| - |
|
Net loss for the year |
|
| (41,960,484 | ) |
|
| (977,635 | ) |
|
| (3,210,504 | ) |
Other comprehensive income |
|
|
|
|
|
|
|
|
|
|
|
|
Items that will be reclassified subsequently to net loss |
|
|
|
|
|
|
|
|
|
|
|
|
Translation adjustment for foreign operations |
|
| 134,639 |
|
|
| 3,196 |
|
|
| 41,713 |
|
Net loss and comprehensive loss for the year |
| $ | (41,825,845 | ) |
| $ | (974,439 | ) |
| $ | (3,168,791 | ) |
| 17 |
NEXTSOURCE MATERIALS INC.
MANAGEMENT’S DISCUSSION AND ANALYSIS
For the years ended June 30, 2021, and 2020
Overall Performance
The Company has two operating segments, consisting of the development of mining operations in Madagascar and the exploration and evaluation of mineral resources in Madagascar and Canada. During the year ended June 30, 2021, the Company incurred a net loss and comprehensive loss of $41,825,845 (2020: net loss and comprehensive loss of $974,439). Highlights include completing a $29.5 million financing package and the initiation of mine development and construction activities for Phase 1 of the Molo Graphite Mine.
Mine Development Expenses
On March 29, 2021, upon obtaining approval to initiate mine construction from the Board, the Company began capitalizing development costs related to the Molo Graphite Mine. As of June 30, 2021, the Company capitalized $708,514 (2020: $nil) as mining property and $3,611,890 (2020: $nil) as assets under construction.
Mine development expenditures increased to $323,668 (2020: $179,256) and consisted primarily of consulting fees of $265,610 (2020: $Nil) that were related to corporate social responsibility (“CSR”) activities performed in Madagascar.
Exploration and Evaluation Expenses
Exploration and evaluation expenditures decreased to $46,815 (2020: $66,110) and consisted primarily of a decrease in Canadian and Madagascar mineral claim renewal fees to $19,784 (2020: $56,623) and an increase in exploration camp and administration expenses to $27,031 (2020: $9,487). No exploration and evaluation activities were completed in 2021 or 2020.
General and Administrative Expenses
General and administrative expenses increased to $1,396,801 (2020: $1,114,087) and consisted primarily of payroll and benefits of $483,519 (2020: $436,337) and consulting fees of $383,841 (2020: $358,503). Legal fees increased to $99,316 (2020: $29,344) related to the negotiation of the investment agreements and other matters. Professional fees increased to $155,108 (2020: $95,397) due to the conversion of the business licenses for our Mauritius subsidiaries and increased audit fees. Public filing fees increased to $131,293 ($72,137) due to the special meeting of shareholders that was held to approve the Vision Blue investment agreement.
Share Based Compensation
Share-based compensation increased to $3,744,172 (2020: $Nil) due to the recognition of the $2,777,404 of fair value of stock options awarded on March 19, 2021, and the recognition of the $966,768 of fair value of unvested RSUs, which are recognized over their respective vesting periods.
Change in Value of Warrant Liabilities
Other items included the recognition of a net loss on the change in the fair value of the warrant liabilities of $36,486,420 (2020: gain of $386,940) which consisted of a loss of $43,294,527 upon the initial recognition of the fair value of the warrants that were issued on May 19, 2021, and a net gain of $6,808,106 from the change in the fair values of the outstanding warrant derivative liabilities during the year.
| 18 |
NEXTSOURCE MATERIALS INC.
MANAGEMENT’S DISCUSSION AND ANALYSIS
For the years ended June 30, 2021, and 2020
QUARTERLY RESULTS
For the Company’s detailed 2021 and 2020 quarterly financial and operating results, see Summarized Quarterly Data in this MD&A.
Overall Performance
During the quarter ended June 30, 2021, the Company incurred a net loss and comprehensive loss of $27,419,558 (2020: net loss and comprehensive loss of $426,243). Highlights during the quarter include completing the second private placement related to the financing package and the initiation of mine development and construction activities for Phase 1 of the Molo Graphite Mine.
Mine Development Expenses
Mine development expenditures increased to $198,886 (2020: $68,954) and consisted primarily of consulting fees of $164,220 (2020: $Nil) that were related to corporate social responsibility (“CSR”) activities performed in Madagascar.
Exploration and Evaluation Expenses
Exploration and evaluation expenditures decreased to a gain of $5,550 (2020: expense of $26,055) and consisted primarily of a reversal of mineral claim renewal fee accruals resulting in a gain of $29,974 (2020: expense of $50,000).
General and Administrative Expenses
General and administrative expenses increased to $472,883 (2020: $229,663) and consisted primarily of payroll and benefits of $186,316 (2020: $87,671) and consulting fees of $115,060 (2020: $86,874). Legal fees increased to $27,424 (2020: $9,005) related to the negotiation of the investment agreements and other matters. Professional fees increased to $41,033 (2020: $31,440) due to the conversion of the business licenses for our Mauritius subsidiaries. Public filing fees increased to $41,341 ($3,364) due to the special meeting of shareholders that was held to approve the Vision Blue investment agreement.
Share Based Compensation
Share-based compensation decreased to a gain of $48,932 (2020: $Nil) due to the revaluation of the fair value of stock options granted on March 19, 2021, and the recognition of the fair value of unvested RSUs, which are recognized over their respective vesting periods.
Change in value of Warrant Liability
Other items included the recognition of a net loss on the change in the fair value of the warrant liabilities of $26,810,060 (2020: loss of $100,323) which consisted of a loss of $43,294,527 upon the initial recognition of the fair value of the warrants that were issued on May 19, 2021, and a net gain of $16,484,467 from the change in the fair values of the outstanding warrant derivative liabilities during the quarter.
STATEMENT OF FINANCIAL POSITION
Cash and Cash Equivalents
The Company’s cash balances are deposited with major financial institutions in Canada and with reputable financial institutions in Madagascar and Mauritius. Limited amounts of cash are currently held in Madagascar and Mauritius.
| Canada |
|
| Mauritius |
|
| Madagascar |
|
| Total |
| |||||
Cash and cash equivalents |
| $ |
|
| $ |
|
| $ |
|
| $ |
| ||||
As of June 30, 2021 |
|
| 22,422,783 |
|
|
| 1,130 |
|
|
| 13,173 |
|
|
| 22,437,086 |
|
As of June 30, 2020 |
|
| 208,251 |
|
|
| - |
|
|
| 14,054 |
|
|
| 222,305 |
|
Amounts Receivable and Prepaid Expenses
Amounts receivables increased to $92,370 (June 30, 2020: $7,539) due primarily to an increase in Canadian sales tax receivables. Prepaid expenses increased to $52,974 (June 30, 2020: $25,484) due primarily to an increase in prepaid insurance premiums.
| 19 |
NEXTSOURCE MATERIALS INC.
MANAGEMENT’S DISCUSSION AND ANALYSIS
For the years ended June 30, 2021, and 2020
Plant and Equipment
Plant and equipment increased to $4,337,161 (2020: $18,111) due primarily to the start of capitalization of development costs related to the Molo Graphite Mine, which included capitalization of the $708,514 commercial production fee provision as mining property and the capitalization of $3,611,890 (2020: $nil) related to construction of the processing plant as assets under construction.
|
| Mining Property |
|
| Assets Under Construction |
|
| Right of Use Assets |
|
| Equipment |
|
| Total |
| |||||
|
| $ |
|
| $ |
|
| $ |
|
| $ |
|
| $ |
| |||||
As at June 30, 2019 |
|
| - |
|
|
| - |
|
|
| - |
|
|
| - |
|
|
| - |
|
Adoption of IFRS 16 |
|
| - |
|
|
| - |
|
|
| 24,164 |
|
|
| - |
|
|
| 24,164 |
|
Disposals |
|
| - |
|
|
| - |
|
|
| - |
|
|
| - |
|
|
| - |
|
Amortization |
|
| - |
|
|
| - |
|
|
| (6,053 | ) |
|
| - |
|
|
| (6,053 | ) |
As at June 30, 2020 |
|
| - |
|
|
| - |
|
|
| 18,111 |
|
|
| - |
|
|
| 18,111 |
|
Additions |
|
| 708,514 |
|
|
| 3,611,890 |
|
|
| - |
|
|
| 5,238 |
|
|
| 4,325,642 |
|
Disposals |
|
| - |
|
|
| - |
|
|
| - |
|
|
| - |
|
|
| - |
|
Amortization |
|
| - |
|
|
| - |
|
|
| (6,037 | ) |
|
| (555 | ) |
|
| (6,592 | ) |
As at June 30, 2021 |
|
| 708,514 |
|
|
| 3,611,890 |
|
|
| 12,074 |
|
|
| 4,683 |
|
|
| 4,337,161 |
|
Accounts Payable and Accrued Liabilities
Accounts payable increased to $383,428 (June 30, 2020: $323,876) due primarily to an increase in trade payables. Accrued liabilities decreased to $221,692 (June 30, 2020: $370,449) due primarily to a decrease in accrued legal expenses.
Short-Term Debt
The Company has a Canada Emergency Business Account (CEBA), which is not subject to an interest rate until after December 31, 2022 and has loan forgiveness provisions whereby 25% of the loan principal will be forgiven if 75% of the loan principal is repaid prior to December 31, 2022.
As of June 30, 2021, the Company had previously withdrawn CAD $40,000 and repaid CAD $30,000 of loan principal. The Company recognized the loan forgiveness of CAD$10,000 resulting in a short-term debt carrying balance on June 30, 2021 of $nil (June 30, 2020: $22,115).
Lease Obligations
The Company is party to several contracts that contain a lease, most of which include office facilities and exploration camp. Leases of low value assets, short term leases and leases with variable payments proportional to the rate of use of the underlying asset do not give rise to a lease obligation.
Upon the Company’s adoption of IFRS 16 on July 1, 2019, the Company recognized $24,164 of lease obligations for leased right-of-use assets in relation to the long-term lease for the exploration camp in Fotadrevo, Madagascar. As of June 30, 2021, the exploration camp lease had a remaining term of 24 months.
The following table sets out the carrying amounts of lease obligations for right-of-use assets that are included in the consolidated statement of financial position and the movements between the reporting periods:
|
| Buildings |
| |
|
| $ |
| |
Balance as at July 1, 2019 |
|
| - |
|
|
|
|
|
|
Adoption of IFRS 16 |
|
| 24,164 |
|
Lease payments |
|
| (4,810 | ) |
Foreign exchange adjustments |
|
| (3,336 | ) |
Balance as at June 30, 2020 |
|
| 16,018 |
|
|
|
|
|
|
Additions |
|
| - |
|
Lease payments |
|
| (6,367 | ) |
Finance costs |
|
| 1,317 |
|
Foreign exchange adjustments |
|
| 131 |
|
Balance as at June 30, 2021 |
|
| 11,099 |
|
| 20 |
NEXTSOURCE MATERIALS INC.
MANAGEMENT’S DISCUSSION AND ANALYSIS
For the years ended June 30, 2021, and 2020
The following table sets out the lease obligations included in the consolidated statements of financial position:
|
| Buildings |
| |
|
| $ |
| |
Current portion of lease obligations |
|
| 5,845 |
|
Long-term lease obligations |
|
| 5,254 |
|
Balance as at June 30, 2021 |
|
| 11,099 |
|
Fair Value of Warrant Liabilities
The fair value of warrant derivative liabilities increased to $45,380,933 (2020: $208,768) due primarily to the recognition of new derivative liabilities related to the private placement completed on July 2, 2020 and May 19, 2021. The initial fair value of $421,861 for warrants granted on July 2, 2020 consisted of $421,861 that was reclassed from equity to warrant liability. The initial fair value of $55,794,527 for the warrants issued on May 19, 2021 consisted of $12,500,000 that was reclassed from equity to warrant liability and $43,294,527 that was recognized through profit and loss.
|
| Warrant Liability |
| |
|
| $ |
| |
Balance as at June 30, 2019 |
|
| 334,618 |
|
|
|
|
|
|
Recognition of derivative liability |
|
| 261,090 |
|
Change in fair value through profit and loss |
|
| (386,940 | ) |
Reclassification to equity on exercise of warrants |
|
| - |
|
Balance as at June 30, 2020 |
|
| 208,768 |
|
|
|
|
|
|
Recognition of derivative liability |
|
| 56,216,388 |
|
Change in fair value through profit and loss |
|
| (6,808,106 | ) |
Reclassification to equity on exercise of warrants |
|
| (4,236,117 | ) |
Balance as at June 30, 2021 |
|
| 45,380,933 |
|
Provisions
On April 16, 2014, the Company signed a Sale and Purchase Agreement and a Mineral Rights Agreement (together “the Agreements”) with Malagasy to acquire the remaining 25% interest in the Molo Graphite Property. Pursuant to the Agreements, a further cash payment of approximately $806,200 (CAD$1,000,000) will be due within five days of the commencement of commercial production (“Commercial Production Fee”).
As of June 30, 2021, the Company believes that construction can be completed within 12 months and that commercial production could be declared on or around June 30, 2022, and as such recognized a provision of $708,514 based on the present value of the Commercial Production Fee using a 13.8% discount rate. The Commercial Production Fee provision was capitalized as mining property under property, plant and equipment.
The provision relating to a shortfall in flow-through expenditures decreased to $29,508 (June 30, 2020: $174,419) due to the completion of settlements and a decrease in the provision.
LIQUIDITY AND CAPITAL RESOURCES
There were no changes in the Company’s approach to capital management during the year ended June 30, 2021.
In managing liquidity, the Company’s primary objective is to ensure the entity can continue as a going concern while working to obtain additional funding to meet its obligations as they come due. The Company’s operations to date have been funded by issuing equity and a royalty financing agreement. The Company expects to continue to improve the working capital position by securing additional financing.
The Company’s investment policy is to invest excess cash in very low risk financial instruments such as term deposits or by holding funds in high yield savings accounts with major Canadian banks. Financial instruments are exposed to certain financial risks, which may include currency risk, credit risk, liquidity risk and interest rate risk.
| 21 |
NEXTSOURCE MATERIALS INC.
MANAGEMENT’S DISCUSSION AND ANALYSIS
For the years ended June 30, 2021, and 2020
The Company’s mineral property interests are all in the exploration, development, and construction stage. The Company has yet to generate any revenue from mining operations. As such the Company is dependent on obtaining external financing to fund exploration and evaluation, development, construction and operating expenditures. Management continues to assess the merits of mineral properties on an ongoing basis and may seek to acquire new properties or to increase ownership interests if it believes there is sufficient geologic and economic potential.
Management mitigates the risk and uncertainty associated with raising additional capital in current economic conditions through cost control measures that minimizes discretionary disbursements and reduces exploration expenditures that are deemed of limited strategic value.
The Company manages the capital structure (consisting of shareholders’ deficiency) on an ongoing basis and adjusts in response to changes in economic conditions and risks characteristics of its underlying assets. Adjustments to the Company’s capital structure may involve the issuance of new shares, assumption of new debt, acquisition or disposition of assets, or adjustments to the amounts held in cash, cash equivalents and short-term investments.
The Company is not subject to any externally imposed capital requirements.
Working Capital Balance
As of June 30, 2021, the Company had a working capital deficit of $24,147,490 (June 30, 2020: deficit of $918,048). Excluding the $45,380,933 warrant derivative liabilities, which are expected to be settled through the issuance of common shares upon the exercise or expiration of the underlying common share purchase warrants, the Company had a working capital surplus of $21,233,443 (June 30, 2020: deficit of $709,280). Although the Company has a working capital surplus excluding the warrant derivate liabilities, the working capital surplus is expected to be utilized in the construction of the Molo Graphite Mine, commissioning of the processing plant, exploration and evaluation activities, development of value-added processing facilities, and general and administrative expenditures.
|
| As at |
|
| As at |
| ||
|
| June 30, |
|
| June 30, |
| ||
|
| 2021 |
|
| 2020 |
| ||
|
|
|
|
|
|
| ||
Current Assets: |
|
|
|
|
|
| ||
Cash and cash equivalents |
| $ | 22,437,086 |
|
| $ | 222,305 |
|
Amounts receivable |
|
| 92,370 |
|
|
| 7,539 |
|
Prepaid expenses |
|
| 52,974 |
|
|
| 25,484 |
|
Total Current Assets |
|
| 22,582,430 |
|
|
| 255,328 |
|
|
|
|
|
|
|
|
|
|
Current Liabilities: |
|
|
|
|
|
|
|
|
Accounts payable |
|
| 383,428 |
|
|
| 323,876 |
|
Accrued liabilities |
|
| 221,692 |
|
|
| 370,449 |
|
Share subscriptions |
|
| - |
|
|
| 68,411 |
|
Short term debt |
|
| - |
|
|
| 22,115 |
|
Provision |
|
| 738,022 |
|
|
| 174,418 |
|
Fair value of warrant derivative liabilities |
|
| 45,380,933 |
|
|
| 208,768 |
|
Current portion of lease obligations |
|
| 5,845 |
|
|
| 5,339 |
|
Total Current Liabilities |
|
| 46,729,920 |
|
|
| 1,173,376 |
|
|
|
|
|
|
|
|
|
|
Working Capital (Deficit) surplus |
|
| (24,147,490 | ) |
|
| (918,048 | ) |
| 22 |
NEXTSOURCE MATERIALS INC.
MANAGEMENT’S DISCUSSION AND ANALYSIS
For the years ended June 30, 2021, and 2020
Cash Flows - Sources and Uses of Cash
The following are the Company’s cash flows from operating, investing and financing activities for the years ended June 30, 2021 and 2020:
|
| Year ended |
|
| Year ended |
|
| Year ended |
| |||
|
| June 30, |
|
| June 30, |
|
| June 30, |
| |||
|
| 2021 |
|
| 2020 |
|
| 2019 |
| |||
|
|
|
|
|
|
|
|
|
| |||
Operating activities |
|
|
|
|
|
|
|
|
| |||
Net loss for the year |
| $ | (41,960,484 | ) |
| $ | (977,635 | ) |
| $ | (3,210,504 | ) |
Add (deduct) items not affecting cash: |
|
|
|
|
|
|
|
|
|
|
|
|
Amortization of plant and equipment |
|
| 6,592 |
|
|
| 6,053 |
|
|
| - |
|
Change in value of warrant derivative liability |
|
| 36,486,420 |
|
|
| (386,940 | ) |
|
| (73,532 | ) |
Share-based compensation (options) |
|
| 3,744,172 |
|
|
| - |
|
|
| 651,692 |
|
Government assistance |
|
| - |
|
|
| (7,373 | ) |
|
| - |
|
Change in value of lease obligations |
|
| 1,448 |
|
|
| (3,337 | ) |
|
| - |
|
Change in non-cash working capital balances: |
|
|
|
|
|
|
|
|
|
|
|
|
(Increase) decrease in amounts receivable and prepaid expenses |
|
| (112,321 | ) |
|
| 51,049 |
|
|
| (28,291 | ) |
Increase (decrease) in accounts payable and accrued liabilities |
|
| (89,205 | ) |
|
| (69,692 | ) |
|
| 425,320 |
|
Increase (decrease) in provision |
|
| 563,604 |
|
|
| (6,234 | ) |
|
| - |
|
Increase (decrease) in share subscriptions received in advance |
|
| (68,411 | ) |
|
| 68,411 |
|
|
| - |
|
Net cash used in operating activities |
|
| (1,428,185 | ) |
|
| (1,325,698 | ) |
|
| (2,235,315 | ) |
|
|
|
|
|
|
|
|
|
|
|
|
|
Cash flows from investing activities |
|
|
|
|
|
|
|
|
|
|
|
|
Additions to property, plant and equipment |
|
| (4,325,642 | ) |
|
| - |
|
|
| - |
|
Net cash used in investing activities |
|
| (4,325,642 | ) |
|
| - |
|
|
| - |
|
|
|
|
|
|
|
|
|
|
|
|
|
|
Cash flows from financing activities |
|
|
|
|
|
|
|
|
|
|
|
|
Proceeds from issuance of common shares |
|
| 19,976,571 |
|
|
| 998,620 |
|
|
| 2,444,015 |
|
Exercise of stock options |
|
| 560,406 |
|
|
| - |
|
|
| - |
|
Exercise of warrants |
|
| 1,108,200 |
|
|
| - |
|
|
| - |
|
Common share issue costs finder shares |
|
| - |
|
|
| - |
|
|
| 17,966 |
|
Common share issue costs |
|
| (113,446 | ) |
|
| (7,821 | ) |
|
| (77,750 | ) |
Short term debt |
|
| (22,115 | ) |
|
| 29,486 |
|
|
| - |
|
Lease liability principal payments |
|
| (6,367 | ) |
|
| (4,810 | ) |
|
| - |
|
Proceeds from royalty financing |
|
| 6,330,721 |
|
|
| - |
|
|
| - |
|
Net cash provided by financing activities |
|
| 27,833,970 |
|
|
| 1,015,475 |
|
|
| 2,384,231 |
|
|
|
|
|
|
|
|
|
|
|
|
|
|
Effect of exchange rate changes on cash and cash equivalents |
|
| 134,638 |
|
|
| 3,197 |
|
|
| 41,713 |
|
Net increase (decrease) in cash and cash equivalents during the year |
|
| 22,214,781 |
|
|
| (307,026 | ) |
|
| 190,629 |
|
|
|
|
|
|
|
|
|
|
|
|
|
|
Cash and cash equivalents, beginning of year |
|
| 222,305 |
|
|
| 529,331 |
|
|
| 338,702 |
|
Cash and cash equivalents, end of year |
| $ | 22,437,086 |
|
| $ | 222,305 |
|
| $ | 529,331 |
|
Operating Activities
Net cash used in operating activities increased to $1,428,185 (2020: $1,325,698) due primarily to increased expenditures related to the development of the Molo Graphite Mine.
Investing Activities
Net cash used in investing activities increased to $4,325,642 (2020: $Nil) due primarily to the start of capitalization of mine development costs.
Financing Activities
Net cash provided by financing activities increased to $27,833,970 (2020: $1,015,475) due primarily to the completion of the private placements and royalty financings related to the financing agreement with Vision Blue and from the exercise of in-the-money stock options and warrants.
| 23 |
NEXTSOURCE MATERIALS INC.
MANAGEMENT’S DISCUSSION AND ANALYSIS
For the years ended June 30, 2021, and 2020
The following events occurred during the year ended June 30, 2021:
| (a) | On July 2, 2020, the Company completed a non-brokered private placement of 6,157,887 units at a price of $0.24 (CAD$0.325) per unit for gross proceeds of $1,476,571 (CAD$2,001,310). Each unit consisted of one common share of the Company and one-half of one common share purchase warrant, with each full warrant entitling the holder to acquire one additional common share of the Company at a price of $0.48 (CAD$0.65) per share for a period of 24 months. No finder fees or commissions were paid in association with the private placement. In connection with the non-brokered private placement, the Company incurred $9,293 in share issuance costs. |
|
|
|
| (b) | On December 22, 2020, a total of 72,174 stock options priced at $0.56 were exercised into 72,174 common shares for gross proceeds of $40,418. |
|
|
|
| (c) | On February 9, 2021, a total of 147,000 stock options priced at $0.66 were exercised into 147,000 common shares for gross proceeds of $97,054. |
|
|
|
| (d) | On February 12, 2021, a total of 55,000 warrants priced at CAD$0.90 and 15,385 warrants at a price of CAD$0.65 were exercised into 70,385 common shares for gross proceeds of $46,760. |
|
|
|
| (e) | On February 19, 2021, a total of 22,223 stock options priced at CAD$0.90 were exercised into 22,223 common shares for gross proceeds of $15,857 and a total of 517,443 RSUs that vested on February 7, 2021 were converted into common shares for no additional consideration. |
|
|
|
| (f) | On February 23, 2021, a total of 73,000 stock options priced at $0.66 were exercised into 73,000 common shares for gross proceeds of $48,439. |
|
|
|
| (g) | On February 26, 2021, a total of 111,112 warrants priced at CAD$0.90 were exercised into 111,112 common shares for gross proceeds of $79,172. |
|
|
|
| (h) | On March 4, 2021, a total of 50,000 warrants priced at CAD$0.65 were exercised into 50,000 common shares for gross proceeds of $25,681. |
|
|
|
| (i) | On March 8, 2021, a total of 290,000 stock options priced at CAD$1.00 and 220,000 stock options priced at $0.66 were exercised into 510,000 common shares for gross proceeds of $374,494. |
|
|
|
| (j) | On March 15, 2021, the Company completed a non-brokered private placement of 12,000,000 common shares at a price of CAD$0.65 per share for total gross proceeds of $6,000,000 (CAD$7,800,000). In connection with the non-brokered private placement, the Company incurred $16,367 in share issuance costs. |
|
|
|
| (k) | On April 12, 2021, a total of 361,500 warrants priced at CAD$0.65 and 55,555 warrants priced at CAD$0.90 were exercised into 417,055 common shares for gross proceeds of $226,506. |
|
|
|
| (l) | On May 19, 2021, the Company completed a non-brokered private placement of 23,214,286 units at a price of CAD$0.65 per unit for total gross proceeds of $12,500,000 (CAD$15,089,286). Each unit consisted of one common share of the Company and one common share purchase warrant, with each warrant entitling the holder to acquire one additional common share of the Company at a price of CAD$1.00 per share for a period of 24 months. No finder fees or commissions were paid in association with the private placement. In connection with the non-brokered private placement, the Company incurred $87,788 in share issuance costs. |
|
|
|
| (m) | On May 25, 2021, a total of 750,000 warrants priced at CAD$0.65 were exercised into 750,000 common shares for gross proceeds of $403,705. |
|
|
|
| (n) | On June 7, 2021, a total of 200,000 warrants priced at CAD$0.90 were exercised into 200,000 common shares for gross proceeds of $148,518. |
|
|
|
| (o) | On June 23, 2021, a total of 222,223 warrants priced at CAD$0.90 were exercised into 222,223 common shares for gross proceeds of $162,000. |
|
|
|
| (p) | On June 28, 2021, the Company received the royalty funding from Vision Blue consisting of $8.0 million. The $1.5 million financing fee and $169,279 in legal fees related to the royalty agreement were netted against the carrying value of the royalty obligation, which will be recognized over the term of the minimum repayment period. |
|
|
|
| (q) | The Company repaid $22,386 to the Canada Emergency Business Account (CEBA). |
The following events occurred during the year ended June 30, 2020:
| (a) | On October 25, 2019, the Company closed a non-brokered private placement offering of 2,907,777 units at a price of $0.34 (CAD$0.45) per unit for aggregate gross proceeds of $998,620 (CAD$1,308,500). Each unit consisted of one common share and one-half common share purchase warrant, with each full warrant exercisable into one common share at an exercise price of $0.70 (CAD$0.90) for a period of two years. In connection with the non-brokered private placement, the Company incurred $7,820 in share issuance costs. |
|
|
|
| (b) | The Company withdrew $29,486 from the Canada Emergency Business Account (CEBA). |
| 24 |
NEXTSOURCE MATERIALS INC.
MANAGEMENT’S DISCUSSION AND ANALYSIS
For the years ended June 30, 2021, and 2020
Contractual Obligations and Commitments
The Company is subject to contractual obligations related to the royalty obligation minimum repayments and the lease agreement for the camp in Fotadrevo. The Company’s future operating cash flows are expected to be sufficient to satisfy its contractual obligations related to these obligations and commitments.
The Company’s contractual obligations related to the royalty minimum payments are set out in the following table:
|
| Obligation |
| |
|
| $ |
| |
Within 12 months |
|
| - |
|
Between 13 and 24 months |
|
| 948,750 |
|
Between 25 and 36 months |
|
| 1,897,500 |
|
Between 37 and 48 months |
|
| 1,897,500 |
|
Between 49 and 60 months |
|
| 1,897,500 |
|
Thereafter |
|
| 12,333,750 |
|
Total undiscounted minimum payments and interest |
|
| 18,975,000 |
|
Future minimum lease payments required to meet obligations that have initial or remaining non-cancellable lease terms are set out in the following table:
|
| Buildings |
| |
|
| $ |
| |
Within 12 months |
|
| 6,019 |
|
Between 13 and 24 months |
|
| 6,019 |
|
Total undiscounted lease obligations |
|
| 12,038 |
|
Off-balance sheet arrangements
The Company does not have any off-balance sheet arrangements including any arrangements that would affect the liquidity, capital resources, market risk support and credit risk support or other benefits.
Liquidity risk and capital resource analysis
Liquidity risk is the risk that the Company will not be able to meet its obligations associated with financial liabilities. Liquidity risk arises from the Company’s financial obligations and in the management of its assets, liabilities and capital structure. The Company manages this risk by regularly evaluating its liquid financial resources to fund current and long-term obligations and to meet its capital commitments in a cost-effective manner. The main factors that affect liquidity include working capital requirements, capital-expenditure requirements, and equity capital market conditions. The Company’s liquidity requirements are met through a variety of sources, including cash and cash equivalents and equity capital markets.
Other than accounts payable and accrued liabilities, which are primarily due within 30 days, the warrant liabilities, which are expected to be fully expensed by their respective exercise or expirations, and the royalty obligations, which are expected to be settled through minimum repayments starting in fiscal 2023, none of the Company’s obligations have contractual maturities during the next 12 months.
As of June 30, 2021, the Company had cash and cash equivalents of $22,437,086 (June 30, 2020: $222,305) to settle current liabilities of $46,729,920 (June 30, 2020: $1,173,376). Excluding the $45,380,933 warrant derivative liabilities, which are expected to be settled through the issuance of common shares upon the exercise or expiration of the underlying common share purchase warrants, the Company had current liabilities of $1,348,987 (June 30, 2020: $964,608). Although the Company is not currently exposed to liquidity risk, a significant portion of the surplus cash is expected to be utilized to complete construction of the mine and to fund mine working capital and general and administrative expenditures over the next 12 months.
As of June 30, 2021, the Company remaining Molo Graphite Mine construction costs were estimated at approximately $18.4 million, mine working capital requirements were estimated at approximately $1.3 million, and general and administrative expenditures until the completion of construction were estimated at $3.0 million. As part of the royalty financing agreement, the Company will receive a further $3.0 million from Vision Blue upon achieving 80% of capital expenditures related to the construction of the mine, which is expected to be reached on or around December 31, 2021. The Company expects to receive additional funding from the exercise of in-the-money warrants that are due to expire in October 2021 and July 2022. As a result, the Company believes its capital resources will be sufficient to complete construction of the mine and to fund mine working capital and general and administrative expenditures over the next 12 months. Should unexpected financial circumstances arise in the future, the Company may choose to decrease certain discretionary expenditures.
| 25 |
NEXTSOURCE MATERIALS INC.
MANAGEMENT’S DISCUSSION AND ANALYSIS
For the years ended June 30, 2021, and 2020
While the Company has been successful in obtaining required funding in the past, there is no assurance that future financings will be available. Based on management’s assessment of its past ability to obtain required funding, the Company believes that it will be able to satisfy its current and long-term obligations as they come due.
Credit risk
The Company does not currently have commercial customers and therefore does not have any credit risk related to amounts receivables. The Company has credit risk arising from the potential from counterparty default on cash and cash equivalents held on deposit with financial institutions. The Company manages this risk by ensuring that deposits are only held with large Canadian banks and financial institutions, whereas any offshore deposits are held with reputable financial institutions.
Market risks
Market risk is the potential for financial loss from adverse changes in underlying market factors, including foreign exchange rates, commodity prices and interest rates.
| · | Interest rate risk: This is the sensitivity of the fair value or of the future cash flows of a financial instrument to changes in interest rates. The Company does not have any financial assets or liabilities that are subject to variable interest rates. |
|
|
|
| · | Commodity price risks: This is the sensitivity of the fair value of, or of the future cash flows, from mineral assets. The Company manages this risk by monitoring mineral prices and commodity price trends to determine the appropriate timing for funding the exploration or development of its mineral assets, or for the acquisition or disposition of mineral assets. The Company does not have any mineral assets at the development or production stage carried at historical cost. The Company has expensed the acquisition and exploration costs of its exploration stage mineral assets. |
|
|
|
| · | Currency risk: This is the sensitivity of the fair value or of the future cash flows of financial instruments to changes in foreign exchange rates. The Company transacts in currencies other than the US dollar, including the Canadian dollar, the Madagascar Ariary, the Euro and the South African Rand. The Company purchases services and has certain salary commitments in those currencies. The Company also has monetary and financial instruments that may fluctuate due to changes in foreign exchange rates. Derivative financial instruments are not used to reduce exposure to fluctuations in foreign exchange rates. The Company is not sensitive to foreign exchange exposure since it has not made any commitments to deliver products quoted in foreign currencies. The Company is not sensitive to foreign exchange risk arising from the translation of the financial statements of subsidiaries with a functional currency other than the US dollar since it does not have any material assets and liabilities measured through other comprehensive income. As of June 30, 2021, the Company estimated that a 10% decrease of the USD versus foreign exchange rates would result in a gain of $1,463 (2020: loss of $66,259). |
|
| June 30, |
|
| June 30, |
| ||
|
| 2021 |
|
| 2019 |
| ||
Cash and cash equivalents (CAD) |
| $ | 1,011,996 |
|
| $ | 130,414 |
|
Cash and cash equivalents (MGA) |
|
| 1,698 |
|
| $ | 4,003 |
|
Amounts receivable (CAD) |
|
| 73,707 |
|
|
| 7,513 |
|
Amounts receivable (MGA) |
|
| 26 |
|
|
| 26 |
|
Accounts payable and accrued liabilities (CAD) |
|
| (137,329 | ) |
|
| (383,006 | ) |
Accounts payable and accrued liabilities (MGA) |
|
| (30,574 | ) |
|
| (1,061 | ) |
Accounts payable and accrued liabilities (EUR) |
|
| (166,869 | ) |
|
| (177,654 | ) |
Provisions (CAD) |
|
| (738,022 | ) |
|
| (242,829 | ) |
Net foreign exchange exposure in USD |
| $ | 14,633 |
|
|
| (662,594 | ) |
Impact of 10% change in foreign exchange rates |
| $ | 1,463 |
|
|
| (66,259 | ) |
OUTLOOK
The following section contains “forward-looking statements” and “forward-looking information” within the meaning of applicable securities laws. The Company continues to monitor the implications of the Covid-19 Pandemic. The manner and extent that the pandemic, and measures taken as a result of the pandemic by governments and others, will affect the Company in ways that cannot be predicted with certainty. See the Cautionary Statement Regarding Forward-Looking Information and Uncertainty due to the Covid-19 Pandemic in this MD&A for a discussion of assumptions and risks relating to such statements and information and a discussion of certain risks facing the Company relating to the pandemic.
| 26 |
NEXTSOURCE MATERIALS INC.
MANAGEMENT’S DISCUSSION AND ANALYSIS
For the years ended June 30, 2021, and 2020
2022 Outlook
The Company is not providing any guidance on expected production volumes, revenues and operating costs for the Molo Graphite Mine, which is expected to begin commissioning in May 2022. Although the Company expects to produce sellable product during fiscal 2022, the Company does not expect to achieve full nameplate capacity until after June 30, 2022.
Remaining capital expenditures required to complete Phase 1 of the Molo Graphite Mine are estimated at approximately $18.0 to $19.0 million plus mine working capital estimated at approximately $1.1 to $1.5 million. As June 30, 2021, the Company had capitalized $3.6 million related to the construction of the mine. The Company expects to receive $3.0 million from Vision Blue upon achieving 80% of capital expenditures related to the construction of the mine, which is expected to occur on or around December 31, 2021.
Mine development expenditures, prior to any capitalizations, are expected to be approximately $0.5 to $0.6 million primarily due to technical studies related to a Phase 2 mine expansion, as compared to $0.3 million in 2021.
Exploration and evaluation expenditures are expected to be approximately $0.1 to $0.2 million primarily due to the completion of metallurgical evaluations and technical studies related to the Green Giant Vanadium Project, as compared to $0.05 million in 2021.
Value-added processing expenditures, prior to any capitalizations, are expected to be approximately $1.0 to $1.5 million primarily due to the completion of technical studies related to the construction of a value-added processing facilities capable of producing coated, spheronized and purified graphite (“CSPG”), as compared to $Nil in 2021.
General and administrative expenses, prior to any capitalizations, are expected to be approximately $2.5 million to $3.5 million, as compared to $1.6 million in 2021.
OUTSTANDING SECURITIES
The Company’s common shares trade on the Toronto Stock Exchange (the “TSX”) under the symbol “NEXT” and the OTCQB under the symbol “NSRCF”. The Company’s common shares have no par value and the authorized share capital is composed of an unlimited number of common shares.
On May 20, 2021, the Company gave effect to a 1 for 10 consolidation of its common shares and all outstanding warrants, stock options and restricted share units. All of the per share amounts in the consolidated financial statements and this MD&A have been restated to give effect to the share consolidation on a retroactive basis.
As of June 30, 2021, the Company had:
| · | 98,184,260 common shares issued and outstanding (June 30, 2020: 53,649,481). |
| · | 25,904,122 common share purchase warrants outstanding (June 30, 2020: 2,519,157) with a weighted average expiration of 1.77 years (June 30, 2020: 0.82 years), which are exercisable into 25,904,122 (June 30, 2020: 2,519,157) common shares at a weighted average exercise price of USD$0.78 (June 30, 2020: USD$0.70). All outstanding warrants vested on their respective issue dates. |
| · | 2,780,000 stock options outstanding (June 30, 2020: 3,625,001) with a weighted average expiration of 2.15 years (June 30, 2020: 2.28), which are exercisable into 2,780,000 common shares (June 30, 2020: 3,625,001) at a weighted average exercise price of USD$1.73 (June 30, 2020: USD$0.67). All the outstanding stock options vested on their respective grant dates. |
| · | 475,000 RSUs issued and outstanding (June 30, 2020: Nil) with a weighted average expiration of 1.40 years (June 30, 2020: nil) which entitle the holders to receive 475,000 common shares (June 30, 2020: nil) for no additional consideration subject to satisfying the vesting conditions. |
On September 23, 2021, a total of 211,112 warrants priced at CAD$0.90 were exercised into 211,112 common shares for gross proceeds of $150,100.
The following table sets out the maximum number of common shares that would be outstanding if all dilutive instruments outstanding as of the date of this MD&A were exercised:
Common Shares Outstanding |
|
| 98,395,372 |
|
Warrants |
|
| 25,693,010 |
|
Stock options |
|
| 2,780,000 |
|
Restricted Share Units (RSUs) |
|
| 475,000 |
|
Fully Diluted Common Shares |
|
| 127,343,382 |
|
| 27 |
NEXTSOURCE MATERIALS INC.
MANAGEMENT’S DISCUSSION AND ANALYSIS
For the years ended June 30, 2021, and 2020
SUSTAINABLE DEVELOPMENT AND ENVIRONMENTAL POLICIES
The Company is committed to the health and safety of our workers and communities, the protection of the environment, and to the rights, culture and development of the local communities in which it operates.
The Company is in the process of incorporating health, safety and environmental sustainability into all aspects and stages of its business, from corporate objectives to mine development, exploration and evaluation activities, day-to-day operations and site closure. The Company has created an Environmental, Social and Governance (“ESG”) Committee for the Board of Directors (the “ESG Committee”), which is currently developing a “Sustainable Development Policy” for the Company.
The Company is evaluating but has not adopted the requirements of the Mining Association of Canada’s industry leading Towards Sustainable Mining Initiative (the “TSM Initiative”), as well as the Global Reporting Initiative’s sustainability reporting guidelines for the mining industry (the “GRI Reporting Guidelines”). The TSM Initiative helps mining companies evaluate the quality, comprehensiveness and robustness of their management systems, tailings management, biodiversity management, health and safety, indigenous and community relations, prevention of child and forced labour, and water stewardship. The GRI Reporting Guidelines consist of principles for defining report content and ensuring the quality of reported information.
The Company’s exploration activities and mining and processing operations are subject to state, federal, provincial, territorial, regional and local environmental laws and regulations in the jurisdictions in which the Company’s activities and facilities are located. These include the requirements for planning and implementing the closure and reclamation of mining properties and related financial assurance.
As part of the advancement of the Molo Graphite Mine project, the Company completed a comprehensive Environmental and Social Impact Assessment (“ESIA”) in 2018, which was developed to local Madagascar (“Malagasy”), Equator Principles, World Bank and International Finance Corporation (“IFC”) standards.
On April 11, 2019, the Company announced it had received the Global Environmental Permit for the Molo Graphite Mine from the Madagascar Ministry of Environment’s Office National pour l’Environnement (the National Office for the Environment; or “ONE”). This follows the completion of the Environmental & Social Impact Assessment (“ESIA”) and Relocation Action Plan (“RAP���) to International Finance Corporation (IFC) performance standards and World Bank standards, the completion of local and regional stakeholder and community engagement, and the completion of negotiations and signed agreements with all potentially affected land occupants to accept compensation for any affected crops and grazing land and relocation if needed.
TRANSACTIONS WITH RELATED PARTIES
Parties are related if one party has the direct or indirect ability to control or exercise significant influence over the other party in making operating and financial decisions. Parties are also related if they are subject to common control or common significant influence. Other related parties include companies controlled by key management personnel. Related parties include key management, which consists of the Board of Directors, Chief Executive Officer, Chief Financial Officer, and the Senior Vice Presidents of the Company.
A transaction is considered a related party transaction when there is a transfer of economic resources or financial obligations between related parties. Related party transactions that are in the normal course of business and have commercial substance are measured at the fair value. Balances and transactions between the Company and its wholly owned subsidiaries, which are related parties of the Company, have been eliminated and are not disclosed in this note.
The following key management related party transactions occurred during the following reporting periods:
|
| Year ended |
|
| Year ended |
|
| Year ended |
| |||
|
| June 30, |
|
| June 30, |
|
| June 30, |
| |||
|
| 2021 |
|
| 2020 |
|
| 2019 |
| |||
Payroll and benefits |
| $ | 448,984 |
|
| $ | 381,777 |
|
| $ | 439,175 |
|
Consulting fees |
|
| 341,541 |
|
|
| 331,682 |
|
|
| 335,045 |
|
Professional fees |
|
| 35,946 |
|
|
| - |
|
|
| - |
|
Share-based compensation |
|
| 3,744,172 |
|
|
| - |
|
|
| 640,692 |
|
Total |
| $ | 4,570,643 |
|
| $ | 713,459 |
|
| $ | 1,414,912 |
|
The following key management related party balances existed as of the end of the following reporting periods:
|
| As of |
|
| As of |
| ||
|
| June 30, |
|
| June 30, |
| ||
|
| 2021 |
|
| 2020 |
| ||
Amounts receivable from key management |
| $ | 17,007 |
|
| $ | - |
|
Prepaid expenses to companies controlled by key management |
| $ | 6,949 |
|
| $ | 3,178 |
|
Accounts payable due to companies controlled by key management |
| $ | - |
|
| $ | 86,685 |
|
Accrued liabilities due to key management |
| $ | 64,503 |
|
| $ | 54,727 |
|
| 28 |
NEXTSOURCE MATERIALS INC.
MANAGEMENT’S DISCUSSION AND ANALYSIS
For the years ended June 30, 2021, and 2020
LEGAL PROCEEDINGS
The Company is not currently involved in any litigation that we believe could have a material adverse effect on our financial condition or results of operations. There is no regulatory action, suit, proceeding, inquiry or investigation before or by any court, public board, government agency, securities commissions, self-regulatory organization or body pending or, to the knowledge of the executive officers of our Company or any of our subsidiaries, threatened against or affecting our Company, our common stock, any of our subsidiaries or of our companies or our subsidiaries’ officers or directors in their capacities as such, in which an adverse decision could have a material adverse effect.
CRITICAL IFRS ACCOUNTING POLICIES AND ACCOUNTING ESTIMATES
The Company’s annual consolidated financial statements are prepared in accordance with International Financial Reporting Standards (“IFRS”) as issued by the International Accounting Standards Board. The Company’s significant accounting policies, including a summary of current and future changes in accounting policies, are disclosed in Note 3 in the annual consolidated financial statements.
To prepare financial statements in conformity with IFRS, the Company must make estimates, judgements and assumptions concerning the future that affect the carrying values of assets and liabilities as of the date of the financial statements and the reported values of revenues and expenses during the reporting period. By their nature, these are uncertain and actual outcomes could differ from the estimates, judgments and assumptions. The impacts of such estimates are pervasive throughout the financial statements and may require accounting adjustments based on future occurrences. Revisions to accounting estimates are recognized in the period in which the estimate is revised and also in future periods when the revision affects both current and future periods. Significant accounting judgments, estimates and assumptions are reviewed on an ongoing basis. The critical judgments, estimates and assumptions used in the application of accounting policies during the year ended June 30, 2021 are disclosed in Note 4 to the annual consolidated financial statements.
Management has discussed the development and selection of critical accounting policies and estimates with the Audit Committee, which has reviewed the Company’s disclosure in this MD&A.
RISK FACTORS
The Company manages risks inherent to its business and has procedures to identify and manage significant operational and financial risks. The reader is cautioned to carefully review the risk factors identified below in addition to the risk factors disclosed in our financial statements for the year ended June 30, 2021 and our most recent AIF.
Any such risk factors could materially affect the Company’s business, financial condition and/or future operating results and prospects and could cause actual events to differ materially from those described in forward-looking statements and information relating to the Company. Additional risks and uncertainties not currently identified by the Company or that the Company currently believes not to be material also may materially and adversely affect the Company’s business, financial condition, operations or prospects.
Uncertainty due to the Covid-19 Pandemic
The impact of COVID-19 on the Company has been limited since it does not have any active exploration programs and construction activities related to the Molo Graphite Mine have mainly focused on the assembly of the processing plant off-shore by our EPC contractor. Certain of our directors, officers, employees, consultants, and contractors have been indirectly impacted by intermittent lockdowns that have been imposed in Canada, Madagascar, Mauritius and in South Africa.
The Company has tried to incorporate the impact COVID-19 outbreaks and intermittent lockdowns into the development plans for the Molo Graphite Mine. Notwithstanding, intermittent lockdowns have the potential to cause unforeseen delays in the plant assembly and delivery schedule, as well as with mine site works construction schedule. It is not possible for the Company to predict the duration or magnitude of adverse impacts from further outbreaks and predict the effects on the Company’s business or results of operations.
The duration and full financial effect of the COVID-19 pandemic is unknown at this time, as are the measures taken by governments, the Company or others related to the COVID-19 pandemic. Any estimate of the length and severity of these developments is therefore subject to significant uncertainty, and accordingly estimates of the extent to which the COVID-19 pandemic may materially and adversely affect the Company’s operations, financial results and condition in future periods are also subject to significant uncertainty.
Inputs and assumptions relate to, among other things, interest rates, foreign exchange rates, cost of capital, commodity prices, and the amount and timing of future cash flows, while accounting judgments take into consideration the business and economic uncertainties related to the COVID-19 pandemic and the future response of governments, the Company and others to those uncertainties. In the current environment, the inputs and assumptions and judgements are subject to greater variability than normal, which could in the future significantly affect judgments, estimates and assumptions made by management as they relate to potential impact of the COVID-19 pandemic on various financial accounts and note disclosures and could lead to a material adjustment to the carrying value of the assets or liabilities affected. The impact of current uncertainty on judgments, estimates and assumptions includes the Company’s valuation of the long-term assets (including the assessment for impairment and impairment reversal), estimation of reclamation provisions, estimation of mineral reserves and mineral resources, and estimation of income and mining taxes. Actual results may differ materially from these estimates.
| 29 |
NEXTSOURCE MATERIALS INC.
MANAGEMENT’S DISCUSSION AND ANALYSIS
For the years ended June 30, 2021, and 2020
Development projects are uncertain, and it is possible that actual capital and operating costs and economic returns will differ significantly from those estimated for a project prior to production.
Mine development projects, including the Molo Graphite Mine, require significant expenditures during the development phase before production is possible.
Development projects are subject to the completion of successful feasibility studies and environmental assessments, issuance of necessary governmental permits and availability of adequate financing. The economic feasibility of development projects is based on many factors such as: estimation of capital mineral reserves, anticipated recoveries, environmental considerations and permitting, future commodity prices, and anticipated capital and operating costs of these projects. It is not unusual in new mining operations to experience unexpected problems during the start-up phase, and delays can often occur at the start of production.
Particularly for development projects, mineral reserve estimates, sustaining costs and cash operating costs are, to a large extent, based upon the interpretation of geologic data obtained from drill holes and other sampling techniques, and feasibility studies that derive estimates of cash operating costs based upon anticipated tonnage and grades of ore to be mined and processed, the configuration of the ore body, expected recovery rates of metals from the ore, estimated operating costs, anticipated climatic conditions and other factors. As a result, it is possible that actual capital and operating costs and economic returns will differ significantly from those currently estimated for a project prior to production.
Any of the following events, among others, could affect the profitability or economic feasibility of the Molo Graphite Mine: unanticipated changes in grade and tonnes of material to be mined and processed, unanticipated adverse geological conditions, unanticipated recovery problems, incorrect data on which engineering assumptions are made, availability and costs of labor, costs of processing, availability of economic sources of power, adequacy of water supply, availability of surface on which to locate processing facilities, adequate access to the site, unanticipated transportation costs, government regulations (including regulations with respect to prices, royalties, duties, taxes, permitting, restrictions on production, quotas on exportation of minerals, environmental), fluctuations in commodity prices, accidents, labor actions, the availability and delivery of critical equipment, successful commissioning and start-up of operations, including the achievement of designed plant recovery rates and force-majeure events.
The Molo Graphite Mine has not yet been built and accordingly has no operating history upon which to base estimates of future production and cash operating costs. The price of graphite can fluctuate significantly on a month-to-month and year-to-year basis. Declining graphite prices can impact operations by forcing a reassessment of the feasibility of the Molo Graphite Mine.
It is likely that actual results for the Molo Graphite Mine will differ from current estimates and assumptions, and these differences may be material. In addition, experience from actual mining or processing operations may identify new or unexpected conditions that could reduce production below, or increase capital or operating costs above, current estimates. If actual results are less favorable than currently estimated, the Company’s business, results of operations, financial condition and liquidity could be materially adversely affected.
The Company’s development and exploration projects are in the African country of Madagascar and are subject to country political and regulatory risks.
A new president of Madagascar was inaugurated in January 2019 following democratic elections. The Company is actively monitoring the political climate in Madagascar and continues to hold meetings with new representatives of the government and the Ministries in charge of mining. Depending on future actions taken by the newly elected government, or any future government, the Company’s business operations could be impacted.
Companies in the mining and metals sector continue to be targeted to raise government revenue, particularly as governments struggle with deficits and concerns over the effects of depressed economies. Many governments are continually assessing the fiscal terms of the economic rent for mining companies to exploit resources in their countries.
The government of Madagascar has granted mining claims, permits, and licenses that will enable us to conduct anticipated operations or exploration and development activities. Notwithstanding, these arrangements, the Company’s ability to conduct operations, exploration and/or development activities at any of its properties is subject to obtaining and/or renewing permits or concessions, changes in laws or government regulations or shifts in political attitudes beyond its control.
Any adverse developments to the political and regulatory situation in Madagascar could have a material effect on the Company’s business, results of operations and financial condition. The Company’s operations may also be affected in varying degrees by terrorism; military conflict or repression; crime; populism; activism; labour unrest; attempts to renegotiate or nullify existing concessions, licenses, permits and contracts; unstable or unreliable legal systems; changes in fiscal regimes including taxation, and other risks arising out of sovereignty issues.
| 30 |
NEXTSOURCE MATERIALS INC.
MANAGEMENT’S DISCUSSION AND ANALYSIS
For the years ended June 30, 2021, and 2020
The Company does not currently carry political risk insurance covering its investments in Madagascar. It may not be possible for investors to enforce judgments in Canada against a loss suffered on the Company’s assets and operations in Madagascar.
Economic dependence on the Molo Graphite Mine.
The Company’s principal mineral property is the Molo Graphite Mine. As a result, unless the Company acquires or develops any additional material properties or projects, any adverse developments affecting this project or our rights to develop the Molo Graphite Mine could materially adversely affect the Company’s business, financial condition and results of operations.
Additional permits and licenses are necessary to complete the development of the Molo Graphite Mine.
The Company successfully converted its exploration permit for the Molo Graphite Mine into a mining permit. However, the Company requires additional permits necessary to construct and operate the mine, including water use, construction, mineral processing, transportation, export, and labour. Applications for these additional permits and licenses will be undertaken in due course at the appropriate time.
The Company cannot provide any assurance as to the timing of the receipt of any of the additional permits and licenses necessary to initiate construction of the mine.
Fluctuations in the market price of graphite and other metals may adversely affect and the value of the Company’s securities, revenue projections and the ability of the Company to develop Phase 2 of the Molo Graphite Mine.
The value of the Company’s securities may be significantly affected by the market price of graphite and other metals, which are cyclical and subject to substantial price fluctuations. Market prices can be affected by numerous factors beyond the Company’s control, including levels of supply and demand for a broad range of industrial products, economic growth rates of various international economies, expectations with respect to the rate of inflation, the relative strength of various currencies, interest rates, speculative activities, global or regional political or economic circumstances. The Chinese market is a significant source of global demand for commodities, including graphite. Chinese demand has been a major driver in global commodities markets for a number of years and recent reductions in Chinese demand have adversely affected prices for graphite. A slowing in China’s economic growth could result in even lower prices and could negatively impact the value of the Company’s securities. Excess global supply of graphite could result in a decrease in the price of graphite and other metals, which could adversely impact the projected revenues from the Molo Graphite Mine. Prolonged decreases in the price of graphite or other metals could adversely impact the ability of the Company to proceed with the development of Phase 2 of the Molo Graphite Mine.
Estimates of mineral resources and mineral reserves may not be realized.
Mineral resource and mineral reserve estimates are only estimates and no assurance can be given that any particular level of recovery of minerals will be realized or that an identified mineral resource will ever qualify as a commercially mineable (or viable) deposit which can be legally and economically exploited. The Company relies on laboratory-based recovery models to project estimated ultimate recoveries by mineral type. There can be no assurance that mineral recovery in small scale laboratory tests will be duplicated in large scale tests under on-site conditions or in production scale operations. Actual recoveries may exceed or fall short of projected laboratory test results. In addition, the grade of mineralization ultimately mined may differ from the one indicated by the drilling results and the difference may be material. Production can be affected by such factors as permitting regulations and requirements, weather, environmental factors, unforeseen technical difficulties, unusual or unexpected geological formations, inaccurate or incorrect geologic, metallurgical or engineering work, and work interruptions, among other things. Short term factors, such as the need for an orderly development of deposits or the processing of new or different grades, may have an adverse effect on mining operations or the results of those operations. Material changes in mineral reserves or mineral resources, grades, waste-to-ore ratios or recovery rates may affect the economic viability of projects. The estimated mineral reserves and mineral resources should not be interpreted as assurances of mine life or of the profitability of future operations
The Company may not have access to sufficient capital to develop Phase 2 of the Molo Graphite Mine and value-added processing facilities.
The Company has limited capital, which is sufficient to complete construction of Phase 1 of the Molo Graphite Mine but is insufficient to complete construction of Phase 2 of the Molo Graphite Mine and construction of value-added processing facilities. The Company ability to develop Phase 2 of the Molo Graphite Mine and value-added processing facilities will depend primarily on its ability to obtain additional capital in the form of private or public equity or debt financing. There is no assurance that the Company will secure sufficient financing, or the Company may be unable to locate and secure capital on terms and conditions that are acceptable to the Company. Any equity financing may have a dilutive effect on the value of the Company securities. Any debt financing, if available, may involve financial covenants which limit operations and could be secured against all of the Company’s assets. If the Company cannot obtain additional capital, the Company may not be able to complete the development of Phase 2 of the Molo Graphite Mine and value-added processing facilities, which could have a material adverse effect on the business, operating results and financial condition of the Company.
| 31 |
NEXTSOURCE MATERIALS INC.
MANAGEMENT’S DISCUSSION AND ANALYSIS
For the years ended June 30, 2021, and 2020
The Company has a limited operating history and expects to incur operating losses for the foreseeable future.
The Company has principally operated as a mineral exploration company since incorporation and has just received its first mining permit. There are numerous difficulties normally encountered by mineral exploration and development companies, and these companies experience a high rate of failure.
The Company has not earned any revenues has not been profitable. It is anticipated that the Company will continue to report negative operating cash flow in future periods, likely until after the Molo Graphite Mine generates recurring revenues from being placed into production of which there is no assurance. The Company has no history upon which to base any assumption as to the likelihood that the business will prove successful, and the Company can provide no assurance to investors that it will generate any operating revenues or ever achieve profitable operations.
Due to the speculative nature of mineral property exploration, there is substantial risk that the Company’s assets will not go into commercial production and the business will fail.
Exploration for minerals is a speculative venture involving substantial risk. The Company cannot provide investors with any assurance that the Company’s claims and properties will ever enter into commercial production. The exploration work that the Company has completed on the Molo Graphite Mine claims may not result in the commercial production of graphite. The exploration work that the Company has completed on the Green Giant Vanadium Project may not result in the commercial production of vanadium or other minerals.
Mining companies are increasingly required to consider and provide benefits to the communities and countries in which they operate, and are subject to extensive environmental, health and safety laws and regulations.
As a result of public concern about the real or perceived detrimental effects of economic globalization and global climate impacts, businesses generally, and large multinational corporations in natural resources industries, face increasing public scrutiny of their activities. These businesses are under pressure to demonstrate that, as they seek to generate satisfactory returns on investment to shareholders, other stakeholders, including employees, governments, communities surrounding operations and the countries in which they operate, benefit and will continue to benefit from their commercial activities. Such pressures tend to be particularly focused on companies whose activities are perceived to have a high impact on their social and physical environment. The potential consequences of these pressures include reputational damage, legal suits, increasing social investment obligations and pressure to increase taxes and royalties payable to governments and communities.
In addition, the Company’s ability to successfully obtain key permits and approvals to explore for, develop and operate mines and to successfully operate in communities around the world will likely depend on the Company’s ability to develop, operate and close mines in a manner that is consistent with the creation of social and economic benefits in the surrounding communities, which may or may not be required by law. The Company’s ability to obtain permits and approvals and to successfully operate in particular communities may be adversely impacted by real or perceived detrimental events associated with the Company’s activities or those of other mining companies affecting the environment, human health and safety of communities in which the Company operates. Delays in obtaining or failure to obtain government permits and approvals may adversely affect the Company’s operations, including its ability to explore or develop properties, commence production or continue operations. Key permits and approvals may be revoked or suspended or may be varied in a manner that adversely affects the Company’s operations, including its ability to explore or develop properties, commence production or continue operations.
The Company’s business operations are subject to extensive laws and regulations governing worker health and safety and land use and the protection of the environment, which generally apply to air and water quality, protection of endangered, protected or other specified species, hazardous waste management and reclamation. The Company has made, and expect to make in the future, significant expenditures to comply with such laws and regulations. Compliance with these laws and regulations imposes substantial costs and burdens, and can cause delays in obtaining, or failure to obtain, government permits and approvals which may adversely impact the Company’s closure processes and operations.
Because of the inherent dangers involved in mineral exploration, there is a risk that the Company may incur liability or damages as the Company conducts business.
The search for valuable minerals involves numerous hazards. As a result, the Company may become subject to liability for such hazards, including pollution, cave-ins and other hazards against which the Company cannot, or may elect not, to insure against. The Company currently has no such insurance, but management intends to periodically review the availability of commercially reasonable insurance coverage. If a hazard were to occur, the costs of rectifying the hazard may exceed the Company’s asset value and cause us to liquidate all of its assets.
The Company’s operations are subject to environmental regulations, which could result in additional costs and operational delays. Environmental legislation is evolving in a manner that may require stricter standards, and enforcement, increased fines and penalties for non-compliance, more stringent environmental assessments of proposed projects, and a heightened degree of responsibility for companies and their officers, directors, and employees. There is no assurance that any future changes in environmental regulation will not negatively affect the Company’s projects.
| 32 |
NEXTSOURCE MATERIALS INC.
MANAGEMENT’S DISCUSSION AND ANALYSIS
For the years ended June 30, 2021, and 2020
The Company has no insurance for environmental problems.
Insurance against environmental risks, including potential liability for pollution or other hazards as a result of the disposal of waste products occurring from exploration and production, has not been available generally in the mining industry. The Company has no insurance coverage for most environmental risks. In the event of a problem, the payment of environmental liabilities and costs would reduce the funds available to us for future operations. If the Company’s is unable to full pay for the cost of remedying an environmental problem, the Company might be required to enter into an interim compliance measure pending completion of the required remedy.
Should the Company lose the services of key executives, the Company’s financial condition and proposed expansion may be negatively impacted.
The Company depends on the continued contributions of the Company’s executive officers to work effectively as a team, to execute its business strategy and to manage its business. The loss of key personnel, or their failure to work effectively, could have a material adverse effect on its business, financial condition, and results of operations. Specifically, the Company relies on Craig Scherba, the President and Chief Executive Officer and Marc Johnson, the Chief Financial Officer.
The Company does not maintain key man life insurance. Should the Company lose any or all of their services and the Company is unable to replace their services with equally competent and experienced personnel, the Company’s operational goals and strategies may be adversely affected, which will negatively affect potential revenues.
Because access to the Company’s properties may be restricted by inclement weather or proper infrastructure, its exploration programs are likely to experience delays.
Access to most of the properties underlying the Company’s claims and interests is restricted due to their remote locations and because of weather conditions. Some of the Company’s properties are only accessible by air. As a result, any attempts to visit, test, or explore the property are generally limited to those periods when weather permits such activities. These limitations can result in significant delays in exploration efforts, as well as mining and production efforts in the event that commercial amounts of minerals are found. This could cause the Company’s business to fail.
Climate change and related regulatory responses may impact the Company’s business.
Climate change as a result of emissions of greenhouse gases is a current topic of discussion and may generate government regulatory responses in the near future. It is impracticable to predict with any certainty the impact of climate change on the Company’s business or the regulatory responses to it, although the Company recognizes that they could be significant. However, it is too soon for us to predict with any certainty the ultimate impact, either directionally or quantitatively, of climate change and related regulatory responses.
To the extent that climate change increases the risk of natural disasters or other disruptive events in the areas in which the Company operates, the Company could be harmed. While the Company maintains rudimentary business recovery plans that are intended to allow us to recover from natural disasters or other events that can be disruptive to the Company’s business, its plans may not fully protect us from all such disasters or events.
Compliance with changing regulation of corporate governance and public disclosure will result in additional expenses and pose challenges for management.
The Company’s management team needs to devote significant time and financial resources to comply with both existing and evolving standards for public companies, which will lead to increased general and administrative expenses and a diversion of management time and attention from revenue generating activities to compliance activities.
Tax risks.
Changes in tax laws or tax rulings could materially affect the Company’s financial position and results of operations. Changes to, or differing interpretations of, taxation laws or regulations in Canada, Madagascar, the United States of America, or any of the countries in which the Company’s assets or relevant contracting parties are located could result in some or all of the Company’s profits being subject to additional taxation or other tax liabilities being applicable to the Company or its subsidiaries. Taxation laws are complex, subject to differing interpretations and applications by the relevant tax authorities. In particular, the tax treatment relating to the Company’s corporate redomicile from the US to Canada is complex. There is no assurance that new taxation rules or accounting policies will not be enacted or that existing rules will not be applied in a manner which could result in the Company’s profits being subject to additional taxation or which could otherwise have a material adverse effect on profitability, results of operations, financial condition and the trading price of the Company’s securities. Additionally, the introduction of new tax rules or accounting policies, or changes to, or differing interpretations of, or application of, existing tax rules or accounting policies could make investments in or by the Company less attractive to counterparties. Such changes could adversely affect the Company’s ability to raise additional funding or make future investments.
| 33 |
NEXTSOURCE MATERIALS INC.
MANAGEMENT’S DISCUSSION AND ANALYSIS
For the years ended June 30, 2021, and 2020
Because from time to time the Company holds a significant portion of cash reserves in Canadian dollars, the Company may experience losses due to foreign exchange translations.
From time to time the Company holds a significant portion of cash reserves in Canadian dollars. Due to foreign exchange rate fluctuations, the value of these Canadian dollar reserves can result in translation gains or losses in U.S. dollar terms. If there was a significant decline in the Canadian dollar versus the U.S. dollar, the Company’s converted Canadian dollar cash balances presented in U.S. dollars on its balance sheet would significantly decline. If the US dollar significantly declines relative to the Canadian dollar the Company’s quoted US dollar cash position would significantly decline as it would be more expensive in US dollar terms to pay Canadian dollar expenses. The Company has not entered into derivative instruments to offset the impact of foreign exchange fluctuations. In addition, certain of the Company’s ongoing expenditures are in South African Rand, Madagascar Ariary and Euros requiring us to occasionally hold reserves of these foreign currencies with a similar risk of foreign exchange currency translation losses.
The Company’s business is subject to anti-corruption and anti-bribery laws, a breach or violation of which could lead to civil and criminal fines and penalties, loss of licenses or permits and reputational harm.
The Company operates in certain jurisdictions that have experienced governmental and private sector corruption to some degree, and, in certain circumstances, strict compliance with anti-bribery laws may conflict with certain local customs and practices. Anti-corruption and anti-bribery laws in certain jurisdictions generally prohibit companies and their intermediaries from making improper payments for the purpose of obtaining or retaining business or other commercial advantage. The Company’s corporate policies mandate compliance with these anti-bribery laws, which often carry substantial penalties. There can be no assurance that the Company’s internal control policies and procedures always will protect it from recklessness, fraudulent behavior, dishonesty or other inappropriate acts committed by the Company’s affiliates, employees or agents. As such, the Company’s corporate policies and processes may not prevent all potential breaches of law or other governance practices. Violations of these laws, or allegations of such violations, could lead to civil and criminal fines and penalties, litigation, and loss of operating licenses or permits, and may damage the Company’s reputation, which could have a material adverse effect on its business, financial position and results of operations or cause the market value of the Common Shares to decline.
The Company is exposed to general economic conditions, which could have a material adverse impact on its business, operating results and financial condition.
Recently there have been adverse conditions and uncertainty in the global economy as the result of unstable global financial and credit markets, inflation, and recession. These unfavorable economic conditions and the weakness of the credit market may continue to have, an impact on the Company’s business and the Company’s financial condition. The current global macroeconomic environment may affect the Company’s ability to access the capital markets may be severely restricted at a time when the Company wishes or needs to access such markets, which could have a materially adverse impact on the Company’s flexibility to react to changing economic and business conditions or carry on operations.
The market price for the Common Shares is particularly volatile given the Company’s status as a company with a small public float, limited operating history and lack of profits which could lead to wide fluctuations in the market price for the Common Shares.
The market price for the Common Shares is characterized by significant price volatility when compared to seasoned issuers, and the Company expects that its share price will continue to be more volatile than a seasoned issuer. Such volatility is attributable to a number of factors. First, the Common Shares, at times, are thinly traded. As a consequence of this lack of liquidity, the trading of relatively small quantities of Common Shares by shareholders may disproportionately influence the price of those Common Shares in either direction. The price for the Common Shares could, for example, decline precipitously in the event that a large number of Common Shares are sold on the market without commensurate demand, as compared to a seasoned issuer which could better absorb those sales without adverse impact on its share price. Second, the Company is a speculative or “risky” investment due to the Company’s limited operating history, lack of profits to date and uncertainty of future market acceptance for the Company’s potential products. As a consequence, more risk-adverse investors may, under the fear of losing all or most of their investment in the event of negative news or lack of progress, be more inclined to sell their shares on the market more quickly and at greater discounts than would be the case with the stock of a seasoned issuer. Many of these factors are beyond the Company’s control and may decrease the market price of the Common Shares, regardless of the Company’s performance. The Company cannot make any predictions as to what the prevailing market price for the Common Shares will be at any time or as to what effect that the sale of Common Shares or the availability of Common Shares for sale at any time will have on the prevailing market price.
Securities of small-cap and mid-cap companies have experienced substantial volatility in the recent past, often based on factors unrelated to the financial performance or prospects of the companies involved. These factors include macroeconomic developments in North America and globally and market perceptions of the attractiveness of particular industries. The price of the Common Shares is also likely to be significantly affected by short-term changes in graphite prices and demand, the U.S. dollar, the Malagasy ariary, the Canadian dollar, and the Company’s financial condition or results of operations as reflected in its financial statements. Other factors unrelated to the performance of the Company that may have an effect on the price of the Common Shares include the following: the extent of analytical coverage available to investors concerning the Company’s business may be limited if investment banks with research capabilities do not follow the Company’s securities; lessening in trading volume and general market interest in the Company’s securities may affect an investor’s ability to trade significant numbers of Common Shares; the size of the Company’s public float may limit the ability of some institutions to invest in its securities; and a substantial decline in the price of the Common Shares that persists for a significant period of time could cause its securities, if listed on an exchange, to be delisted from such exchange, further reducing market liquidity.
As a result of any of these factors, the market price of the Common Shares at any given point in time may not accurately reflect the long-term value of the Company. Class action litigation often has been brought against companies following periods of volatility in the market price of their securities. The Company may in the future be the target of similar litigation. Securities litigation could result in substantial costs and damages and divert management’s attention and resources.
The Company does not intend to pay dividends in the foreseeable future.
The Company does not anticipate paying cash dividends in the foreseeable future. The Company may not have sufficient funds to legally pay dividends. Even if funds are legally available to pay dividends, the Company may nevertheless decide, in its sole discretion, not to pay dividends. The declaration, payment and amount of any future dividends will be made at the discretion of the board of directors, and will depend upon, among other things, the results of the Company’s operations, cash flows and financial condition, operating and capital requirements, and other factors the board of directors may consider relevant. There is no assurance that the Company will pay any dividends in the future, and, if dividends are paid, there is no assurance with respect to the amount of any such dividend.
| 34 |
NEXTSOURCE MATERIALS INC.
MANAGEMENT’S DISCUSSION AND ANALYSIS
For the years ended June 30, 2021, and 2020
SUMMARIZED QUARTERLY DATA
|
| Three months ended |
|
| Three months ended |
|
| Three months ended |
|
| Three months ended |
| ||||
|
| June 30, |
|
| March 31, |
|
| December 31, |
|
| September 30, |
| ||||
|
| 2021 |
|
| 2021 |
|
| 2020 |
|
| 2020 |
| ||||
Revenues |
| $ | - |
|
| $ | - |
|
| $ | - |
|
| $ | - |
|
Mine development expenses |
|
|
|
|
|
|
|
|
|
|
|
|
|
|
|
|
Mineral claims (Madagascar) |
|
| (10,197 | ) |
|
| (9,890 | ) |
|
| 23,422 |
|
|
| - |
|
Payroll and benefits |
|
| - |
|
|
| - |
|
|
| - |
|
|
| - |
|
Engineering and metallurgical (Canada, South Africa) |
|
| 28,763 |
|
|
| - |
|
|
| - |
|
|
| 9,835 |
|
Consulting fees (Madagascar) |
|
| 164,220 |
|
|
| 27,476 |
|
|
| 73,939 |
|
|
| - |
|
Travel |
|
| 16,100 |
|
|
| - |
|
|
| - |
|
|
| - |
|
Commercial production success fee |
|
| - |
|
|
| - |
|
|
| - |
|
|
| - |
|
Total mine development expenses |
|
| 198,886 |
|
|
| 17,586 |
|
|
| 97,361 |
|
|
| 9,835 |
|
Exploration and evaluation expenses |
|
|
|
|
|
|
|
|
|
|
|
|
|
|
|
|
Mineral claims (Canada) |
|
| 12,810 |
|
|
| 844 |
|
|
| 1,297 |
|
|
| 384 |
|
Mineral claims (Madagascar) |
|
| (29,974 | ) |
|
| - |
|
|
| 34,423 |
|
|
| - |
|
Exploration Camp and Admin (Madagascar) |
|
| 11,614 |
|
|
| 4,318 |
|
|
| 5,016 |
|
|
| 6,083 |
|
Total exploration and evaluation expenses |
|
| (5,550 | ) |
|
| 5,162 |
|
|
| 40,736 |
|
|
| 6,467 |
|
General and administrative expenses |
|
|
|
|
|
|
|
|
|
|
|
|
|
|
|
|
Payroll and benefits |
|
| 186,316 |
|
|
| 108,255 |
|
|
| 96,570 |
|
|
| 92,378 |
|
Consulting Fees |
|
| 115,060 |
|
|
| 97,284 |
|
|
| 76,857 |
|
|
| 94,640 |
|
Legal Fees |
|
| 27,424 |
|
|
| 32,348 |
|
|
| 21,895 |
|
|
| 17,649 |
|
Professional Fees |
|
| 41,033 |
|
|
| 49,539 |
|
|
| 44,158 |
|
|
| 20,378 |
|
Public filing expenses |
|
| 41,341 |
|
|
| 35,681 |
|
|
| 24,446 |
|
|
| 30,455 |
|
Travel expenses |
|
| 20,656 |
|
|
| 436 |
|
|
| - |
|
|
| 2,307 |
|
Investor relation expenses |
|
| 10,415 |
|
|
| 12,605 |
|
|
| 2,760 |
|
|
| 5,830 |
|
Insurance expenses |
|
| 9,554 |
|
|
| 6,610 |
|
|
| 7,475 |
|
|
| 7,177 |
|
Rent expenses |
|
| 4,977 |
|
|
| 5,105 |
|
|
| 5,329 |
|
|
| 4,446 |
|
Office and admin |
|
| 16,107 |
|
|
| 9,206 |
|
|
| 4,096 |
|
|
| 8,003 |
|
Total general and administrative expenses |
|
| 472,883 |
|
|
| 357,069 |
|
|
| 283,586 |
|
|
| 283,263 |
|
Share-based compensation |
|
| (48,932 | ) |
|
| 3,772,435 |
|
|
| 20,669 |
|
|
| - |
|
Amortization of plant and equipment |
|
| 1,745 |
|
|
| 1,804 |
|
|
| 1,521 |
|
|
| 1,522 |
|
Finance costs |
|
| 266 |
|
|
| 321 |
|
|
| 730 |
|
|
| - |
|
Foreign currency translation (gain) loss |
|
| 136,898 |
|
|
| (4,423 | ) |
|
| (14,972 | ) |
|
| (16,251 | ) |
Interest (income) |
|
| (104 | ) |
|
| - |
|
|
| - |
|
|
| - |
|
Interest expense |
|
| 128 |
|
|
| - |
|
|
| (626 | ) |
|
| 771 |
|
Royalty Fee |
|
| - |
|
|
| - |
|
|
| - |
|
|
| - |
|
Flow through provision (gain) or loss |
|
| (146,814 | ) |
|
| - |
|
|
| - |
|
|
| - |
|
Foreign taxes |
|
| 92 |
|
|
| - |
|
|
| - |
|
|
| - |
|
Sub-total before other items |
|
| 609,498 |
|
|
| 4,149,954 |
|
|
| 429,005 |
|
|
| 285,607 |
|
Change in value of warrant liability |
|
| 26,810,060 |
|
|
| 8,560,319 |
|
|
| 1,120,933 |
|
|
| (4,892 | ) |
Government assistance |
|
| - |
|
|
| - |
|
|
| - |
|
|
| - |
|
Net loss for the year |
|
| (27,419,558 | ) |
|
| (12,710,273 | ) |
|
| (1,549,938 | ) |
|
| (280,715 | ) |
Other comprehensive income |
|
|
|
|
|
|
|
|
|
|
|
|
|
|
|
|
Items that will be reclassified subsequently to net loss |
|
|
|
|
|
|
|
|
|
|
|
|
|
|
|
|
Translation adjustment for foreign operations |
|
| 134,846 |
|
|
| 1,617 |
|
|
| (2,369 | ) |
|
| 545 |
|
Net loss and comprehensive loss for the year |
| $ | (27,284,712 | ) |
| $ | (12,708,656 | ) |
| $ | (1,552,307 | ) |
| $ | (280,170 | ) |
Working capital (deficit) surplus |
|
| (24,500,482 | ) |
|
| (3,952,895 | ) |
|
| (1,761,218 | ) |
|
| (269,775 | ) |
| 35 |
NEXTSOURCE MATERIALS INC.
MANAGEMENT’S DISCUSSION AND ANALYSIS
For the years ended June 30, 2021, and 2020
|
| Three months ended |
|
| Three months ended |
|
| Three months ended |
|
| Three months ended |
| ||||
|
| June 30, |
|
| March 31, |
|
| December 31, |
|
| September 30, |
| ||||
|
| 2020 |
|
| 2020 |
|
| 2019 |
|
| 2019 |
| ||||
Revenues |
| $ | - |
|
| $ | - |
|
| $ | - |
|
| $ | - |
|
Mine development expenses |
|
|
|
|
|
|
|
|
|
|
|
|
|
|
|
|
Mineral claims (Madagascar) |
|
| 68,954 |
|
|
| 25,000 |
|
|
| - |
|
|
| - |
|
Payroll and benefits |
|
| - |
|
|
| - |
|
|
| - |
|
|
| - |
|
Engineering and metallurgical (Canada, South Africa) |
|
| - |
|
|
| - |
|
|
| 20,000 |
|
|
| 44,850 |
|
Consulting fees (Madagascar) |
|
| - |
|
|
| - |
|
|
| - |
|
|
| - |
|
Travel |
|
| - |
|
|
| - |
|
|
| 19,088 |
|
|
| - |
|
Commercial production success fee |
|
| - |
|
|
| - |
|
|
| - |
|
|
| - |
|
Total mine development expenses |
|
| 68,954 |
|
|
| 25,000 |
|
|
| 39,088 |
|
|
| 44,850 |
|
Exploration and evaluation expenses |
|
|
|
|
|
|
|
|
|
|
|
|
|
|
|
|
Mineral claims (Canada) |
|
| 921 |
|
|
| 1,363 |
|
|
| 3,030 |
|
|
| 1,309 |
|
Mineral claims (Madagascar) |
|
| 50,000 |
|
|
| - |
|
|
| - |
|
|
| - |
|
Exploration Camp and Admin (Madagascar) |
|
| (24,866 | ) |
|
| 5,789 |
|
|
| 21,552 |
|
|
| 7,012 |
|
Total exploration and evaluation expenses |
|
| 26,055 |
|
|
| 7,152 |
|
|
| 24,582 |
|
|
| 8,321 |
|
General and administrative expenses |
|
|
|
|
|
|
|
|
|
|
|
|
|
|
|
|
Payroll and benefits |
|
| 87,671 |
|
|
| 122,815 |
|
|
| 114,439 |
|
|
| 111,412 |
|
Consulting Fees |
|
| 86,874 |
|
|
| 76,726 |
|
|
| 95,334 |
|
|
| 99,570 |
|
Legal Fees |
|
| 9,005 |
|
|
| 9,896 |
|
|
| (49,246 | ) |
|
| 59,689 |
|
Professional Fees |
|
| 31,440 |
|
|
| 24,009 |
|
|
| 18,957 |
|
|
| 20,991 |
|
Public filing expenses |
|
| 3,364 |
|
|
| 12,710 |
|
|
| 30,575 |
|
|
| 25,488 |
|
Travel expenses |
|
| (9,688 | ) |
|
| 13,652 |
|
|
| 18,488 |
|
|
| 12,916 |
|
Investor relation expenses |
|
| 2,764 |
|
|
| 2,747 |
|
|
| 2,740 |
|
|
| 14,742 |
|
Insurance expenses |
|
| 9,748 |
|
|
| 2,877 |
|
|
| 5,759 |
|
|
| 4,240 |
|
Rent expenses |
|
| 4,214 |
|
|
| 4,516 |
|
|
| 5,464 |
|
|
| 4,917 |
|
Office and admin |
|
| 4,271 |
|
|
| 1,208 |
|
|
| 12,577 |
|
|
| 5,581 |
|
Total general and administrative expenses |
|
| 229,663 |
|
|
| 271,156 |
|
|
| 255,087 |
|
|
| 359,546 |
|
Amortization of plant and equipment |
|
| 6,053 |
|
|
| - |
|
|
| - |
|
|
| - |
|
Share-based compensation |
|
| - |
|
|
| - |
|
|
| - |
|
|
| - |
|
Finance costs |
|
| - |
|
|
| - |
|
|
| - |
|
|
| - |
|
Foreign currency translation (gain) loss |
|
| 4,155 |
|
|
| (2,414 | ) |
|
| 4,120 |
|
|
| (2,309 | ) |
Interest (income) |
|
| - |
|
|
| - |
|
|
| - |
|
|
| - |
|
Interest expense |
|
| 1,621 |
|
|
| 276 |
|
|
| 156 |
|
|
| 45 |
|
Royalty Fee |
|
| - |
|
|
| - |
|
|
| - |
|
|
| - |
|
Flow through provision (gain) or loss |
|
| - |
|
|
| - |
|
|
| - |
|
|
| - |
|
Foreign taxes |
|
| 86 |
|
|
| (83 | ) |
|
| 769 |
|
|
| - |
|
Sub-total before other items |
|
| 336,587 |
|
|
| 301,087 |
|
|
| 323,802 |
|
|
| 410,453 |
|
Change in value of warrant liability |
|
| 100,323 |
|
|
| (266,431 | ) |
|
| 20,178 |
|
|
| (241,010 | ) |
Government assistance |
|
| (7,353 | ) |
|
| - |
|
|
| - |
|
|
| - |
|
Net loss for the year |
|
| (429,557 | ) |
|
| (34,656 | ) |
|
| (343,980 | ) |
|
| (169,443 | ) |
Other comprehensive income |
|
|
|
|
|
|
|
|
|
|
|
|
|
|
|
|
Items that will be reclassified subsequently to net loss |
|
|
|
|
|
|
|
|
|
|
|
|
|
|
|
|
Translation adjustment for foreign operations |
|
| 3,314 |
|
|
| (343 | ) |
|
| 3,970 |
|
|
| (3,745 | ) |
Net loss and comprehensive loss for the year |
| $ | (426,243 | ) |
| $ | (34,999 | ) |
| $ | (340,010 | ) |
| $ | (173,188 | ) |
Working capital (deficit) surplus |
|
| (918,048 | ) |
|
| (484,374 | ) |
|
| (449,374 | ) |
|
| (839,074 | ) |
| 36 |
NEXTSOURCE MATERIALS INC.
MANAGEMENT’S DISCUSSION AND ANALYSIS
For the years ended June 30, 2021, and 2020
THREE-YEAR FINANCIAL AND OPERATING SUMMARY
The following is selected annual information for the three most recently completed financial years:
|
| Year ended |
|
| Year ended |
|
| Year ended |
| |||
|
| June 30, |
|
| June 30, |
|
| June 30, |
| |||
|
| 2021 |
|
| 2020 |
|
| 2019 |
| |||
|
| $ |
|
| $ |
|
| $ |
| |||
Revenues |
| $ | - |
|
| $ | - |
|
| $ | - |
|
Mine development expenses |
|
| 323,668 |
|
|
| 179,256 |
|
|
| 965,468 |
|
Exploration and evaluation expenses |
|
| 46,815 |
|
|
| 66,110 |
|
|
| 137,926 |
|
General and administrative expenses |
|
| 1,396,801 |
|
|
| 1,114,087 |
|
|
| 1,533,515 |
|
Net loss and comprehensive loss for the year |
|
| (41,825,845 | ) |
|
| (974,439 | ) |
|
| (3,168,791 | ) |
Weighted-average common shares (basic and diluted) |
|
| 66,654,804 |
|
|
| 52,720,608 |
|
|
| 49,358,647 |
|
Net loss per common share (basic and diluted) |
|
| (0.63 | ) |
|
| (0.02 | ) |
|
| (0.07 | ) |
Total assets |
|
| 26,919,591 |
|
|
| 273,439 |
|
|
| 613,403 |
|
Total non-current liabilities |
|
| 6,335,975 |
|
|
| 10,679 |
|
|
| - |
|
Dividends |
|
| - |
|
|
| - |
|
|
| - |
|
QUALIFIED PERSON
Craig Scherba, P.Geo., the Company’s President and Chief Executive Officer is the Qualified Person, as defined by NI 43-101, who has reviewed and approved the technical information disclosed in this MD&A.
DISCLOSURE CONTROLS AND PROCEDURES
Disclosure controls and procedures are designed to provide reasonable assurance that all relevant information is gathered and reported to management, including the Chief Executive Officer and Chief Financial Officer, on a timely basis so that appropriate decisions can be made regarding public disclosure.
As of June 30, 2021, the end of the period covered by this MD&A, our management, including our Chief Executive Officer and Chief Financial Officer, evaluated the effectiveness of our disclosure controls and procedures. Based upon that evaluation, our Chief Executive Officer and Chief Financial Officer concluded that as of June 30, 2021, the end of the period covered by this MD&A, we maintained effective disclosure controls and procedures
Management’s Report on Internal Control Over Financial Reporting
Our management is responsible for establishing and maintaining adequate internal control over financial reporting. Because of its inherent limitations, internal control over financial reporting may not prevent or detect misstatements. Also, projections of any evaluation of effectiveness to future periods are subject to the risk that controls may become inadequate because of changes in conditions, or that the degree of compliance with the policies or procedures may deteriorate. Internal control over financial reporting is a process designed to provide reasonable assurance regarding the reliability of financial reporting and the preparation of financial statements for external purposes in accordance with IFRS.
Our management, including our Chief Executive Officer and Chief Financial Officer, conducted an evaluation of the effectiveness of internal control over financial reporting using the criteria set forth in the COSO Internal Control – Integrated Framework (2013). Based on the results of this evaluation, our management concluded that our internal control over financial reporting was effective as of June 30, 2021.
Changes in Internal Control Over Financial Reporting
There were no changes in our internal control over financial reporting that occurred during the year ended June 30, 2021 that have materially affected, or are reasonably likely to materially affect, our internal control over financial reporting.
OTHER INFORMATION
Additional information related to the Company, including the Company’s Annual Information Form (“AIF”), is available on SEDAR at www.sedar.com or on the Company website at www.nextsourcematerials.com.
| 37 |