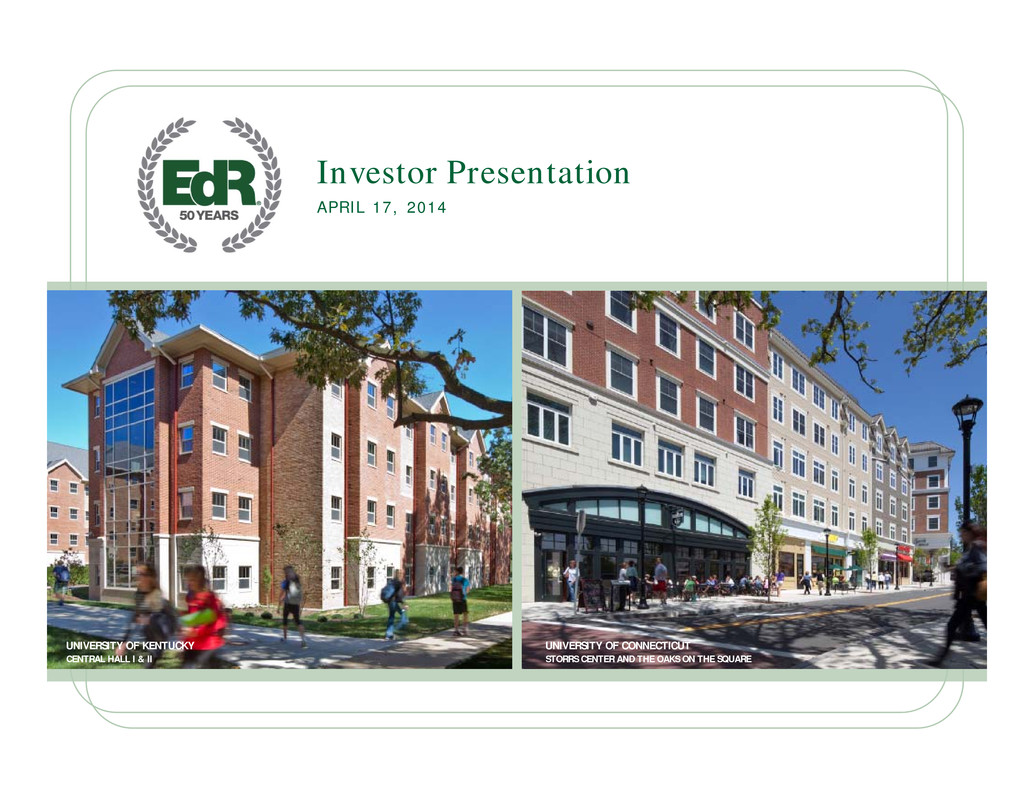
. . Investor Presentation APRIL 17, 2014 UNIVERSITY OF KENTUCKY CENTRAL HALL I & II UNIVERSITY OF CONNECTICUT STORRS CENTER AND THE OAKS ON THE SQUARE
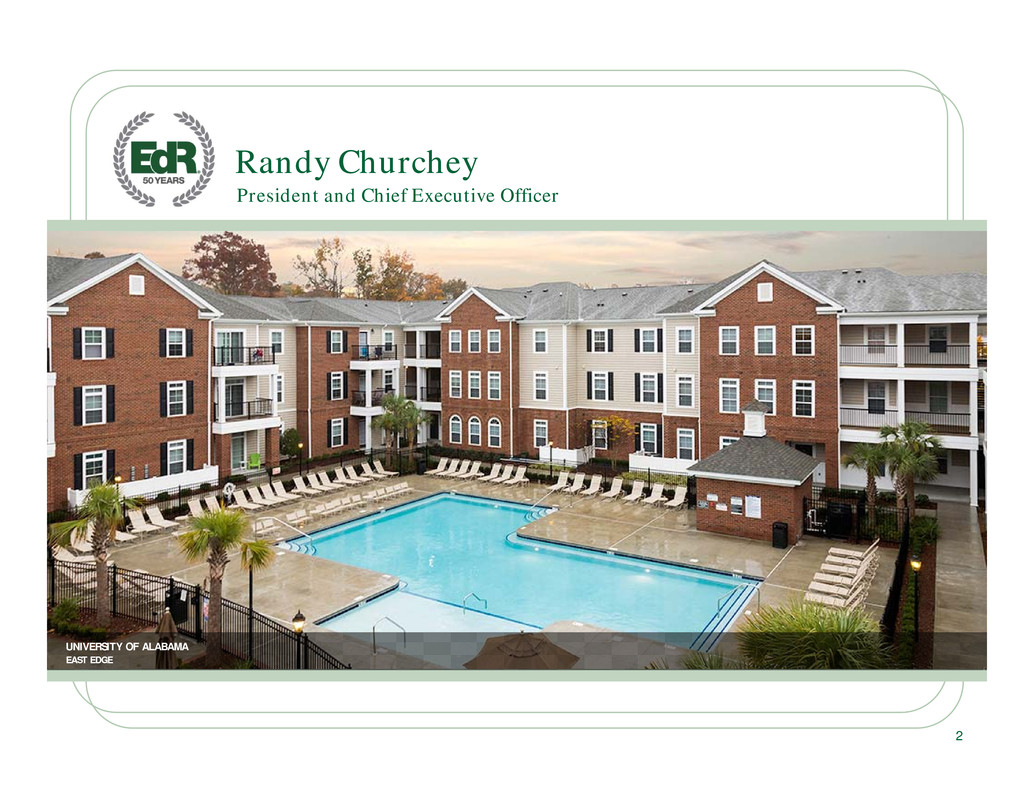
. . 2 President and Chief Executive Officer Randy Churchey ARIZONA STATE UNIVERSITY, DOWNTOWN CAMPUS ROOSEVELT POINT UNIVERSITY OF ALABAMA EAST DGE
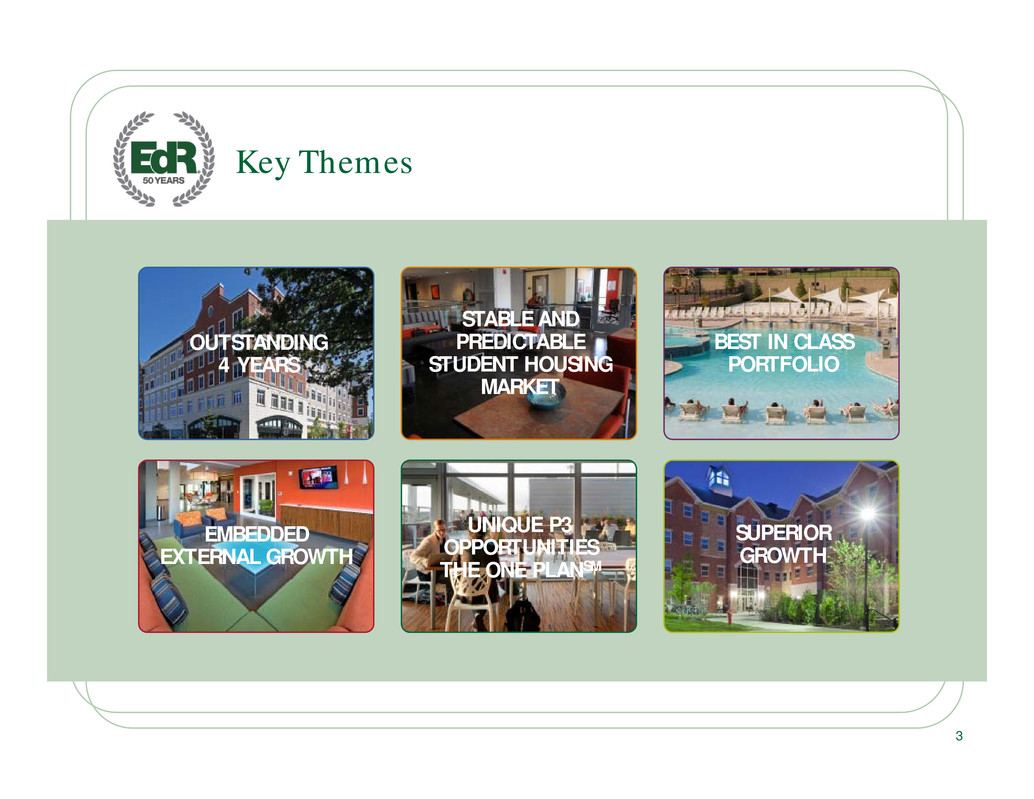
. . EMBEDDED EXTERNAL GROWTH OUTSTANDING 4 YEARS STABLE AND PREDICTABLE STUDENT HOUSING MARKET BEST IN CLASS PORTFOLIO SUPERIOR GROWTH UNIQUE P3 OPPORTUNITIES THE ONE PLANSM Key Themes 3
. . Agenda • EdR by the Numbers • Overview of Student Housing Market • Best-in-Class Portfolio • The One PlanSM – On-Campus Equity • External Growth Priorities • Superior Growth • Capital Management / Forecast 4 UNIVERSITY OF VIRGINIA GRANDMARC AT THE CORNER
. . OUTSTANDING 4 YEARS Key Themes 5
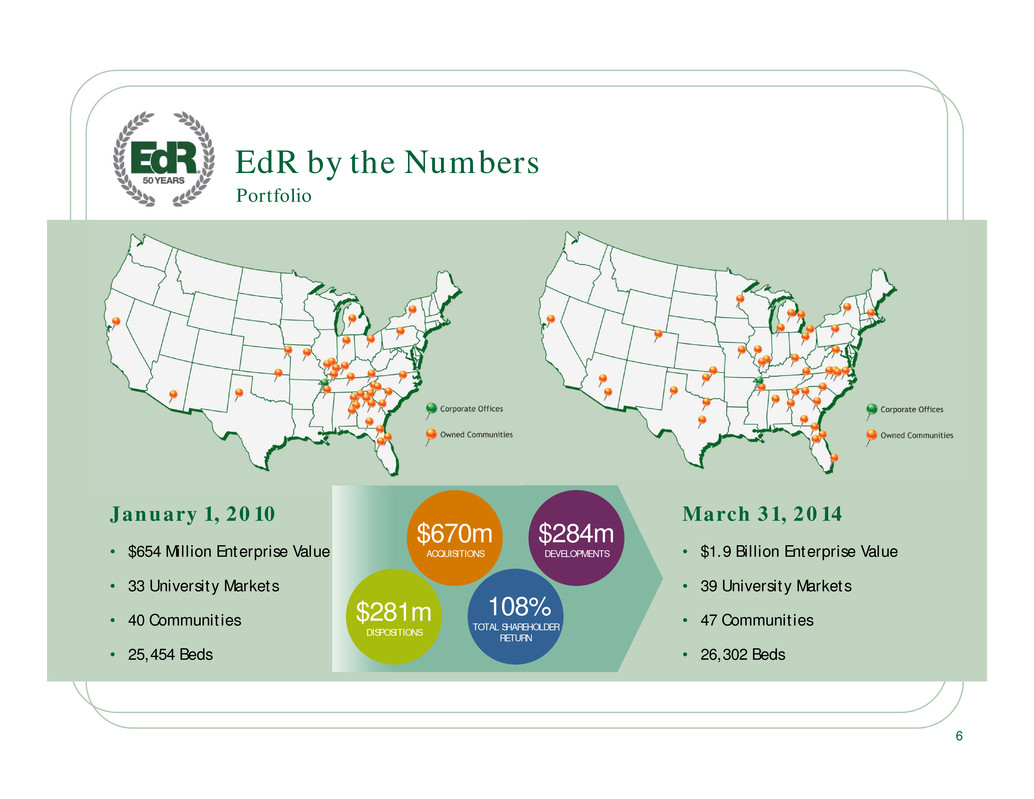
. . 6 Portfolio EdR by the Numbers $670m ACQUISITIONS $284m DEVELOPMENTS $281m DISPOSITIONS 108% TOTAL SHAREHOLDER RETURN March 31, 2014 • $1.9 Billion Enterprise Value • 39 University Markets • 47 Communities • 26,302 Beds January 1, 2010 • $654 Million Enterprise Value • 33 University Markets • 40 Communities • 25,454 Beds
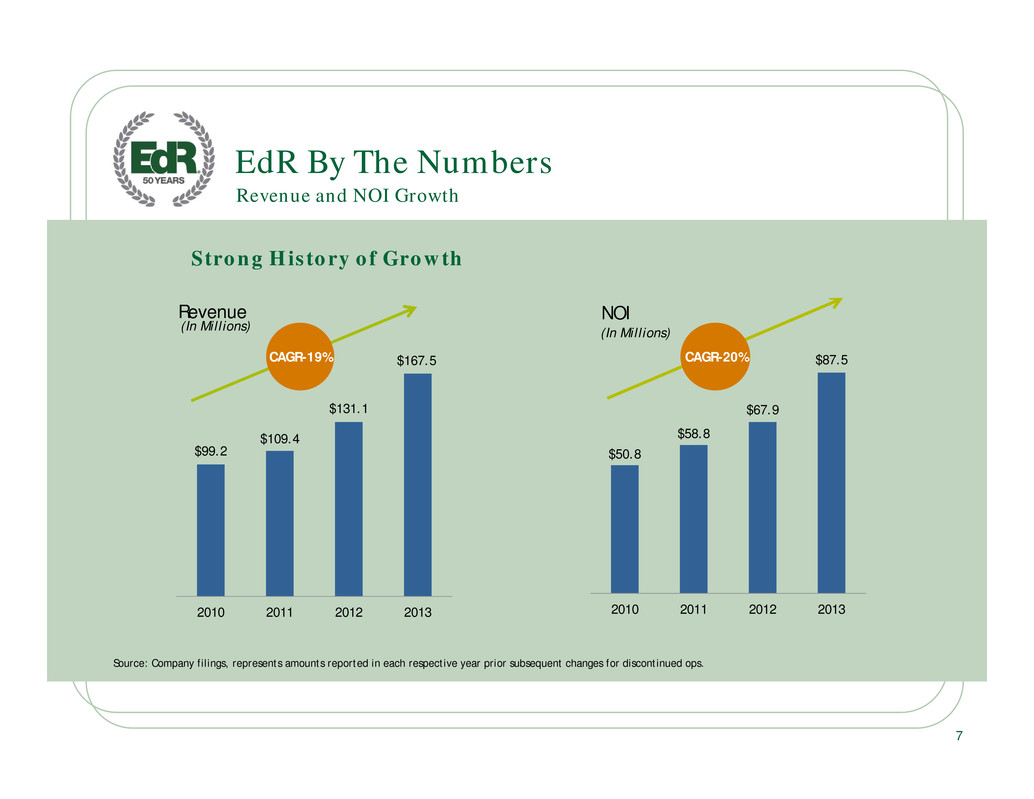
. . 7 Strong History of Growth EdR By The Numbers Revenue and NOI Growth $99.2 $109.4 $131.1 $167.5 2010 2011 2012 2013 Revenue (In Millions) $50.8 $58.8 $67.9 $87.5 2010 2011 2012 2013 NOI (In Millions) CAGR-20% Source: Company filings, represents amounts reported in each respective year prior subsequent changes for discontinued ops. CAGR-19%
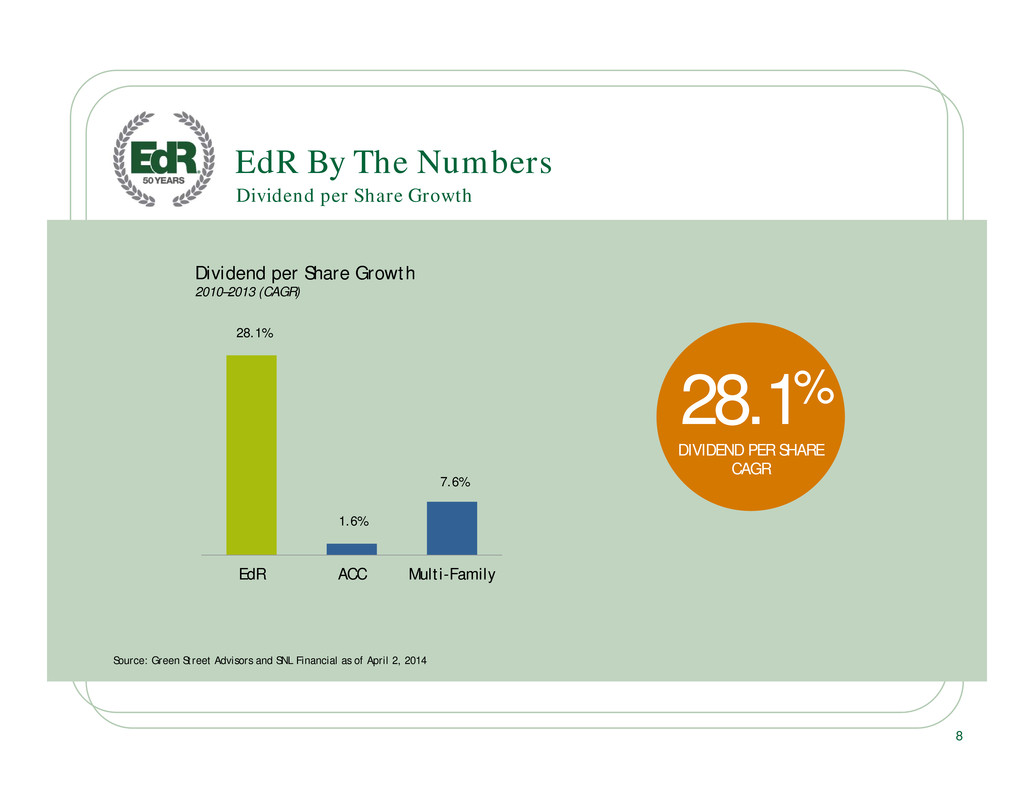
. . Source: Green Street Advisors and SNL Financial as of April 2, 2014 28.1% 1.6% 7.6% EdR ACC Multi-Family Dividend per Share Growth 2010–2013 (CAGR) EdR By The Numbers Dividend per Share Growth 8 28.1% DIVIDEND PER SHARE CAGR
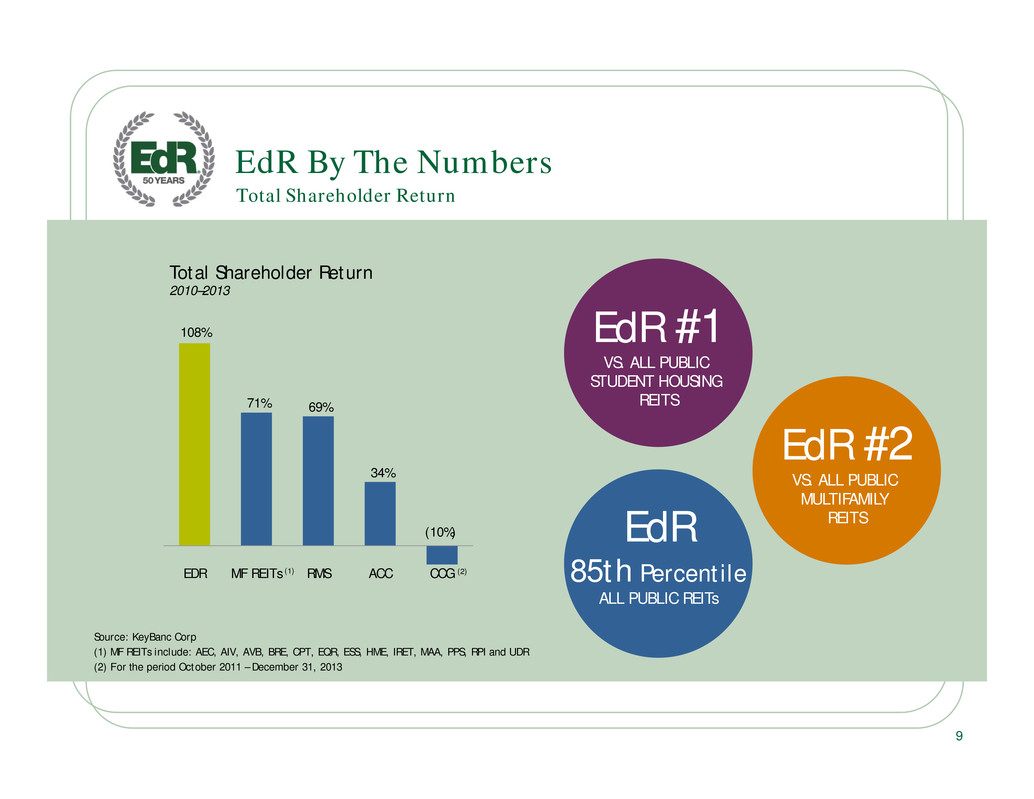
. . 108% 71% 69% 34% (10%) EDR MF REITs RMS ACC CCG Total Shareholder Return 2010–2013 (2)(1) EdR #2 VS. ALL PUBLIC MULTIFAMILY REITS EdR #1 VS. ALL PUBLIC STUDENT HOUSING REITS Total Shareholder Return EdR By The Numbers Source: KeyBanc Corp (1) MF REITs include: AEC, AIV, AVB, BRE, CPT, EQR, ESS, HME, IRET, MAA, PPS, RPI and UDR (2) For the period October 2011 – December 31, 2013 9 EdR 85th Percentile ALL PUBLIC REITs
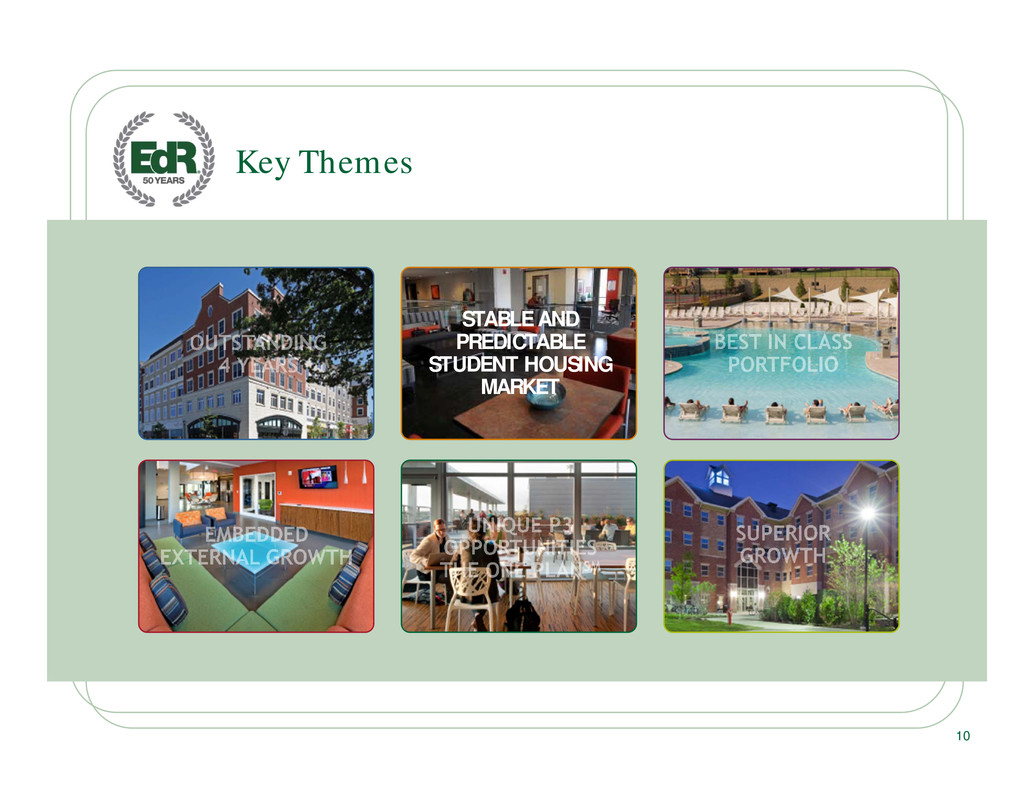
. . STABLE AND PREDICTABLE STUDENT HOUSING MARKET Key Themes 10
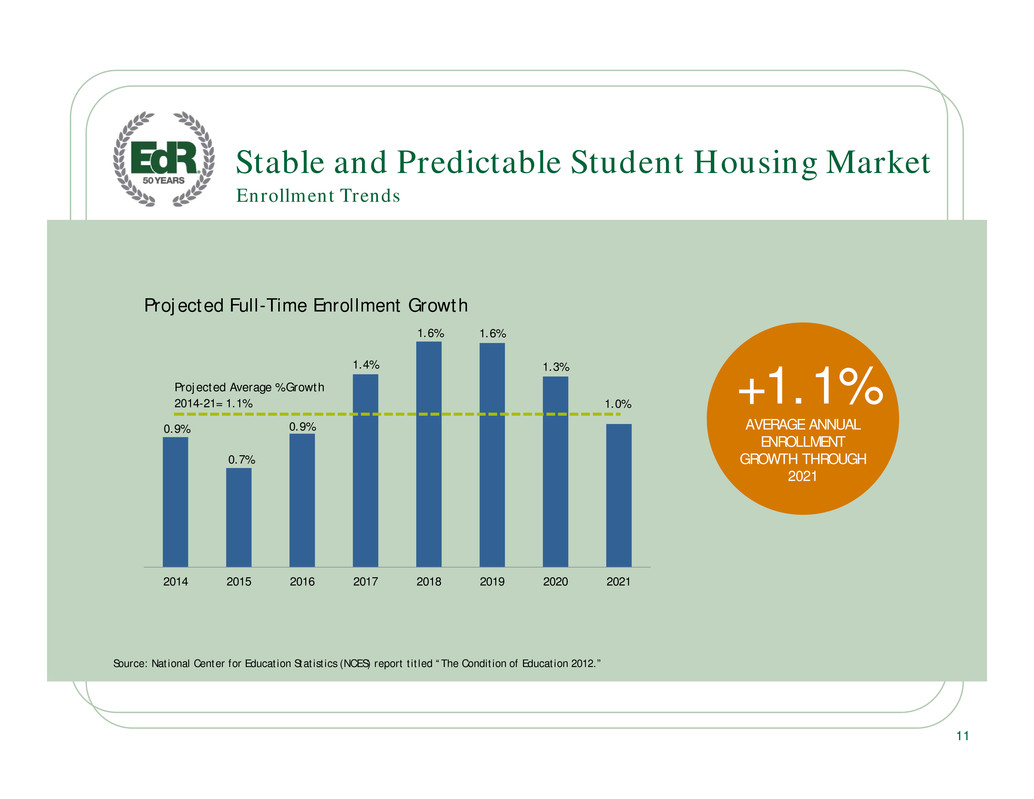
. . 0.9% 0.7% 0.9% 1.4% 1.6% 1.6% 1.3% 1.0% 2014 2015 2016 2017 2018 2019 2020 2021 Projected Average % Growth 2014-21= 1.1% Projected Full-Time Enrollment Growth Enrollment Trends Stable and Predictable Student Housing Market Source: National Center for Education Statistics (NCES) report titled “The Condition of Education 2012.” +1.1% AVERAGE ANNUAL ENROLLMENT GROWTH THROUGH 2021 11
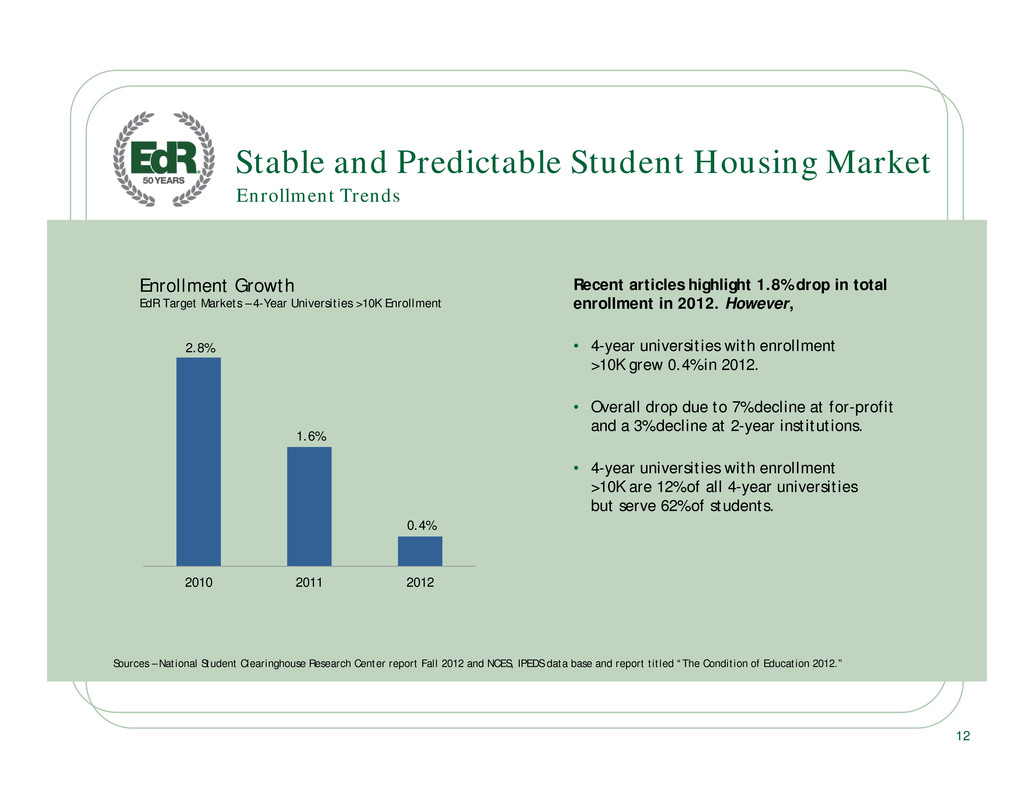
. . Enrollment Trends Stable and Predictable Student Housing Market Sources – National Student Clearinghouse Research Center report Fall 2012 and NCES, IPEDS data base and report titled “The Condition of Education 2012.” 2.8% 1.6% 0.4% 2010 2011 2012 Enrollment Growth EdR Target Markets – 4-Year Universities >10K Enrollment Recent articles highlight 1.8% drop in total enrollment in 2012. However, • 4-year universities with enrollment >10K grew 0.4% in 2012. • Overall drop due to 7% decline at for-profit and a 3% decline at 2-year institutions. • 4-year universities with enrollment >10K are 12% of all 4-year universities but serve 62% of students. 12
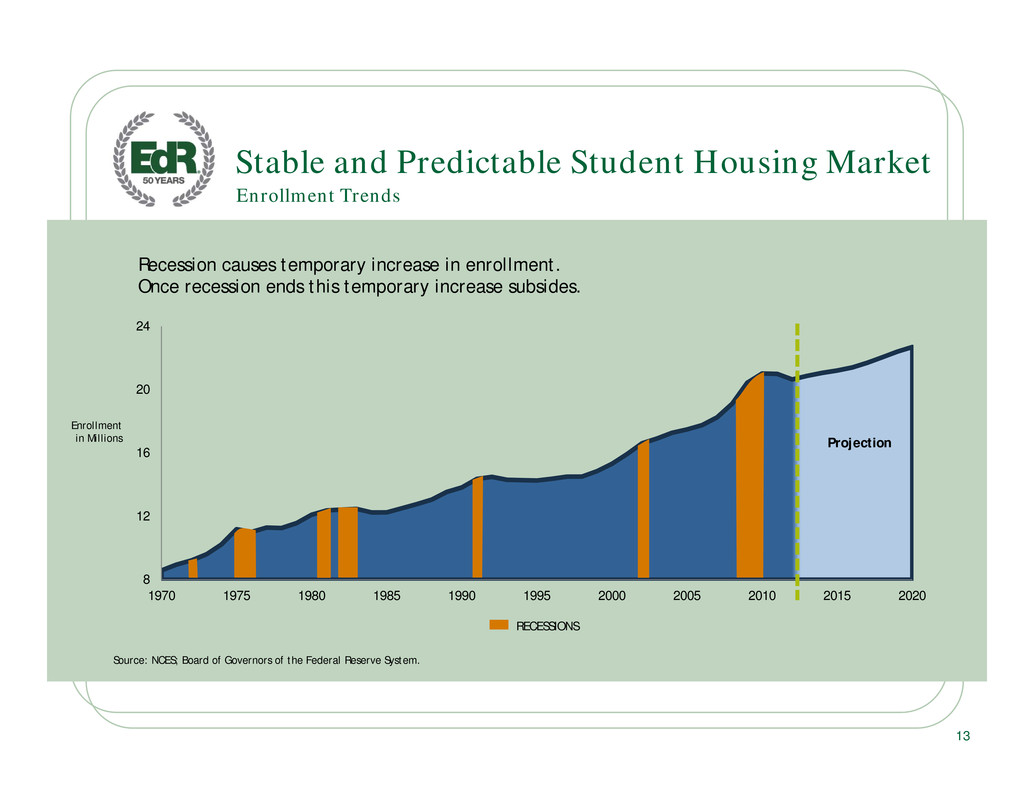
. . Enrollment Trends Stable and Predictable Student Housing Market Source: NCES; Board of Governors of the Federal Reserve System. 8 12 16 20 24 1970 1975 1980 1985 1990 1995 2000 2005 2010 2015 2020 Projection RECESSIONS Recession causes temporary increase in enrollment. Once recession ends this temporary increase subsides. Enrollment in Millions 13
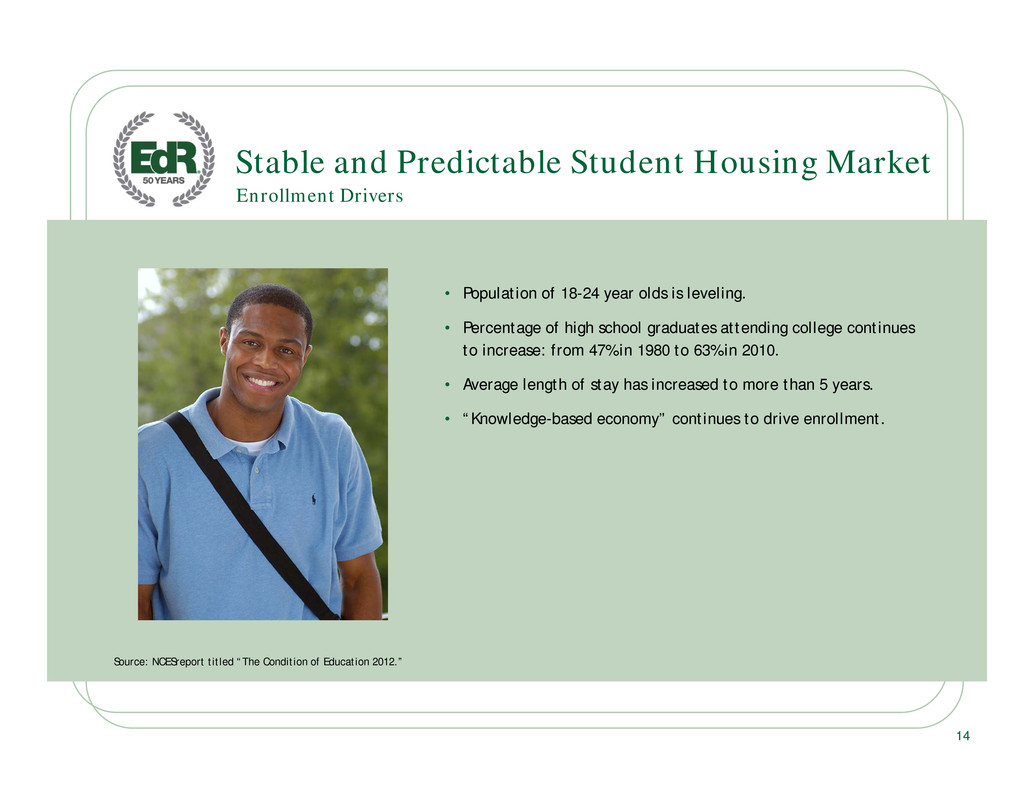
. . Stable and Predictable Student Housing Market • Population of 18-24 year olds is leveling. • Percentage of high school graduates attending college continues to increase: from 47% in 1980 to 63% in 2010. • Average length of stay has increased to more than 5 years. • “Knowledge-based economy” continues to drive enrollment. Enrollment Drivers Source: NCESreport titled “The Condition of Education 2012.” 14

. . Stable and Predictable Student Housing Market • “Enrollment declines are concentrated in colleges with smaller enrollment size, high tuition dependence, weak selectivity/yield rates, and soft regional demographics. The survey indicates that market-leading, diversified colleges and universities rated Aaa or Aa continue to fare better than the majority of the sector and are still seeing healthy student demand.” • “The survey shows that there remains a “flight to quality” as students seek the highest value education in the face of declining family income and weak job prospects. As a result, small, lower-rated public and private universities, as well as publics with small enrollment size, experienced the most enrollment pressure in fall 2012.” • “For public universities, there continues to be a correlation between size and enrollment trends, with the highest median enrollment growth experienced at large, program-diversified universities.” 15 Enrollment Drivers Source: Moody’s Investors Service, Special Comment: More US Colleges Face Stagnating Enrollment and Tuition Revenue, According to Moody’s Survey, Jan. 10, 2013. EdR Target Markets • Universities with Aaa or Aa rating • Highly-regarded universities • Large, program-diversified, public universities Moody’s Investor Services
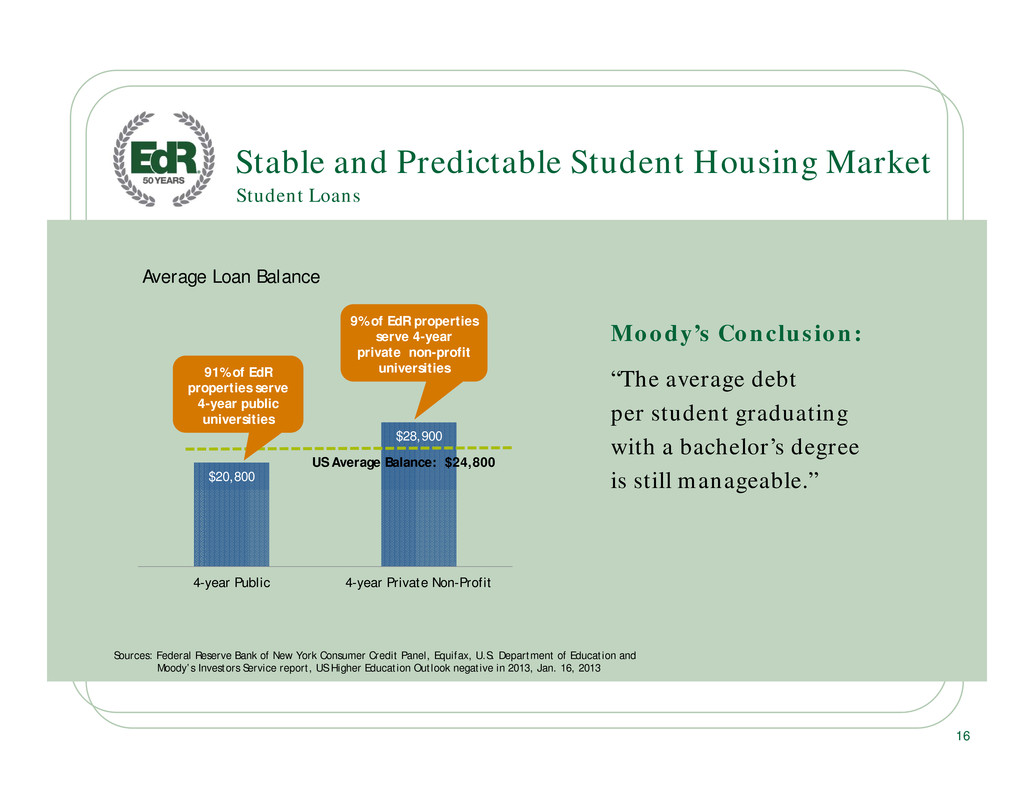
. . Stable and Predictable Student Housing Market Moody’s Conclusion: “The average debt per student graduating with a bachelor’s degree is still manageable.” Student Loans Sources: Federal Reserve Bank of New York Consumer Credit Panel, Equifax, U.S. Department of Education and Moody’s Investors Service report, US Higher Education Outlook negative in 2013, Jan. 16, 2013 $20,800 $28,900 4-year Public 4-year Private Non-Profit Average Loan Balance 9% of EdR properties serve 4-year private non-profit universities US Average Balance: $24,800 91% of EdR properties serve 4-year public universities 16
. . Stable and Predictable Student Housing Market • 40% of students graduating 4-year public and private universities have no debt. • Of students graduating with debt at these universities, 72% have less than $25,000 in debt and nearly 90% have less than $50,000 in debt. • The average student loan balance of $25,000 is substantially equivalent to one year’s increased wage between a high school graduate and a university’s bachelor’s degree. • Defaults are highest at private for-profit schools. • 40% of student loan balances are held by graduate students who account for only 14% of enrollment. • Recent studies have concluded that “student loan debt has replaced normal consumer debt due to its relative ease in obtaining.” Student Loans Source: Moody’s Investors Service report, US Higher Education Outlook negative in 2013, Jan. 16, 2013 17
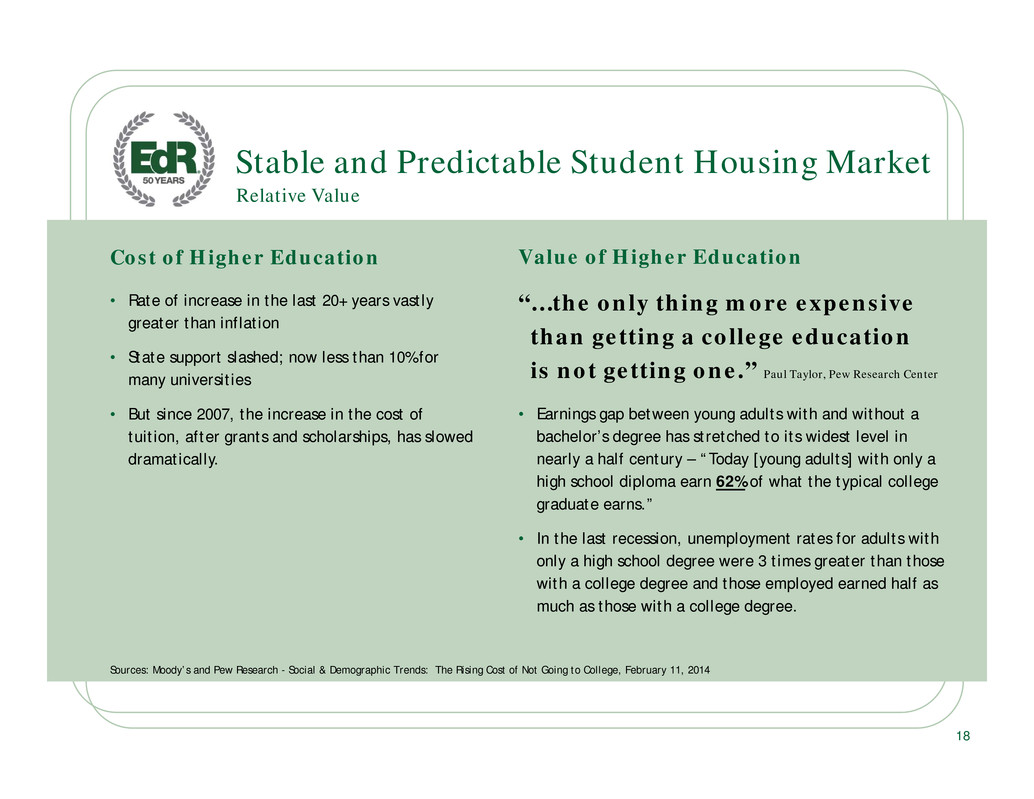
. . Cost of Higher Education • Rate of increase in the last 20+ years vastly greater than inflation • State support slashed; now less than 10% for many universities • But since 2007, the increase in the cost of tuition, after grants and scholarships, has slowed dramatically. “…the only thing more expensive than getting a college education is not getting one.” Paul Taylor, Pew Research Center • Earnings gap between young adults with and without a bachelor’s degree has stretched to its widest level in nearly a half century – “Today [young adults] with only a high school diploma earn 62% of what the typical college graduate earns.” • In the last recession, unemployment rates for adults with only a high school degree were 3 times greater than those with a college degree and those employed earned half as much as those with a college degree. Stable and Predictable Student Housing Market Relative Value Value of Higher Education Sources: Moody’s and Pew Research - Social & Demographic Trends: The Rising Cost of Not Going to College, February 11, 2014 18
. . Stable and Predictable Student Housing Market • Supplement to on-campus classes – predominantly non-accredited • High drop out rate and high failure rate • Part-time students • Most observers believe that online courses are a supplement to the university rather than a subtraction, in that most students taking online classes, other than the occasional class, are ones that would not have otherwise attended a four-year institution. • In a recent WSJ interview, the new Chief Executive Officer of Coursera, Inc. and the former President of Yale University stated that MOOCs couldn’t replace the traditional 4-year residential education model, but he said “we’re going to address the needs of millions who don’t have access to that.”(1) Massive Open Online Courses (MOOC) 19 (1) Wall Street Journal, March 25, 2014, “A College for the Masses Hires a Yale Man for Class,” by Douglas Belkin.
. . Conclusions • Repositioned Portfolio • Total Shareholder Return of 108% – #1 and #2 in student housing and multifamily segments, respectively – Top 85th percentile of all public REITs 20 Outstanding Four Years • Enrollment trends are favorable. • New supply is manageable. • Modernization is in full swing. Moving Forward
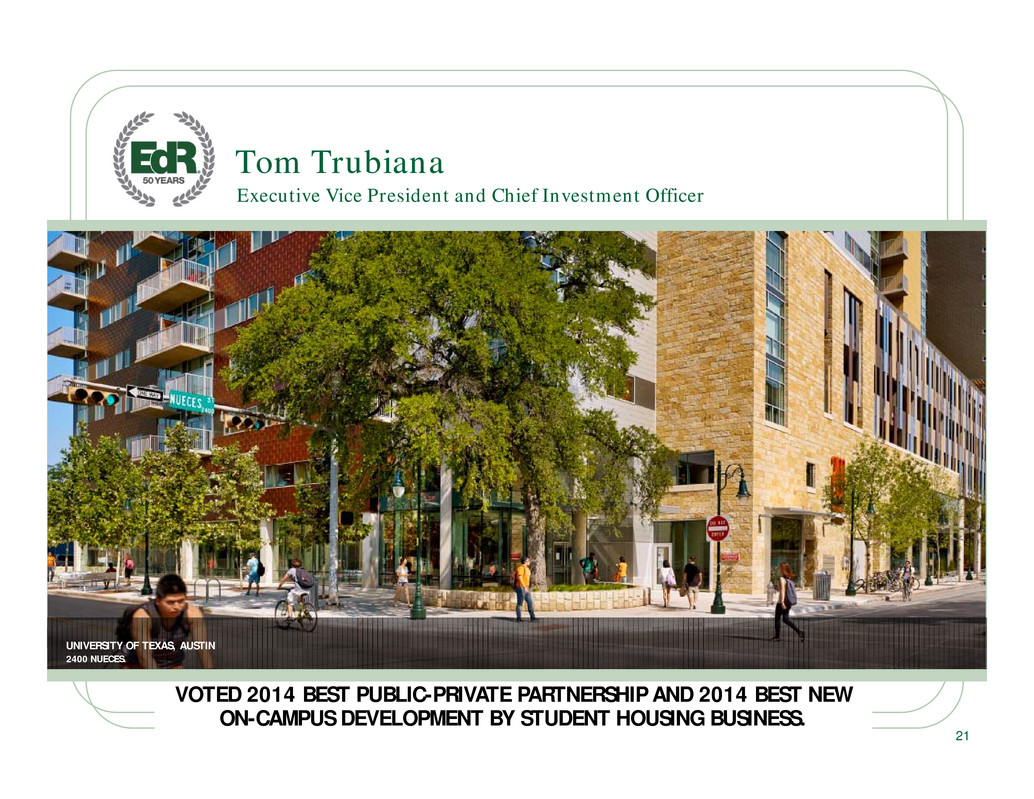
. . 21 Executive Vice President and Chief Investment Officer Tom Trubiana UNIVERSITY OF TEXAS, AUSTIN 2400 NUECES. VOTED 2014 BEST PUBLIC-PRIVATE PARTNERSHIP AND 2014 BEST NEW ON-CAMPUS DEVELOPMENT BY STUDENT HOUSING BUSINESS.
. . BEST IN CLASS PORTFOLIO Key Themes 22
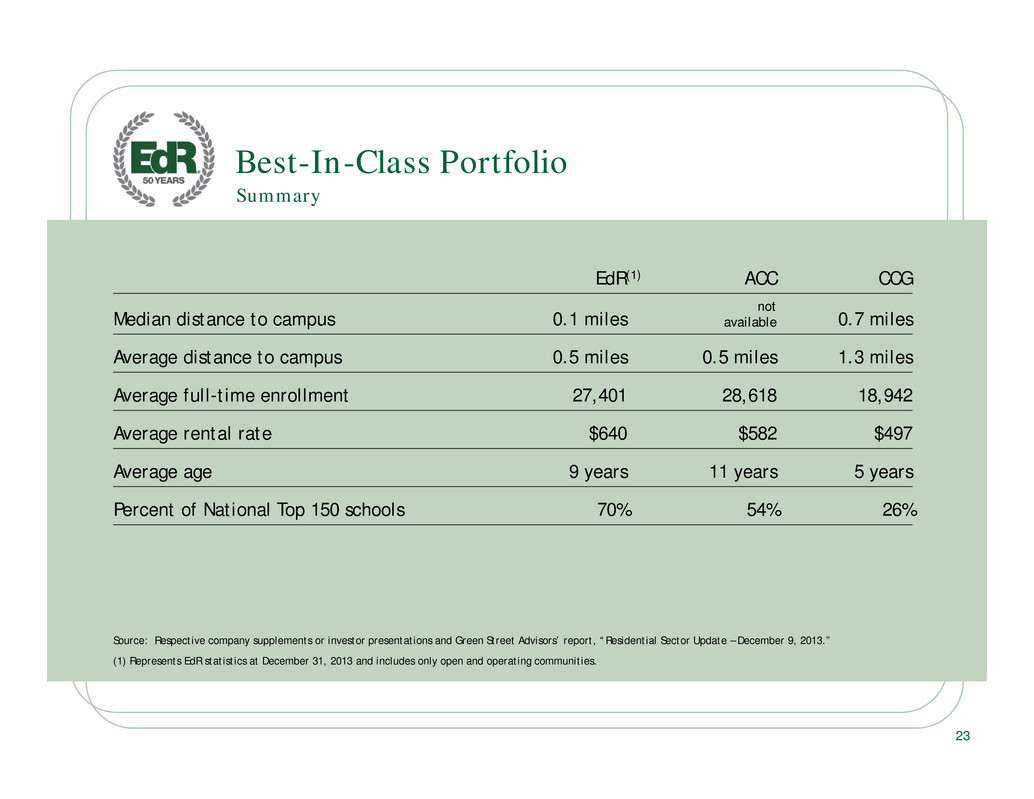
. . Best-In-Class Portfolio EdR(1) ACC CCG Median distance to campus 0.1 miles not available 0.7 miles Average distance to campus 0.5 miles 0.5 miles 1.3 miles Average full-time enrollment 27,401 28,618 18,942 Average rental rate $640 $582 $497 Average age 9 years 11 years 5 years Percent of National Top 150 schools 70% 54% 26% Summary Source: Respective company supplements or investor presentations and Green Street Advisors’ report, “Residential Sector Update – December 9, 2013.” (1) Represents EdR statistics at December 31, 2013 and includes only open and operating communities. 23
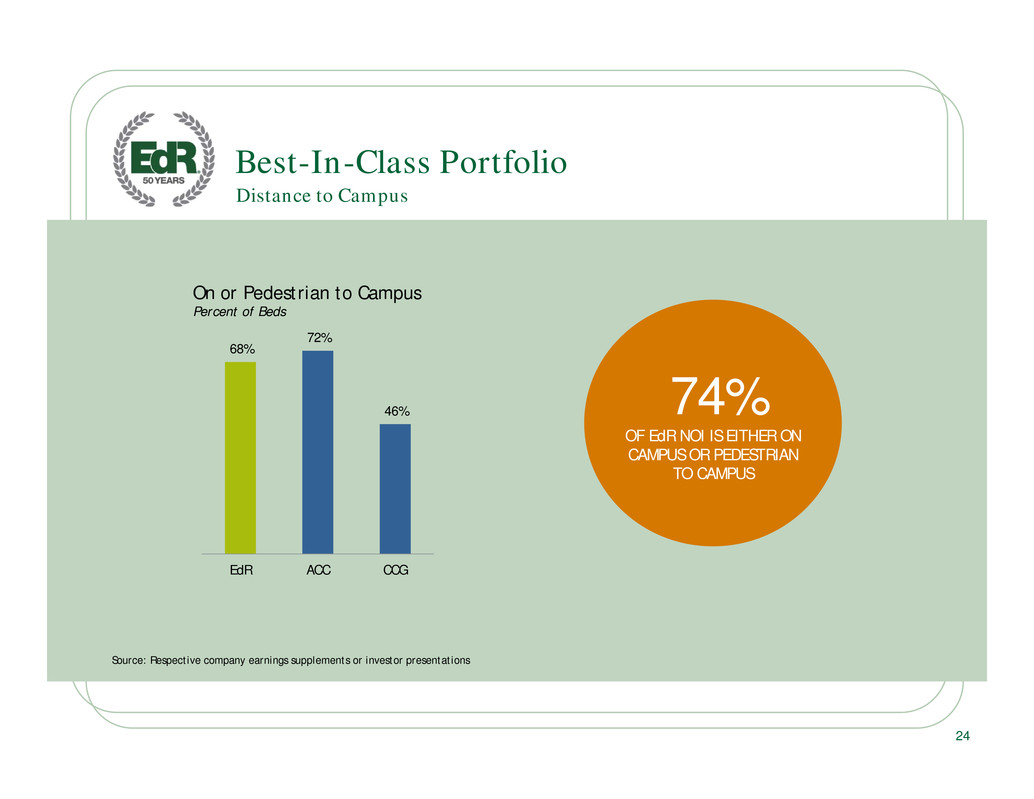
. . Distance to Campus Best-In-Class Portfolio Source: Respective company earnings supplements or investor presentations 74% OF EdR NOI IS EITHER ON CAMPUS OR PEDESTRIAN TO CAMPUS 24 68% 72% 46% EdR ACC CCG On or Pedestrian to Campus Percent of Beds
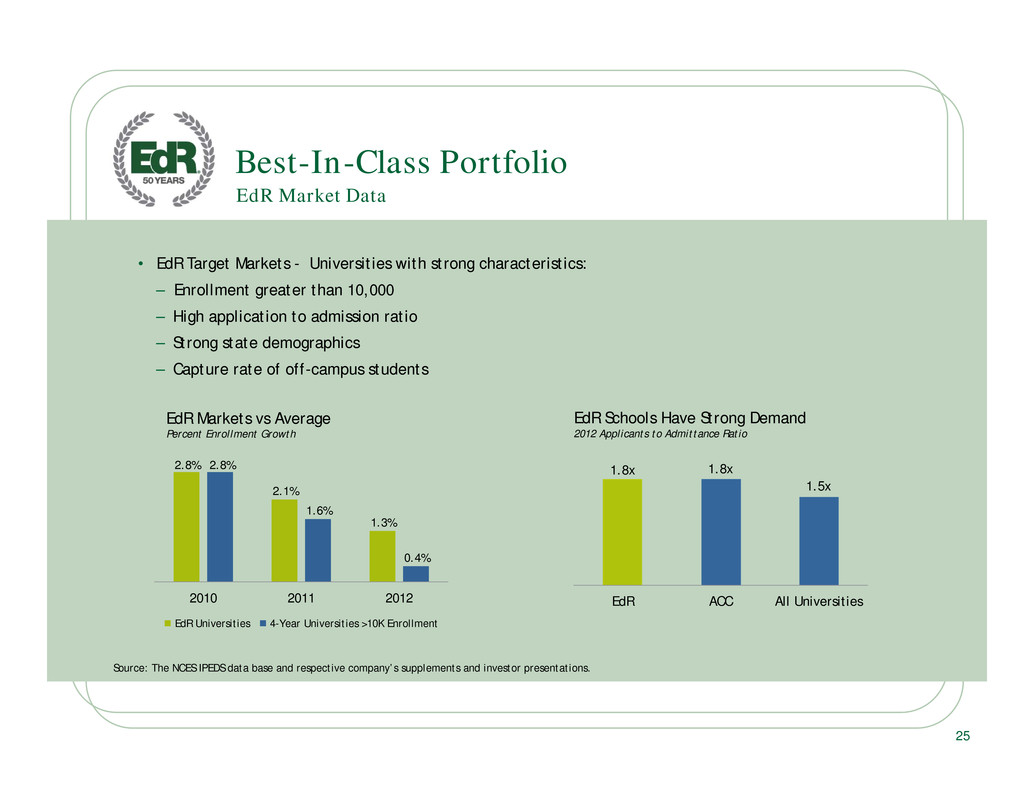
. . Best-In-Class Portfolio • EdR Target Markets - Universities with strong characteristics: – Enrollment greater than 10,000 – High application to admission ratio – Strong state demographics – Capture rate of off-campus students EdR Market Data Source: The NCES IPEDS data base and respective company’s supplements and investor presentations. 2.8% 2.1% 1.3% 2.8% 1.6% 0.4% 2010 2011 2012 EdR Markets vs Average Percent Enrollment Growth 1.8x 1.8x 1.5x EdR ACC All Universities EdR Schools Have Strong Demand 2012 Applicants to Admittance Ratio 25 EdR Universities 4-Year Universities >10K Enrollment
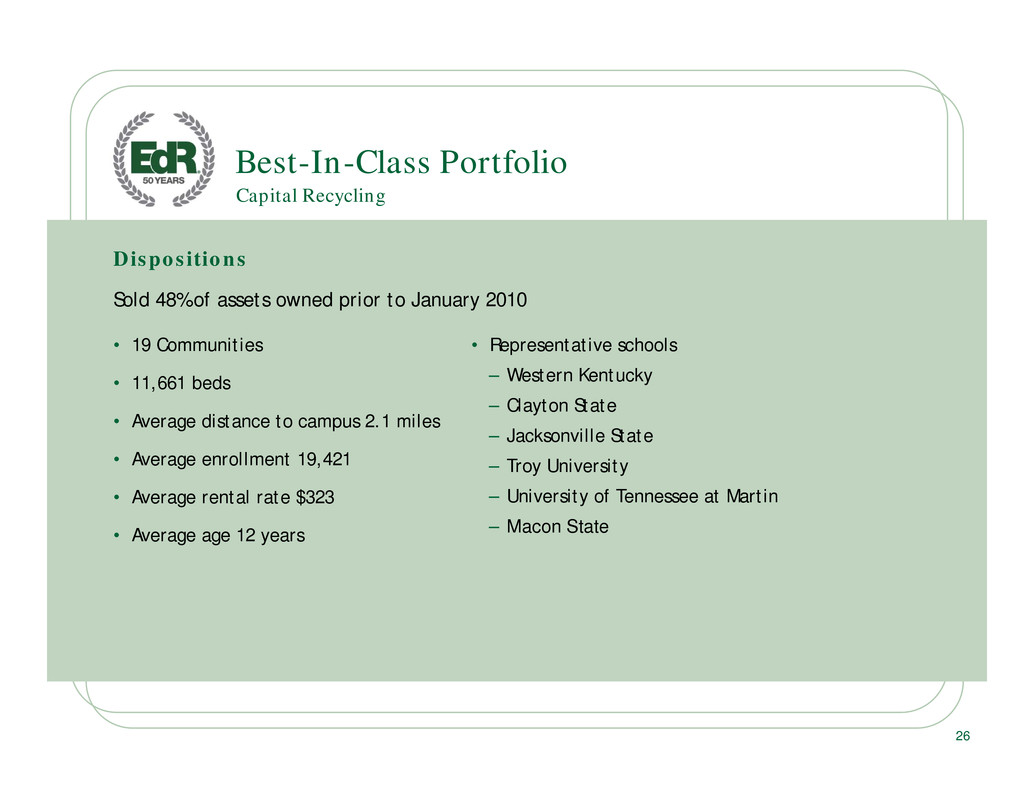
. . Dispositions Sold 48% of assets owned prior to January 2010 • 19 Communities • 11,661 beds • Average distance to campus 2.1 miles • Average enrollment 19,421 • Average rental rate $323 • Average age 12 years Best-In-Class Portfolio Capital Recycling • Representative schools – Western Kentucky – Clayton State – Jacksonville State – Troy University – University of Tennessee at Martin – Macon State 26
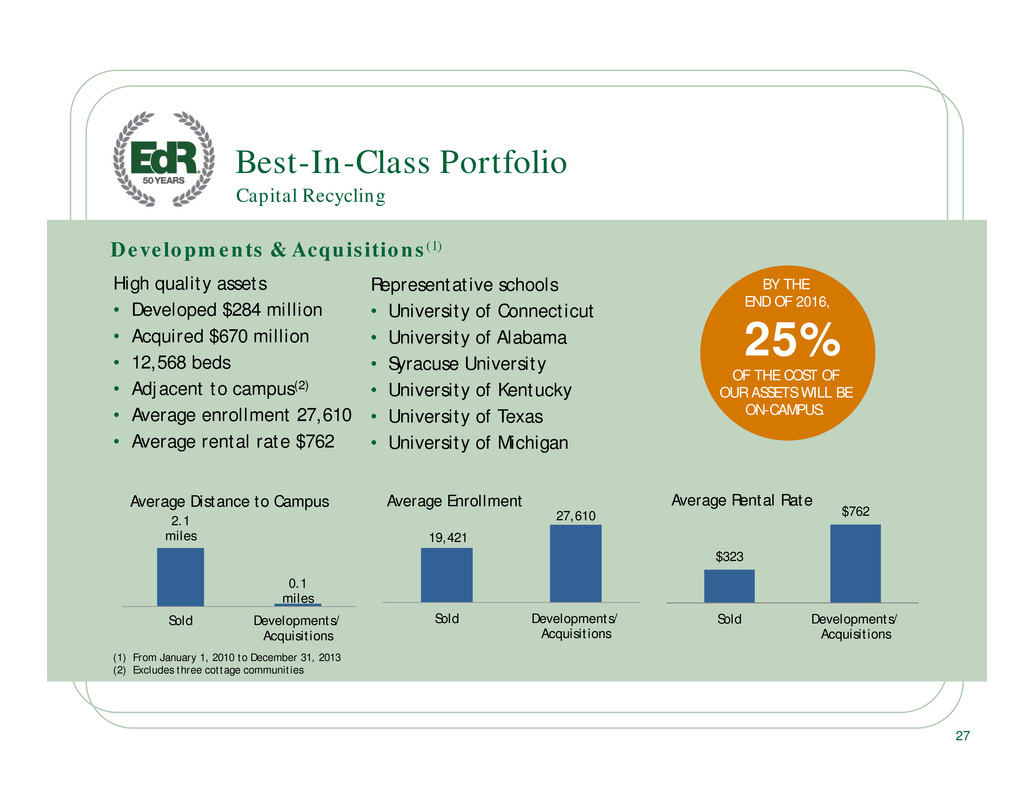
. . Developments & Acquisitions(1) High quality assets • Developed $284 million • Acquired $670 million • 12,568 beds • Adjacent to campus(2) • Average enrollment 27,610 • Average rental rate $762 Best-In-Class Portfolio Capital Recycling (1) From January 1, 2010 to December 31, 2013 (2) Excludes three cottage communities Representative schools • University of Connecticut • University of Alabama • Syracuse University • University of Kentucky • University of Texas • University of Michigan BY THE END OF 2016, 25% OF THE COST OF OUR ASSETS WILL BE ON-CAMPUS. 27 19,421 27,610 Sold Developments/ Acquisitions Average Enrollment 2.1 miles 0.1 miles Sold Developments/ Acquisitions Average Distance to Campus $323 $762 Sold Developments/ Acquisitions Average Rental Rate
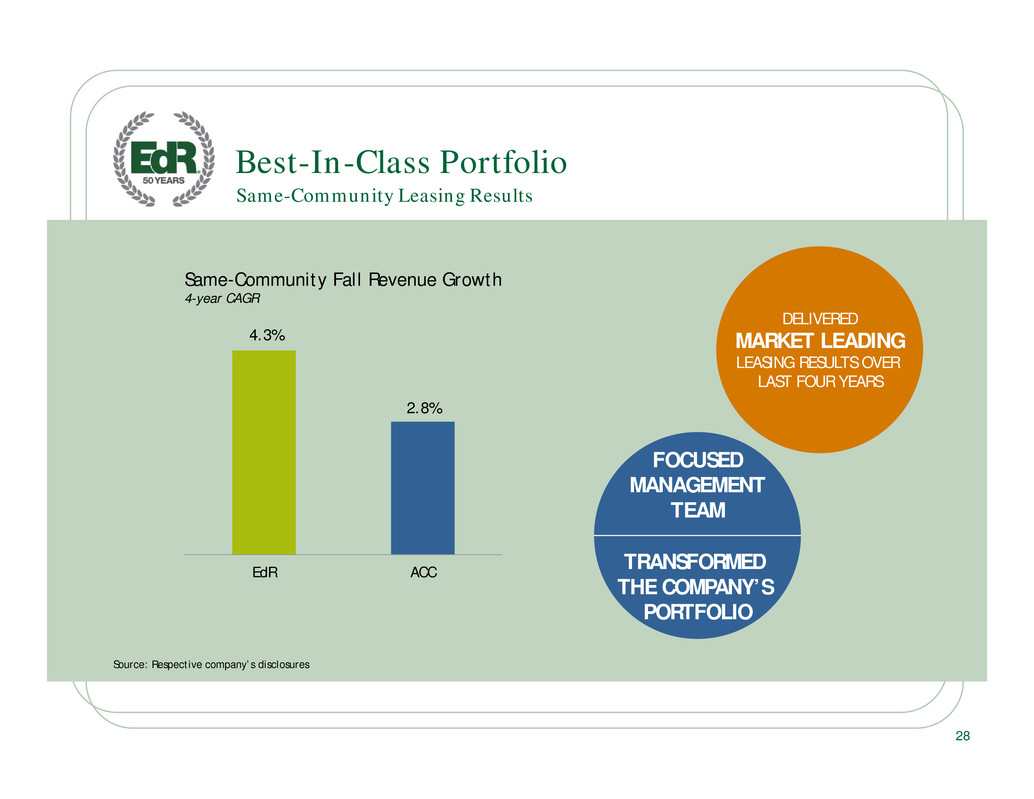
. . 28 Same-Community Leasing Results Best-In-Class Portfolio Source: Respective company’s disclosures 4.3% 2.8% EdR ACC Same-Community Fall Revenue Growth 4-year CAGR DELIVERED MARKET LEADING LEASING RESULTS OVER LAST FOUR YEARS FOCUSED MANAGEMENT TEAM TRANSFORMED THE COMPANY’S PORTFOLIO
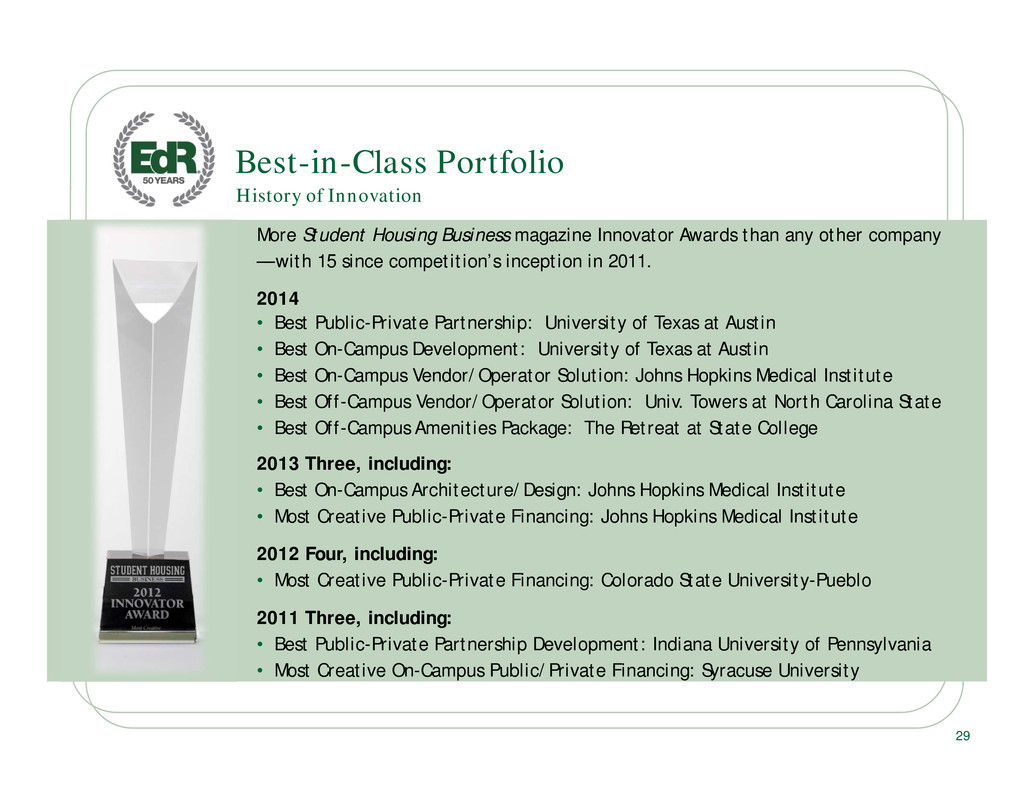
. . 29 History of Innovation Best-in-Class Portfolio More Student Housing Business magazine Innovator Awards than any other company — with 15 since competition’s inception in 2011. 2014 • Best Public-Private Partnership: University of Texas at Austin • Best On-Campus Development: University of Texas at Austin • Best On-Campus Vendor/Operator Solution: Johns Hopkins Medical Institute • Best Off-Campus Vendor/Operator Solution: Univ. Towers at North Carolina State • Best Off-Campus Amenities Package: The Retreat at State College 2013 Three, including: • Best On-Campus Architecture/Design: Johns Hopkins Medical Institute • Most Creative Public-Private Financing: Johns Hopkins Medical Institute 2012 Four, including: • Most Creative Public-Private Financing: Colorado State University-Pueblo 2011 Three, including: • Best Public-Private Partnership Development: Indiana University of Pennsylvania • Most Creative On-Campus Public/Private Financing: Syracuse University
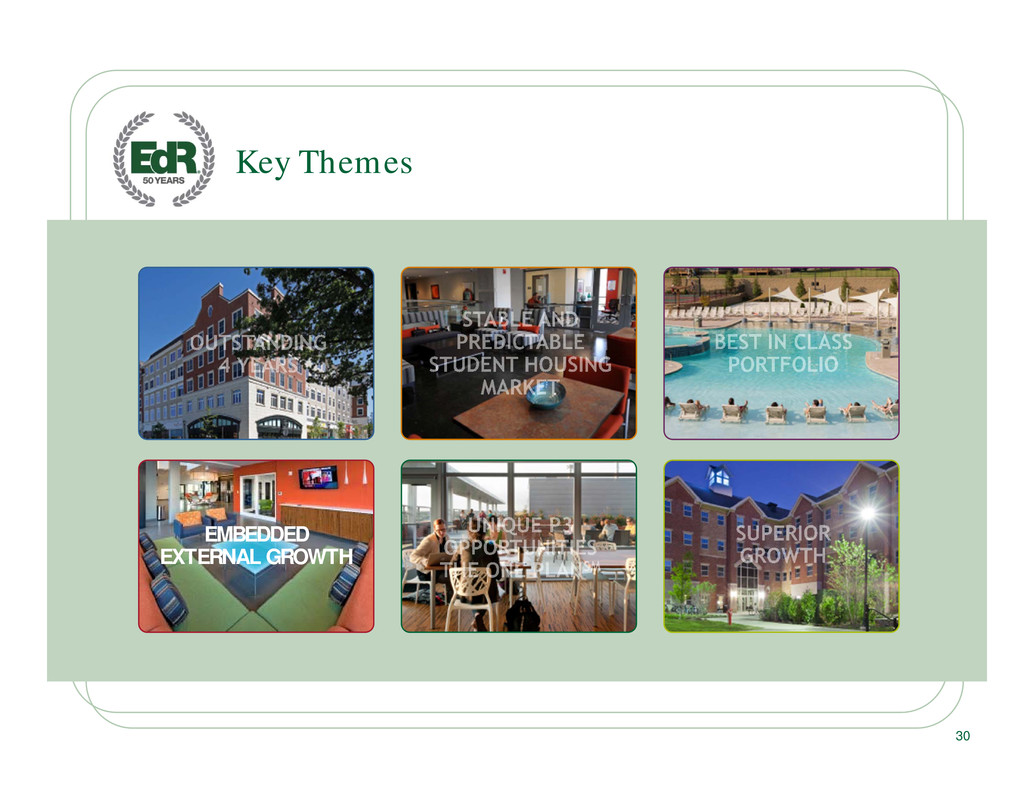
. . EMBEDDED EXTERNAL GROWTH Key Themes 30
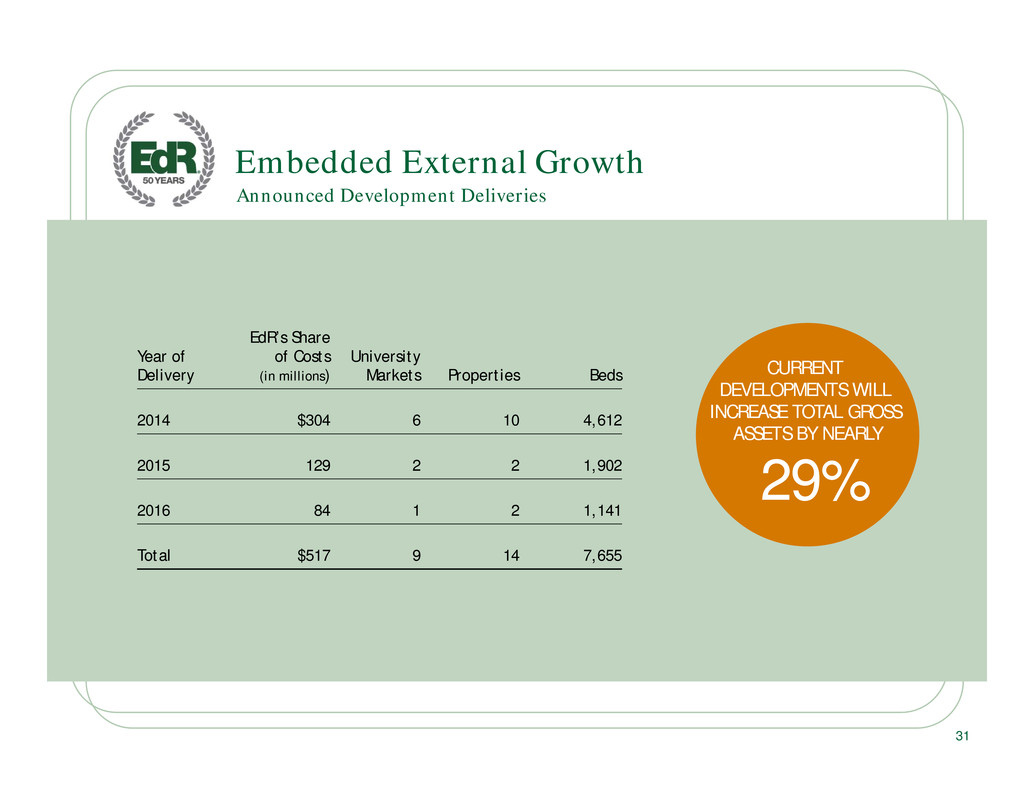
. . Embedded External Growth Year of Delivery EdR’s Share of Costs (in millions) University Markets Properties Beds 2014 $304 6 10 4,612 2015 129 2 2 1,902 2016 84 1 2 1,141 Total $517 9 14 7,655 Announced Development Deliveries CURRENT DEVELOPMENTS WILL INCREASE TOTAL GROSS ASSETS BY NEARLY 29% 31
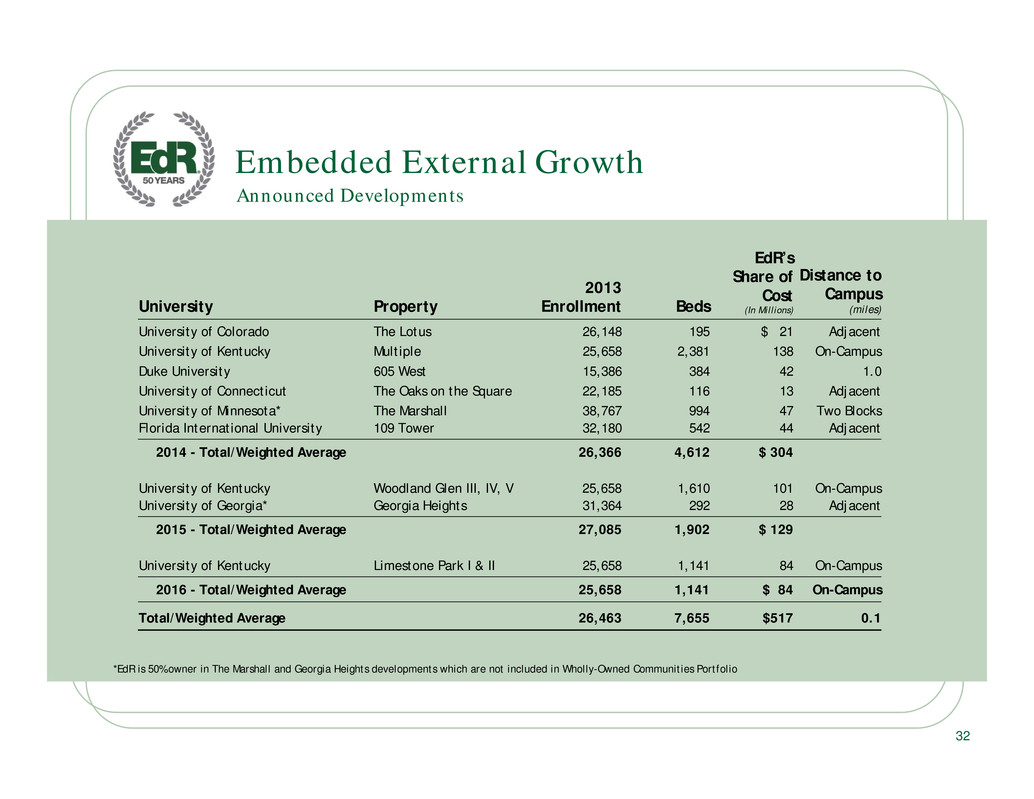
. . 32 Announced Developments Embedded External Growth *EdR is 50% owner in The Marshall and Georgia Heights developments which are not included in Wholly-Owned Communities Portfolio University Property 2013 Enrollment Beds EdR’s Share of Cost (In Millions) Distance to Campus (miles) University of Colorado The Lotus 26,148 195 $ 21 Adjacent University of Kentucky Multiple 25,658 2,381 138 On-Campus Duke University 605 West 15,386 384 42 1.0 University of Connecticut The Oaks on the Square 22,185 116 13 Adjacent University of Minnesota* The Marshall 38,767 994 47 Two Blocks Florida International University 109 Tower 32,180 542 44 Adjacent 2014 - Total/Weighted Average 26,366 4,612 $ 304 University of Kentucky Woodland Glen III, IV, V 25,658 1,610 101 On-Campus University of Georgia* Georgia Heights 31,364 292 28 Adjacent 2015 - Total/Weighted Average 27,085 1,902 $ 129 University of Kentucky Limestone Park I & II 25,658 1,141 84 On-Campus 2016 - Total/Weighted Average 25,658 1,141 $ 84 On-Campus Total/Weighted Average 26,463 7,655 $517 0.1
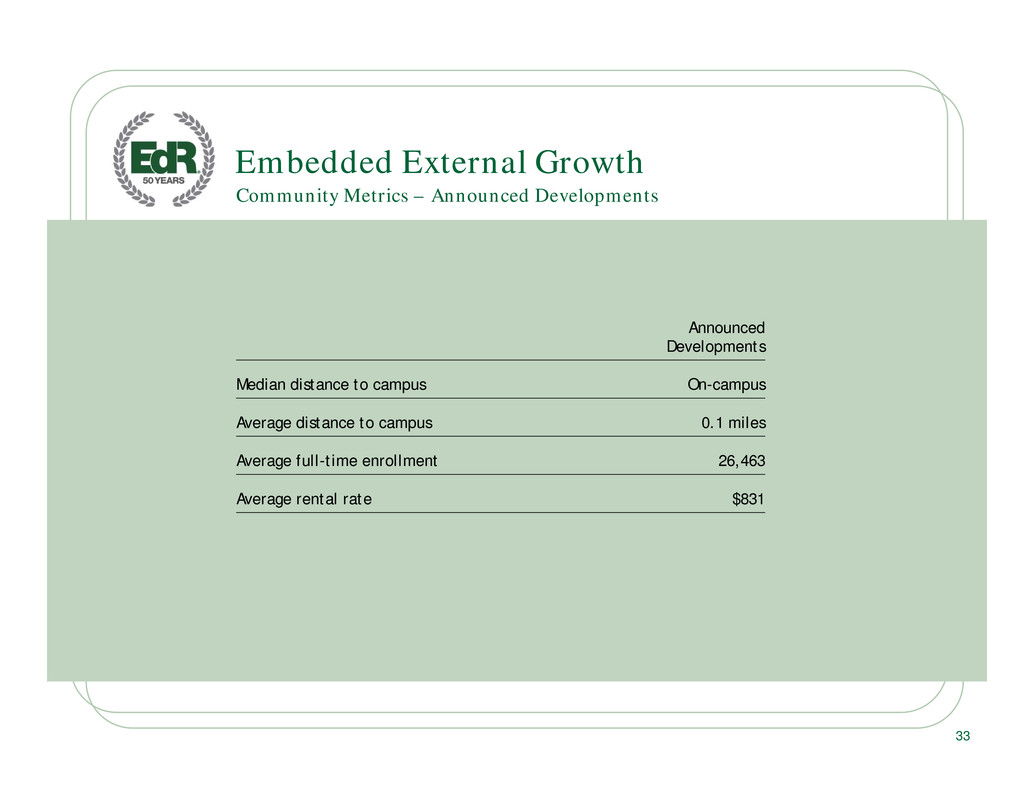
. . Embedded External Growth Announced Developments Median distance to campus On-campus Average distance to campus 0.1 miles Average full-time enrollment 26,463 Average rental rate $831 Community Metrics – Announced Developments 33
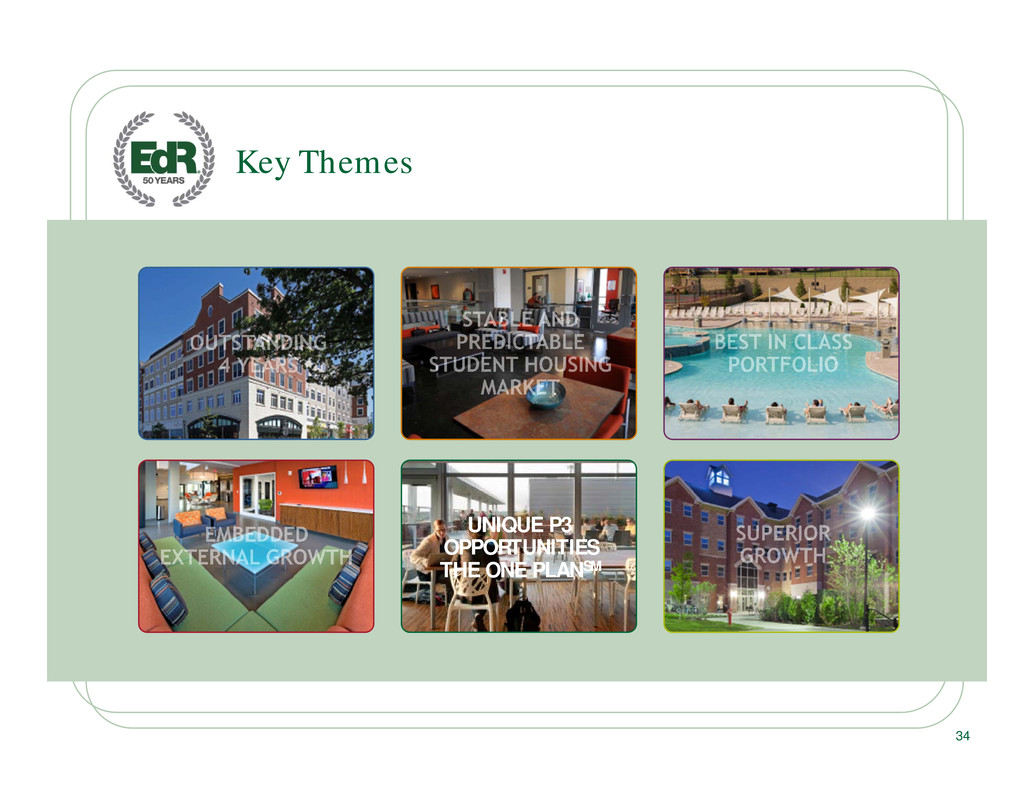
. . UNIQUE P3 OPPORTUNITIES THE ONE PLANSM Key Themes 34
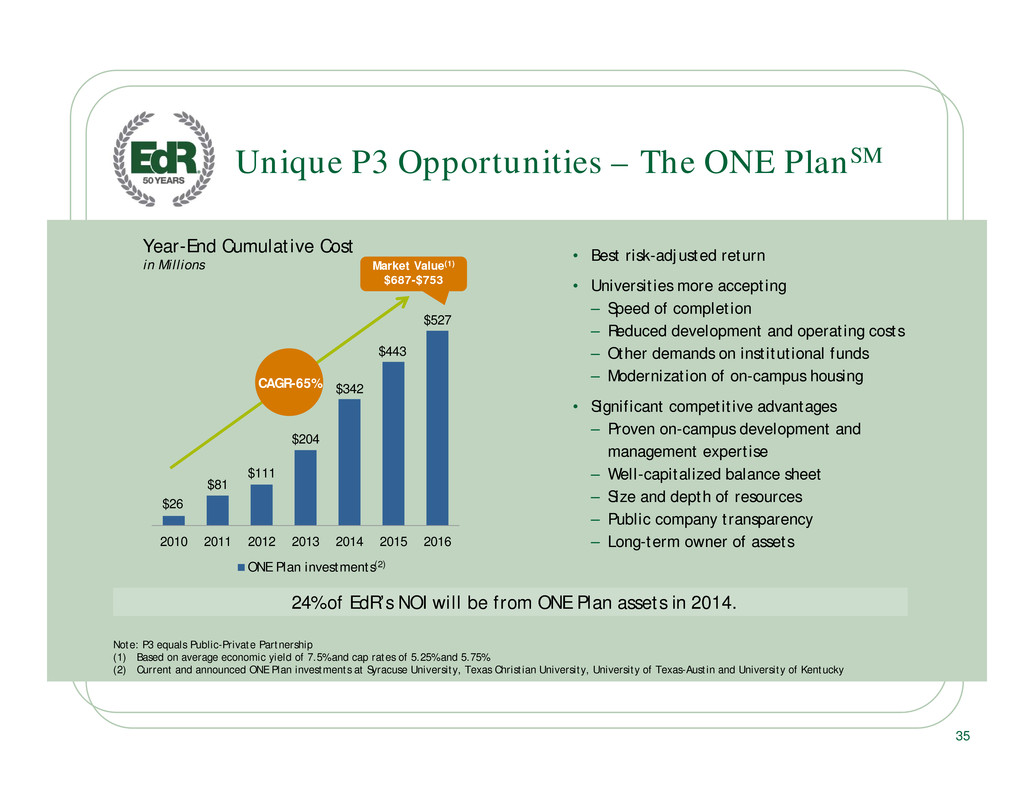
. . • Best risk-adjusted return • Universities more accepting – Speed of completion – Reduced development and operating costs – Other demands on institutional funds – Modernization of on-campus housing • Significant competitive advantages – Proven on-campus development and management expertise – Well-capitalized balance sheet – Size and depth of resources – Public company transparency – Long-term owner of assets Unique P3 Opportunities – The ONE PlanSM 24% of EdR’s NOI will be from ONE Plan assets in 2014. Note: P3 equals Public-Private Partnership (1) Based on average economic yield of 7.5% and cap rates of 5.25% and 5.75% (2) Current and announced ONE Plan investments at Syracuse University, Texas Christian University, University of Texas-Austin and University of Kentucky 35 $26 $81 $111 $204 $342 $443 $527 2010 2011 2012 2013 2014 2015 2016 ONE Plan investments Market Value(1) $687-$753 Year-End Cumulative Cost in Millions (2) CAGR-65%

. . Unique P3 Opportunities – The ONE PlanSM University’s Goals • President Capilouto’s Kentucky Promise (right) • Modern housing for competitive advantage – Replace almost all current housing – Increase inventory to 9,000 beds • Preserve debt capacity for academic purposes • No adverse impact on credit rating 36 University of Kentucky “In order to attract the best and brightest students from Kentucky, the nation and world, we must revitalize the university. The people of the Commonwealth deserve this from its flagship institution.” — President Eli Capilouto, October 25, 2011
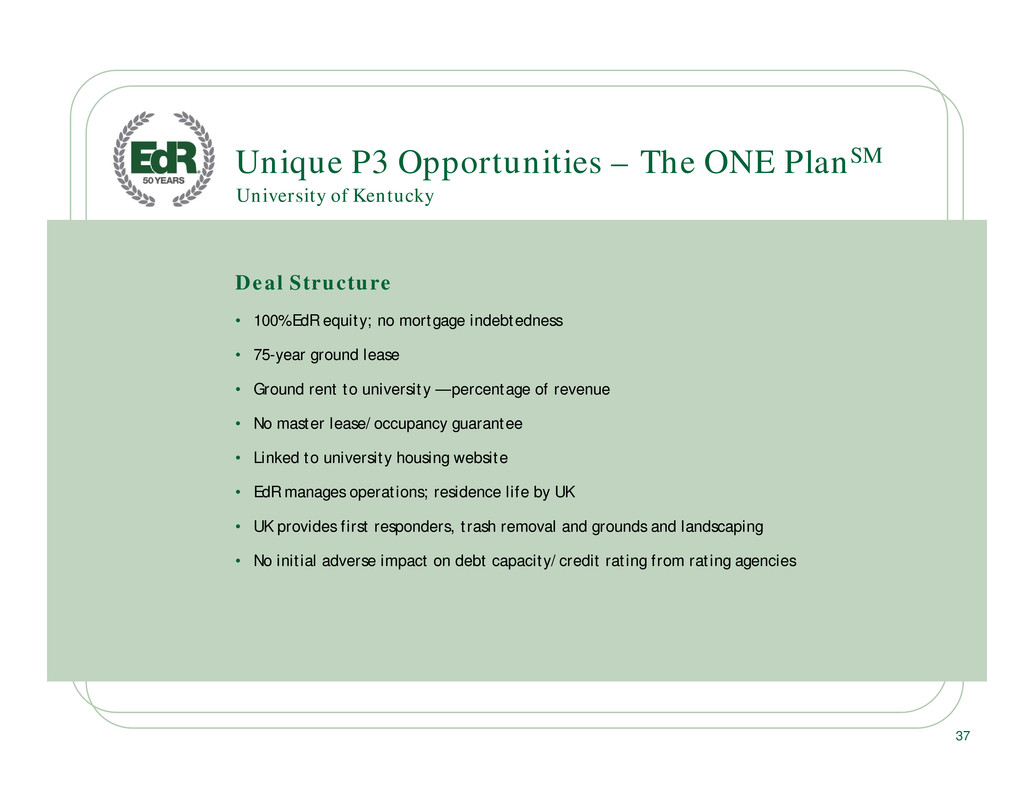
. . Unique P3 Opportunities – The ONE PlanSM Deal Structure • 100% EdR equity; no mortgage indebtedness • 75-year ground lease • Ground rent to university — percentage of revenue • No master lease/occupancy guarantee • Linked to university housing website • EdR manages operations; residence life by UK • UK provides first responders, trash removal and grounds and landscaping • No initial adverse impact on debt capacity/credit rating from rating agencies University of Kentucky 37
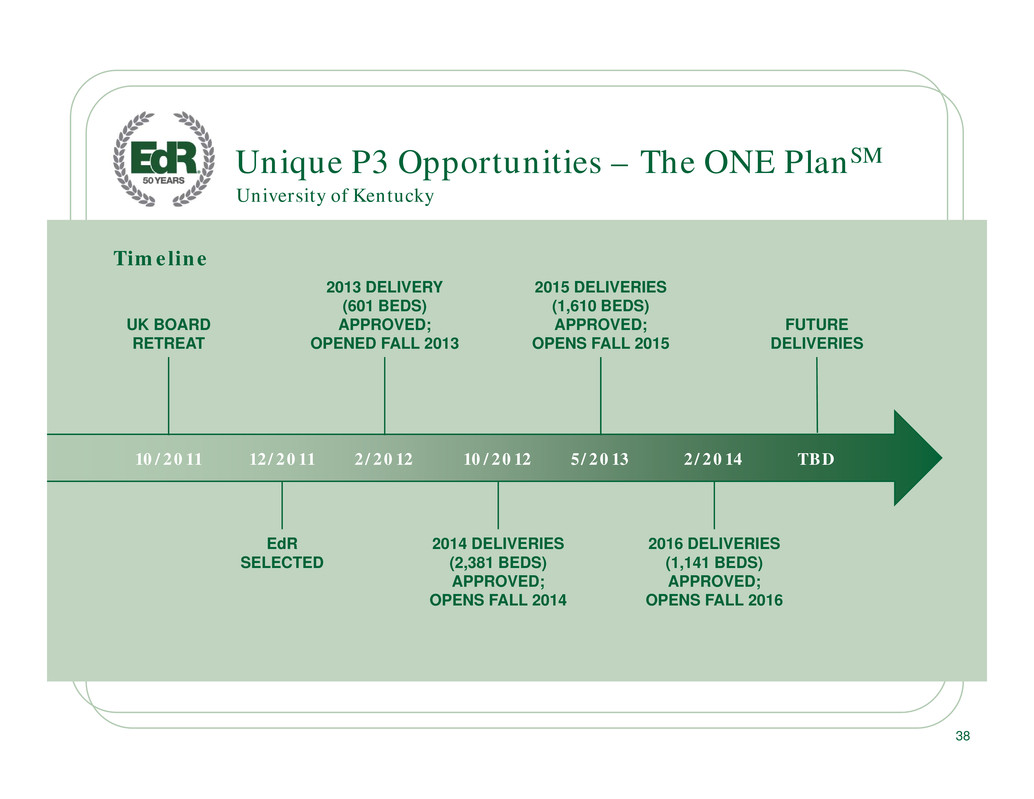
. . 38 Timeline Unique P3 Opportunities – The ONE PlanSM University of Kentucky UK BOARD RETREAT 2013 DELIVERY (601 BEDS) APPROVED; OPENED FALL 2013 2015 DELIVERIES (1,610 BEDS) APPROVED; OPENS FALL 2015 FUTURE DELIVERIES EdR SELECTED 2014 DELIVERIES (2,381 BEDS) APPROVED; OPENS FALL 2014 2016 DELIVERIES (1,141 BEDS) APPROVED; OPENS FALL 2016 10/2011 12/2011 2/2012 10/2012 5/2013 2/2014 TBD

. . Unique P3 Opportunities – The ONE PlanSM Living Arrangement GPA* Retention Off campus 2.50 76% On campus 2.86 83% Living-learning centers 3.26 88% University of Kentucky *GPA based on first semester Source: University of Kentucky 39 Student Performance Indicators
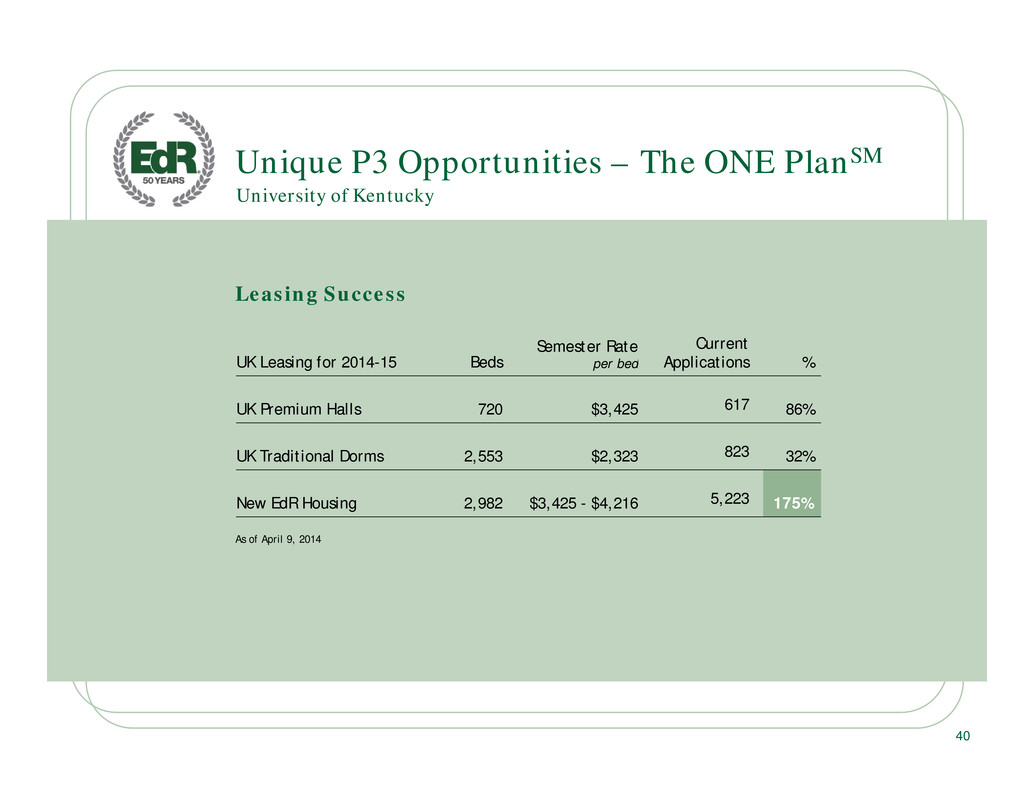
. . Unique P3 Opportunities – The ONE PlanSM UK Leasing for 2014-15 Beds Semester Rate per bed Current Applications % UK Premium Halls 720 $3,425 617 86% UK Traditional Dorms 2,553 $2,323 823 32% New EdR Housing 2,982 $3,425 - $4,216 5,223 175% University of Kentucky As of April 9, 2014 40 Leasing Success
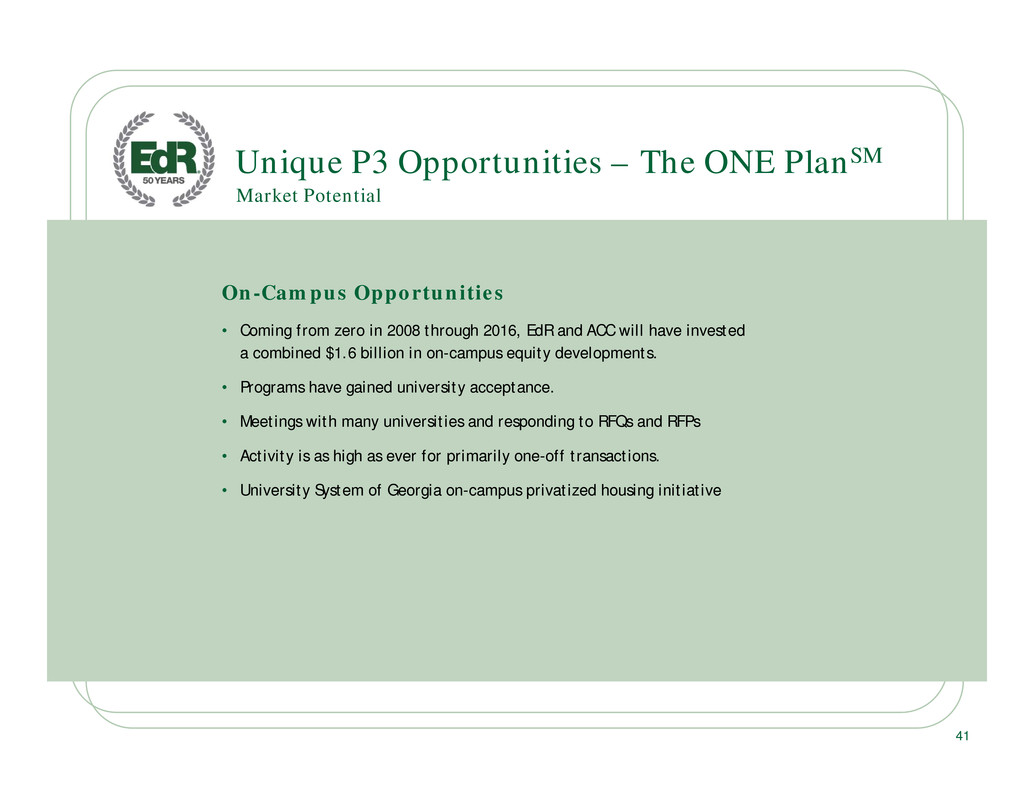
. . Unique P3 Opportunities – The ONE PlanSM On-Campus Opportunities • Coming from zero in 2008 through 2016, EdR and ACC will have invested a combined $1.6 billion in on-campus equity developments. • Programs have gained university acceptance. • Meetings with many universities and responding to RFQs and RFPs • Activity is as high as ever for primarily one-off transactions. • University System of Georgia on-campus privatized housing initiative Market Potential 41
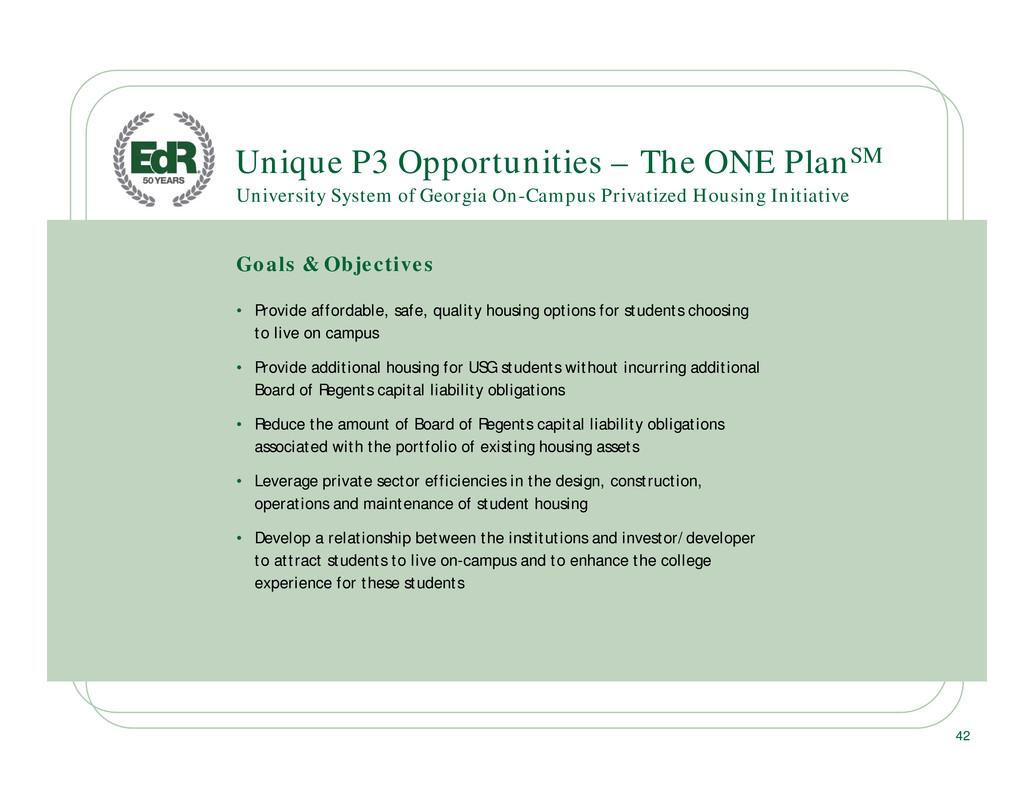
. . • Provide affordable, safe, quality housing options for students choosing to live on campus • Provide additional housing for USG students without incurring additional Board of Regents capital liability obligations • Reduce the amount of Board of Regents capital liability obligations associated with the portfolio of existing housing assets • Leverage private sector efficiencies in the design, construction, operations and maintenance of student housing • Develop a relationship between the institutions and investor/developer to attract students to live on-campus and to enhance the college experience for these students Unique P3 Opportunities – The ONE PlanSM University System of Georgia On-Campus Privatized Housing Initiative Goals & Objectives 42
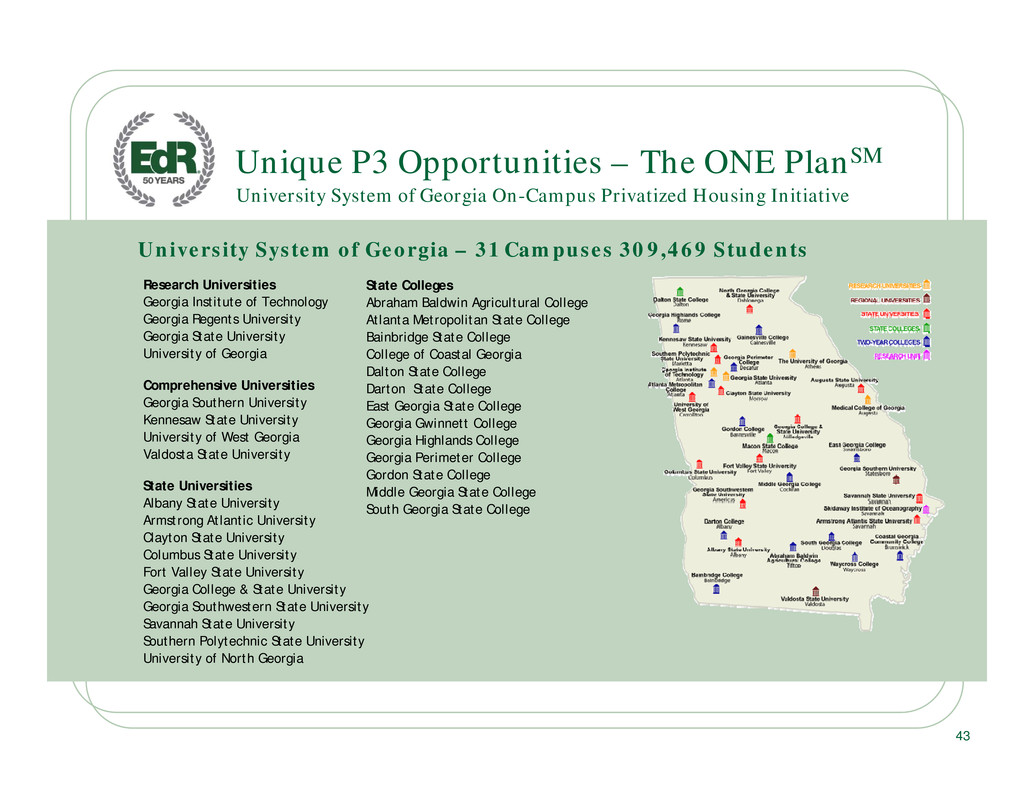
. . University System of Georgia – 31 Campuses 309,469 Students Research Universities Georgia Institute of Technology Georgia Regents University Georgia State University University of Georgia Comprehensive Universities Georgia Southern University Kennesaw State University University of West Georgia Valdosta State University State Universities Albany State University Armstrong Atlantic University Clayton State University Columbus State University Fort Valley State University Georgia College & State University Georgia Southwestern State University Savannah State University Southern Polytechnic State University University of North Georgia State Colleges Abraham Baldwin Agricultural College Atlanta Metropolitan State College Bainbridge State College College of Coastal Georgia Dalton State College Darton State College East Georgia State College Georgia Gwinnett College Georgia Highlands College Georgia Perimeter College Gordon State College Middle Georgia State College South Georgia State College University System of Georgia On-Campus Privatized Housing Initiative Unique P3 Opportunities – The ONE PlanSM 43
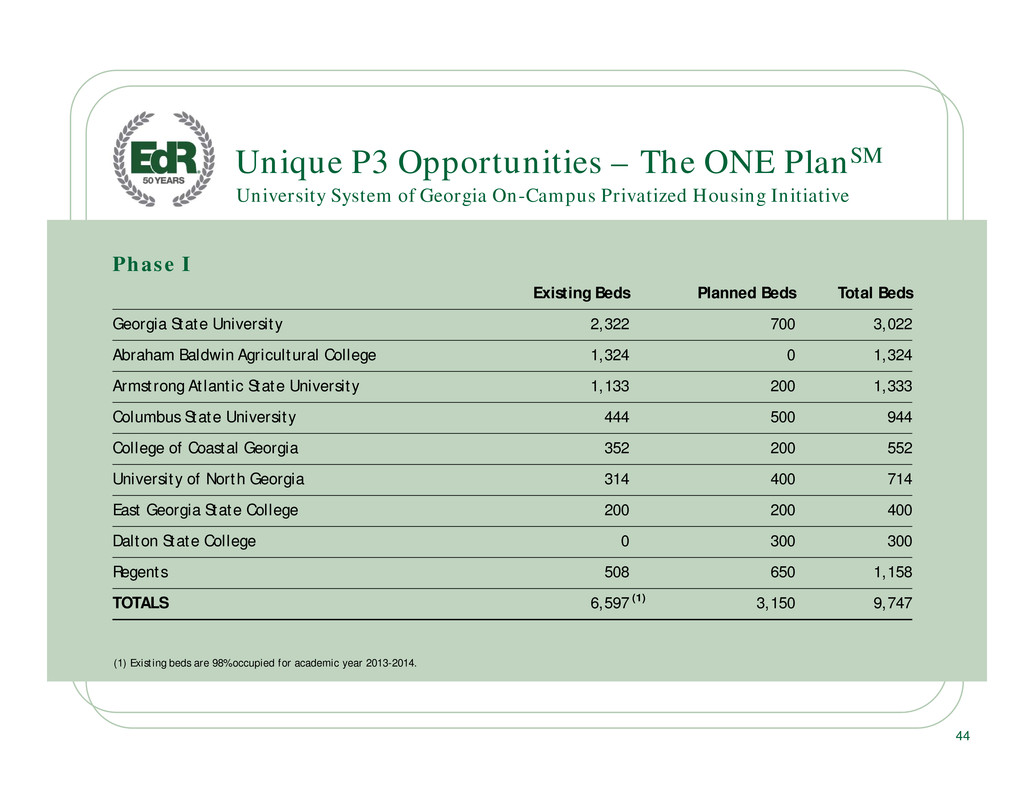
. . Phase I Existing Beds Planned Beds Total Beds Georgia State University 2,322 700 3,022 Abraham Baldwin Agricultural College 1,324 0 1,324 Armstrong Atlantic State University 1,133 200 1,333 Columbus State University 444 500 944 College of Coastal Georgia 352 200 552 University of North Georgia 314 400 714 East Georgia State College 200 200 400 Dalton State College 0 300 300 Regents 508 650 1,158 TOTALS 6,597 (1) 3,150 9,747 Unique P3 Opportunities – The ONE PlanSM University System of Georgia On-Campus Privatized Housing Initiative (1) Existing beds are 98% occupied for academic year 2013-2014. 44
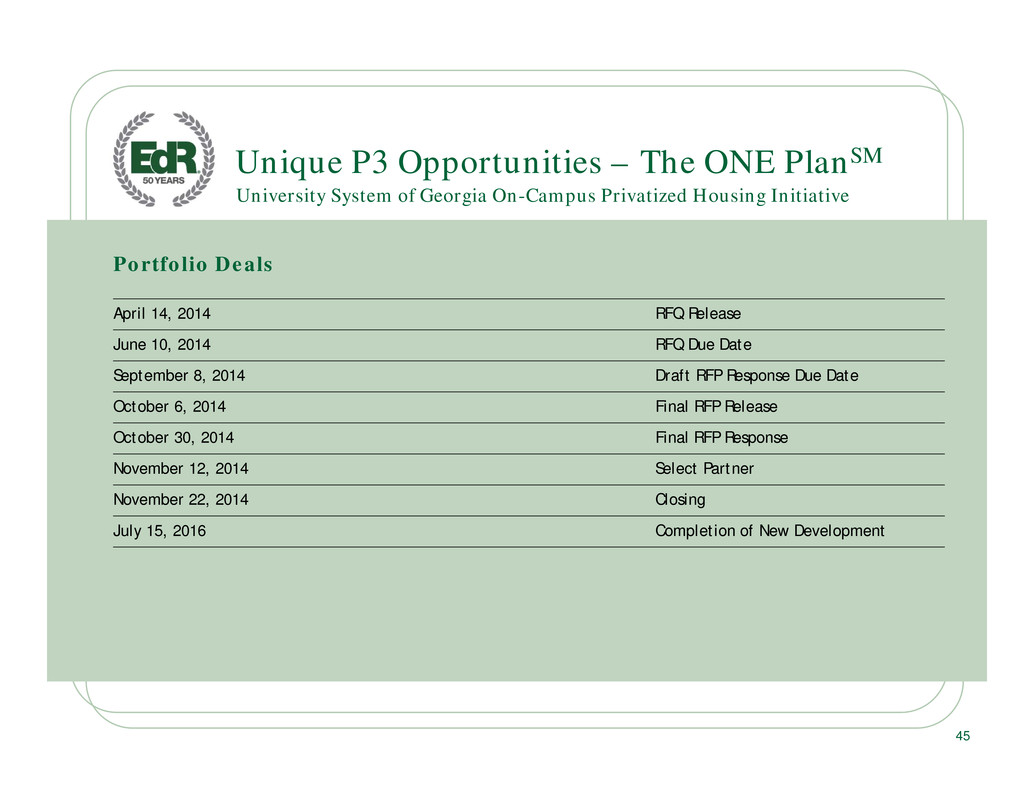
. . Portfolio Deals April 14, 2014 RFQ Release June 10, 2014 RFQ Due Date September 8, 2014 Draft RFP Response Due Date October 6, 2014 Final RFP Release October 30, 2014 Final RFP Response November 12, 2014 Select Partner November 22, 2014 Closing July 15, 2016 Completion of New Development Unique P3 Opportunities – The ONE PlanSM University System of Georgia On-Campus Privatized Housing Initiative 45
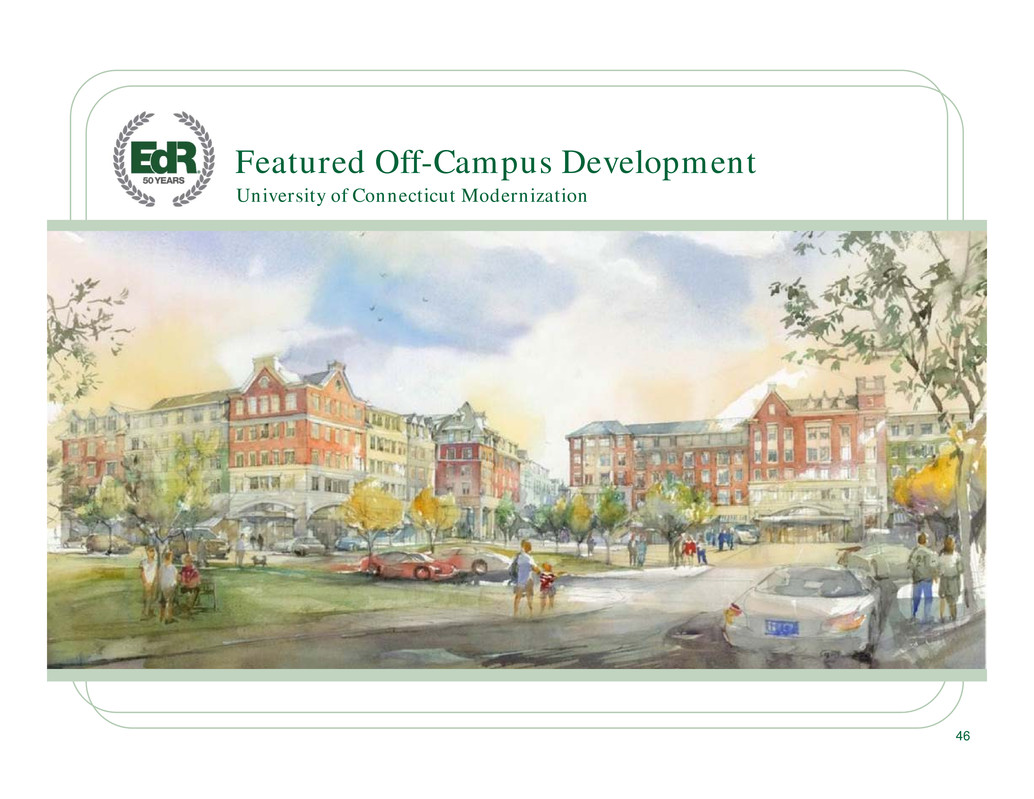
. . University of Connecticut Modernization Featured Off-Campus Development 46

. . Relevant Data Points • Enrollment 2013 – 22,185 • Students housed on campus – 50% • Other off-campus purpose built student housing – 944 Beds (4% of Enrollment) – 1.9 miles – average distance from campus • Remaining 46% of enrollment resides in non- purpose-built student housing • EdR added beds – 619, in 414 units – adjacent to campus – Will be 100% leased for fall 2014-2015 Featured Off-Campus Development University of Connecticut Modernization 47 Example of Modernization • EdR New Supply 2.7% • UConn Enrollment Growth 0% (2011-2013)
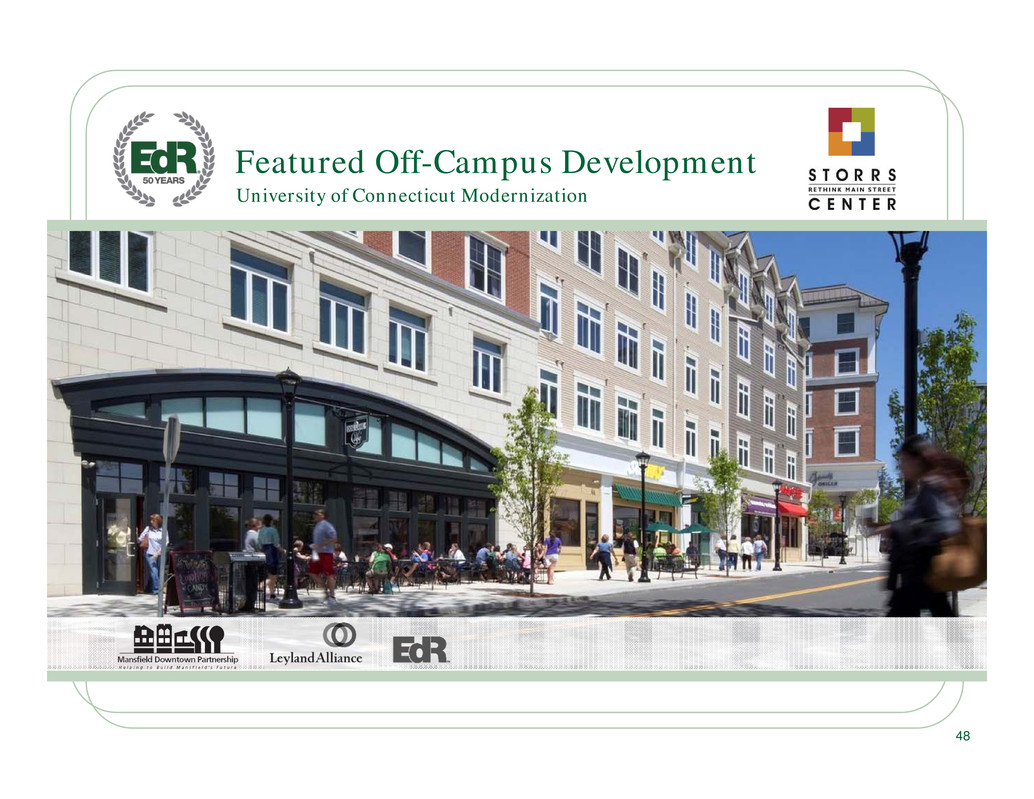
. . University of Connecticut Modernization Featured Off-Campus Development 48
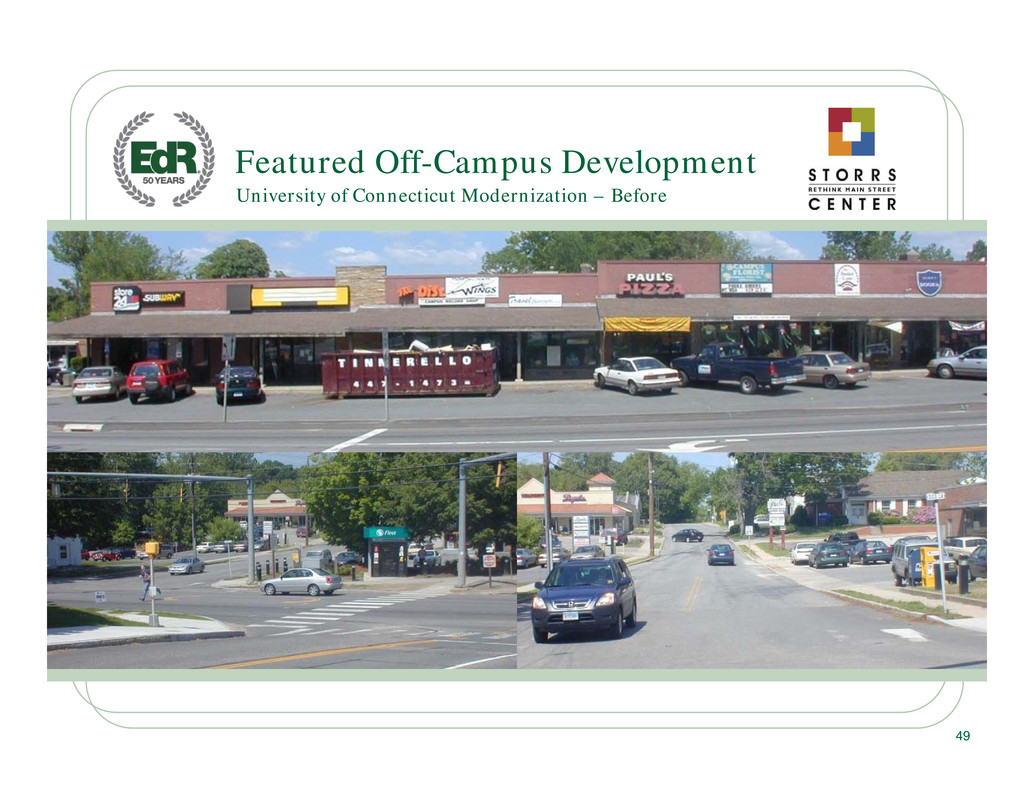
. . University of Connecticut Modernization – Before Featured Off-Campus Development 49
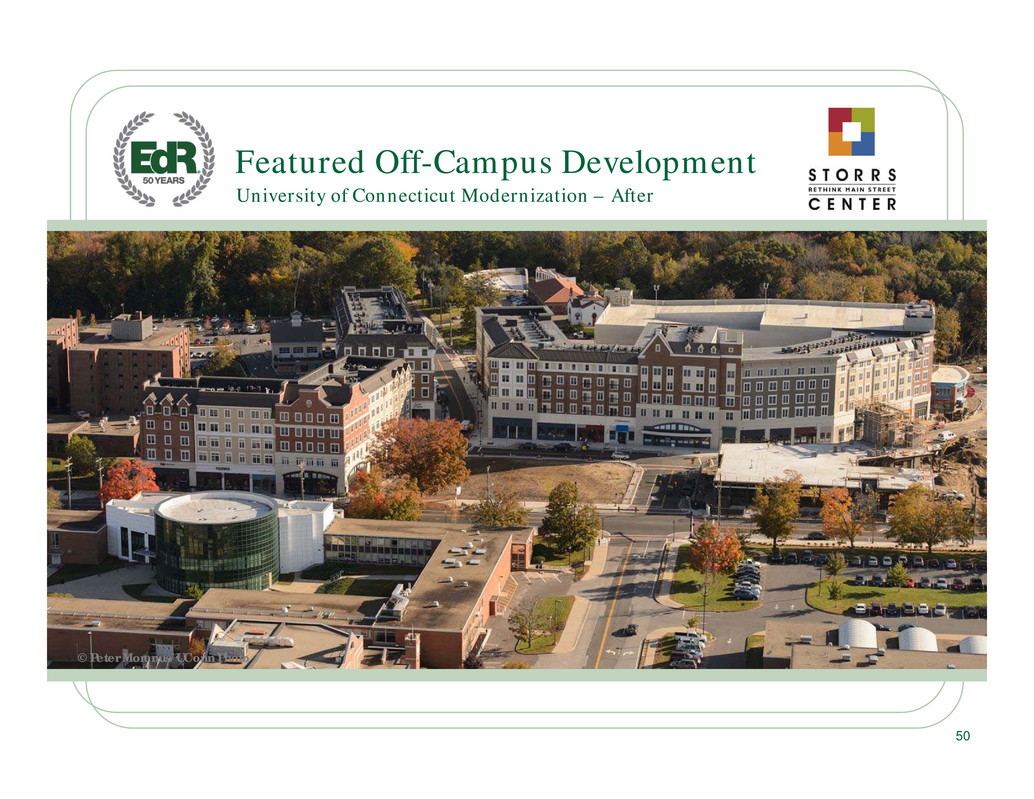
. . University of Connecticut Modernization – After Featured Off-Campus Development 50 © Peter Morenus/UConn Photo
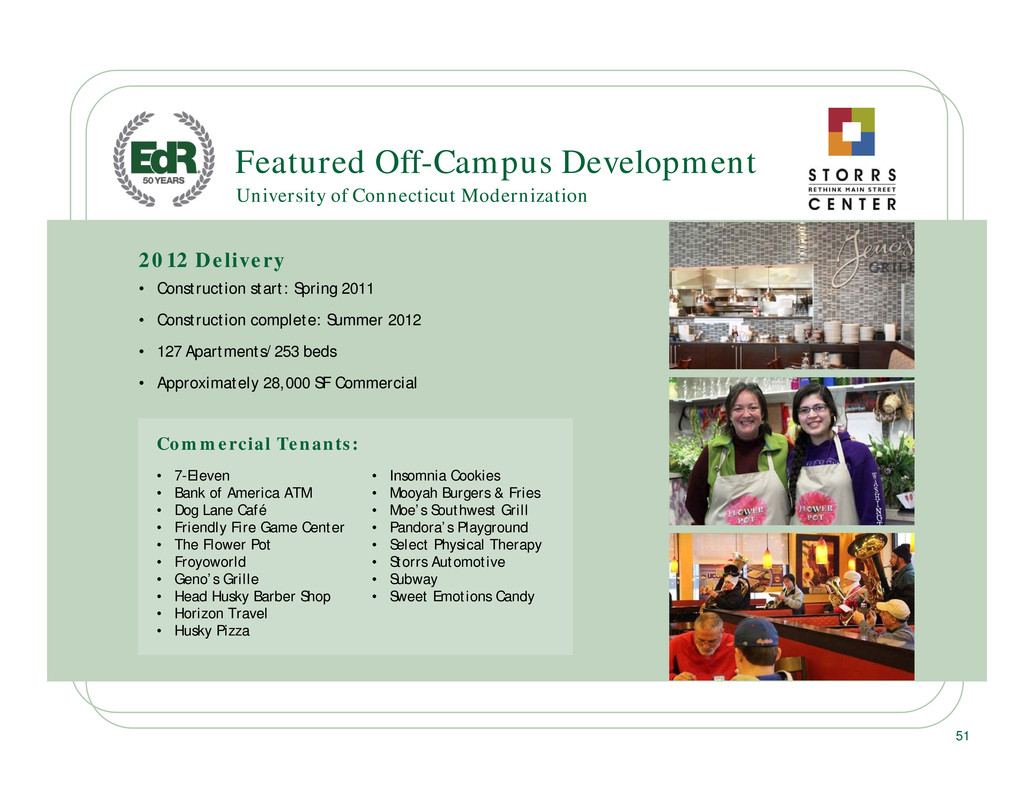
. . Featured Off-Campus Development • Construction start: Spring 2011 • Construction complete: Summer 2012 • 127 Apartments/253 beds • Approximately 28,000 SF Commercial University of Connecticut Modernization • 7-Eleven • Bank of America ATM • Dog Lane Café • Friendly Fire Game Center • The Flower Pot • Froyoworld • Geno’s Grille • Head Husky Barber Shop • Horizon Travel • Husky Pizza • Insomnia Cookies • Mooyah Burgers & Fries • Moe’s Southwest Grill • Pandora’s Playground • Select Physical Therapy • Storrs Automotive • Subway • Sweet Emotions Candy Commercial Tenants: 51 2012 Delivery
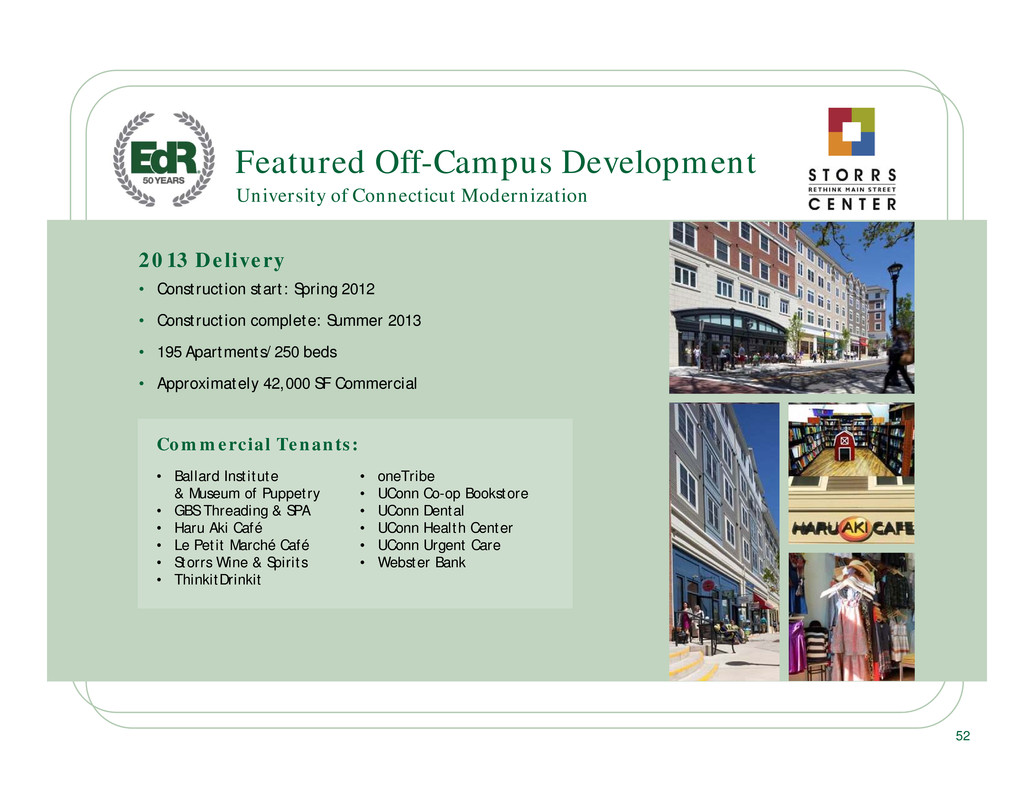
. . Featured Off-Campus Development • Construction start: Spring 2012 • Construction complete: Summer 2013 • 195 Apartments/250 beds • Approximately 42,000 SF Commercial University of Connecticut Modernization • Ballard Institute & Museum of Puppetry • GBS Threading & SPA • Haru Aki Café • Le Petit Marché Café • Storrs Wine & Spirits • ThinkitDrinkit • oneTribe • UConn Co-op Bookstore • UConn Dental • UConn Health Center • UConn Urgent Care • Webster Bank Commercial Tenants: 52 2013 Delivery
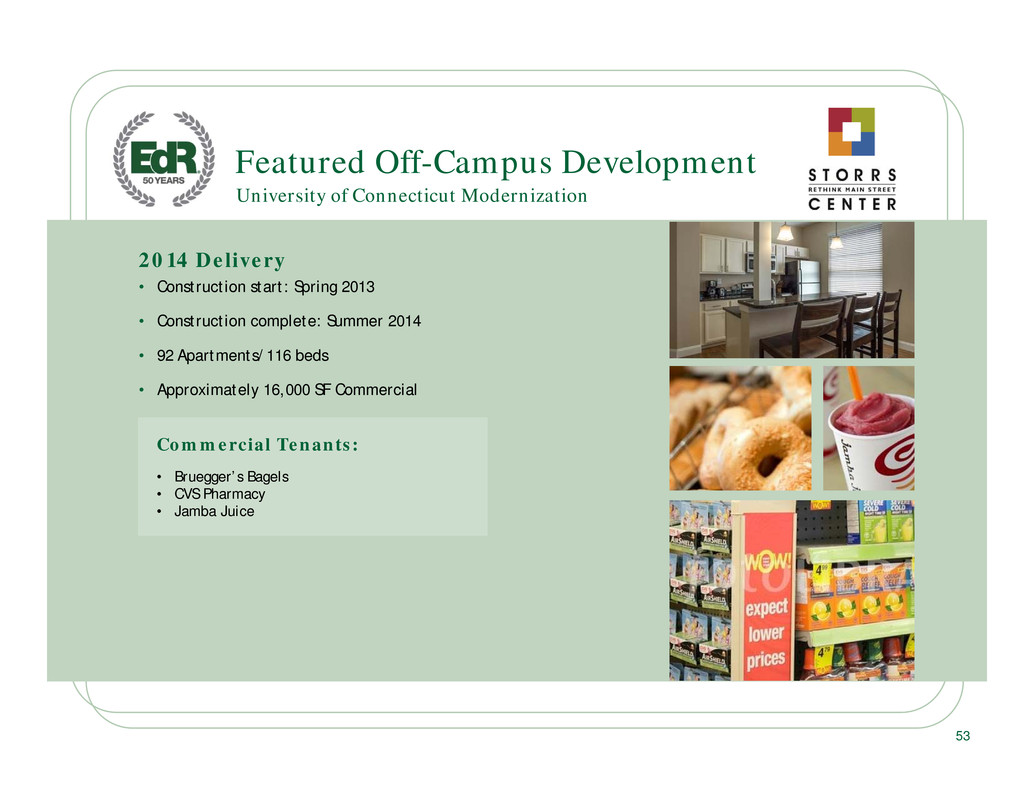
. . • Bruegger’s Bagels • CVS Pharmacy • Jamba Juice Featured Off-Campus Development • Construction start: Spring 2013 • Construction complete: Summer 2014 • 92 Apartments/116 beds • Approximately 16,000 SF Commercial University of Connecticut Modernization Commercial Tenants: 53 2014 Delivery
. . • Approximately 414 rental apartments/619 beds • Approximately 40 owner-occupied condominiums and townhomes (not owned by EdR) • More than 150,000 SF commercial (not owned by EdR) Featured Off-Campus Development University of Connecticut Modernization 54 Storrs Center by the Numbers
. . External Growth Priorities • Highly fragmented • REITs own less than 5% • Outdated housing stock • Consolidation and development opportunities aplenty 55 Student Housing Marketplace
. . External Growth Priorities • Deliver all developments on time and within budget • Strengthen the EdR portfolio by divesting of assets with less future upside to fund targeted higher yielding developments • Win and close on more ONE Plans – Full-time dedicated Senior Vice President, Julie Skolnicki – Pro-active relationship building • Create meaningful pipeline of off-campus developments, for 2016 and beyond – Wholly-owned – Joint-ventures • Monitor the acquisition market 56 External Growth Priorities

. . 57 Senior Vice President and Chief Operating Officer Chris Richards
. . SUPERIOR GROWTH Key Themes 58
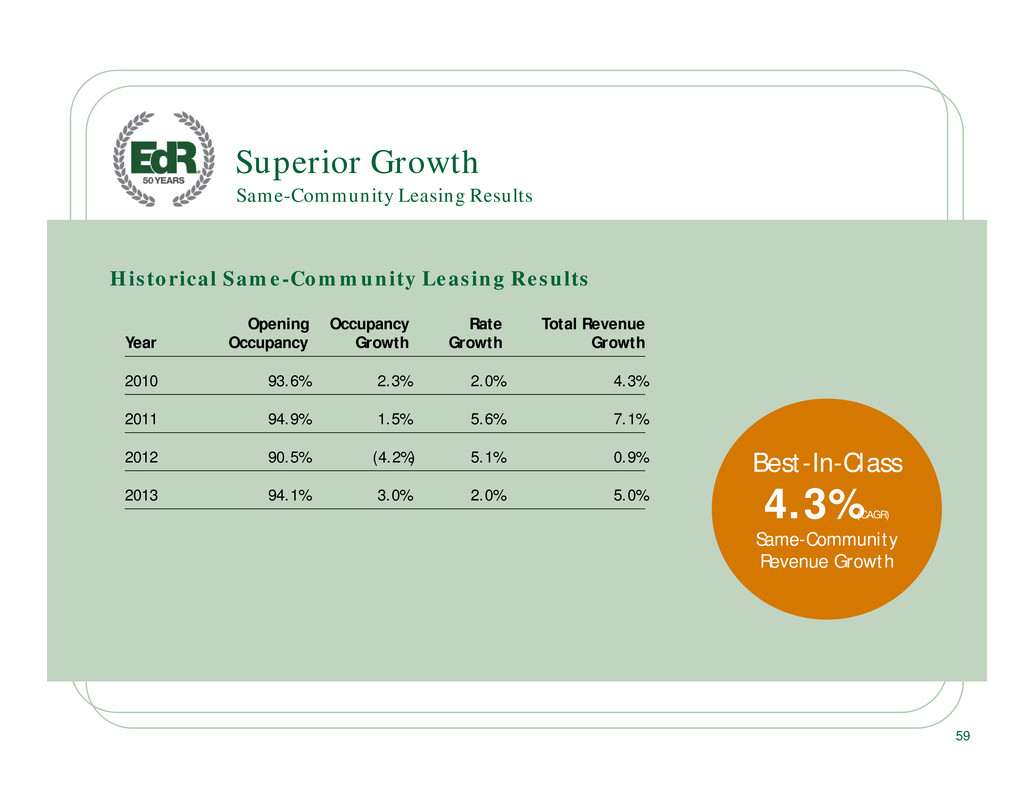
. . Superior Growth Year Opening Occupancy Occupancy Growth Rate Growth Total Revenue Growth 2010 93.6% 2.3% 2.0% 4.3% 2011 94.9% 1.5% 5.6% 7.1% 2012 90.5% (4.2%) 5.1% 0.9% 2013 94.1% 3.0% 2.0% 5.0% Same-Community Leasing Results Historical Same-Community Leasing Results 59 Best-In-Class 4.3%(CAGR) Same-Community Revenue Growth
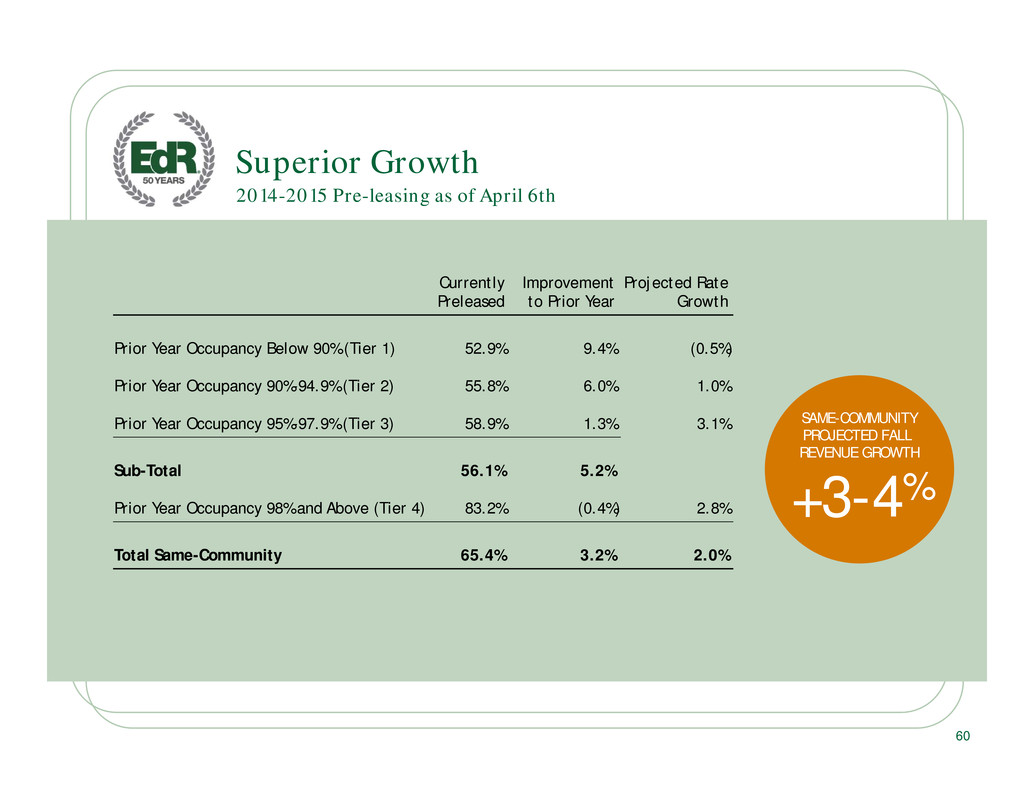
. . Currently Preleased Improvement to Prior Year Projected Rate Growth Prior Year Occupancy Below 90% (Tier 1) 52.9% 9.4% (0.5%) Prior Year Occupancy 90%-94.9% (Tier 2) 55.8% 6.0% 1.0% Prior Year Occupancy 95%-97.9% (Tier 3) 58.9% 1.3% 3.1% Sub-Total 56.1% 5.2% Prior Year Occupancy 98% and Above (Tier 4) 83.2% (0.4%) 2.8% Total Same-Community 65.4% 3.2% 2.0% 60 2014-2015 Pre-leasing as of April 6th Superior Growth SAME-COMMUNITY PROJECTED FALL REVENUE GROWTH +3-4%
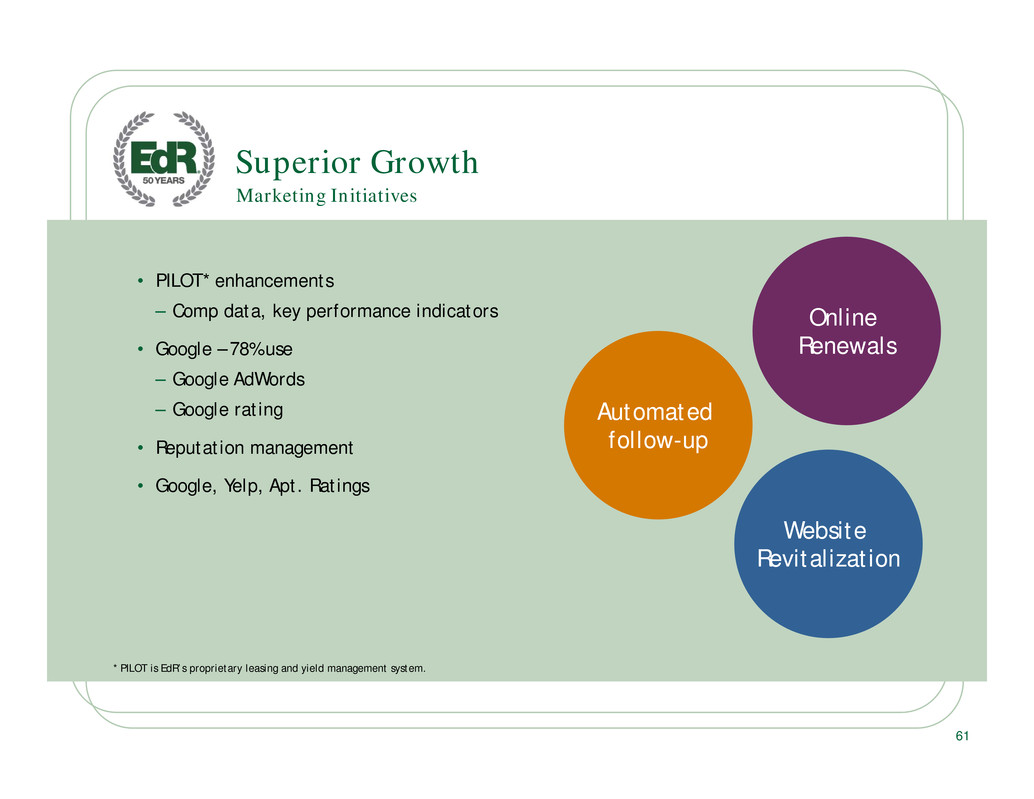
. . Superior Growth • PILOT* enhancements – Comp data, key performance indicators • Google – 78% use – Google AdWords – Google rating • Reputation management • Google, Yelp, Apt. Ratings Marketing Initiatives Automated follow-up Website Revitalization Online Renewals 61 * PILOT is EdR’s proprietary leasing and yield management system.

. . Superior Growth 2012 $123 2013 $169** 2014* $174 *projection **represents 6% of total operating expenses 62 Marketing Spend Per Bed

. . Marketing to our Target Audience Superior Growth 63
. . • Partnered with On-Site to design a student housing solution • Beta tested in 2013-14 • 100% roll-out to all properties for 2014-15 cycle • 2015-16 cycle will include early renewal online push • Application to Guarantor with no paper processing – 16% of all leases executed this season Superior Growth On-Site.com 64
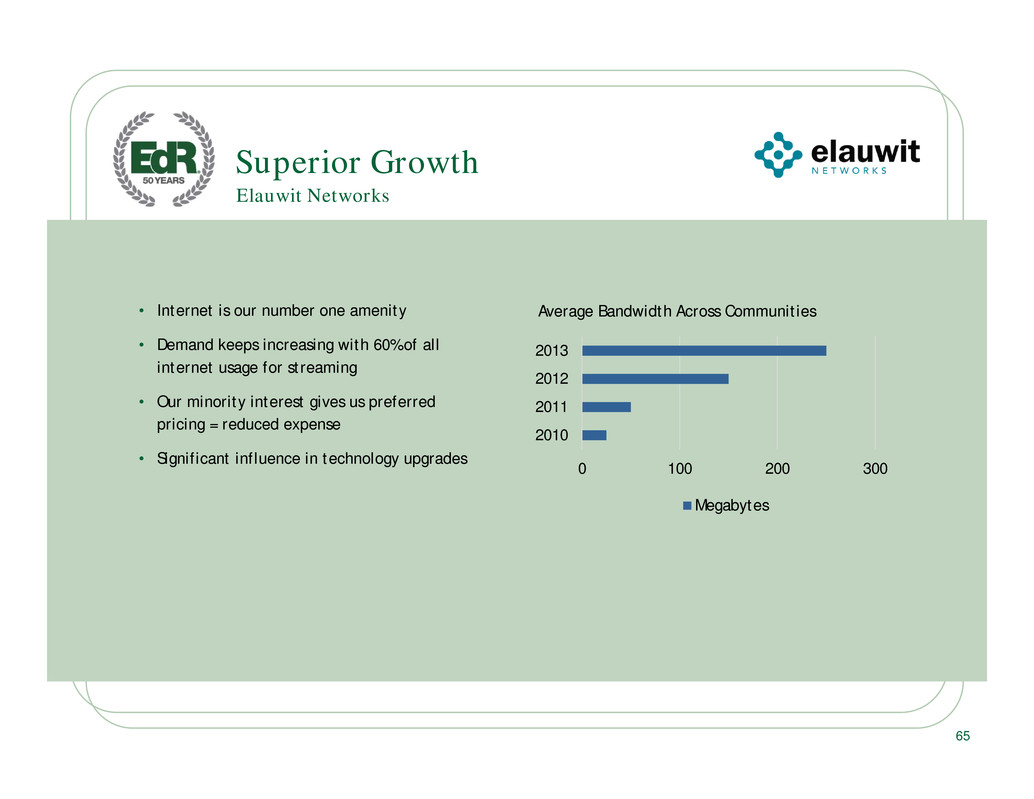
. . • Internet is our number one amenity • Demand keeps increasing with 60% of all internet usage for streaming • Our minority interest gives us preferred pricing = reduced expense • Significant influence in technology upgrades Superior Growth Elauwit Networks 0 100 200 300 2010 2011 2012 2013 Average Bandwidth Across Communities Megabytes 65
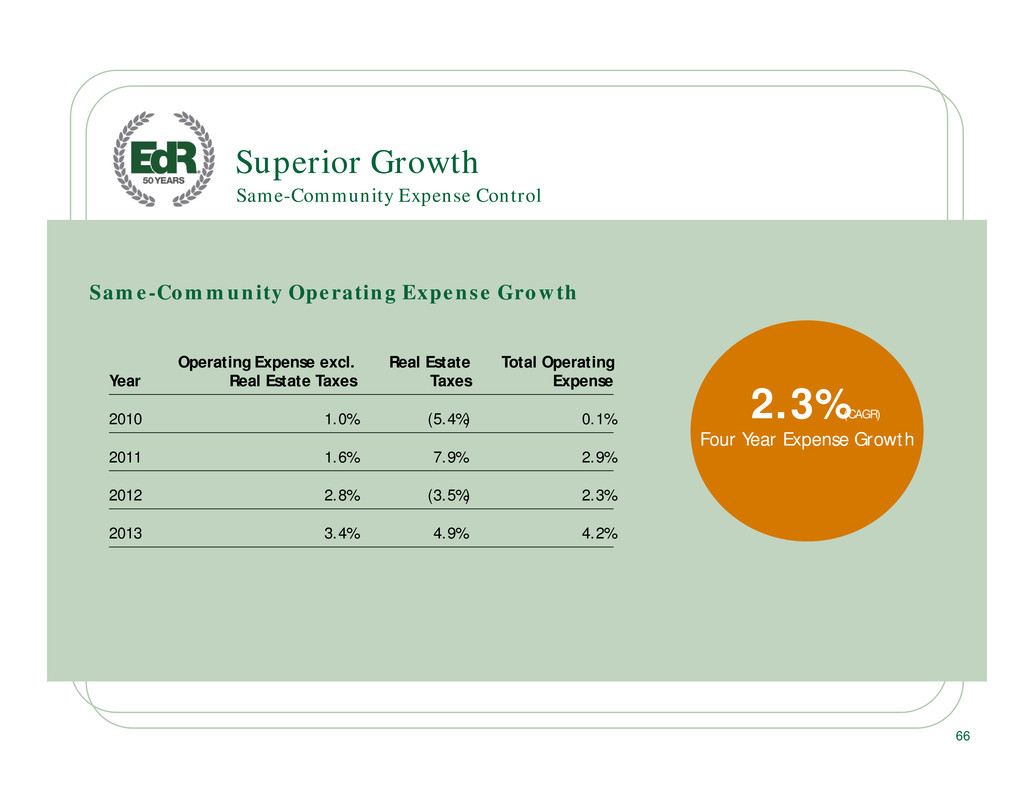
. . Superior Growth Year Operating Expense excl. Real Estate Taxes Real Estate Taxes Total Operating Expense 2010 1.0% (5.4%) 0.1% 2011 1.6% 7.9% 2.9% 2012 2.8% (3.5%) 2.3% 2013 3.4% 4.9% 4.2% Same-Community Expense Control Same-Community Operating Expense Growth 66 2.3%(CAGR) Four Year Expense Growth
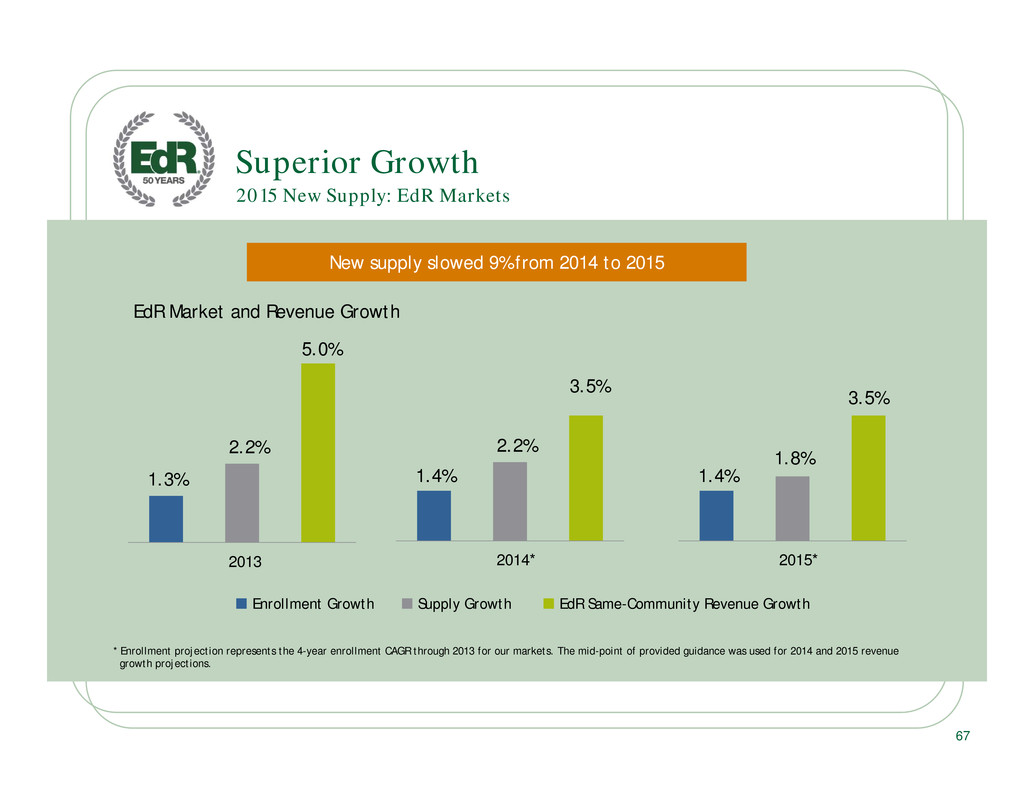
. . 2015 New Supply: EdR Markets Superior Growth * Enrollment projection represents the 4-year enrollment CAGR through 2013 for our markets. The mid-point of provided guidance was used for 2014 and 2015 revenue growth projections. 67 1.3% 2.2% 5.0% 2013 1.4% 2.2% 3.5% 2014* 1.4% 1.8% 3.5% 2015* EdR Market and Revenue Growth Enrollment Growth Supply Growth EdR Same-Community Revenue Growth New supply slowed 9% from 2014 to 2015
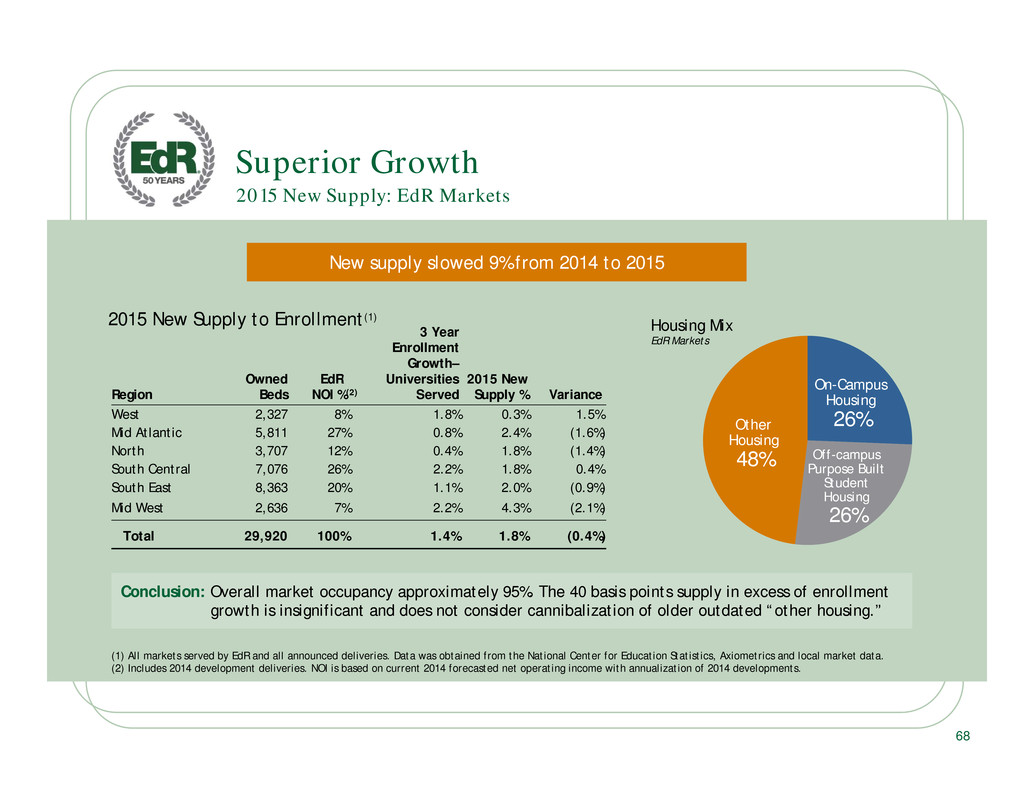
. . Region Owned Beds EdRfff NOI %(2) 3 Year Enrollment Growth– Universities Served 2015 New Supply % Variance West 2,327 8% 1.8% 0.3% 1.5% Mid Atlantic 5,811 27% 0.8% 2.4% (1.6%) North 3,707 12% 0.4% 1.8% (1.4%) South Central 7,076 26% 2.2% 1.8% 0.4% South East 8,363 20% 1.1% 2.0% (0.9%) Mid West 2,636 7% 2.2% 4.3% (2.1%) Total 29,920 100% 1.4% 1.8% (0.4%) 68 New supply slowed 9% from 2014 to 2015 Superior Growth 2015 New Supply: EdR Markets 2015 New Supply to Enrollment(1) Conclusion: Overall market occupancy approximately 95%. The 40 basis points supply in excess of enrollment growth is insignificant and does not consider cannibalization of older outdated “other housing.” (1) All markets served by EdR and all announced deliveries. Data was obtained from the National Center for Education Statistics, Axiometrics and local market data. (2) Includes 2014 development deliveries. NOI is based on current 2014 forecasted net operating income with annualization of 2014 developments. Other Housing 48% On-Campus Housing 26% Housing Mix EdR Markets Off-campus Purpose Built Student Housing 26%
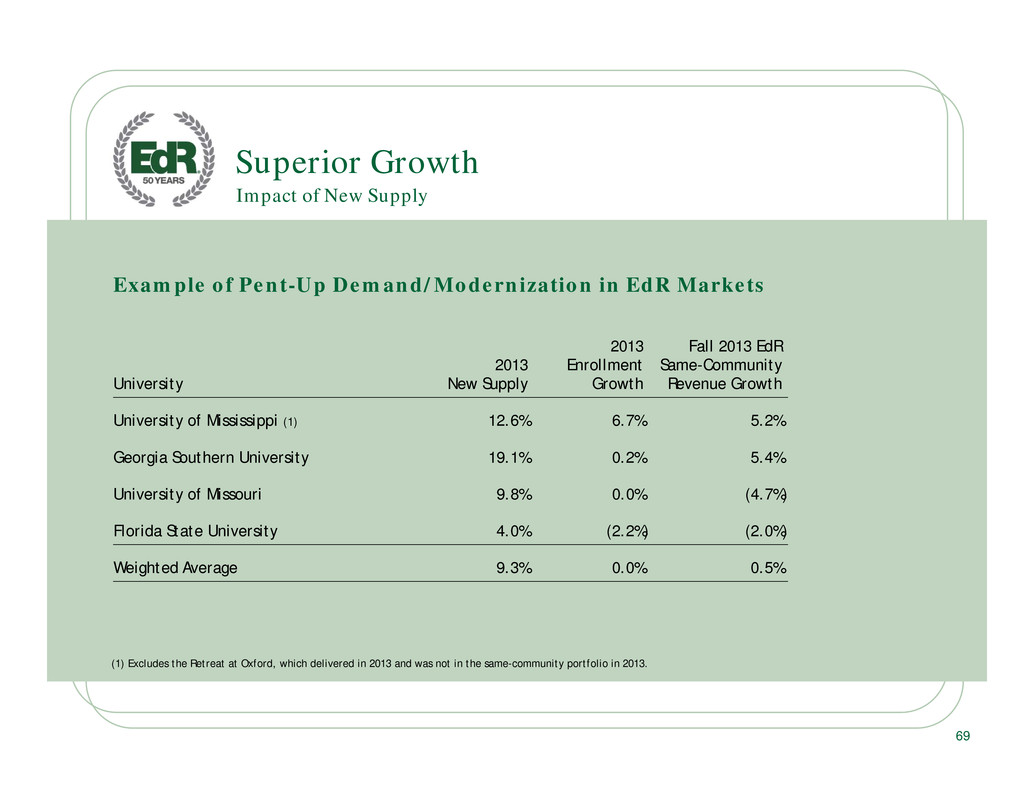
. . Impact of New Supply Superior Growth Example of Pent-Up Demand/Modernization in EdR Markets University 2013 New Supply 2013 Enrollment Growth Fall 2013 EdR Same-Community Revenue Growth University of Mississippi (1) 12.6% 6.7% 5.2% Georgia Southern University 19.1% 0.2% 5.4% University of Missouri 9.8% 0.0% (4.7%) Florida State University 4.0% (2.2%) (2.0%) Weighted Average 9.3% 0.0% 0.5% 69 (1) Excludes the Retreat at Oxford, which delivered in 2013 and was not in the same-community portfolio in 2013.

. . 70 Executive Vice President and Chief Financial Officer Randy Brown JOHNS HOPKINS MEDICAL INSTITUTE 929
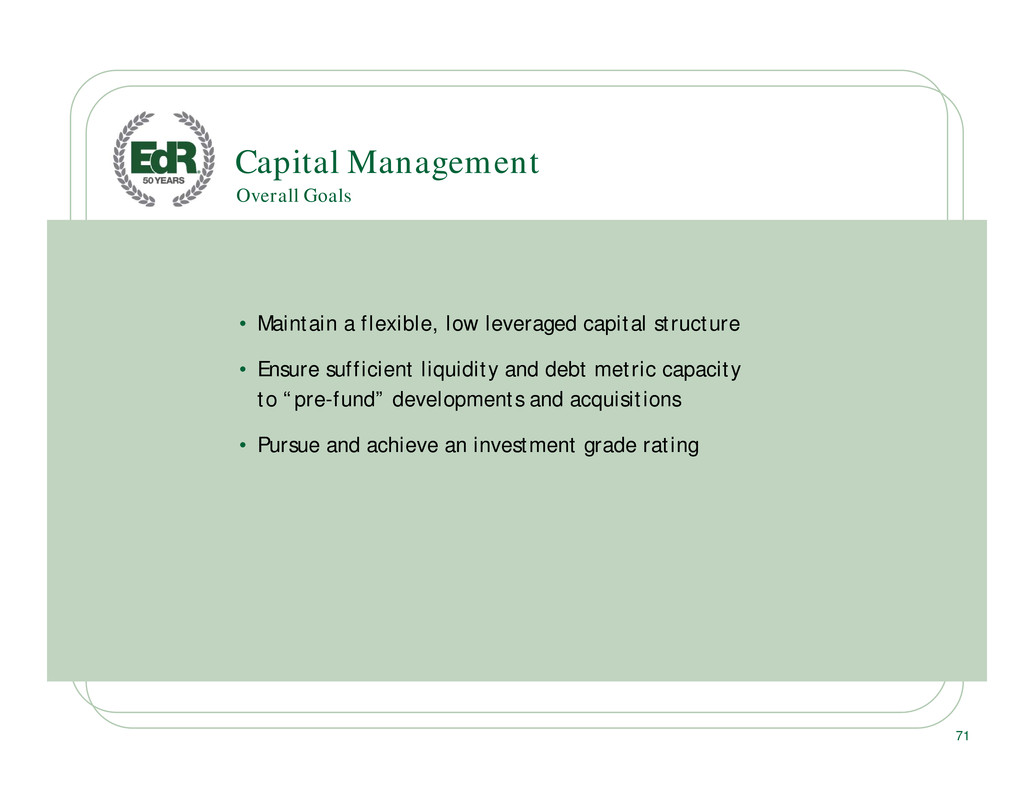
. . Capital Management • Maintain a flexible, low leveraged capital structure • Ensure sufficient liquidity and debt metric capacity to “pre-fund” developments and acquisitions • Pursue and achieve an investment grade rating Overall Goals 71
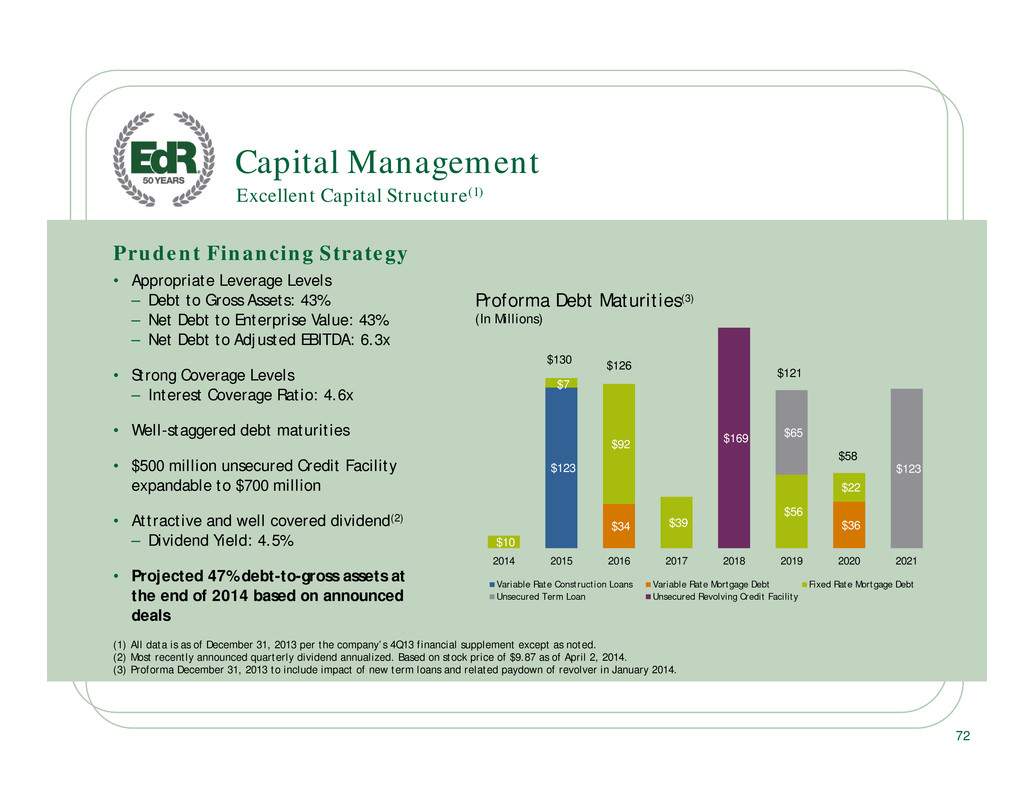
. . $123 $34 $36 $10 $7 $92 $39 $56 $22 $65 $123 $169 2014 2015 2016 2017 2018 2019 2020 2021 Variable Rate Construction Loans Variable Rate Mortgage Debt Fixed Rate Mortgage Debt Unsecured Term Loan Unsecured Revolving Credit Facility Proforma Debt Maturities(3) (In Millions) Capital Management (1) All data is as of December 31, 2013 per the company’s 4Q13 financial supplement except as noted. (2) Most recently announced quarterly dividend annualized. Based on stock price of $9.87 as of April 2, 2014. (3) Proforma December 31, 2013 to include impact of new term loans and related paydown of revolver in January 2014. Prudent Financing Strategy • Appropriate Leverage Levels – Debt to Gross Assets: 43% – Net Debt to Enterprise Value: 43% – Net Debt to Adjusted EBITDA: 6.3x • Strong Coverage Levels – Interest Coverage Ratio: 4.6x • Well-staggered debt maturities • $500 million unsecured Credit Facility expandable to $700 million • Attractive and well covered dividend(2) – Dividend Yield: 4.5% • Projected 47% debt-to-gross assets at the end of 2014 based on announced deals Excellent Capital Structure(1) 72 $130 $126 $121 $58
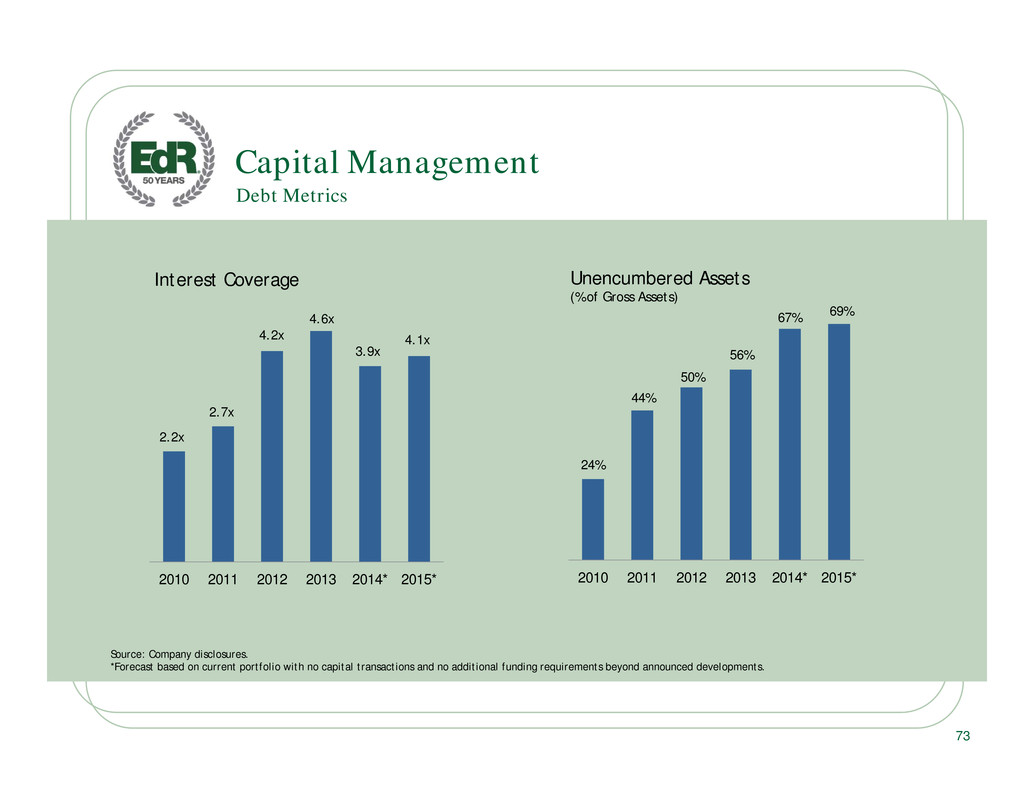
. . 24% 44% 50% 56% 67% 69% 2010 2011 2012 2013 2014* 2015* Unencumbered Assets (% of Gross Assets) 2010 2011 2012 2013 2014* 2015* Interest Coverage 2.2x 2.7x 4.2x 4.6x 3.9x 4.1x Source: Company disclosures. *Forecast based on current portfolio with no capital transactions and no additional funding requirements beyond announced developments. 73 Debt Metrics Capital Management
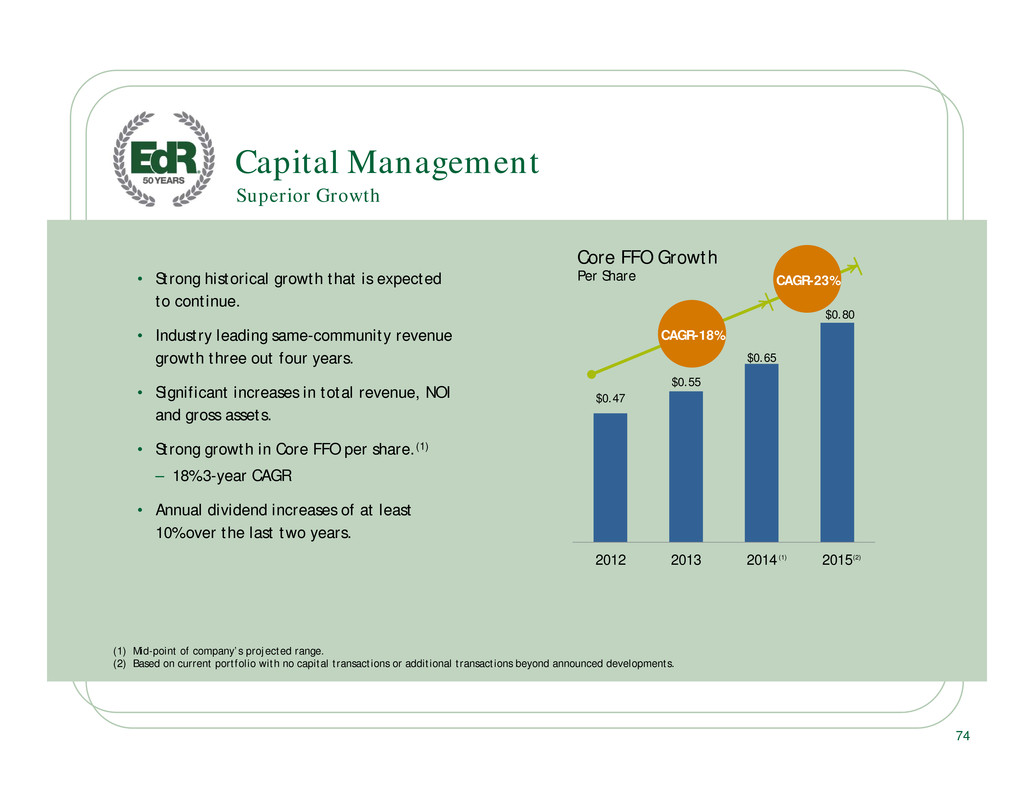
. . $0.47 $0.55 $0.65 $0.80 2012 2013 2014 2015 Core FFO Growth Per Share (1) (2) Capital Management • Strong historical growth that is expected to continue. • Industry leading same-community revenue growth three out four years. • Significant increases in total revenue, NOI and gross assets. • Strong growth in Core FFO per share.(1) – 18% 3-year CAGR • Annual dividend increases of at least 10% over the last two years. Superior Growth (1) Mid-point of company’s projected range. (2) Based on current portfolio with no capital transactions or additional transactions beyond announced developments. 74 CAGR-18% CAGR-23%
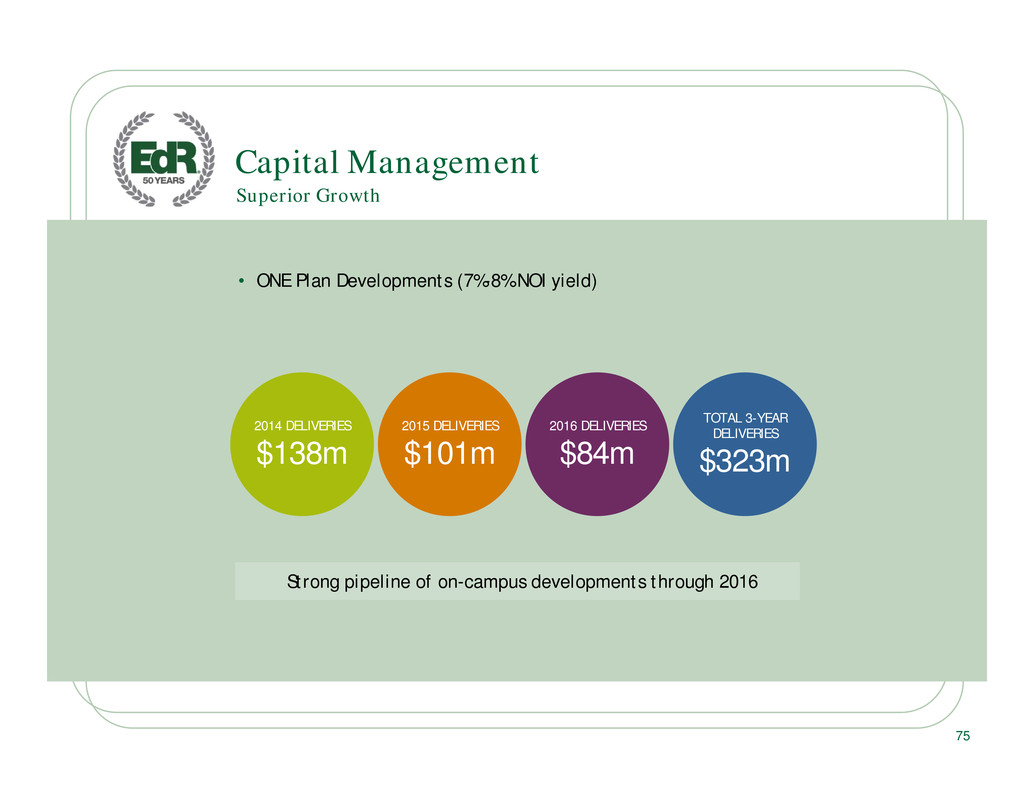
. . Capital Management • ONE Plan Developments (7%-8% NOI yield) 75 Superior Growth Strong pipeline of on-campus developments through 2016 2015 DELIVERIES $101m 2014 DELIVERIES $138m 2016 DELIVERIES $84m TOTAL 3-YEAR DELIVERIES $323m
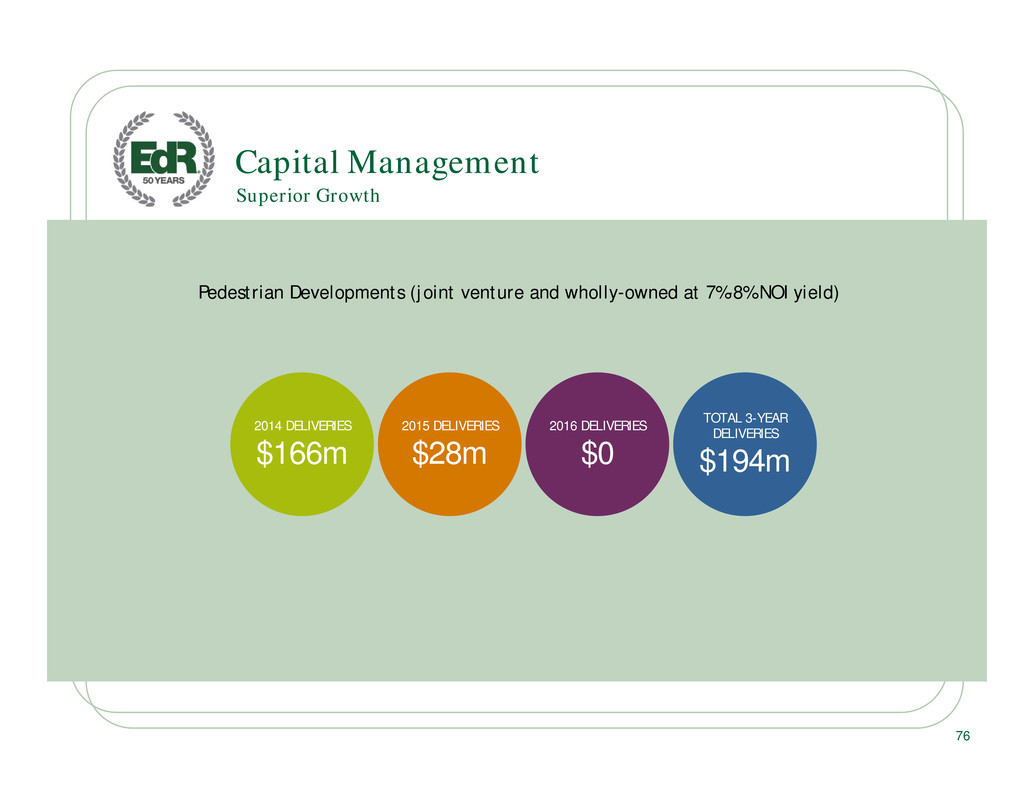
. . 2015 DELIVERIES $28m 2014 DELIVERIES $166m 2016 DELIVERIES $0 TOTAL 3-YEAR DELIVERIES $194m Capital Management Pedestrian Developments (joint venture and wholly-owned at 7%-8% NOI yield) 76 Superior Growth
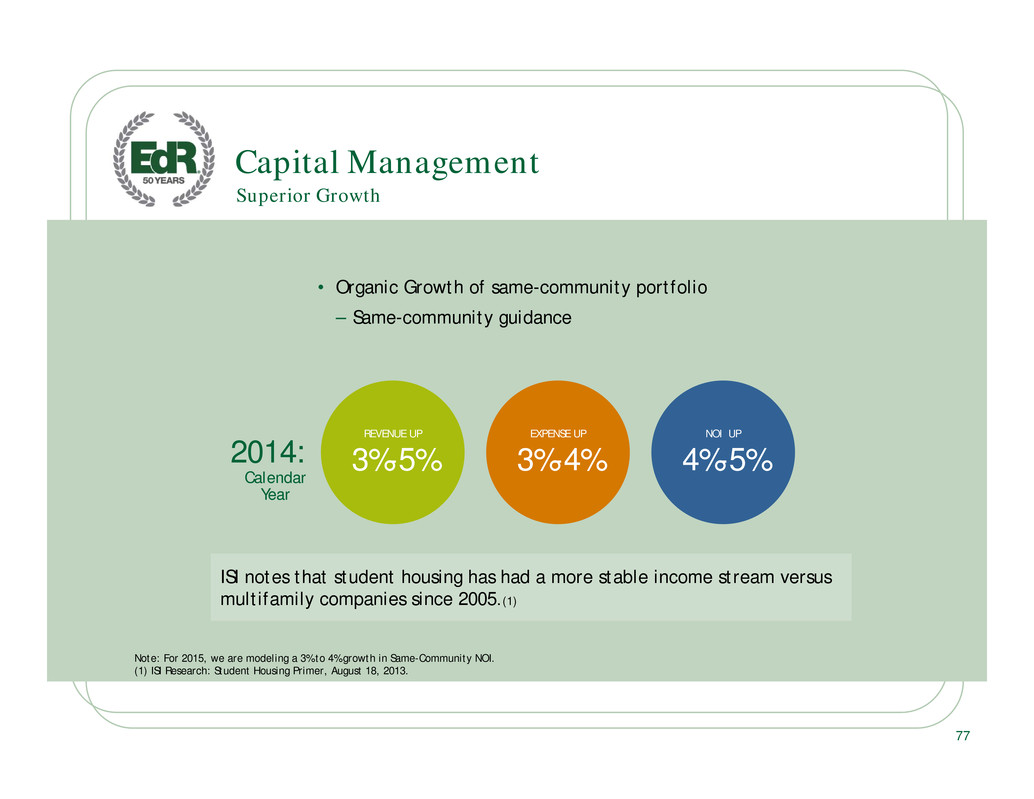
. . Capital Management • Organic Growth of same-community portfolio – Same-community guidance 77 Superior Growth EXPENSE UP 3%-4% REVENUE UP 3%-5% NOI UP 4%-5%2014: Calendar Year ISI notes that student housing has had a more stable income stream versus multifamily companies since 2005.(1) Note: For 2015, we are modeling a 3% to 4% growth in Same-Community NOI. (1) ISI Research: Student Housing Primer, August 18, 2013.

. . (1) Forecast based on current portfolio with no capital transactions or additional transactions other than funding announced developments (2) Assumes 116 million shares/units outstanding (3) FFO per share estimates includes the impact of SS NOI growth, G&A, interest expense, taxes, and other FFO-related items not shown. (4) 2014 based on mid-point of FFO guidance range Three Year Financial Forecast(1) Capital Management 78 2014 2015 2016 EdR Same-Community Portfolio: Annual Revenue Growth 3% - 5% 3% - 4% 3% - 4% Annual Expense Growth 3% - 4% 3% - 4% 3% - 4% Annual NOI Growth 4% - 5% 3% - 4% 3% - 4% Developments NOIs (7%-8% yields): Cost ($mm) Total 2014 Deliveries $304 $10 mm - $11 mm $22 mm - $25 mm $23 mm - $26 mm Total 2015 Deliveries 129 $4 mm - $5 mm $10 mm - $11 mm Total 2016 Deliveries 84 $2 mm - $3 mm Total Annual Development NOI $10 mm - $11 mm $26 mm - $30 mm $35 mm - $40 mm Annual Incremental NOI Contribution $16 mm - $19 mm $9 mm - $10 mm Annual Incremental NOI per share contribution(2) $0.14 - $0.17 $0.08 - $0.09 Estimated Core FFO per share(2,3) $0.62 - $0.68 $0.78 - $0.82 Estimated Annual Growth Rate 13% - 24% 20% - 25% Dividend 2014 3-Yr Range Annualized Dividend Rate / share $0.44 TBD Annualized Dividend Payout Ratio 67%(4) 60% - 70% Capital Structure Debt to Gross Assets 47% 47% - 49% Interest Coverage 3.9x 3.9x – 4.5x Debt to Stabilized EBITDA Ratio 7.2x 6.8x – 7.5x
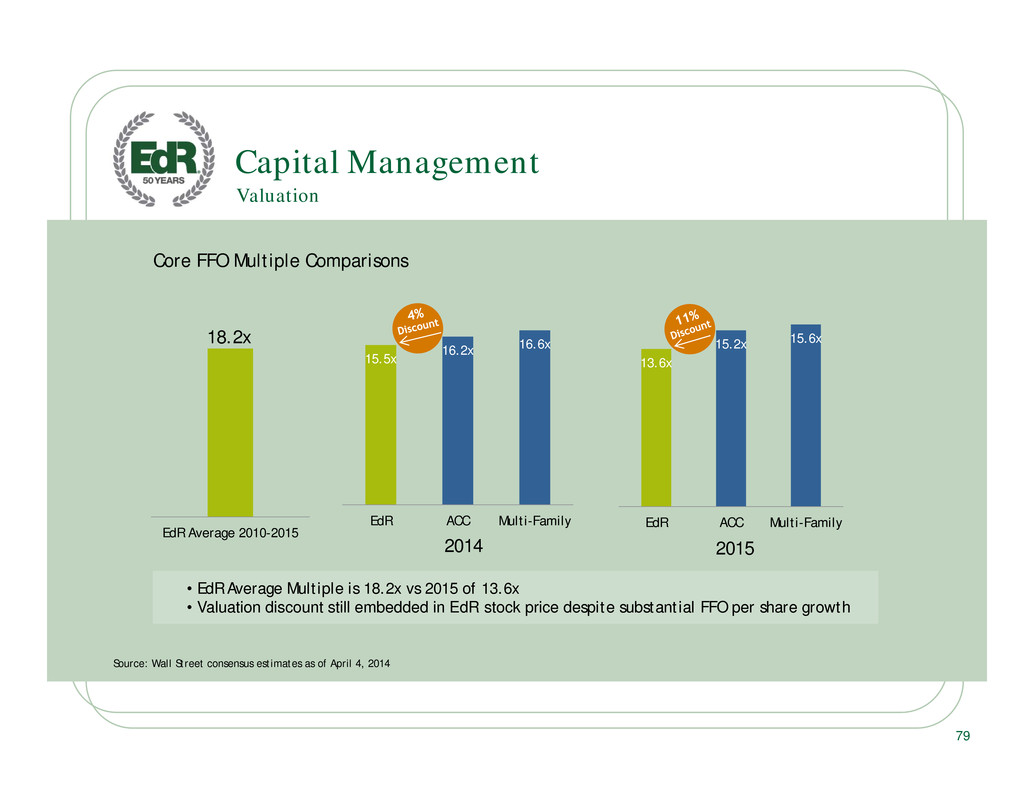
. . 79 Valuation Capital Management • EdR Average Multiple is 18.2x vs 2015 of 13.6x • Valuation discount still embedded in EdR stock price despite substantial FFO per share growth Source: Wall Street consensus estimates as of April 4, 2014 Core FFO Multiple Comparisons EdR Average 2010-2015 18.2x 15.5x 16.2x 16.6x EdR ACC Multi-Family 2014 13.6x 15.2x 15.6x EdR ACC Multi-Family 2015
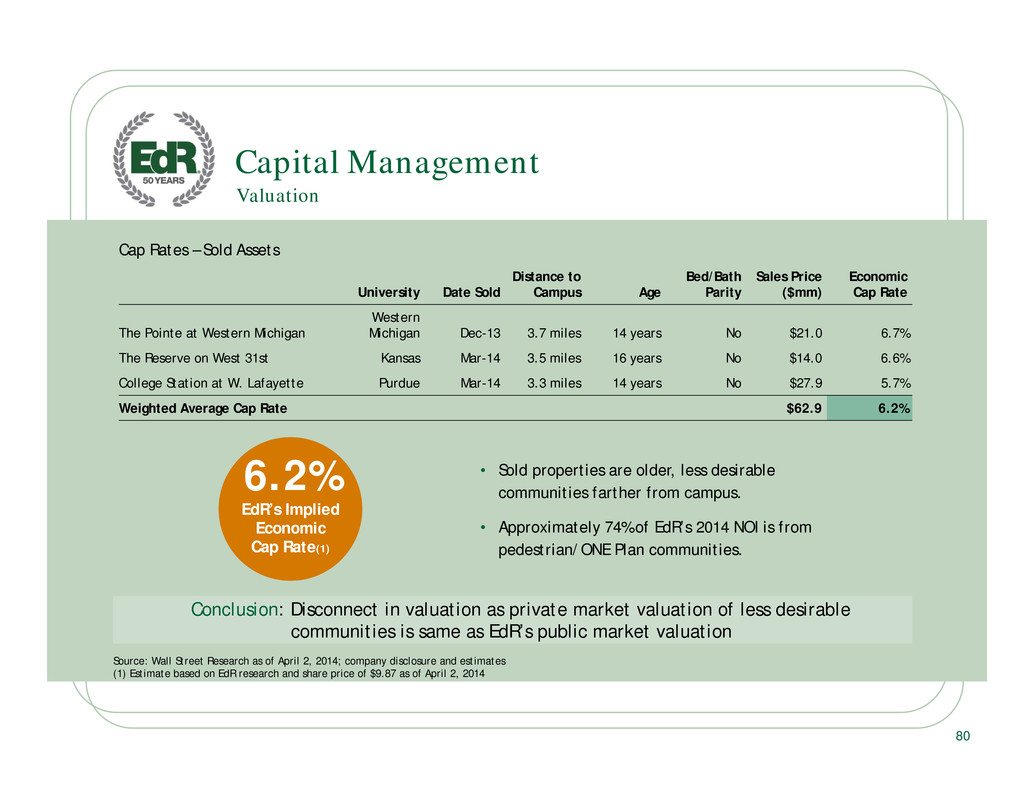
. . Valuation Capital Management • Sold properties are older, less desirable communities farther from campus. • Approximately 74% of EdR’s 2014 NOI is from pedestrian/ONE Plan communities. Conclusion: Disconnect in valuation as private market valuation of less desirable communities is same as EdR’s public market valuation Source: Wall Street Research as of April 2, 2014; company disclosure and estimates (1) Estimate based on EdR research and share price of $9.87 as of April 2, 2014 Cap Rates – Sold Assets University Date Sold Distance to Campus Age Bed/Bath Parity Sales Price ($mm) Economic Cap Rate The Pointe at Western Michigan Western Michigan Dec-13 3.7 miles 14 years No $21.0 6.7% The Reserve on West 31st Kansas Mar-14 3.5 miles 16 years No $14.0 6.6% College Station at W. Lafayette Purdue Mar-14 3.3 miles 14 years No $27.9 5.7% Weighted Average Cap Rate $62.9 6.2% 80 6.2% EdR’s Implied Economic Cap Rate(1)
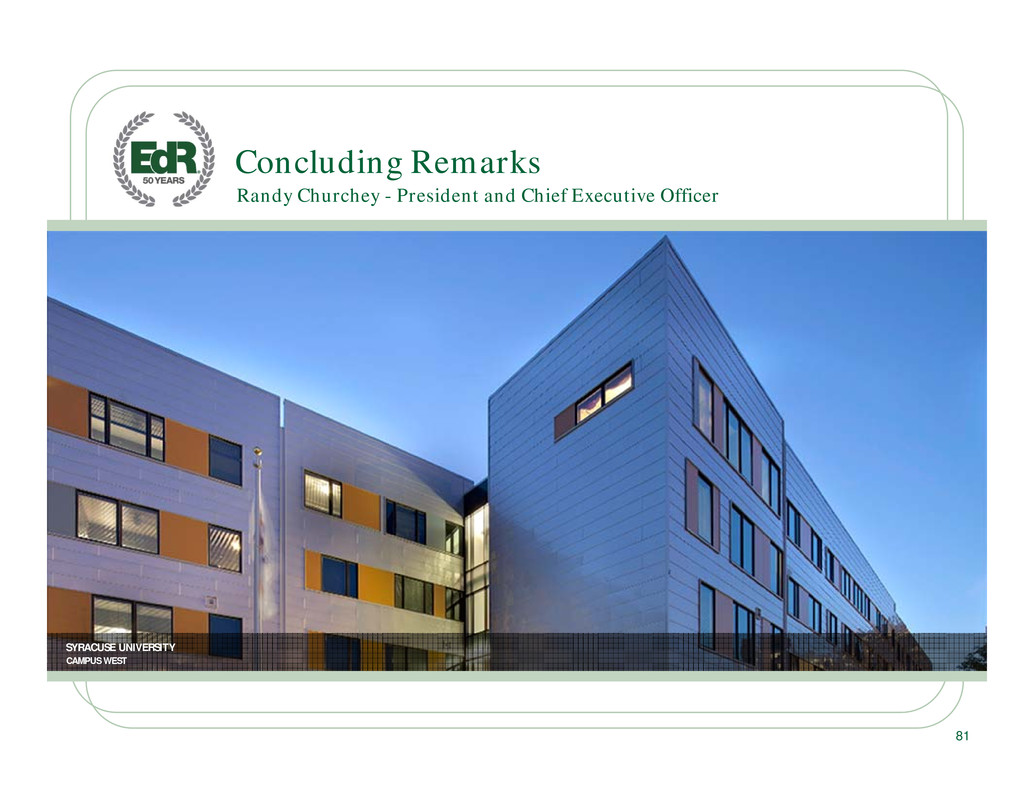
. . 81 Randy Churchey - President and Chief Executive Officer Concluding Remarks SYRACUSE UNIVERSITY CAMPUS WEST
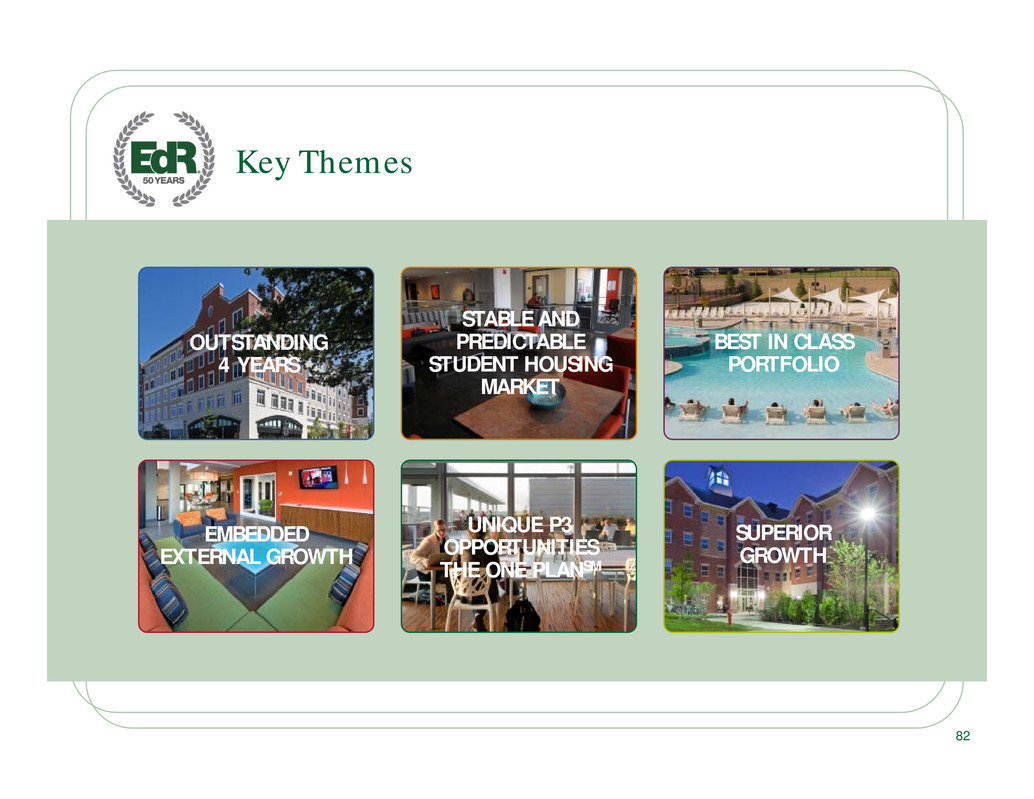
. . EMBEDDED EXTERNAL GROWTH OUTSTANDING 4 YEARS STABLE AND PREDICTABLE STUDENT HOUSING MARKET BEST IN CLASS PORTFOLIO SUPERIOR GROWTH UNIQUE P3 OPPORTUNITIES THE ONE PLANSM Key Themes 82
. . Safe Harbor Statement Statements about the Company’s business that are not historical facts are “forward-looking statements,” which relate to expectations, beliefs, projections, future plans and strategies, anticipated events or trends, and similar expressions. In some cases, you can identify forward-looking statements by the use of forward-looking terminology such as “may,” “will,” “should,” “expects,” “intends,” “plans,” “anticipates,” “believes,” “estimates,” “predicts,” “potential,” or the negative of these words and phrases or similar words or phrases which are predictions of or indicate future events or trends and which do not relate solely to historical matters. Forward-looking statements are based on current expectations. You should not rely on our forward-looking statements because the matters that they describe are subject to known and unknown risks and uncertainties that could cause the Company’s business, financial condition, liquidity, results of operations, Core FFO, FFO and prospects to differ materially from those expressed or implied by such statements. Such risks are set forth under the captions “Risk Factors,” “Forward-Looking Statements” and “Management’s Discussion and Analysis of Financial Condition and Results of Operations” (or similar captions) in our most recent Annual Report on Form 10-K and our quarterly reports on Form 10-Q, and as described in our other filings with the Securities and Exchange Commission. Forward-looking statements speak only as of the date on which they are made, and, except as otherwise may be required by law, the Company undertakes no obligation to update publicly or revise any guidance or other forward-looking statement, whether as a result of new information, future developments, or otherwise, except as required by law. Under the Private Securities Litigation Reform Act of 1995 83
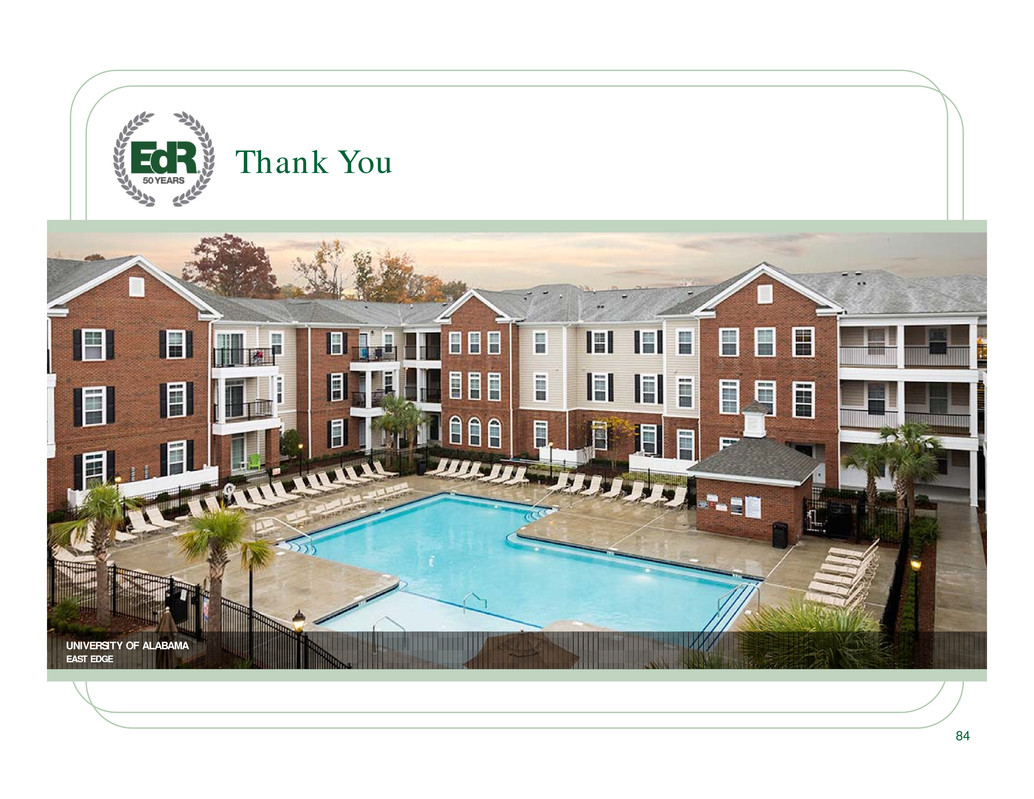
. . 84 Thank You UNIVERSITY OF ALABAMA EAST EDGE


