|
| | | | | | | | | | | | | | | | | | | | | | | | | | |
| (Amounts in thousands, except per share data, unaudited) | | | | | | | | | |
| | | | | | | | | | |
| OPERATING DATA: | | | | | | | | | | | |
| | | Three months ended December 31, | | Year ended December 31, |
| | | 2015 | 2014 | | $ Chg | % Chg | | 2015 | 2014 | | $ Chg | % Chg |
| | | | | | | | | | | | | |
| | Same-community revenue | $ | 49,895 |
| $ | 48,192 |
| | $ | 1,703 |
| 3.5 | % | | $ | 183,375 |
| $ | 173,948 |
| | $ | 9,427 |
| 5.4 | % |
| | Total community revenue | 71,781 |
| 61,645 |
| | 10,136 |
| 16.4 | % | | 240,623 |
| 206,322 |
| | 34,301 |
| 16.6 | % |
| | Total revenue | 75,520 |
| 66,504 |
| | 9,016 |
| 13.6 | % | | 255,162 |
| 225,793 |
| | 29,369 |
| 13.0 | % |
| | | | | | | | | | | | | |
| | Same-community net operating income | 30,492 |
| 29,655 |
| | 837 |
| 2.8 | % | | 102,786 |
| 97,162 |
| | 5,624 |
| 5.8 | % |
| | Total community net operating income | 45,950 |
| 39,059 |
| | 6,891 |
| 17.6 | % | | 139,340 |
| 113,673 |
| | 25,667 |
| 22.6 | % |
| | Total operating income | 19,857 |
| 17,514 |
| | 2,343 |
| 13.4 | % | | 45,055 |
| 23,940 |
| | 21,115 |
| 88.2 | % |
| | | | | | | | | | | | | |
| | Net income attributable to EdR | 14,773 |
| 22,397 |
| | (7,624 | ) | (34.0 | )% | | 19,911 |
| 47,055 |
| | (27,144 | ) | (57.7 | )% |
| | Per share - basic | $ | 0.28 |
| $ | 0.47 |
| | $ | (0.19 | ) | (40.4 | )% | | $ | 0.40 |
| $ | 1.10 |
| | $ | (0.70 | ) | (63.6 | )% |
| | Per share - diluted | 0.27 |
| 0.47 |
| | (0.20 | ) | (42.6 | )% | | 0.40 |
| 1.09 |
| | (0.69 | ) | (63.3 | )% |
| | | | | | | | | | | | | |
| | Funds from operations (FFO) | 31,074 |
| 25,025 |
| | 6,049 |
| 24.2 | % | | 86,079 |
| 77,718 |
| | 8,361 |
| 10.8 | % |
| | Per weighted average share/unit (1) | $ | 0.58 |
| $ | 0.52 |
| | $ | 0.06 |
| 11.5 | % | | $ | 1.72 |
| $ | 1.80 |
| | $ | (0.08 | ) | (4.4 | )% |
| | | | | | | | | | | | | |
| | Core funds from operations (Core FFO) | 32,664 |
| 28,878 |
| | 3,786 |
| 13.1 | % | | 91,557 |
| 80,339 |
| | 11,218 |
| 14.0 | % |
| | Per weighted average share/unit (1) | $ | 0.61 |
| $ | 0.60 |
| | $ | 0.01 |
| 1.7 | % | | $ | 1.83 |
| $ | 1.86 |
| | $ | (0.03 | ) | (1.6 | )% |
| | | | | | | | | | | | | |
| FINANCIAL RATIOS: | | | | | | |
| | | 12/31/2015 | | 12/31/2014 | | | | | | |
| | Debt to gross assets | 28.3% | | 35.1% | | | | | | |
| | Net debt to enterprise value | 22.0% | | 28.1% | | | | | | |
| | Interest coverage ratio (TTM) | 4.8x | | 5.0x | | | | | | |
| | Net debt to EBITDA - Adjusted (TTM) | 4.0x | | 4.9x | | | | | | |
| | | | | | | | | | | | | |
(1) FFO and Core FFO per share/unit were computed using weighted average shares and units outstanding, regardless of their dilutive impact. See page 5 for a detailed calculation. |
|
| | | | | | | | | | |
| (Amount in thousands, except share and per share data, unaudited) | | | | | |
| | | December 31, 2015 | | December 31, 2014 | |
| Assets | | | | | |
| | Collegiate housing properties, net (1) | | $ | 1,774,796 |
| | $ | 1,586,009 |
| |
| | Assets under development | | 117,384 |
| | 120,702 |
| |
| | Cash and cash equivalents | | 33,742 |
| | 18,385 |
| |
| | Restricted cash | | 9,784 |
| | 10,342 |
| |
| | Other assets | | 66,125 |
| | 70,892 |
| |
| Total assets | | $ | 2,001,831 |
| | $ | 1,806,330 |
| |
| | | | | | |
| Liabilities and equity | | | | | |
| Liabilities: | | | | | |
| | Mortgage and construction loans, net of unamortized premium and deferred financing costs | | $ | 204,511 |
| | $ | 248,128 |
| |
| | Unsecured revolving credit facility | | — |
| | 24,000 |
| |
| | Unsecured term loan, net of unamortized deferred financing costs | | 186,518 |
| | 186,277 |
| |
| | Unsecured Senior Notes, net of unamortized deferred financing costs | | 247,678 |
| | 247,425 |
| |
| | Accounts payable and accrued expenses | | 85,670 |
| | 76,869 |
| |
| | Deferred revenue | | 19,024 |
| | 17,301 |
| |
| Total liabilities | | 743,401 |
| | 800,000 |
| |
| | | | | | | |
| Commitments and contingencies | | — |
| | — |
| |
| | | | | | | |
| Redeemable noncontrolling interests | | 13,560 |
| | 14,512 |
| |
| | | | | | | |
| Equity: | | | | | |
| EdR stockholders' equity: | | | | | |
| | Common stock, $0.01 par value per share, 200,000,000 shares authorized, 56,879,003 and 47,999,427 shares issued and outstanding as of December 31, 2015 and 2014, respectively | | 569 |
| | 480 |
| |
| | Preferred stock, $0.01 par value per share, 50,000,000 shares authorized, no shares issued and outstanding | | — |
| | — |
| |
| | Additional paid-in capital | | 1,263,603 |
| | 1,034,683 |
| |
| | Accumulated deficit | | (21,998 | ) | | (41,909 | ) | |
| | Accumulated other comprehensive loss | | (5,475 | ) | | (4,465 | ) | |
| Total EdR stockholders' equity | | 1,236,699 |
| | 988,789 |
| |
| Noncontrolling interest | | 8,171 |
| | 3,029 |
| |
| Total equity | | 1,244,870 |
| | 991,818 |
| |
| | | | | | | |
| Total liabilities and equity | | $ | 2,001,831 |
| | $ | 1,806,330 |
| |
| | | | | | | |
(1) Amount is net of accumulated depreciation of $270,993 and $210,047, as of December 31, 2015 and 2014, respectively.
|
| | | | | | | | | | | | | | | | | | | | | | | |
| (Amounts in thousands, except per share data, unaudited) | | | | | | |
| | Three months ended December 31, | | Year ended December 31, |
| | 2015 | | 2014 | | $ Change | | 2015 | | 2014 | | $ Change |
| Revenues: | | | | | | | | | | | |
| Collegiate housing leasing revenue | $ | 71,781 |
| | $ | 61,645 |
| | $ | 10,136 |
| | $ | 240,623 |
| | $ | 206,322 |
| | $ | 34,301 |
|
| Third-party development consulting services | 702 |
| | 1,541 |
| | (839 | ) | | 2,233 |
| | 6,805 |
| | (4,572 | ) |
| Third-party management services | 972 |
| | 1,103 |
| | (131 | ) | | 3,670 |
| | 3,959 |
| | (289 | ) |
| Operating expense reimbursements | 2,065 |
| | 2,215 |
| | (150 | ) | | 8,636 |
| | 8,707 |
| | (71 | ) |
| Total revenues | 75,520 |
| | 66,504 |
| | 9,016 |
| | 255,162 |
| | 225,793 |
| | 29,369 |
|
| Operating expenses: | | | | | | | | | | |
|
|
| Collegiate housing leasing operations | 25,831 |
| | 22,586 |
| | 3,245 |
| | 101,283 |
| | 92,649 |
| | 8,634 |
|
| Development and management services | 3,218 |
| | 2,725 |
| | 493 |
| | 11,446 |
| | 9,685 |
| | 1,761 |
|
| General and administrative | 2,773 |
| | 2,593 |
| | 180 |
| | 9,000 |
| | 8,745 |
| | 255 |
|
| Development pursuit, acquisition costs and severance | 47 |
| | — |
| | 47 |
| | 452 |
| | 1,372 |
| | (920 | ) |
| Depreciation and amortization | 18,417 |
| | 16,045 |
| | 2,372 |
| | 68,022 |
| | 58,974 |
| | 9,048 |
|
| Ground lease expense | 3,312 |
| | 2,826 |
| | 486 |
| | 11,268 |
| | 8,988 |
| | 2,280 |
|
| Loss on impairment of collegiate housing properties | — |
| | — |
| | — |
| | — |
| | 12,733 |
| | (12,733 | ) |
| Reimbursable operating expenses | 2,065 |
| | 2,215 |
| | (150 | ) | | 8,636 |
| | 8,707 |
| | (71 | ) |
| Total operating expenses | 55,663 |
| | 48,990 |
| | 6,673 |
| | 210,107 |
| | 201,853 |
| | 8,254 |
|
| | | | | | | | | | | |
|
|
| Operating income | 19,857 |
| | 17,514 |
| | 2,343 |
| | 45,055 |
| | 23,940 |
| | 21,115 |
|
| | | | | | | | | | | |
|
|
| Nonoperating (income) expenses: | | | | | | | | | | |
|
|
| Interest expense | 6,834 |
| | 5,580 |
| | 1,254 |
| | 24,449 |
| | 20,656 |
| | 3,793 |
|
| Amortization of deferred financing costs | 562 |
| | 623 |
| | (61 | ) | | 2,089 |
| | 2,156 |
| | (67 | ) |
| Interest income | (69 | ) | | (38 | ) | | (31 | ) | | (213 | ) | | (190 | ) | | (23 | ) |
| Guarantee fee income from participating development | — |
| | — |
| | — |
| | — |
| | (3,000 | ) | | 3,000 |
|
| Interest on loan to participating development | — |
| | — |
| | — |
| | — |
| | (6,486 | ) | | 6,486 |
|
| Gain on insurance settlement | — |
| | — |
| | — |
| | — |
| | (8,133 | ) | | 8,133 |
|
| Loss on extinguishment of debt | 403 |
| | 2,651 |
| | (2,248 | ) | | 403 |
| | 3,543 |
| | (3,140 | ) |
| Total nonoperating expenses | 7,730 |
| | 8,816 |
| | (1,086 | ) | | 26,728 |
| | 8,546 |
| | 18,182 |
|
| Income before equity in earnings (losses) of unconsolidated entities, income taxes and gain on sale of collegiate housing communities | 12,127 |
| | 8,698 |
| | 3,429 |
| | 18,327 |
| | 15,394 |
| | 2,933 |
|
| Equity in earnings (losses) of unconsolidated entities | 155 |
| | (340 | ) | | 495 |
| | (668 | ) | | (710 | ) | | 42 |
|
| Income before income taxes and gain on sale of collegiate housing properties | 12,282 |
| | 8,358 |
| | 3,924 |
| | 17,659 |
| | 14,684 |
| | 2,975 |
|
| Income tax expense (benefit) | 22 |
| | (337 | ) | | 359 |
| | 347 |
| | 261 |
| | 86 |
|
| Income before gain on sale of collegiate housing properties | 12,260 |
| | 8,695 |
| | 3,565 |
| | 17,312 |
| | 14,423 |
| | 2,889 |
|
| Gain on sale of collegiate housing properties | 2,770 |
| | 13,908 |
| | (11,138 | ) | | 2,770 |
| | 33,231 |
| | (30,461 | ) |
| Net income | 15,030 |
| | 22,603 |
| | (7,573 | ) | | 20,082 |
| | 47,654 |
| | (27,572 | ) |
| Less: Net income attributable to the noncontrolling interests | 257 |
| | 206 |
| | 51 |
| | 171 |
| | 599 |
| | (428 | ) |
| Net income attributable to Education Realty Trust, Inc. | $ | 14,773 |
| | $ | 22,397 |
| | $ | (7,624 | ) | | $ | 19,911 |
| | $ | 47,055 |
| | $ | (27,144 | ) |
| | | | | | | | | | | |
|
|
| | | | | | | | | | | | |
| | | | | | | | | | | | |
| | | | | | | | | | | | |
|
| | | | | | | | | | | | | | | | | | | | | | | |
| (Amounts in thousands, except per share data, unaudited) | | | | | | |
| | Three months ended December 31, | | Year ended December 31, |
| | 2015 | | 2014 | | $ Change | | 2015 | | 2014 | | $ Change |
| Other comprehensive income (loss): | | | | | | | | | | | |
| Gain (loss) on cash flow hedging derivatives | 2,419 |
| | (2,051 | ) | | 4,470 |
| | (1,010 | ) | | (4,465 | ) | | 3,455 |
|
| Comprehensive income | $ | 17,192 |
| | $ | 20,346 |
| | $ | (3,154 | ) | | $ | 18,901 |
| | $ | 42,590 |
| | $ | (23,689 | ) |
| | | | | | | | | | | | |
| Earnings per share information: | | | | | | | | | | |
|
|
| Net income attributable to Education Realty Trust, Inc. common stockholders per share – basic | $ | 0.28 |
| | $ | 0.47 |
| | $ | (0.19 | ) | | $ | 0.40 |
| | $ | 1.10 |
| | $ | (0.70 | ) |
| Net income attributable to Education Realty Trust, Inc. common stockholders per share – diluted | $ | 0.27 |
| | $ | 0.47 |
| | $ | (0.20 | ) | | $ | 0.40 |
| | $ | 1.09 |
| | $ | (0.69 | ) |
| | | | | | | | | | | | |
| Weighted average shares of common stock outstanding – basic | 53,486 |
| | 47,658 |
| | | | 49,676 |
| | 42,934 |
| | |
Weighted average shares of common stock outstanding – diluted (1) | 53,788 |
| | 48,002 |
| | | | 49,991 |
| | 43,277 |
| | |
| | | | | | | | | | | | |
| | | | | | | | | | | | |
(1) Weighted average shares of common stock outstanding - diluted assumes the conversion of outstanding redeemable Operating Partnership Units and University Towers Operating Units. |
|
| | | | | | | | | | | | | | | | | | | | | | | | |
| (Amounts in thousands, except per share data, unaudited) | Three months ended December 31, | | Year ended December 31, |
| | | 2015 | | 2014 | | $ Change | | 2015 | | 2014 | | $ Change |
| Net income attributable to EdR | $ | 14,773 |
| | $ | 22,397 |
| | $ | (7,624 | ) | | $ | 19,911 |
| | $ | 47,055 |
| | $ | (27,144 | ) |
| | Gain on sale of collegiate housing assets | (2,770 | ) | | (13,908 | ) | | 11,138 |
| | (2,770 | ) | | (33,231 | ) | | 30,461 |
|
| | Gain on insurance settlement (1) | — |
| | — |
| | — |
| | — |
| | (8,133 | ) | | 8,133 |
|
| | Impairment losses | — |
| | — |
| | — |
| | — |
| | 12,733 |
| | (12,733 | ) |
| | Real estate related depreciation and amortization | 18,026 |
| | 15,690 |
| | 2,336 |
| | 66,499 |
| | 58,055 |
| | 8,444 |
|
| | Equity portion of real estate depreciation and amortization on equity investees | 784 |
| | 557 |
| | 227 |
| | 2,141 |
| | 701 |
| | 1,440 |
|
| | Noncontrolling interests | 261 |
| | 289 |
| | (28 | ) | | 298 |
| | 538 |
| | (240 | ) |
| Funds from operations ("FFO") available to stockholders and unitholders | 31,074 |
| | 25,025 |
| | 6,049 |
| | 86,079 |
| | 77,718 |
| | 8,361 |
|
| | percent change | | | | | 24.2 | % | | | | | | 10.8 | % |
| | | | | | | | | | | | | |
| FFO adjustments: | | | | | | | | | | | |
| | Loss on extinguishment of debt | 403 |
| | 2,651 |
| | (2,248 | ) | | 403 |
| | 3,543 |
| | (3,140 | ) |
| | Acquisition costs | — |
| | — |
| | — |
| | 293 |
| | 1,058 |
| | (765 | ) |
| | Severance costs, net of tax | — |
| | — |
| | — |
| | — |
| | 314 |
| | (314 | ) |
| | Straight-line adjustment for ground leases (2) | 1,187 |
| | 1,202 |
| | (15 | ) | | 4,782 |
| | 4,835 |
| | (53 | ) |
| FFO adjustments | 1,590 |
| | 3,853 |
| | (2,263 | ) | | 5,478 |
| | 9,750 |
| | (4,272 | ) |
| | | | | | | | | | | | | |
FFO on Participating Developments:(3) | | | | | | | | | | | |
| | Interest on loan to Participating Development | — |
| | — |
| | — |
| | — |
| | (5,581 | ) | | 5,581 |
|
| | Development fees on Participating Development, net of costs and taxes | — |
| | — |
| | — |
| | — |
| | (1,548 | ) | | 1,548 |
|
| FFO on Participating Developments | — |
| | — |
| | — |
| | — |
| | (7,129 | ) | | 7,129 |
|
| | | | | | | | | | | | | |
| Core funds from operations ("Core FFO") available to stockholders and unitholders | $ | 32,664 |
| | $ | 28,878 |
| | $ | 3,786 |
| | $ | 91,557 |
| | $ | 80,339 |
| | $ | 11,218 |
|
| | percent change | | | | | 13.1 | % | | | | | | 14.0 | % |
| | | | | | |
|
| | | | | |
|
FFO per weighted average share/unit (4) | $ | 0.58 |
| | $ | 0.52 |
| | $ | 0.06 |
| | $ | 1.72 |
| | $ | 1.80 |
| | $ | (0.08 | ) |
| | percent change | | | | | 11.5 | % | | | | | | (4.4 | )% |
Core FFO per weighted average share/unit (4) | $ | 0.61 |
| | $ | 0.60 |
| | $ | 0.01 |
| | $ | 1.83 |
| | $ | 1.86 |
| | $ | (0.03 | ) |
| | percent change | | | | | 1.7 | % | | | | | | (1.6 | )% |
| | | | | | | | | | | | |
|
Weighted average shares/units (4) | 53,788 |
| | 48,002 |
| | 5,786 |
| | 49,991 |
| | 43,277 |
| | 6,714 |
|
| | percent change | | | | | 12.1 | % | | | | | | 15.5 | % |
| | | | | | | | | | | | | |
(1) Represents gain on insurance settlement at 3949 Lindell. The community was damaged by fire in July 2012. All claims were settled during the year ended December 31, 2014, at which time the gain was recognized. |
(2) This represents the straight-line rent expense adjustment required by GAAP related to ground leases. As the ground lease terms range from 40 to 99 years, the adjustment to straight-line these agreements becomes material to our operating results, distorting the economic results of the communities. |
(3) FFO on participating developments in 2014 represents the economic impact of interest and fees not recognized in net income due to the Company having a participating investment in the third-party development. The adjustment for interest income is based on terms of the loan. In July 2014, our mezzanine investment was repaid in full, ending the Company's participation in the project and any fees and interest. At the same time all previously deferred amounts were recognized in net income. |
(4) FFO and Core FFO per weighted average share/unit were computed using the weighted average of all shares and partnership units outstanding, regardless of their dilutive impact. |
|
| | |
| COMMUNITY OPERATING RESULTS |
|
| | | | | | | | | | | | | | | | | | | | | | | | | | | | | | |
| (Amounts in thousands, unaudited) | | | | | | | | | | | | |
| | | | | | | | | | | | | | | | | |
| | | Three Months Ended December 31, | | Year Ended December 31, |
| | | 2015 | | 2014 | | $ Change | | % Change | | 2015 | | 2014 | | $ Change | | % Change |
| Revenues | | | | | | | | | | | | | | | |
| | Same-communities(1) | $ | 49,895 |
| | $ | 48,192 |
| | $ | 1,703 |
| | 3.5 | % | | $ | 183,375 |
| | $ | 173,948 |
| | $ | 9,427 |
| | 5.4 | % |
| | New-communities (2) | 21,137 |
| | 11,823 |
| | 9,314 |
| | 78.8 | % | | 54,005 |
| | 16,937 |
| | 37,068 |
| | 218.9 | % |
| | Sold-communities(3) | 382 |
| | 1,630 |
| | (1,248 | ) | | (76.6 | )% | | 1,775 |
| | 15,437 |
| | (13,662 | ) | | (88.5 | )% |
| | CA revenue(4) | 367 |
| | — |
| | 367 |
| | NM |
| | 1,468 |
| | — |
| | 1,468 |
| | NM |
|
| Total revenues | 71,781 |
| | 61,645 |
| | 10,136 |
| | 16.4 | % | | 240,623 |
| | 206,322 |
| | 34,301 |
| | 16.6 | % |
| | | | | | | | | | | | | | | | | |
Operating expenses (5) | | | | | | | | | | | | | | | |
| | Same-communities(1) | 19,403 |
| | 18,537 |
| | 866 |
| | 4.7 | % | | 80,589 |
| | 76,786 |
| | 3,803 |
| | 5.0 | % |
| | New-communities (2) | 5,796 |
| | 3,012 |
| | 2,784 |
| | 92.4 | % | | 18,235 |
| | 6,366 |
| | 11,869 |
| | 186.4 | % |
| | Sold-communities(3) | 265 |
| | 1,037 |
| | (772 | ) | | (74.4 | )% | | 991 |
| | 9,497 |
| | (8,506 | ) | | (89.6 | )% |
| | CA revenue(4) | 367 |
|
| — |
| | 367 |
| | NM |
| | 1,468 |
| | — |
| | 1,468 |
| | NM |
|
| Total operating expenses | 25,831 |
| | 22,586 |
| | 3,245 |
| | 14.4 | % | | 101,283 |
| | 92,649 |
| | 8,634 |
| | 9.3 | % |
| | | | | | | | | | | | | | | | | |
| Net operating income | | | | | | | | | | | | | | | |
| | Same-communities(1) | 30,492 |
| | 29,655 |
| | 837 |
| | 2.8 | % | | 102,786 |
| | 97,162 |
| | 5,624 |
| | 5.8 | % |
| | New-communities (2) | 15,341 |
| | 8,811 |
| | 6,530 |
| | NM |
| | 35,770 |
| | 10,571 |
| | 25,199 |
| | NM |
|
| | Sold-communities(3) | 117 |
| | 593 |
| | (476 | ) | | NM |
| | 784 |
| | 5,940 |
| | (5,156 | ) | | NM |
|
| Total net operating income | $ | 45,950 |
| | $ | 39,059 |
| | $ | 6,891 |
| | 17.6 | % | | $ | 139,340 |
| | $ | 113,673 |
| | $ | 25,667 |
| | 22.6 | % |
| | | | | | | | | | | | | | | | | |
| |
(1) Same-communities are defined as those communities that have been open and operating for the whole time in the current and prior periods. See page 27 of this supplement for a listing of same-communities. |
(2) See page 27 of this supplement for a listing of which communities are categorized as new-communities. |
(3) Represents operating results from communities sold in 2014 and 2015. |
(4) Represents additional same-community revenue and expenses incurred as a result of the Company changing its community assistant program at the end of 2014. The amounts are shown separately as there is no NOI impact and to clearly show the operating growth in revenue and expenses year over year.
|
(5) Represents community level operating expenses, excluding management fees, depreciation, amortization, ground lease expense and impairment charges, plus regional and other corporate costs of supporting the communities. |
|
| | |
| SAME-COMMUNITY EXPENSES BY CATEGORY |
|
| | | | | | | | | | | | | | | | | | | | | | | | | | | | |
| (Amounts in thousands, except bed and per-bed data, unaudited) |
| | Three months ended December 31, 2015 | | Three months ended December 31, 2014 | | | | |
| | Amount | | Per Bed | | % of Total Operating Expenses | | Amount | | Per Bed | | % of Total Operating Expenses | | $ Change | | % Change |
Utilities(1) | $ | 5,890 |
| | $ | 259 |
| | 29 | % | | $ | 5,714 |
| | $ | 252 |
| | 32 | % | | $ | 176 |
| | 3.1 | % |
| On-Site Payroll | 3,376 |
| | 149 |
| | 17 | % | | 3,263 |
| | 144 |
| | 18 | % | | 113 |
| | 3.5 | % |
General & Administrative(2) | 3,349 |
| | 147 |
| | 17 | % | | 3,248 |
| | 143 |
| | 18 | % | | 101 |
| | 3.1 | % |
Maintenance & Repairs(3) | 1,234 |
| | 54 |
| | 6 | % | | 1,092 |
| | 48 |
| | 6 | % | | 142 |
| | 13.0 | % |
| Marketing | 860 |
| | 38 |
| | 4 | % | | 870 |
| | 38 |
| | 5 | % | | (10 | ) | | (1.1 | )% |
| Total Direct Operating Expenses | $ | 14,709 |
| | $ | 647 |
| | 76 | % | | $ | 14,187 |
| | $ | 625 |
| | 77 | % | | $ | 522 |
| | 3.7 | % |
| | | | | | | | | | | | | | | | |
| Real Estate Taxes | 4,123 |
| | 181 |
| | 21 | % | | 3,796 |
| | 167 |
| | 20 | % | | 327 |
| | 8.6 | % |
| Insurance | 571 |
| | 25 |
| | 3 | % | | 554 |
| | 24 |
| | 3 | % | | 17 |
| | 3.1 | % |
| Total Fixed Operating Expenses | $ | 4,694 |
| | $ | 206 |
| | 24 | % | | $ | 4,350 |
| | $ | 191 |
| | 23 | % | | $ | 344 |
| | 7.9 | % |
| Total Property Operating Expenses | $ | 19,403 |
| | $ | 853 |
| | 100 | % | | $ | 18,537 |
| | $ | 816 |
| | 100 | % | | $ | 866 |
| | 4.7 | % |
| | | | | | | | | | | | | | | | |
| | Year ended December 31, 2015 | | Year ended December 31, 2014 | | | | |
| | Amount | | Per Bed | | % of Total Operating Expenses | | Amount | | Per Bed | | % of Total Operating Expenses | | $ Change | | % Change |
Utilities(1) | $ | 22,678 |
| | $ | 998 |
| | 27 | % | | $ | 21,695 |
| | 955 |
| | 29 | % | | 983 |
| | 4.5 | % |
| On-Site Payroll | 13,792 |
| | 607 |
| | 17 | % | | 13,075 |
| | 576 |
| | 18 | % | | 717 |
| | 5.5 | % |
General & Administrative(2) | 12,409 |
| | 546 |
| | 15 | % | | 12,706 |
| | 559 |
| | 17 | % | | (297 | ) | | (2.3 | )% |
Maintenance & Repairs(3) | 8,582 |
| | 378 |
| | 11 | % | | 7,847 |
| | 345 |
| | 10 | % | | 735 |
| | 9.4 | % |
| Marketing | 3,440 |
| | 151 |
| | 4 | % | | 3,552 |
| | 156 |
| | 5 | % | | (112 | ) | | (3.2 | )% |
| Total Direct Operating Expenses | $ | 60,901 |
| | $ | 2,680 |
| | 76 | % | | $ | 58,875 |
| | $ | 2,591 |
| | 77 | % | | $ | 2,026 |
| | 3.4 | % |
| | | | | | | | | | | | | | | | |
| Real Estate Taxes | 17,405 |
| | 766 |
| | 22 | % | | 15,682 |
| | 690 |
| | 20 | % | | 1,723 |
| (4) | 11.0 | % |
| Insurance | 2,283 |
| | 100 |
| | 3 | % | | 2,229 |
| | 98 |
| | 3 | % | | 54 |
| | 2.4 | % |
| Total Fixed Operating Expenses | $ | 19,688 |
| | $ | 866 |
| | 24 | % | | $ | 17,911 |
| | $ | 788 |
| | 23 | % | | $ | 1,777 |
| | 9.9 | % |
| Total Property Operating Expenses | $ | 80,589 |
| | $ | 3,546 |
| | 100 | % | | $ | 76,786 |
| | $ | 3,379 |
| | 100 | % | | $ | 3,803 |
| (4) | 5.0 | % |
| | | | | | | | | | | | | | | | |
| Same-community beds | 22,718 |
| | | | | | | | | | | | | | |
| | | | | | | | | | | | | | | | |
NOTE: Schedule does not include $0.4 million and $1.5 million of expenses for the three months ended December 31, 2015 and the year ended ended December 31, 2015, respectively, related to the Company's change in its community assistant program at the end of the prior year. See note 4 on page 6.
|
| | | | | | | | | | | | | | | | |
(1) Represents gross costs before recoveries from tenants and includes student amenities such as internet. |
(2) Includes property-level general and administrative cost and dining costs as well as regional and other corporate costs of supporting the communities. |
(3) Includes general maintenance costs, grounds and landscaping, turn costs and life safety costs. |
(4) During the first quarter of 2015 the Company accrued an additional $0.8 million in real estate taxes relating to the settlement of an assessment dispute with a local school board at one community covering several prior assessment years. Without this charge, real estate taxes would have only increased 5.8% and total operating expenses would have only increased 3.9% over prior year.
|
|
| | |
| COMMUNITY OPERATIONS - TRAILING FIVE QUARTERS |
|
| | | | | | | | | | | | | | | | | | | | | | | | | |
| (Amounts in thousands, except beds and per bed amounts) | Three Months Ended | | Total / Weighted Average - Trailing Twelve Months |
| | | | December 31, 2014 | | March 31, 2015 | | June 30, 2015 | | September 30, 2015 | | December 31, 2015 | |
| 2015 Same Communities | | | | | | | | | | | | |
| | Revenue | | $ | 48,192 |
| | $ | 47,582 |
| | $ | 44,144 |
| | $ | 41,754 |
| | $ | 49,895 |
| | $ | 183,375 |
|
| | Operating Expenses | | 18,537 |
| | 19,774 |
| | 18,366 |
| | 23,046 |
| | 19,403 |
| | 80,589 |
|
| | Net Operating Income | | $ | 29,655 |
| | $ | 27,808 |
| | $ | 25,778 |
| | $ | 18,708 |
| | $ | 30,492 |
| | $ | 102,786 |
|
| | Margin | | 62 | % | | 58 | % | | 58 | % | | 45 | % | | 61 | % | | 56 | % |
| | Beds | | 68,157 |
| | 68,157 |
| | 68,157 |
| | 68,157 |
| | 68,157 |
| | 272,628 |
|
| | Occupancy(1) | | 96.3 | % | | 96.0 | % | | 88.5 | % | | 90.8 | % | | 97.2 | % | | 93.1 | % |
| | Net Apartment Rent per Occupied Bed | | $ | 693 |
| | $ | 682 |
| | $ | 677 |
| | $ | 606 |
| | $ | 709 |
| | $ | 669 |
|
| | Other Income per Occupied Bed | | 41 |
| | 46 |
| | 55 |
| | 69 |
| | 44 |
| | 53 |
|
| | Total Revenue per Occupied Bed | | $ | 734 |
| | $ | 728 |
| | $ | 732 |
| | $ | 675 |
| | $ | 753 |
| | $ | 722 |
|
| | Operating Expense per Available Bed | | $ | 272 |
| | $ | 290 |
| | $ | 269 |
| | $ | 338 |
| | $ | 285 |
| | $ | 296 |
|
| | | | | | | | | | | | | | |
| 2015 New Communities | | | | | | | | | | | | |
| | Revenue | | $ | 11,823 |
| | $ | 11,939 |
| | $ | 8,726 |
| | $ | 12,203 |
| | $ | 21,137 |
| | $ | 54,005 |
|
| | Operating Expenses | | 3,012 |
| | 3,787 |
| | 3,907 |
| | 4,745 |
| | 5,796 |
| | 18,235 |
|
| | Net Operating Income | | $ | 8,811 |
| | $ | 8,152 |
| | $ | 4,819 |
| | $ | 7,458 |
| | $ | 15,341 |
| | $ | 35,770 |
|
| | Margin | | 75 | % | | 68 | % | | 55 | % | | 61 | % | | 73 | % | | 66 | % |
| | Beds | | 13,674 |
| | 13,674 |
| | 13,824 |
| | 19,756 |
| | 23,046 |
| | 70,300 |
|
| | Occupancy(1) | | 95.6 | % | | 95.0 | % | | 63.7 | % | | 82.7 | % | | 94.2 | % | | 85.1 | % |
| | Net Apartment Rent per Occupied Bed | | $ | 883 |
| | $ | 882 |
| | $ | 945 |
| | $ | 683 |
| | $ | 940 |
| | $ | 858 |
|
| | Other Income per Occupied Bed | | 22 |
| | 37 |
| | 47 |
| | 64 |
| | 33 |
| | 44 |
|
| | Total Revenue per Occupied Bed | | $ | 905 |
| | $ | 919 |
| | $ | 992 |
| | $ | 747 |
| | $ | 973 |
| | $ | 902 |
|
| | Operating Expense per Available Bed | | $ | 220 |
| | $ | 277 |
| | $ | 283 |
| | $ | 240 |
| | $ | 252 |
| | $ | 259 |
|
| | | | | | | | | | | | | | |
| 2015 Sold Communities | | | | | | | | | | | | |
| | Revenue | | $ | 1,630 |
| | $ | 494 |
| | $ | 497 |
| | $ | 402 |
| | $ | 382 |
| | $ | 1,775 |
|
| | Operating Expenses | | 1,037 |
| | 212 |
| | 228 |
| | 286 |
| | 265 |
| | 991 |
|
| | Net Operating Income | | $ | 593 |
| | $ | 282 |
| | $ | 269 |
| | $ | 116 |
| | $ | 117 |
| | $ | 784 |
|
| | Margin | | 36 | % | | 57 | % | | 54 | % | | 29 | % | | 31 | % | | 44 | % |
| | Beds | | 2,708 |
| | 1,080 |
| | 1,080 |
| | 1,080 |
| | 1,080 |
| | 4,320 |
|
| | Occupancy(1) | | 92.7 | % | | 99.1 | % | | 98.9 | % | | 92.7 | % | | 84.5 | % | | 93.8 | % |
| | Net Apartment Rent per Occupied Bed | | $ | 622 |
| | $ | 445 |
| | $ | 448 |
| | $ | 385 |
| | $ | 386 |
| | $ | 417 |
|
| | Other Income per Occupied Bed | | 28 |
| | 19 |
| | 17 |
| | 17 |
| | 33 |
| | 21 |
|
| | Total Revenue per Occupied Bed | | $ | 650 |
| | $ | 464 |
| | $ | 465 |
| | $ | 402 |
| | $ | 419 |
| | $ | 438 |
|
| | Operating Expense per Available Bed | | $ | 404 |
| | $ | 196 |
| | $ | 211 |
| | $ | 265 |
| | $ | 245 |
| | $ | 229 |
|
| | | | | | | | | | | | | | |
|
| | |
| COMMUNITY OPERATIONS - TRAILING FIVE QUARTERS |
|
| | | | | | | | | | | | | | | | | | | | | | | | | |
| (Amounts in thousands, except beds and per bed amounts) | Three Months Ended | | Total / Weighted Average - Trailing Twelve Months |
| | | | December 31, 2014 | | March 31, 2015 | | June 30, 2015 | | September 30, 2015 | | December 31, 2015 | |
| | | | | | | | | | | | | | |
Other(2) | | | | | | | | | | | | |
| | Revenue | | $ | — |
| | $ | 367 |
| | $ | 367 |
| | $ | 367 |
| | $ | 367 |
| | $ | 1,468 |
|
| | Operating Expenses | | — |
| | 367 |
| | 367 |
| | 367 |
| | 367 |
| | 1,468 |
|
| | Net Operating Income | | $ | — |
| | $ | — |
| | $ | — |
| | $ | — |
| | $ | — |
| | $ | — |
|
| | Margin | | — | % | | — | % | | — | % | | — | % | | — | % | | — | % |
| | | | | | | | | | | | | | |
| 2015 Total Communities | | | | | | | | | | | | |
| | Revenue | | $ | 61,645 |
| | $ | 60,382 |
| | $ | 53,734 |
| | $ | 54,726 |
| | $ | 71,781 |
| | $ | 240,623 |
|
| | Operating Expenses | | 22,586 |
| | 24,140 |
| | 22,868 |
| | 28,444 |
| | 25,831 |
| | 101,283 |
|
| | Net Operating Income | | $ | 39,059 |
| | $ | 36,242 |
| | $ | 30,866 |
| | $ | 26,282 |
| | $ | 45,950 |
| | $ | 139,340 |
|
| | Margin | | 63 | % | | 60 | % | | 57 | % | | 48 | % | | 64 | % | | 58 | % |
| | Beds | | 84,539 |
| | 82,911 |
| | 83,061 |
| | 88,993 |
| | 92,283 |
| | 347,248 |
|
| | Occupancy(1) | | 96.1 | % | | 95.8 | % | | 84.5 | % | | 89.0 | % | | 96.3 | % | | 91.5 | % |
| | Net Apartment Rent per Occupied Bed | | 721 |
| | 716 |
| | 712 |
| | 623 |
| | 767 |
| | 706 |
|
| | Other Income per Occupied Bed | | 37 |
| | 44 |
| | 53 |
| | 67 |
| | 41 |
| | 51 |
|
| | Total Revenue per Occupied Bed | | 758 |
| | 760 |
| | 765 |
| | 690 |
| | 808 |
| | 757 |
|
| | Operating Expense per Available Bed | | 268 |
| | 291 |
| | 275 |
| | 320 |
| | 280 |
| | 292 |
|
| | | | | | | | | | | | | | |
(1) Represents the weighted average physical occupancy for the period presented. |
(2) Represents additional same-community revenue and expenses incurred as a result of the Company changing its community assistant program at the end of 2014. The amounts are shown separately as there is no NOI impact and to clearly show the operating growth in revenue and expenses year over year.
|
|
| | |
| 2015 RESULTS PRESENTED IN 2016 SAME-COMMUNITY MIX |
|
| | | | | | | | | | | | | | | | | | | | | |
| Build-up to 2016 Same Community Mix | | | | | | |
| (Amounts in thousands, except beds and per bed amounts) | Three Months Ended | | Total / Weighted Average - Full Year 2015 |
| | | | March 31, 2015 | | June 30, 2015 | | September 30, 2015 | | December 31, 2015 | |
| 2015 Same Communities | | | | | | | | | | |
| | Revenue | | $ | 47,582 |
| | $ | 44,144 |
| | $ | 41,754 |
| | $ | 49,895 |
| | $ | 183,375 |
|
| | Operating Expenses | | 19,774 |
| | 18,366 |
| | 23,046 |
| | 19,403 |
| | 80,589 |
|
| | Net Operating Income | | $ | 27,808 |
| | $ | 25,778 |
| | $ | 18,708 |
| | $ | 30,492 |
| | $ | 102,786 |
|
| | Margin | | 58 | % | | 58 | % | | 45 | % | | 61 | % | | 56 | % |
| | Beds | | 68,157 |
| | 68,157 |
| | 68,157 |
| | 68,157 |
| | 272,628 |
|
| | Occupancy(1) | | 96.0 | % | | 88.5 | % | | 90.8 | % | | 97.2 | % | | 93.1 | % |
| | Net Apartment Rent per Occupied Bed | | $ | 682 |
| | $ | 677 |
| | $ | 606 |
| | $ | 709 |
| | $ | 669 |
|
| | Other Income per Occupied Bed | | 46 |
| | 55 |
| | 69 |
| | 44 |
| | 53 |
|
| | Total Revenue per Occupied Bed | | $ | 728 |
| | $ | 732 |
| | $ | 675 |
| | $ | 753 |
| | $ | 722 |
|
| | Operating Expense per Available Bed | | $ | 290 |
| | $ | 269 |
| | $ | 338 |
| | $ | 285 |
| | $ | 296 |
|
| | | | | | | | | | | | |
2016 New Same Communities and Adjustments(2) | | | | | | | | | | |
| | Revenue | | $ | 10,999 |
| | $ | 7,728 |
| | $ | 7,748 |
| | $ | 11,857 |
| | $ | 38,332 |
|
| | Operating Expenses | | 3,362 |
| | 3,440 |
| | 3,251 |
| | 3,446 |
| | 13,499 |
|
| | Net Operating Income | | $ | 7,637 |
| | $ | 4,288 |
| | $ | 4,497 |
| | $ | 8,411 |
| | $ | 24,833 |
|
| | Margin | | 69 | % | | 55 | % | | 58 | % | | 71 | % | | 65 | % |
| | Beds | | 11,670 |
| | 11,670 |
| | 11,670 |
| | 11,670 |
| | 46,680 |
|
| | Occupancy(1) | | 94.4 | % | | 57.7 | % | | 78.2 | % | | 95.5 | % | | 81.5 | % |
| | Net Apartment Rent per Occupied Bed | | $ | 960 |
| | $ | 1,096 |
| | $ | 777 |
| | $ | 1,026 |
| | $ | 959 |
|
| | Other Income per Occupied Bed | | 38 |
| | 53 |
| | 72 |
| | 38 |
| | 49 |
|
| | Total Revenue per Occupied Bed | | $ | 998 |
| | $ | 1,149 |
| | $ | 849 |
| | $ | 1,064 |
| | $ | 1,008 |
|
| | Operating Expense per Available Bed | | $ | 288 |
| | $ | 295 |
| | $ | 279 |
| | $ | 295 |
| | $ | 289 |
|
| | | | | | | | | | | | |
| 2016 Same Communities | | | | | | | | | | |
| | Revenue | | $ | 58,581 |
| | $ | 51,872 |
| | $ | 49,502 |
| | $ | 61,752 |
| | $ | 221,707 |
|
| | Operating Expenses | | 23,136 |
| | 21,806 |
| | 26,297 |
| | 22,849 |
| | 94,088 |
|
| | Net Operating Income | | $ | 35,445 |
| | $ | 30,066 |
| | $ | 23,205 |
| | $ | 38,903 |
| | $ | 127,619 |
|
| | Margin | | 61 | % | | 58 | % | | 47 | % | | 63 | % | | 58 | % |
| | Beds | | 79,827 |
| | 79,827 |
| | 79,827 |
| | 79,827 |
| | 319,308 |
|
| | Occupancy(1) | | 95.7 | % | | 84.0 | % | | 89.0 | % | | 96.9 | % | | 91.4 | % |
| | Net Apartment Rent per Occupied Bed | | $ | 722 |
| | $ | 719 |
| | $ | 628 |
| | $ | 755 |
| | $ | 707 |
|
| | Other Income per Occupied Bed | | 44 |
| | 55 |
| | 69 |
| | 43 |
| | 53 |
|
| | Total Revenue per Occupied Bed | | $ | 766 |
| | $ | 774 |
| | $ | 697 |
| | $ | 798 |
| | $ | 760 |
|
| | Operating Expense per Available Bed | | $ | 290 |
| | $ | 273 |
| | $ | 329 |
| | $ | 286 |
| | $ | 295 |
|
(1) Represents the weighted average physical occupancy for the period presented. |
(2) The following adjustments are included: 1) adjustments for properties that will be considered same-community for financial reporting purposes beginning January 1, 2016, 2) reclass of The Retreat at Oxford to new-communities due to development of the second phase of the project, and 3) the CA adjustment presented in Other in the 2015 trailing five quarters presentation (see note 2 on page 9). |
|
| | | | | | | | | | | | | | | | | | | | | |
| | | | | | | | Preleasing at February 16, | | | | | |
| | Design Beds | | % of NOI | | 2015 Opening Occupancy | | 2016 | | 2015 | | Preleasing Ahead/(Behind) | | Projected Rate Growth | |
| | | | | | | | | | | | | | | |
| Same-Communities - by Tier | | | | | | | | | | | | | | |
| Prior Year Occupancy Below 90% (Tier 1) | 2,384 |
| | 6.4 | % | | 77.6 | % | | 33.3 | % | | 26.8 | % | | 6.5 | % | | 1.0 | % | |
| Prior Year Occupancy 90% to 96.9% (Tier 2) | 5,290 |
| | 14.4 | % | | 95.2 | % | | 34.3 | % | | 38.4 | % | | (4.1 | )% | | 2.5 | % | |
| Prior Year Occupancy 97% and Above (Tier 3) | 16,999 |
| | 79.2 | % | | 99.8 | % | | 69.4 | % | | 62.0 | % | | 7.4 | % | | 3.3 | % | |
Total Same-Communities (1) | 24,673 |
| | 100.0 | % | | 96.6 | % | | 58.4 | % | | 53.5 | % | | 4.9 | % | | 3.0 | % | |
Total New-Communities (2) | 2,107 |
| | | | | | 58.2 | % | | | | | | | |
| Total Communities | 26,780 |
| | | | | | 58.4 | % | | | | | | | |
| | | | | | | | | | | | | | | |
| Projected Fall Revenue: | | | |
| The same-community portfolio is projected to obtain a 2.5% to 3.5% increase in revenue for the upcoming lease term, with net rates up 3% and occupancies consistent with the prior year. | | | |
| | | |
| | | |
| | | | | | | | | | | | | | | |
| NOTE: Leasing update does not include 4,592 same-community beds or 1,141 new-community beds to be delivered in 2016 at the University of Kentucky. Although the university's assignment process does not occur until May, all 5,733 beds, which include the 601 beds delivered in 2013, 2,381 beds delivered in 2014, 1,610 beds delivered in 2015, and 1,141 beds to be delivered in August 2016, are currently 88% applied for this fall. | |
| | | | | | | | | | | | | | | |
(1) The same-community designation for leasing purposes is different than for financial reporting purposes. A community is considered same-community for leasing when the Company has managed the leasing process for at least two leasing cycles, including the 2016/2017 leasing cycle. Design Beds for Same-Communities included in the 2016 Preleasing Summary above include the following design beds: (1) total same-community design beds on page 27 of 22,718 less 601 beds at the University of Kentucky and 668 beds at the Retreat at Oxford plus (2) 3,224 design beds on communities that are considered same for leasing purposes (see note 1 on page 27). |
| | |
(2) The new-community designation for leasing purposes is different than for financial statement purposes. A community is considered new-community for leasing when the Company has not previously managed the leasing process. Design beds for Total New-Communities above include the following: (1) our 2015 acquisitions of The Commons on Bridge (150 beds) and The Province Boulder (317 beds) plus (2) beds at our 2016 development deliveries of The Retreat at Oxford (1,018 beds) and The Retreat at Blacksburg (622 beds). | |
|
| | |
| SAME-COMMUNITY PRELEASING BY REGION AND DISTANCE |
|
| | | | | | | | | | | | | | | | | | | | |
| | | | | | | | Preleasing at February 16, | | | | |
| | Design Beds | | % of NOI | | 2015 Opening Occupancy | | 2016 | | 2015 | | Preleasing Ahead/(Behind) | | Projected Rate Growth |
| | | | | | | | | | | | | | |
Same-Communities - by Region (1) | | | | | | | | | | | | | |
| Mid-Atlantic | 6,202 |
| | 30.7 | % | | 96.1 | % | | 67.1 | % | | 61.9 | % | | 5.2 | % | | 2.8 | % |
| Midwest | 2,276 |
| | 6.4 | % | | 91.3 | % | | 26.4 | % | | 32.9 | % | | (6.5 | )% | | 0.3 | % |
| North | 3,205 |
| | 11.5 | % | | 98.1 | % | | 67.9 | % | | 67.5 | % | | 0.4 | % | | 2.4 | % |
| South Central | 4,082 |
| | 18.9 | % | | 95.9 | % | | 65.9 | % | | 56.4 | % | | 9.5 | % | | 3.8 | % |
| Southeast | 5,681 |
| | 17.2 | % | | 97.9 | % | | 50.9 | % | | 46.8 | % | | 4.1 | % | | 3.0 | % |
| West | 3,227 |
| | 15.3 | % | | 98.8 | % | | 58.4 | % | | 46.3 | % | | 12.1 | % | | 4.4 | % |
| Total Same-Communities | 24,673 |
| | 100.0 | % | | 96.6 | % | | 58.4 | % | | 53.5 | % | | 4.9 | % | | 3.0 | % |
| | | | | | | | | | | | | | |
| | | | | | | | | | | | | | |
| Same-Communities - by Distance from Campus | | | | | | | | | | | | | |
| 0-0.2 miles | 14,896 |
| | 71.5 | % | | 98.0 | % | | 65.1 | % | | 58.1 | % | | 7.0 | % | | 3.3 | % |
| 0.21-0.49 miles | 2,144 |
| | 6.8 | % | | 96.4 | % | | 49.6 | % | | 42.6 | % | | 7.0 | % | | 3.3 | % |
| 0.5-0.99 miles | 336 |
| | 0.9 | % | | 95.5 | % | | 41.1 | % | | 59.2 | % | | (18.1 | )% | | 8.0 | % |
| 1.0-1.99 miles | 5,437 |
| | 16.4 | % | | 93.8 | % | | 49.5 | % | | 44.8 | % | | 4.7 | % | | 1.5 | % |
| 2.0 & > miles | 1,860 |
| | 4.4 | % | | 94.8 | % | | 43.8 | % | | 53.9 | % | | (10.1 | )% | | 1.9 | % |
| Total Same-Communities | 24,673 |
| | 100.0 | % | | 96.6 | % | | 58.4 | % | | 53.5 | % | | 4.9 | % | | 3.0 | % |
| | | | | | | | | | | | | | |
| NOTE: Leasing update does not include 4,592 same-community beds or 1,141 new-community beds to be delivered in 2016 at the University of Kentucky. Although the university's assignment process does not occur until May, all 5,733 beds, which include the 601 beds delivered in 2013, 2,381 beds delivered in 2014, 1,610 beds delivered in 2015, and 1,141 beds to be delivered in August 2016, are currently 88% applied for this fall. |
| | | | | | | | | | | | | | |
(1) See definition of regions on page 29. |
|
| | |
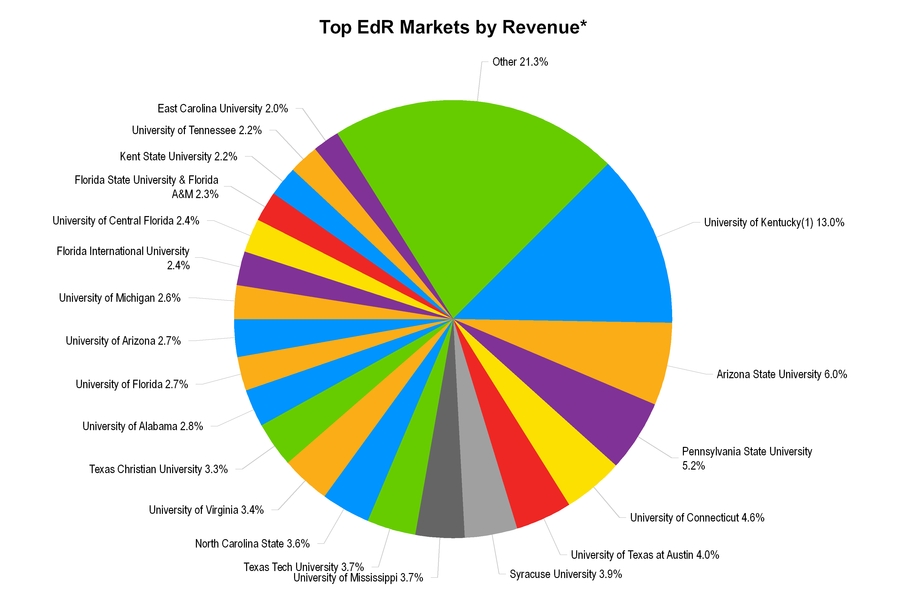
| TOP EdR MARKETS AND STATES BY REVENUE |
|
|
| *The data above is based on actual 2015 revenues, but excludes properties that were sold during 2015. |
(1) All revenue at the University of Kentucky is from ONE PlanSM on-campus assets. |
|
| | |
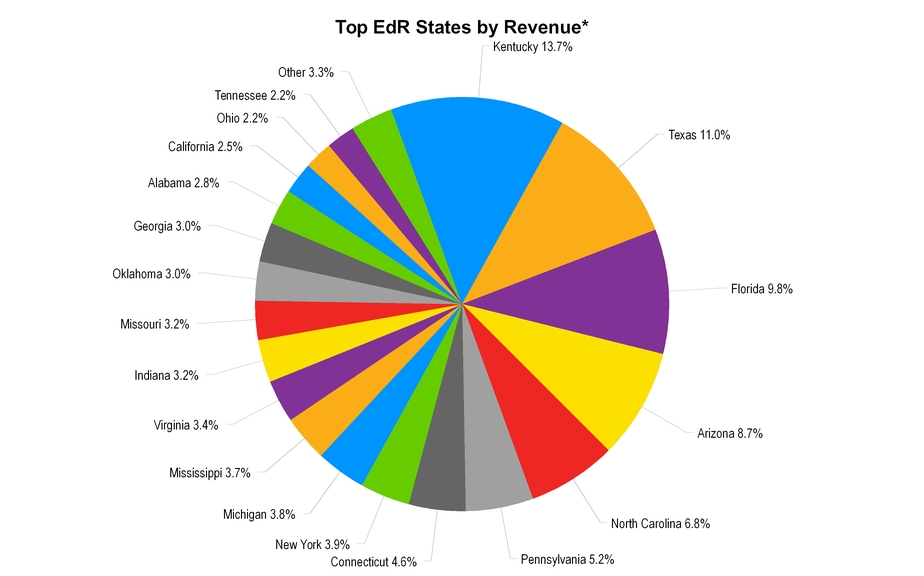
| TOP EdR MARKETS AND STATES BY REVENUE |
|
|
*The data above is based on actual 2015 revenues, but excludes properties that were sold during 2015.
|
|
| | |
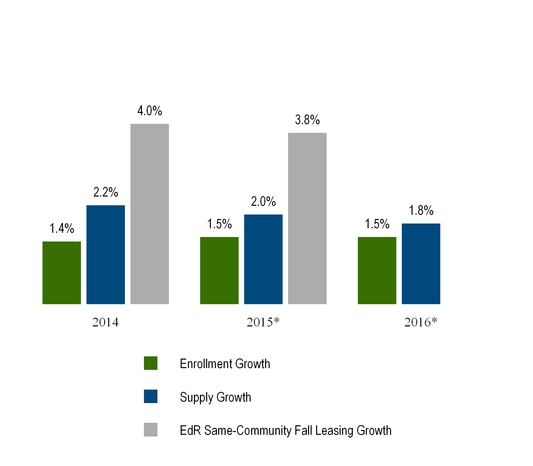
| NEW SUPPLY AND ENROLLMENT - EdR MARKETS |
|
|
| New supply expected to slow over 20% from 2015 to 2016 |
EdR Market and Revenue Growth
|
|
| *Enrollment projection represents the 3-year enrollment CAGR through 2014 for our markets. |
|
| | |
| OWNED COMMUNITY PROJECTED 2016 NEW SUPPLY AND DEMAND INFORMATION
|
|
| | | | | | |
| Owned Community Projected 2016 New Supply and Demand Information by Region | |
| | | | | | | |
Region (4) | Owned Beds (3) | Percentage of Owned Beds | EdR NOI % (1) | Enrollment Growth 3 Year CAGR - Universities Served | 2016 New Supply % | Variance |
| West | 3,544 | 11% | 13% | 1.5% | 0.5% | 1.0% |
| Mid Atlantic | 6,824 | 21% | 25% | 0.9% | 1.5% | (0.6)% |
| North | 3,205 | 10% | 8% | 0.2% | 1.2% | (1.0)% |
| South Central | 10,983 | 34% | 37% | 2.2% | 3.5% | (1.3)% |
| Southeast | 5,681 | 17% | 12% | 0.9% | 0.7% | 0.2% |
| Midwest | 2,276 | 7% | 5% | 1.7% | 1.6% | 0.1% |
| Total | 32,513 | 100% | 100% | 1.5% | 1.8% | (0.3)% |
| | | | | | | |
| | | | | | | |
Region (4) | Anticipated 2016 Enrollment Growth (2) | 2016 Supply Growth | Variance | | | |
| West | 2,900 | 761 | 2,139 | |
| Mid Atlantic | 2,081 | 2,300 | (219) | | | |
| North | 1,124 | 1,913 | (789) | | | |
| South Central | 3,288 | 5,686 | (2,398) | | | |
| Southeast | 1,269 | 1,791 | (522) | | | |
| Midwest | 1,504 | 1,422 | 82 | | | |
| Total | 12,166 | 13,873 | (1,707) | | | |
| | | | | | | |
| | | | | | | |
| NOTE: Schedule represents all markets served by EdR communities and includes 2015 completed deliveries and acquisitions and all announced 2016 developments. Data was obtained from the National Center for Education Statistics, AXIOmetrics and local market data. |
| |
(1) NOI is based on 2015 actual net operating income with pro forma adjustments for 2015 and 2016 developments and acquisitions that have been operating for less than 12 months. |
(2) Extrapolated from 2014 enrollment statistics from University Common Data Sets using the previous 3-year enrollment growth percentages. |
(3) Total Owned Beds reported herein include Total Communities design beds on page 27 of 30,400 plus 2,113 of beds at our 2016 deliveries at the University of Kentucky (1,141 beds), The Retreat at Blacksburg (622 beds) and the second phase at The Retreat at Oxford (350 beds) (also see page 18). |
(4) See definition of regions on page 29. |
|
| | |
| OWNED COMMUNITY PROJECTED 2016 NEW SUPPLY AND DEMAND INFORMATION
|
|
| | | | | |
| Projected 2016 New Supply Sorted by Percentage Increase | | |
| | | | | | |
| New Supply Growth | University Markets | EdR Bed Count | Pro Forma EdR NOI %(1) |
| 0% | 12 | 32% | 15,037 | 46% | 45% |
| 0.1% to 1.0% | 8 | 22% | 4,240 | 13% | 13% |
| 1.0% - 3.0% | 10 | 27% | 7,508 | 23% | 23% |
| 3.0% - 5.0% | 5 | 14% | 3,418 | 11% | 13% |
| > 5.0% | 2 | 5% | 2,310 | 7% | 6% |
| Total | 37 | 100% | 32,513 | 100% | 100% |
| | | | | | |
| | | | | | |
| University Markets with > 5% Increase in 2016 New Supply | | | |
| | | | | | |
| University | New Supply Increase | Pro Forma EdR NOI % | | | |
| University of Louisville | 8.6% | 2.2% | | | |
| University of Mississippi | 8.2% | 4.4% | | | |
| | | 6.6% | | | |
| | | | | | |
| NOTE: Schedule represents all markets served by EdR communities and includes 2015 completed deliveries and acquisitions and all announced 2016 developments. Data was obtained from the National Center for Education Statistics, AXIOmetrics and local market data. |
(1) NOI is based on 2015 actual net operating income with pro forma adjustments for 2015 and 2016 developments and acquisitions that have been operating for less than 12 months. |
|
| | |
| OWNED DEVELOPMENT SUMMARY |
|
| | | | | | | | | | | | | | | | | | |
| (Amounts in thousands, except bed counts) | | | | | | | | | |
| | | | | | | | | | | | |
| | Active Projects | Project Type | Bed Count | Estimated Start Date | Anticipated Completion Date | Total Project Development Cost | | EdR's Ownership Percentage | EdR's Share of Development Cost | | EdR's Share of Development Cost to be Funded |
| | University of Kentucky - Limestone Park I & II(2) | ONE Plan (1) | 1,141 |
| In progress | Summer 2016 | $ | 83,911 |
| | 100% | $ | 83,911 |
| | $ | 33,542 |
|
| | University of Mississippi - The Retreat - Phase II | Wholly Owned | 350 |
| In progress | Summer 2016 | 26,161 |
| | 100% | 26,161 |
| | 11,508 |
|
| | Virginia Tech - Retreat at Blacksburg - Phase I | Joint Venture | 622 |
| In progress | Summer 2016 | 48,325 |
| | 75% | 36,244 |
| | 17,297 |
|
| | Total - 2016 Deliveries | | 2,113 |
| | | $ | 158,397 |
| | | $ | 146,316 |
| | $ | 62,347 |
|
| | | | | | | | | | | | |
| | University of Kentucky - University Flats | ONE Plan (1) | 771 |
| In progress | Summer 2017 | $ | 74,038 |
| | 100% | $ | 74,038 |
| | $ | 65,365 |
|
| | Virginia Tech - Retreat at Blacksburg - Phase II | Joint Venture | 207 |
| Summer 2016 | Summer 2017 | 16,108 |
| | 75% | 12,081 |
| | 12,081 |
|
| | Boise State University | ONE Plan (1) | 656 |
| In progress | Summer 2017 | 39,763 |
| | 100% | 39,763 |
| | 39,157 |
|
| | University of Kentucky - Lewis Hall | ONE Plan (1) | 346 |
| Spring 2016 | Summer 2017 | 26,935 |
| | 100% | 26,935 |
| | 25,926 |
|
| | Michigan State University - SkyVue | Joint Venture | 824 |
| In progress | Summer 2017 | 89,906 |
| | 90% | 80,915 |
| | 80,915 |
|
| | Texas State University - The Local: Downtown | Joint Venture | 304 |
| In progress | Summer 2017 | 29,631 |
| | 80% | 23,705 |
| | 21,209 |
|
| | Total - 2017 Deliveries | | 3,108 |
| | | $ | 276,381 |
| | | $ | 257,437 |
| | $ | 244,653 |
|
| | | | | | | | | | | | |
| | Total Active Projects | | 5,221 |
| | | $ | 434,778 |
| | | $ | 403,753 |
| | $ | 307,000 |
|
| | | | | | | | | | | | |
| | | | | | | | | | | | |
| | Recently Awarded | Project Type | Bed Count | Estimated Start Date | Anticipated Completion Date | Total Project Development Cost | | | | | |
| | Cornell University | TBD (3) | 850 |
| Fall 2016 | Summer 2018 | $ | 80,000 |
| | | | | |
| | | | | | | | | | | | |
| | | | | | | | | | | | |
| | NOTE: The initiation and completion of an awarded project that has not begun construction is contingent upon execution of transactional documents, including such items as development agreements, construction agreements and ground leases.
|
| | (1) The On-Campus Equity Plan, or The ONE PlanSM, is our equity program for universities, which allows universities to use EdR's equity and financial stability to develop and revitalize campus housing while preserving their credit capacity for other campus projects. The ONE PlanSM offers one service provider and one equity source to universities seeking to modernize on-campus housing to meet the needs of today's students. |
| | (2) This project, once complete, will consist of multiple communities. |
| | (3) In February 2016, Cornell University and EdR executed a pre-closing agreement and design and site planning are under way toward an expected fall 2016 groundbreaking and commencement of construction for an approximate 850 bed $80.0 million on-campus housing community targeted for summer 2018 delivery. |
|
| | |
| THIRD-PARTY DEVELOPMENT SUMMARY |
|
| | | | | | | | | | | | | | | | | | | |
| (Amounts in thousands, except bed count) | | | | | | |
| | | | | | | | | |
| | | | | | | | | |
| THIRD-PARTY PROJECTS | | | | | | | | |
| Project | Bed Count | Estimated Start Date | Anticipated Completion Date | Project Development Cost | Total Project Fees | Fees Earned Prior Year (1) | Fees Earned Year Ended December 31, 2015 (1) | Remaining Fees to Earn |
| Clarion University of Pennsylvania | 728 |
| In progress | (2) | $ | 55,104 |
| $ | 2,092 |
| $ | 931 |
| $ | 1,115 |
| $ | 46 |
|
| University of Cal. Berkeley - Bowles Hall | 186 |
| In progress | Summer 2016 | 35,947 |
| 1,768 |
| — |
| 826 |
| 942 |
|
| Texas A&M - Commerce | 490 |
| Summer 2016 | Summer 2017 | 25,770 |
| 1,131 |
| — |
| — |
| 1,131 |
|
| East Stroudsburg University - Pennsylvania Ph II | 488 |
| (3) | Summer 2017 | TBD |
| TBD |
| — |
| — |
| TBD |
|
| Shepherd University | 297 |
| Summer 2016 | Summer 2017 | TBD |
| TBD |
| — |
| — |
| TBD |
|
| Total | 2,189 |
|
|
| $ | 116,821 |
| $ | 4,991 |
| $ | 931 |
| $ | 1,941 |
| $ | 2,119 |
|
| |
| NOTE: The initiation and completion of an awarded project that has not begun construction is contingent upon execution of transactional documents, including such items as development agreements and ground leases, and obtaining financing. |
| | | | | | | | | |
(1) Amount may not tie to third-party development services revenue on the statement of operations as this schedule only includes fees earned on projects that are in progress or recently completed. |
(2) The first phase of the project at Clarion University of Pennsylvania for collegiate housing delivered in August 2015, the second phase of the project for collegiate housing delivered in December 2015 and a third phase of the project for other capital improvements is scheduled to deliver in the summer of 2016. |
(3) Construction on the second phase of the third-party development at East Stroudsburg University is expected to commence in May 2016 after final site plan approval has been obtained. |
|
| | | | | | | | | | | | | | | |
| | | | | | | | | | |
| as of December 31, 2015 | | | | | | Principal Outstanding | Weighted Average Interest Rate | Average Term to Maturity (in years) | |
| (Amounts in thousands) | | | | | | |
| | | | | | | |
| | | | | | | |
| Total Debt to Gross Assets | | | | | Fixed Rate - Mortgage Debt (6) | $ | 98,209 |
| 5.9 | % | 2.8 |
| |
Debt(1) | $ | 642,964 |
| | | | Variable Rate - Mortgage Debt | 33,650 |
| 2.4 | % | 0.5 |
| |
Gross Assets(2) | 2,272,824 | | | | Variable Rate - Construction Debt | 73,605 |
| 2.3 | % | 1.9 |
| |
| Debt to Gross Assets | 28.3 | % | | | | Fixed Rate - 5 Yr. Unsecured Term Loan (7) | 65,000 |
| 3.0 | % | 3.0 |
| |
| | | | | | Fixed Rate - 7 Yr. Unsecured Term Loan (7) | 122,500 |
| 4.0 | % | 5.0 |
| |
| Net Debt to Enterprise Value | | | | | Fixed Rate - Unsecured Senior Notes | 250,000 |
| 4.6 | % | 8.9 |
| |
Net Debt(1) | $ | 609,222 |
| | | | Variable Rate - Unsecured Revolving Credit Facility | — |
| — | % | — |
| |
Market Equity(3) | 2,165,690 |
| | | | Debt(1) / Weighted Average | $ | 642,964 |
| 4.1 | % | 5.4 |
| |
| Enterprise Value | $ | 2,774,912 |
| | | | Less: Cash | 33,742 |
| | | |
| | | | | | Net Debt | $ | 609,222 |
| | | |
| Net Debt to Enterprise Value | 22.0% | |
| | | | | | |
| | | | | | | | | | |
| | | | | | | | | | |
Interest Coverage (TTM)(4) | 4.8x | |
| | | | | | |
Net Debt to EBITDA - Adjusted (TTM)(5) | 4.0x | |
| | |
| | | |
| Variable Rate Debt to Total Debt | 16.7% | |
| | | | | | |
| | | | | | |
| | | |
| | | | | | | | | | |
(1) Excludes unamortized debt premium of $0.6 million and unamortized deferred financing costs of $4.8 million. |
(2) Excludes accumulated depreciation of $271.0 million. |
(3) Market equity includes 56,879,003 shares of the Company's common stock and 293,394 Operating Partnership Units, which are convertible into common shares, and is calculated using $37.88 per share, the closing price of the Company's common stock on December 31, 2015. |
(4) Equals Adjusted EBITDA of $117.5 million divided by interest expense of $24.4 million. See page 24 for reconciliation to Adjusted EBITDA. |
(5) Net Debt to EBITDA - Adjusted is calculated to normalize the impact of non-producing construction debt. In the calculation, Net Debt is total debt (excluding the unamortized debt premium and deferred financing costs) less cash and excludes non-producing debt related to assets under development at time of calculation. EBITDA is Proforma Adjusted EBITDA, which includes proforma adjustments to reflect all acquisitions, development deliveries and dispositions as if such had occurred at the beginning of the 12 month period being presented. |
(6) In January 2016, the Trust prepaid all outstanding fixed rate mortgage debt in the amount of $98.2 million with the proceeds from the January 2016 follow on equity offering. See page 22 for the Pro Forma Capital Structure. |
(7) The Trust entered into interest rate swaps to effectively fix the interest rate on the term loans. The weighted average interest rates reflect the swapped (fixed) rate plus the current margin. |
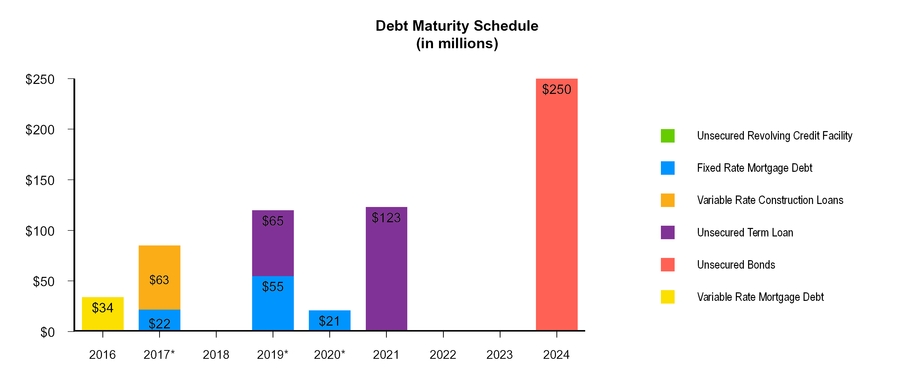
* On January 31, 2016, the Trust prepaid the remaining fixed rate mortgage debt maturing in 2017 ($22 million), 2019 ($55 million) and 2020 ($21 million).
|
| | | | | | | | | | | | | | | | | | |
Weighted Average Interest Rate of Debt Maturing Each Year (1) |
| | | 2016 | | 2017 | | 2018 | | 2019 | | 2020 | | 2021 | | 2022 | | 2023 | | 2024 |
| Fixed Rate Debt | | —% | | 5.6% | | —% | | 4.4% | | 5.7% | | 4.0% | | —% | | —% | | 4.6% |
| Variable Rate Debt | | 2.4% | | 2.4% | | —% | | 2.3% | | —% | | —% | | —% | | —% | | —% |
| Total Debt | | 2.4% | | 3.2% | | —% | | 4.2% | | 5.7% | | 4.0% | | —% | | —% | | 4.6% |
| | | | | | | | | | | | | | | | | | | |
(1) The Trust entered into interest rate swaps to effectively fix the interest rate on the term loans. The weighted average interest rates reflect the swapped (fixed) rate plus the current margin. |
|
| | |
| PRO FORMA CAPITAL STRUCTURE |
|
| | | | | | | | | | | | | | | |
| | | | | | | | | | |
| as of December 31, 2015, pro forma for January 2016 follow-on offering | | | Principal Outstanding | Weighted Average Interest Rate | Average Term to Maturity (in years) | |
| (Amounts in thousands) | | | | | | |
| | | | | | | |
| | | | | | | |
| Total Debt to Gross Assets | | | | | Fixed Rate - Mortgage Debt | $ | — |
| — | % | — |
| |
Debt(1) | $ | 544,755 |
| | | | Variable Rate - Mortgage Debt | 33,650 |
| 2.4 | % | 0.5 |
| |
Gross Assets(2) | 2,379,472 | | | | Variable Rate - Construction Debt | 73,605 |
| 2.3 | % | 1.9 |
| |
| Debt to Gross Assets | 22.9 | % | | | | Fixed Rate - 5 Yr. Unsecured Term Loan (6) | 65,000 |
| 3.0 | % | 3.0 |
| |
| | | | | | Fixed Rate - 7 Yr. Unsecured Term Loan (6) | 122,500 |
| 4.0 | % | 5.0 |
| |
| Net Debt to Enterprise Value | | | | | Fixed Rate - Unsecured Senior Notes | 250,000 |
| 4.6 | % | 8.9 |
| |
Net Debt(1) | $ | 404,365 |
| | | | Variable Rate - Unsecured Revolving Credit Facility | — |
| — | % | — |
| |
Market Equity(3) | 2,405,281 |
| | | | Debt(1) / Weighted Average | $ | 544,755 |
| 3.8 | % | 5.9 |
| |
| Enterprise Value | $ | 2,809,646 |
| | | | Less: Cash | 140,390 |
| | | |
| | | | | | Net Debt | $ | 404,365 |
| | | |
| Net Debt to Enterprise Value | 14.4% | | | | | | | | |
| | | | | | | | | | |
| | | | | | | | | | |
Interest Coverage (TTM)(4) | 6.3x | | | | | | | | |
Net Debt to EBITDA - Adjusted (TTM)(5) | 2.4x | | | | | | | | |
| Variable Rate Debt to Total Debt | 19.7% | | | | | | | | |
| | | | | | | | | | |
| | | | | | | | | | |
(1) Excludes unamortized debt premium of $0.6 million and unamortized deferred financing costs of $4.8 million. |
(2) Excludes accumulated depreciation of $271.0 million. |
(3) Market equity includes 1) 56,879,003 shares of the Company's common stock, 2) 293,394 Operating Partnership Units, which are convertible into common shares and 3) 6,325,000 shares issued in connection with the January 2016 follow on equity offering, and is calculated using $37.88 per share, the closing price of the Company's common stock on December 31, 2015. |
(4) Equals Adjusted EBITDA of $117.5 million divided by pro forma interest expense of $18.5 million. Pro forma interest expense represents actual TTM interest expense of $24.4 million less interest of $5.9 million on the fixed rate mortgage debt that was repaid. See page 24 for reconciliation to Adjusted EBITDA. |
(5) Net Debt to EBITDA - Adjusted is calculated to normalize the impact of non-producing construction debt. In the calculation, Net Debt is total debt (excluding the unamortized debt premium and deferred financing costs) less cash and excludes non-producing debt related to assets under development at time of calculation. EBITDA is Proforma Adjusted EBITDA, which includes proforma adjustments to reflect all acquisitions, development deliveries and dispositions as if such had occurred at the beginning of the 12 month period being presented. |
(6) The Trust entered into interest rate swaps to effectively fix the interest rate on the term loans. The weighted average interest rates reflect the swapped (fixed) rate plus the current margin. |
|
| | | |
| | UNSECURED SENIOR NOTE COVENANTS |
|
| | | | | | |
| as of December 31, 2015 | | | | |
| (Amounts in thousands) | | | | |
| | | | | |
Unsecured Senior Note Covenants(1) | Requirement | | Current Ratio | |
| Total Debt to Total Asset Value | ≤ 60% | | 28.4% | |
| Secured Debt to Total Asset Value | ≤ 40% | | 9.1% | |
| Unencumbered Asset Value to Unsecured Debt | > 150% | | 429.1% | |
| Interest Coverage | > 1.5x | | 4.14x | |
| | | | | |
| | | | | |
| Calculation of Interest Coverage Ratio: | | | | |
| Adjusted Pro Forma EBITDA: | | | | |
EdR Adjusted EBITDA(2) | $ | 117,484 |
| | | |
Pro forma Adjustments - acquisitions & dispositions (1) | 1,549 |
| | | |
| Total Adjusted Pro Forma EBITDA | $ | 119,033 |
|
| | |
| | | | | |
| Pro Forma Interest Expense: | | | | |
| Interest expense | $ | 24,449 |
| | | |
| Add back: Capitalized interest | 5,376 |
| | | |
| Pro forma adjustments | (1,062 | ) | | | |
| Pro forma interest expense | $ | 28,763 |
|
| | |
| | | | | |
| Interest Coverage | 4.14x |
| | | |
| | | | | |
(1) Computed in accordance with the First Supplemental Indenture filed November 24, 2014 with the SEC.
|
(2) See page 24 for a reconciliation to EdR Adjusted EBITDA. |
|
| | |
| RECONCILIATION OF NON-GAAP MEASURES |
|
| | | | | | | | | |
| (Amounts in thousands) | | | | | |
| | | For the Year Ended December 31, | |
| Adjusted EBITDA and Pro Forma Adjusted EBITDA: | | 2015 | | 2014 | |
| Net income attributable to common shareholders | | $ | 19,911 |
| | $ | 47,055 |
| |
| Straight line adjustment for ground leases | | 4,782 |
| | 4,835 |
| |
| Acquisition costs | | 293 |
| | 1,058 |
| |
| Depreciation and amortization | | 68,022 |
| | 58,974 |
| |
| Loss on impairment of collegiate housing assets | | — |
| | 12,733 |
| |
| Gain on sale of collegiate housing assets | | (2,770 | ) | | (33,231 | ) | |
| Gain on insurance settlement | | — |
| | (8,133 | ) | |
| Interest expense | | 24,449 |
| | 20,656 |
| |
| Amortization of deferred financing costs | | 2,089 |
| | 2,156 |
| |
| Interest income | | (213 | ) | | (190 | ) | |
| Interest on loan to participating development | | — |
| | (6,486 | ) | |
| Loss on extinguishment of debt | | 403 |
| | 3,543 |
| |
| Income tax expense | | 347 |
| | 261 |
| |
| Noncontrolling interests | | 171 |
| | 599 |
| |
| Adjusted EBITDA | | 117,484 |
| | 103,830 |
| |
Annualize acquisitions, developments and dispositions(1) | | 9,711 |
| | 13,446 |
| |
| Pro Forma Adjusted EBITDA | | $ | 127,195 |
| | $ | 117,276 |
| |
| | | | | | |
(1) Pro forma adjustment to reflect all acquisitions, development deliveries and dispositions as if such transactions had occurred on the first day of the period presented. |
|
| | | | | | | | |
| (Amounts in thousands, except share and per share data) | | Year ending December 31, 2016 |
| | | Low End | | High End |
| | | | | |
Net income attributable to EdR(1) | | $ | 22,450 |
| | $ | 26,200 |
|
| | | | | |
| Real estate related depreciation and amortization | | 68,000 |
| | 68,000 |
|
| Equity portion of real estate depreciation and amortization on equity investees | | 2,800 |
| | 2,800 |
|
| Noncontrolling interests | | 150 |
| | 200 |
|
| FFO | | $ | 93,400 |
| | $ | 97,200 |
|
| FFO adjustments: | | | | |
| Loss on extinguishment of debt | | 10,000 |
| | 10,000 |
|
Straight-line adjustment for ground leases(2) | | 4,500 |
| | 4,500 |
|
| FFO adjustments | | 14,500 |
| | 14,500 |
|
| | | | | |
| Core FFO | | $ | 107,900 |
| | $ | 111,700 |
|
| | | | | |
FFO per weighted average share/unit(3) | | $ | 1.47 |
| | $ | 1.53 |
|
| | | | | |
Core FFO per weighted average share/unit(3) | | $ | 1.70 |
| | $ | 1.76 |
|
| | | | | |
Weighted average shares/units(3) | | 63,600 |
| | 63,600 |
|
| | | | | |
Note: See page 26 for for details on guidance assumptions. | | | | |
| | | | | |
(1) Does not include any estimated gain or loss on the possible disposition of collegiate housing assets as gains or losses on the disposition of collegiate housing assets are excluded from FFO and Core FFO. |
(2) Represents the straight-line rent expense adjustment required by GAAP related to ground leases. As ground lease terms range from 40 to 99 years, the adjustment to straight-line these agreements becomes material to our operating results, distorting the economic results of the communities. |
(3) FFO and Core FFO per weighted average share/unit were computed using the weighted average of all shares and operating partnership units outstanding, regardless of their dilutive impact. |
|
| | | | | | | | | | | | | | | | | | | |
| (Amounts in thousands, except per share data) | | | | | | | | | | | |
| 2016 Guidance Assumptions |
| |
| Core FFO | | Development and Management Services | | | | |
| | Low | | High | | Change from 2015 (%) | | | Low | | High | |
| Core FFO - without potential Capital Transactions | $ | 112,600 |
| | $ | 117,000 |
| | | | Third-party development services revenue | $ | 1,000 |
| - | $ | 1,500 |
| |
| Per share/Unit | $ | 1.77 |
| | $ | 1.84 |
| | (3%) to 1% | | Third-party management services revenue | $ | 3,500 |
| - | $ | 3,500 |
| |
| Impact of Potential Capital Transactions | $ | (0.07 | ) | | $ | (0.08 | ) | | | | | | |
| |
| Core FFO Per Share/Unit | $ | 1.70 |
| | $ | 1.76 |
| | (4%) to (7%) | | | | | | |
| | | | | | G&A and Nonoperating Expenses |
| |
| |
| | | | Low | | High | |
| Community Net Operating Income Guidance Assumptions | | Interest expense, net of capitalized interest and including amortization of deferred financing costs | $19,000 | - | $20,000 | |
| | Low | | High | | | | Capitalized Interest - included in above | $6,500 | - | $7,000 | |
| Same-community revenue growth | 3.0% | - | 4.0% | | | | | | | | |
| Same-community operating expense growth | 2.5% | - | 3.5% | | | | General and administrative expenses (including management and development services) | $21,000 | - | $22,000 | |
| Same-community net operating income growth | 3.5% | - | 4.5% | |
| | Ground lease expense, excluding straight-line | $7,500 | |
| Same Community - Fall Revenue Growth | 2.5% | - | 3.5% | | | | Non-real estate depreciation | $2,000 | |
| | | | | | | | | | |
| New-communities: | | | | | | | Other | | |
| NOI on 2016 development deliveries | $ | 6,500 |
| | $ | 7,000 |
| | | | | Low | | High | |
NOI on 2015 developments and acquisitions (1) | $ | 18,000 |
| | $ | 18,500 |
| | | | Income tax expense | $400 | |
| Preopening expenses, included in above | $2,000 | | | | Equity in (losses) of unconsolidated entities (1) | $(300) | |
| | | | | | Core FFO depreciation add back related to unconsolidated entities above (1) | $2,800 | |
| Potential Capital Transactions | Dollar Volume | | | | | | |
| Acquisitions | $ | 75,000 |
| - | $ | 125,000 |
| | | | Full year weighted average shares | 63,600 | |
| Dispositions | $ | 150,000 |
| - | $ | 200,000 |
| | | | | | |
(1) The Marshall and Georgia Heights, delivered in 2014 and 2015 respectively, are not included in community NOI as they are not consolidated for financial statement purposes. The net income of these communities, which includes depreciation and interest, will be included in equity in earnings of unconsolidated entities with an FFO add back for depreciation. | |
|
| | |
| COMMUNITY LISTING - OWNED |
|
| | | | | | | | | | | | | | | | |
| Name | | Primary University Served | | Acquisition/Development Date | | # of Beds | | Name | | Primary University Served | | Acquisition/Development Date | | # of Beds |
| Players Club | | Florida State University | | Jan '05 | | 336 |
| | The Oaks on the Square | | University of Connecticut | | Aug '12, Aug '13 | | 503 |
|
| The Commons | | Florida State University | | Jan '05 | | 732 |
| | 3949 | | Saint Louis University | | Aug '13 | | 256 |
|
| University Towers | | North Carolina State University | | Jan '05 | | 889 |
| | Lymon T. Johnson Hall(3) | | University of Kentucky | | Aug '13 | | 301 |
|
| The Reserve on Perkins | | Oklahoma State University | | Jan '05 | | 732 |
| | Central Hall II (ONE Plan)(3) | | University of Kentucky | | Aug '13 | | 300 |
|
| The Pointe | | Pennsylvania State University | | Jan '05 | | 984 |
| | 2400 Nueces (ONE Plan) | | University of Texas at Austin | | Aug '13 | | 655 |
|
| The Lofts | | University of Central Florida | | Jan '05 | | 730 |
| | Roosevelt Point | | Arizona State University- Downtown Phoenix | | Aug '13 | | 609 |
|
| The Reserve at Athens | | University of Georgia | | Jan '05 | | 612 |
| | The Retreat at Oxford(4) | | University of Mississippi | | Aug '13 | | 668 |
|
| The Reserve at Columbia | | University of Missouri | | Jan '05 | | 676 |
| | The Retreat at State College | | Pennsylvania State University | | Sept '13 | | 587 |
|
| Commons at Knoxville | | University of Tennessee | | Jan '05 | | 708 |
| | The Cottages on Lindberg | | Purdue University | | Sept '13 | | 745 |
|
| Campus Creek | | University of Mississippi | | Feb '05 | | 636 |
| | The Varsity | | University of Michigan | | Dec '13 | | 415 |
|
| Campus Lodge | | University of Florida | | Jun '05 | | 1,115 |
| | | | Total Same-Communities(1) | | | | 22,718 |
|
| Carrollton Crossing | | University of West Georgia | | Jan '06 | | 336 |
| | | |
| | | |
|
| River Pointe | | University of West Georgia | | Jan '06 | | 504 |
| | The Lotus(1)(5) | | University of Colorado, Boulder | | Nov '11, Aug '14 | | 235 |
|
| The Reserve at Saluki Pointe | | Southern Illinois University | | Aug '08, Aug '09 | | 768 |
| | 605 West(1)(5) | | Duke University | | Aug '14 | | 384 |
|
| University Village on Colvin (ONE Plan) | | Syracuse University | | Aug '09 | | 432 |
| | 109 Tower(1)(5) | | Florida International University | | Aug '14 | | 542 |
|
| GrandMarc at The Corner | | University of Virginia | | Oct '10 | | 641 |
| | The Oaks on the Square- Ph III(1)(5) | | University of Connecticut | | Aug '14 | | 116 |
|
| Wertland Square | | University of Virginia | | Mar '11 | | 152 |
| | Champions Court I (ONE Plan)(3)(5) | | University of Kentucky | | Aug '14 | | 740 |
|
| Jefferson Commons | | University of Virginia | | Mar '11 | | 82 |
| | Champions Court II (ONE Plan)(3)(5) | | University of Kentucky | | Aug '14 | | 427 |
|
| The Berk on College | | University of California, Berkeley | | May '11 | | 122 |
| | Haggin Hall (ONE Plan)(3)(5) | | University of Kentucky | | Aug '14 | | 396 |
|
| The Berk on Arch | | University of California, Berkeley | | May '11 | | 43 |
| | Woodland Glen I (ONE Plan)(3)(5) | | University of Kentucky | | Aug '14 | | 409 |
|
| University Village Towers | | University of California, Riverside | | Sept '11 | | 554 |
| | Woodland Glen II (ONE Plan)(3)(5) | | University of Kentucky | | Aug '14 | | 409 |
|
| Irish Row | | University of Notre Dame | | Nov '11 | | 326 |
| | The District on Apache(1)(5) | | Arizona State University- Tempe | | Sept '14 | | 900 |
|
| GrandMarc at Westberry Place (ONE Plan) | | Texas Christian University | | Dec '11 | | 562 |
| | Commons on Bridge(2) | | University of Tennessee | | June '15 | | 150 |
|
| The Reserve on Stinson | | University of Oklahoma | | Jan '12 | | 612 |
| | Oaks on the Square- Ph IV(1) | | University of Connecticut | | Aug '15 | | 391 |
|
| Campus West (ONE Plan) | | Syracuse University | | Aug '12 | | 313 |
| | The Retreat at Louisville(1) | | University of Louisville | | Aug '15 | | 656 |
|
| East Edge | | University of Alabama | | Aug '12 | | 774 |
| | Woodland Glen III (ONE Plan)(3) | | University of Kentucky | | Aug '15 | | 782 |
|
| The Province | | East Carolina University | | Sept '12 | | 728 |
| | Woodland Glen IV (ONE Plan)(3) | | University of Kentucky | | Aug '15 | | 578 |
|
| The District on 5th | | University of Arizona | | Oct '12 | | 764 |
| | Woodland Glen V (ONE Plan)(3) | | University of Kentucky | | Aug '15 | | 250 |
|
| Campus Village | | Michigan State University | | Oct '12 | | 355 |
| | The Province Boulder(2) | | University of Colorado, Boulder | | Sept '15 | | 317 |
|
| The Province | | Kent State University | | Nov '12 | | 596 |
| | | | Total New-Communities | | | | 7,682 |
|
| The Suites at Overton Park | | Texas Tech University | | Dec '12 | | 465 |
| | | | Total Owned-Communities | | | | 30,400 |
|
| The Centre at Overton Park | | Texas Tech University | | Dec '12 | | 400 |
| | | | | | | | |
| | | | | | | | | | | | | |
(1) The same-community designation for leasing purposes is different than for financial reporting purposes. These communities are considered same-community for 2016/2017 leasing purposes, as the Company managed the leasing process for the 2015/2016 lease cycle and is currently managing the leasing process for the 2016/2017 lease cycle. Total same-community beds for leasing purposes is 24,673. |
(2) These properties are considered new for purposes of leasing, as we did not manage the leasing process for the 2015/2016 lease year. |
(3) The Kentucky communities, totaling 4,592 beds, are excluded from the leasing update on pages 11 and 12, as the assignment process does not occur until May. |
(4) The Retreat at Oxford will move into new-communities effective January 1, 2016 due to the construction of Phase II (see page 18). |
(5) These properties will move into same-communities effective January 1, 2016 for financial statement reporting purposes. |
|
| | | | |
| Executive Management | | | |
| | Randy Churchey | Chief Executive Officer | | |
| | Tom Trubiana | President | | |
| | Bill Brewer | Chief Financial Officer | | |
| | Christine Richards | Chief Operating Officer | | |
| | Lindsey Mackie | Chief Accounting Officer | | |
| | J. Drew Koester | Senior Vice President - Capital Markets and Investor Relations | |
| | | | | |
| Corporate Headquarters | | | |
| | EdR | | | |
| | 999 South Shady Grove Road, Suite 600 | | | |
| | Memphis, TN 38120 | | | |
| | (901) 259-2500 | | | |
| | | | | |
| Covering Analysts | | | |
| | Firm | Analyst | Contact # | Email |
| | Bank of America - Merrill | Jana Galan | (646) 855-3081 | jana.galan@baml.com |
| | CANACCORD|Genuity | Ryan Meliker | (212) 389-8094 | rmeliker@canaccordgenuity.com |
| | Green Street Advisors | Dave Bragg | (949) 706-8142 | dbragg@greenstreetadvisors.com |
| | Goldman Sachs | Andrew Rosivach | (212) 902-2796 | andrew.rosivach@gs.com |
| | Hilliard Lyons | Carol Kemple | (502) 588-1839 | ckemple@hilliard.com |
| | J.P. Morgan Securities Inc. | Anthony Paolone | (212) 622-6682 | anthony.paolone@jpmorgan.com |
| | JMP Securities | Aaron Hecht | (415) 835-3963 | ahecht@jmpsecurities.com |
| | KeyBanc Capital Markets | Jordan Sadler | (917) 368-2280 | jsadler@keybanccm.com |
| | RBC Capital Market | Wes Golladay | (440) 715-2650 | wes.golladay@rbccm.com |
| | Robert W Baird & Co. | Drew Babin | (215) 553-7816 | dbabin@rwbaird.com |
| | Sandler O'Neill + Partners, L.P. | Alex Goldfarb | (212) 466-7937 | agoldfarb@sandleroneill.com |
| | Stifel Nicolaus & Company Inc. | Rod Petrik | (443) 224-1306 | rpetrik@stifel.com |
| | UBS Securities | Ross Nussbaum | (212) 713-2484 | ross.nussbaum@ubs.com |
|
| |
| | |
| Design beds | Represents the sum of the monthly design beds in the portfolio during the period. |
| | |
| FFO | Funds from operations as defined by the National Association of Real Estate Investment Trusts. |
| | |
| GAAP | U.S. generally accepted accounting principles. |
| | |
| Net apartment rent per occupied bed (NarPOB) | Represents GAAP net apartment rent for the respective period divided by the sum of occupied beds in the portfolio for each month included in the period reported. |
| | |
| Net debt to EBITDA - adjusted | Net debt to EBITDA - adjusted is calculated to normalize the impact of non-producing construction debt. In the calculation, net debt is total debt less cash and excludes non-producing debt related to assets under development at time of calculation. EBITDA is Pro Forma Adjusted EBITDA, which includes proforma adjustments to reflect all acquisitions, dispositions and development assets that are open as if such had occurred at the beginning of the 12 month period being presented. |
| | |
| Operating expense per bed | Represents community-level operating expenses excluding management fees, depreciation and amortization. |
| | |
| Other income per available bed | Represents other GAAP-based income for the respective period divided by the sum of the design beds in the portfolio for each of the included months. Other income includes service/application fees, late fees, termination fees, parking fees, transfer fees, damage recovery, utility recovery, and other misc. |
| | |
| Physical occupancy | Represents a weighted average of the month end occupancies for each month included in the period reported. |
| | |
| Regional Definitions | Regions are defined as follows: Mid-Atlantic: North Carolina, Pennsylvania, Connecticut, New York, Virginia; Midwest: Oklahoma, Missouri; North: Michigan, Ohio, Indiana, Illinois; South Central: Texas, Tennessee, Mississippi, Kentucky; Southeast: Florida, Alabama, Georgia; West: Arizona, California, Colorado. |
| | |
| Revenue per occupied bed (RevPOB) | Represents total revenue (net apartment rent plus other income) for the respective period divided by the sum of occupied beds in the portfolio for each month included in the period reported. |
| | |
| Same community | Includes communities that have been owned for more than a year as of the beginning of the current fiscal year. |
Safe Harbor Statement under the Private Securities Litigation Reform Act of 1995
Statements about the Company’s business that are not historical facts are “forward-looking statements,” which relate to expectations, beliefs, projections, future plans and strategies, anticipated events or trends and similar expressions. In some cases, you can identify forward-looking statements by the use of forward-looking terminology such as “may,” “will,” “should,” “expects,” “intends,” “plans,” “anticipates,” “believes,” “estimates,” “predicts” or “potential” or the negative of these words and phrases or similar words or phrases which are predictions of or indicate future events or trends and which do not relate solely to historical matters. Forward-looking statements are based on current expectations. You should not rely on our forward-looking statements because the matters that they describe are subject to known and unknown risks and uncertainties that could cause the Company’s business, financial condition, liquidity, results of operations, Core FFO, FFO and prospects to differ materially from those expressed or implied by such statements. Such risks are set forth under the captions “Risk Factors,” “Forward-Looking Statements” and "Management’s Discussion and Analysis of Financial Condition and Results of Operations” (or similar captions) in our most recent Annual Report on Form 10-K and our quarterly reports on Form 10-Q, and as described in our other filings with the Securities and Exchange Commission. Forward-looking statements speak only as of the date on which they are made, and, except as otherwise may be required by law, the Company undertakes no obligation to update publicly or revise any guidance or other forward-looking statement, whether as a result of new information, future developments, or otherwise except as required by law.