Exhibit 99.3
Third Quarter 2005 Earnings Release November 2, 2005

Earnings Call Agenda
Introduction and Overview
– Chuck Raymond – President & Chief Executive Officer
Operations Review
– John Keenan – Senior Vice President & Chief Operating Officer
Financial Review
– Mark Urbania – Senior Vice President & Chief Financial Officer Questions and Answers
2 |
|
Third Quarter 2005 Earnings Release
Chuck Raymond
President & Chief Executive Officer
Forward Looking Statements
Risks, Uncertainties, Other Factors with Respect to “Forward-Looking Statements:
Certain statements contained in this presentation constitute “forward-looking statements” within the meaning of the Private Securities Litigation Reform Act of 1995. Such statements that are not of historical fact constitute “forward-looking statements” and, accordingly, involve estimates, assumptions, judgments and uncertainties. There are a number of factors that could cause actual results or outcomes to differ materially from those addressed in the “forward-looking statements”. Such factors are detailed in the Horizon Lines, Inc.’s final prospectus filed with the Securities and Exchange Commission on September 26, 2005.
4 |
|
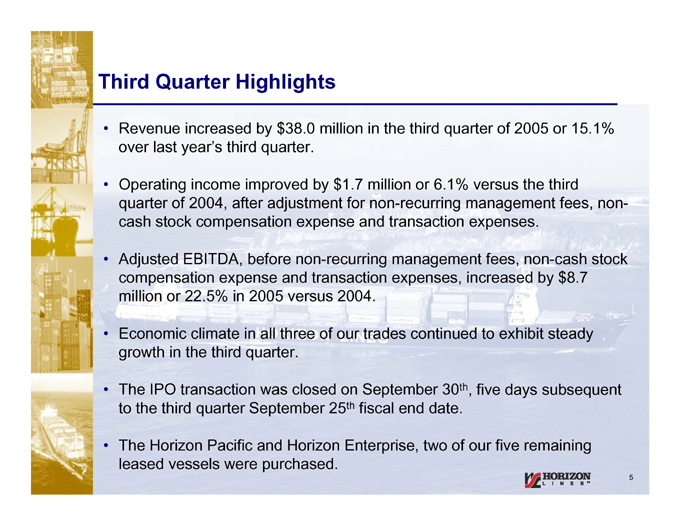
Third Quarter Highlights
Revenue increased by $38.0 million in the third quarter of 2005 or 15.1% over last year’s third quarter.
Operating income improved by $1.7 million or 6.1% versus the third quarter of 2004, after adjustment for non-recurring management fees, non-cash stock compensation expense and transaction expenses.
Adjusted EBITDA, before non-recurring management fees, non-cash stock compensation expense and transaction expenses, increased by $8.7 million or 22.5% in 2005 versus 2004.
Economic climate in all three of our trades continued to exhibit steady growth in the third quarter.
The IPO transaction was closed on September 30th, five days subsequent to the third quarter September 25th fiscal end date.
The Horizon Pacific and Horizon Enterprise, two of our five remaining leased vessels were purchased.
5 |
|
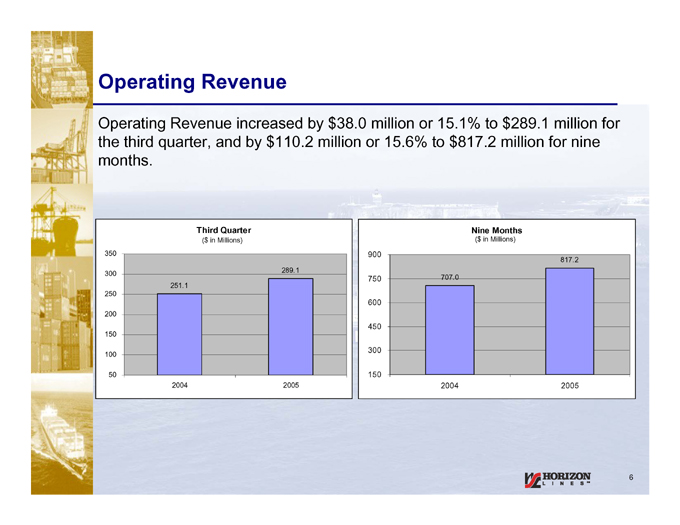
Operating Revenue
Operating Revenue increased by $38.0 million or 15.1% to $289.1 million for the third quarter, and by $110.2 million or 15.6% to $817.2 million for nine months.
Third Quarter
($in Millions)
350 300 250 200 150 100 50
251.1
289.1
2004
2005
Nine Months
($in Millions)
900 750 600 450 300 150
707.0
2004
817.2
2005
6 |
|
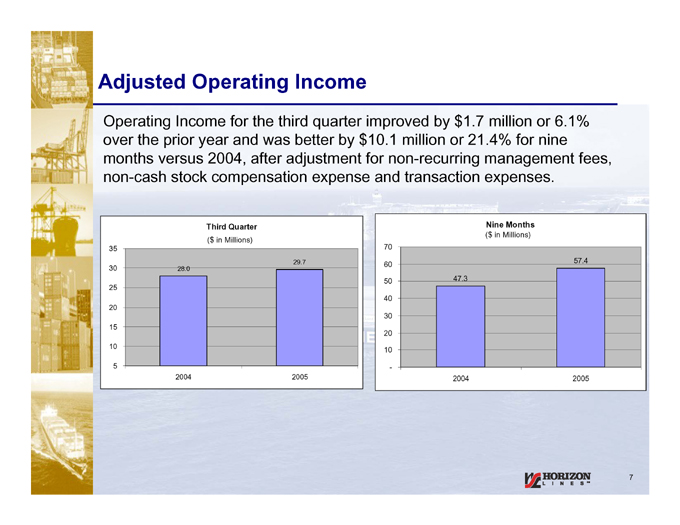
Adjusted Operating Income
Operating Income for the third quarter improved by $1.7 million or 6.1% over the prior year and was better by $10.1 million or 21.4% for nine months versus 2004, after adjustment for non-recurring management fees, non-cash stock compensation expense and transaction expenses.
Third Quarter
($in Millions)
35 30 25 20 15 10 5
28.0
2004
29.7
2005
Nine Months
($in Millions)
70 60 50 40 30 20 10 -
47.3
2004
57.4
2005
7 |
|

Adjusted EBITDA
Adjusted EBITDA(1) increased by $8.7 million or 22.5% in the third quarter and $25.8 million or 30.9% for nine months, after adjustment for non-recurring management fees, stock compensation and transaction expenses.
Third Quarter
($in Millions)
60 50 40 30 20 10 0
38.7
2004
47.4
2005
Nine Months
($in Millions)
(1) |
| See reconciliation of Net Income to Adjusted EBITDA on page 26. |
8 |
|
120 100 80 60 40 20 -
83.6
2004
109.4
2005
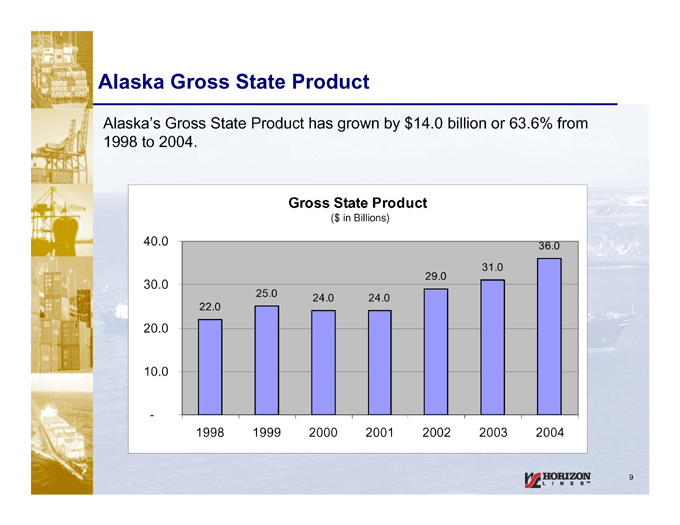
Alaska Gross State Product
Alaska’s Gross State Product has grown by $14.0 billion or 63.6% from 1998 to 2004.
Gross State Product
($in Billions)
40.0 30.0 20.0 10.0 -
22.0
25.0
24.0
24.0
29.0
31.0
36.0
1998 1999 2000 2001 2002 2003 2004
9
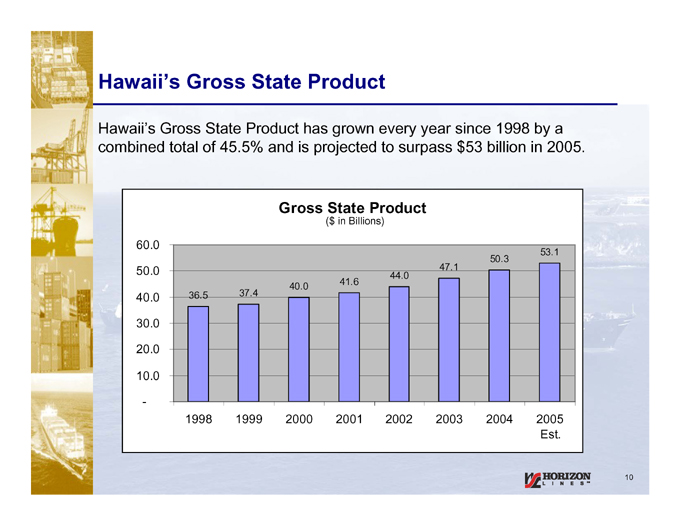
Hawaii’s Gross State Product
Hawaii’s Gross State Product has grown every year since 1998 by a combined total of 45.5% and is projected to surpass $53 billion in 2005.
Gross State Product
($in Billions)
60.0 50.0 40.0 30.0 20.0 10.0 -
36.5
37.4
40.0
41.6
44.0
47.1
50.3
53.1
1998 1999 2000 2001 2002 2003 2004 2005 Est.
10
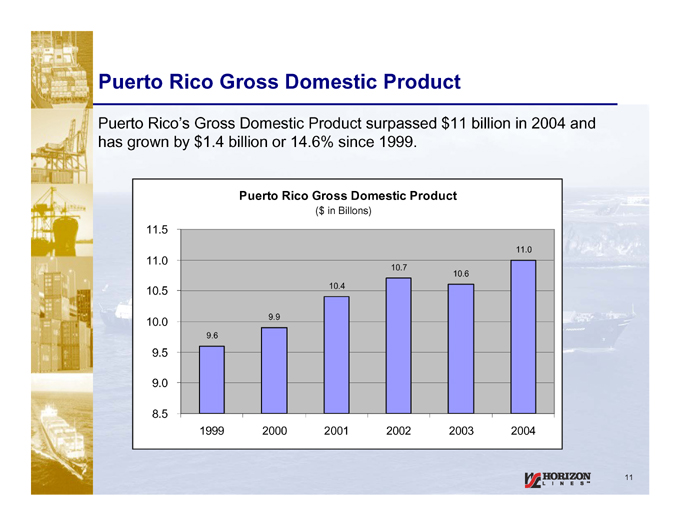
Puerto Rico Gross Domestic Product
Puerto Rico’s Gross Domestic Product surpassed $11 billion in 2004 and has grown by $1.4 billion or 14.6% since 1999.
Puerto Rico Gross Domestic Product
($in Billons)
11.5 11.0 10.5 10.0 9.5 9.0 8.5
9.6
9.9
10.4
10.7
10.6
11.0
1999 2000 2001 2002 2003 2004
11
Third Quarter 2005 Earnings Release
John Keenan
Senior Vice President & Chief Operating Officer
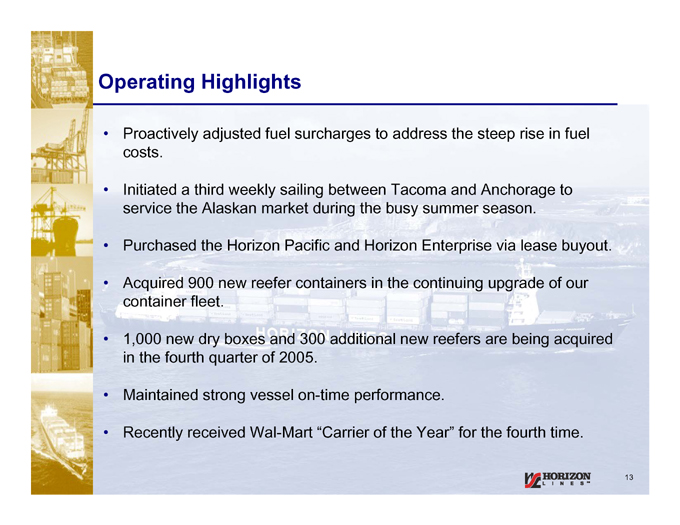
Operating Highlights
Proactively adjusted fuel surcharges to address the steep rise in fuel costs.
Initiated a third weekly sailing between Tacoma and Anchorage to service the Alaskan market during the busy summer season.
Purchased the Horizon Pacific and Horizon Enterprise via lease buyout.
Acquired 900 new reefer containers in the continuing upgrade of our container fleet.
1,000 new dry boxes and 300 additional new reefers are being acquired in the fourth quarter of 2005.
Maintained strong vessel on-time performance.
Recently received Wal-Mart “Carrier of the Year” for the fourth time.
13
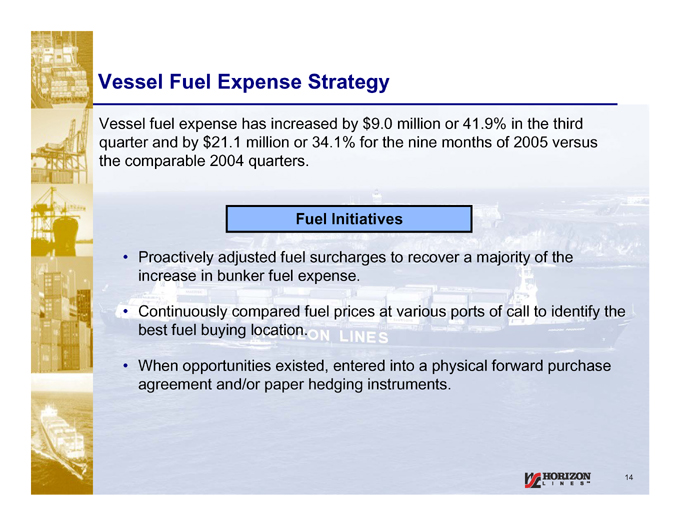
Vessel Fuel Expense Strategy
Vessel fuel expense has increased by $9.0 million or 41.9% in the third quarter and by $21.1 million or 34.1% for the nine months of 2005 versus the comparable 2004 quarters.
Fuel Initiatives
Proactively adjusted fuel surcharges to recover a majority of the increase in bunker fuel expense.
Continuously compared fuel prices at various ports of call to identify the best fuel buying location.
When opportunities existed, entered into a physical forward purchase agreement and/or paper hedging instruments.
14
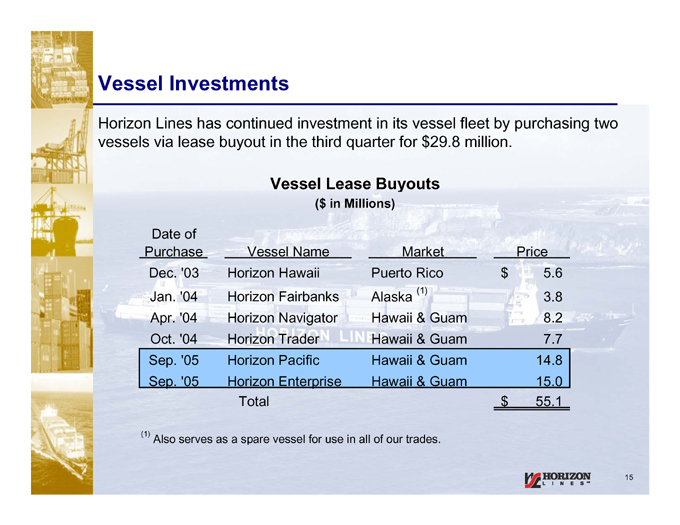
Vessel Investments
Horizon Lines has continued investment in its vessel fleet by purchasing two vessels via lease buyout in the third quarter for $29.8 million.
Vessel Lease Buyouts
($in Millions)
Date |
| of |
Purchase Vessel Name Market Price
Dec. ‘03 Horizon Hawaii Puerto Rico $5.6
Jan. ‘04 Horizon Fairbanks Alaska (1) 3.8
Apr. ‘04 Horizon Navigator Hawaii & Guam 8.2
Oct. ‘04 Horizon Trader Hawaii & Guam 7.7
Sep. ‘05 Horizon Pacific Hawaii & Guam 14.8
Sep. ‘05 Horizon Enterprise Hawaii & Guam 15.0
Total $55.1
(1) |
| Also serves as a spare vessel for use in all of our trades. |
15
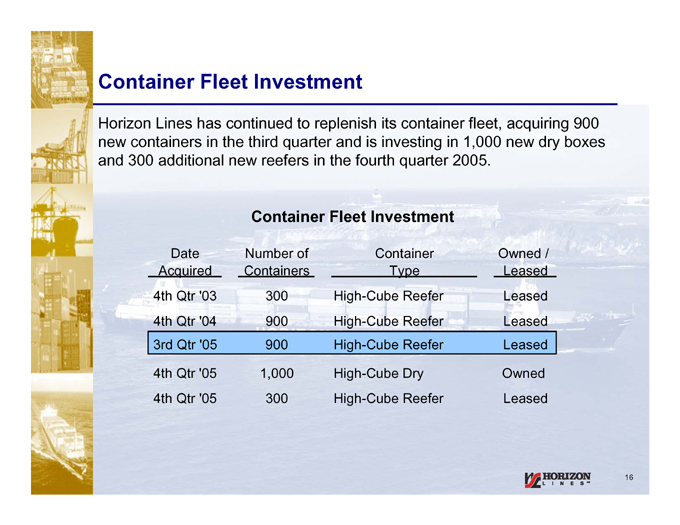
Container Fleet Investment
Horizon Lines has continued to replenish its container fleet, acquiring 900 new containers in the third quarter and is investing in 1,000 new dry boxes and 300 additional new reefers in the fourth quarter 2005.
Container Fleet Investment
Date |
| Number of Container Owned / |
Acquired Containers Type Leased
4th Qtr ‘03 300 High-Cube Reefer Leased
4th Qtr ‘04 900 High-Cube Reefer Leased
3rd Qtr ‘05 900 High-Cube Reefer Leased
4th Qtr ‘05 1,000 High-Cube Dry Owned
4th Qtr ‘05 300 High-Cube Reefer Leased
16
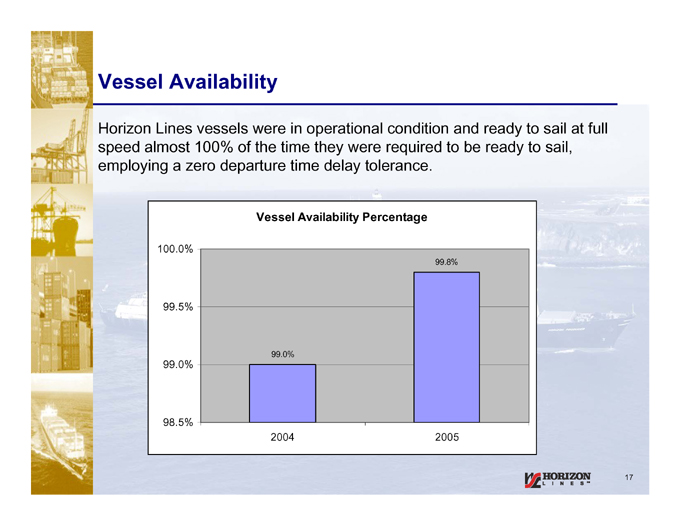
Vessel Availability
Horizon Lines vessels were in operational condition and ready to sail at full speed almost 100% of the time they were required to be ready to sail, employing a zero departure time delay tolerance.
Vessel Availability Percentage
100.0% 99.5% 99.0% 98.5%
99.0%
2004
99.8%
2005
17
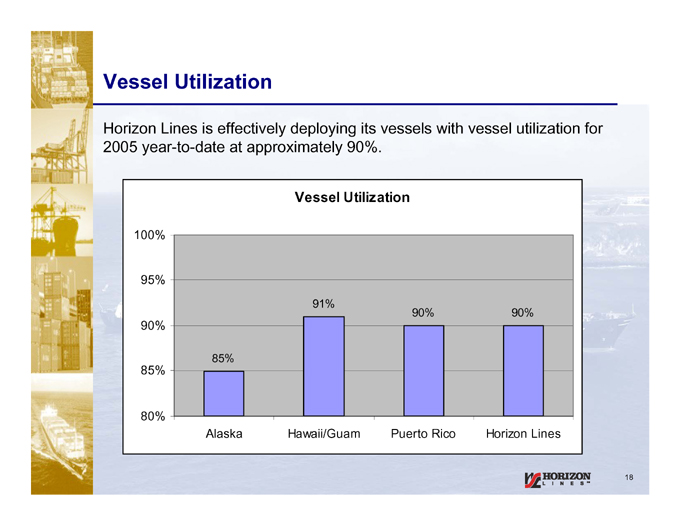
Vessel Utilization
Horizon Lines is effectively deploying its vessels with vessel utilization for 2005 year-to-date at approximately 90%.
Vessel Utilization
100% 95% 90% 85% 80%
85%
91%
90%
90%
Alaska Hawaii/Guam Puerto Rico Horizon Lines
18
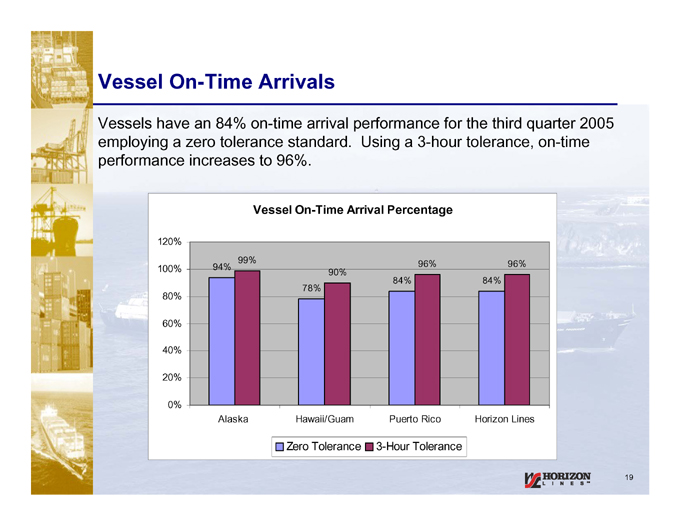
Vessel On-Time Arrivals
Vessels have an 84% on-time arrival performance for the third quarter 2005 employing a zero tolerance standard. Using a 3-hour tolerance, on-time performance increases to 96%.
Vessel On-Time Arrival Percentage
120% 100% 80%
60%
40%
20%
0%
94% 99%
90% 78%
96% 84%
96% 84%
Alaska Hawaii/Guam Puerto Rico Horizon Lines
Zero Tolerance 3-Hour Tolerance
19

Third Quarter 2005 Earnings Release
M. Mark Urbania
Senior Vice President & Chief Financial Officer
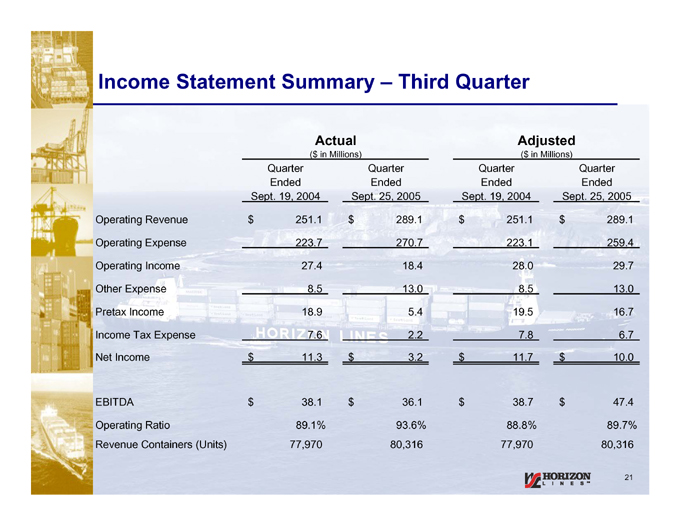
Income Statement Summary – Third Quarter
Actual Adjusted
($in Millions) ($in Millions)
Quarter Quarter Quarter Quarter
Ended Ended Ended Ended
Sept. 19, 2004 Sept. 25, 2005 Sept. 19, 2004 Sept. 25, 2005
Operating Revenue $251.1 $289.1 $251.1 $289.1
Operating Expense 223.7 270.7 223.1 259.4
Operating Income 27.4 18.4 28.0 29.7
Other Expense 8.5 13.0 8.5 13.0
Pretax Income 18.9 5.4 19.5 16.7
Income Tax Expense 7.6 2.2 7.8 6.7
Net Income $11.3 $3.2 $11.7 $10.0
EBITDA $38.1 $36.1 $38.7 $47.4
Operating Ratio 89.1% 93.6% 88.8% 89.7%
Revenue Containers (Units) 77,970 80,316 77,970 80,316
21
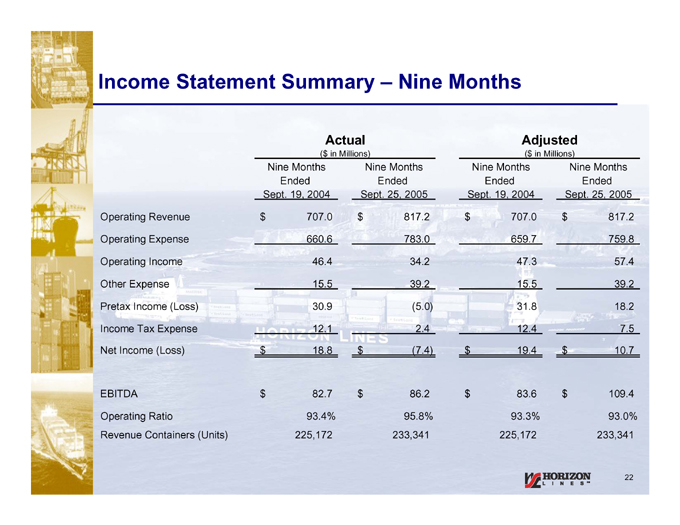
Income Statement Summary – Nine Months
Actual Adjusted
($in Millions) ($in Millions)
Nine Months Nine Months Nine Months Nine Months
Ended Ended Ended Ended
Sept. 19, 2004 Sept. 25, 2005 Sept. 19, 2004 Sept. 25, 2005
Operating Revenue $707.0 $817.2 $707.0 $817.2
Operating Expense 660.6 783.0 659.7 759.8
Operating Income 46.4 34.2 47.3 57.4
Other Expense 15.5 39.2 15.5 39.2
Pretax Income (Loss) 30.9 (5.0) 31.8 18.2
Income Tax Expense 12.1 2.4 12.4 7.5
Net Income (Loss) $18.8 $(7.4) $19.4 $10.7
EBITDA $82.7 $86.2 $83.6 $109.4
Operating Ratio 93.4% 95.8% 93.3% 93.0%
Revenue Containers (Units) 225,172 233,341 225,172 233,341
22
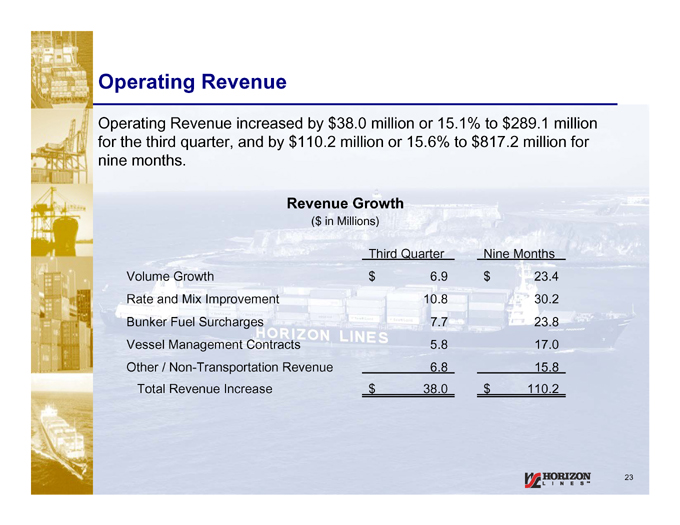
Operating Revenue
Operating Revenue increased by $38.0 million or 15.1% to $289.1 million for the third quarter, and by $110.2 million or 15.6% to $817.2 million for nine months.
Revenue Growth
($in Millions)
Third Quarter Nine Months
Volume Growth $6.9 $23.4
Rate and Mix Improvement 10.8 30.2
Bunker Fuel Surcharges 7.7 23.8
Vessel Management Contracts 5.8 17.0
Other / Non-Transportation Revenue 6.8 15.8
Total Revenue Increase $38.0 $110.2
23
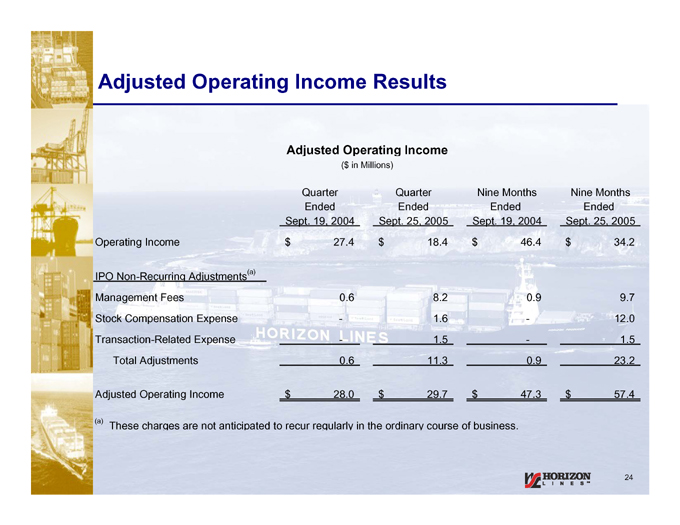
Adjusted Operating Income Results
Adjusted Operating Income
($in Millions)
Quarter Quarter Nine Months Nine Months
Ended Ended Ended Ended
Sept. 19, 2004 Sept. 25, 2005 Sept. 19, 2004 Sept. 25, 2005
Operating Income $27.4 $18.4 $46.4 $34.2
IPO Non-Recurring Adjustments(a)
Management Fees 0.6 8.2 0.9 9.7
Stock Compensation Expense—1.6—12.0
Transaction-Related Expense—1.5—1.5
Total Adjustments 0.6 11.3 0.9 23.2
Adjusted Operating Income $28.0 $29.7 $47.3 $57.4
(a) These charges are not anticipated to recur regularly in the ordinary course of business.
24
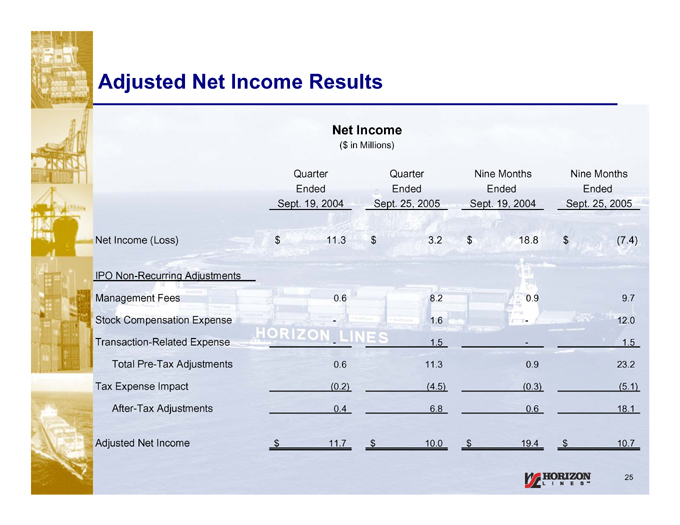
Adjusted Net Income Results
Net Income
($in Millions)
Quarter Quarter Nine Months Nine Months
Ended Ended Ended Ended
Sept. 19, 2004 Sept. 25, 2005 Sept. 19, 2004 Sept. 25, 2005
Net Income (Loss) $11.3 $3.2 $18.8 $(7.4)
IPO Non-Recurring Adjustments
Management Fees 0.6 8.2 0.9 9.7
Stock Compensation Expense—1.6—12.0
Transaction-Related Expense—1.5—1.5
Total Pre-Tax Adjustments 0.6 11.3 0.9 23.2
Tax Expense Impact (0.2) (4.5) (0.3) (5.1)
After-Tax Adjustments 0.4 6.8 0.6 18.1
Adjusted Net Income $11.7 $10.0 $19.4 $10.7
25
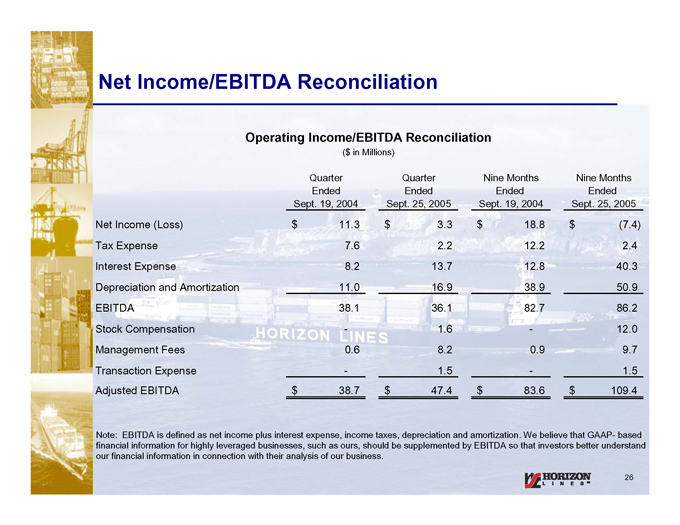
Net Income/EBITDA Reconciliation
Operating Income/EBITDA Reconciliation
($in Millions)
Quarter Quarter Nine Months Nine Months
Ended Ended Ended Ended
Sept. 19, 2004 Sept. 25, 2005 Sept. 19, 2004 Sept. 25, 2005
Net Income (Loss) $11.3 $3.3 $18.8 $(7.4)
Tax Expense 7.6 2.2 12.2 2.4
Interest Expense 8.2 13.7 12.8 40.3
Depreciation and Amortization 11.0 16.9 38.9 50.9
EBITDA 38.1 36.1 82.7 86.2
Stock Compensation—1.6—12.0
Management Fees 0.6 8.2 0.9 9.7
Transaction Expense—1.5—1.5
Adjusted EBITDA $38.7 $47.4 $83.6 $109.4
Note: EBITDA is defined as net income plus interest expense (net of interest income), income taxes, depreciation and amortization. We believe that GAAP-based financial information for highly leveraged businesses, such as ours, should be supplemented by EBITDA so that investors better understand our financial information in connection with their analysis of our business.
26
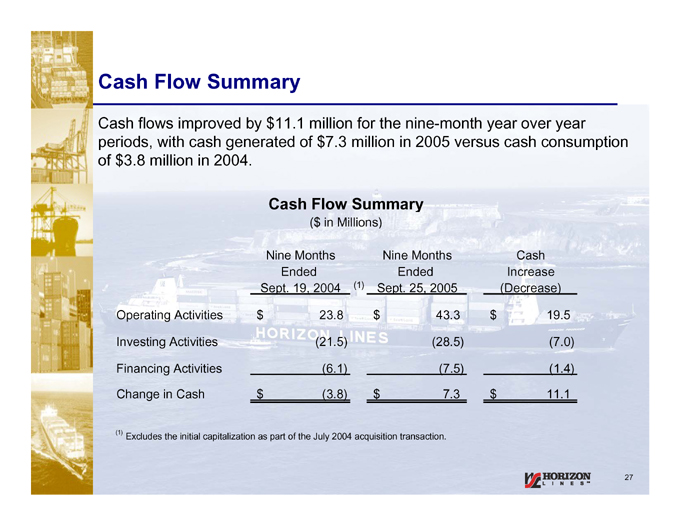
Cash Flow Summary
Cash flows improved by $11.1 million for the nine-month year over year periods, with cash generated of $7.3 million in 2005 versus cash consumption of $3.8 million in 2004.
Cash Flow Summary
($in Millions)
Nine |
| Months Nine Months Cash |
Ended |
| Ended Increase |
Sept. |
| 19, 2004 (1) Sept. 25, 2005 (Decrease) |
Operating |
| Activities $23.8 $43.3 $19.5 |
Investing |
| Activities (21.5) (28.5) (7.0) |
Financing |
| Activities (6.1) (7.5) (1.4) |
Change |
| in Cash $(3.8) $7.3 $11.1 |
(1) |
| Excludes the initial capitalization as part of the July 2004 acquisition transaction. |
27
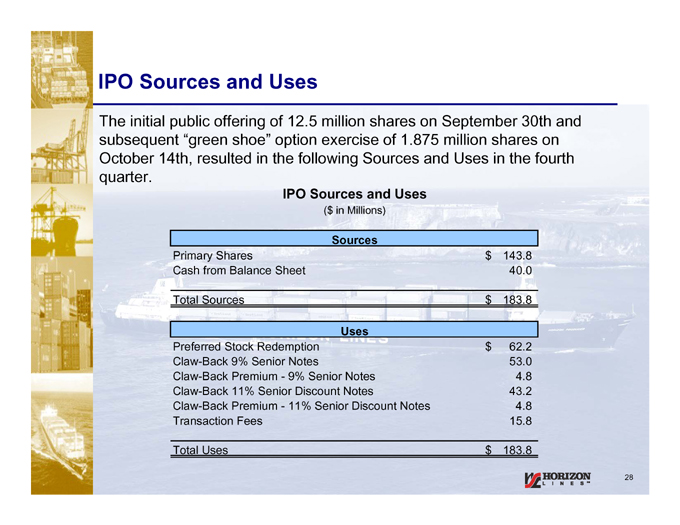
IPO Sources and Uses
The initial public offering of 12.5 million shares on September 30th and subsequent “green shoe” option exercise of 1.875 million shares on October 14th, resulted in the following Sources and Uses in the fourth quarter.
IPO Sources and Uses
($in Millions)
Sources |
|
Primary |
| Shares $143.8 |
Cash |
| from Balance Sheet 40.0 |
Total |
| Sources $183.8 |
Uses |
|
Preferred |
| Stock Redemption $62.2 |
Claw-Back |
| 9% Senior Notes 53.0 |
Claw-Back |
| Premium—9% Senior Notes 4.8 |
Claw-Back |
| 11% Senior Discount Notes 43.2 |
Claw-Back |
| Premium—11% Senior Discount Notes 4.8 |
Transaction |
| Fees 15.8 |
Total |
| Uses $183.8 |
28
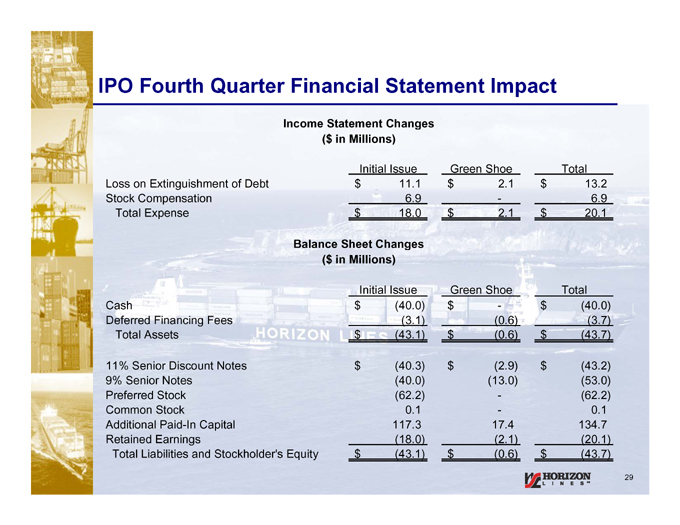
IPO Fourth Quarter Financial Statement Impact
Income Statement Changes ($in Millions)
Initial Issue Green Shoe Total
Loss on Extinguishment of Debt $11.1 $2.1 $13.2
Stock Compensation 6.9—6.9
Total Expense $18.0 $2.1 $20.1
Balance Sheet Changes
($in Millions)
Initial Issue Green Shoe Total
Cash $(40.0) $- $(40.0)
Deferred Financing Fees (3.1) (0.6) (3.7)
Total Assets $(43.1) $(0.6) $(43.7)
11% Senior Discount Notes $(40.3) $(2.9) $(43.2)
9% Senior Notes (40.0) (13.0) (53.0)
Preferred Stock (62.2)—(62.2)
Common Stock 0.1—0.1
Additional Paid-In Capital 117.3 17.4 134.7
Retained Earnings (18.0) (2.1) (20.1)
Total Liabilities and Stockholder’s Equity $(43.1) $(0.6) $(43.7)
29
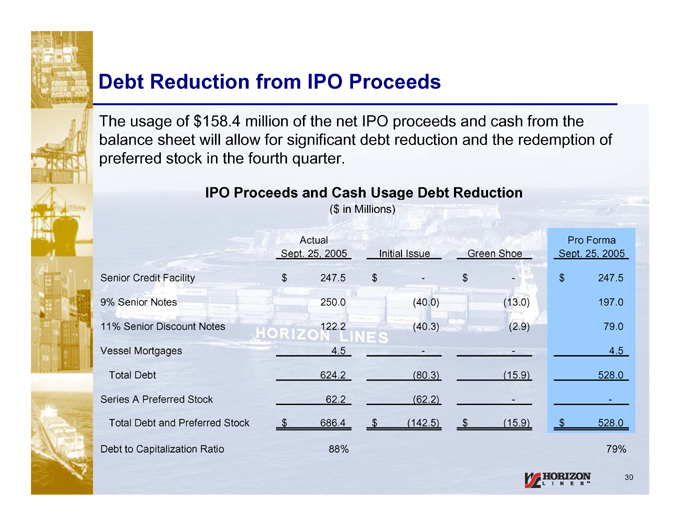
Debt Reduction from IPO Proceeds
The usage of $158.4 million of the net IPO proceeds and cash from the balance sheet will allow for significant debt reduction and the redemption of preferred stock in the fourth quarter.
IPO Proceeds and Cash Usage Debt Reduction
($in Millions)
Actual |
| Pro Forma |
Sept. |
| 25, 2005 Initial Issue Green Shoe Sept. 25, 2005 |
Senior |
| Credit Facility $247.5 $- $- $247.5 |
9% |
| Senior Notes 250.0 (40.0) (13.0) 197.0 |
11% |
| Senior Discount Notes 122.2 (40.3) (2.9) 79.0 |
Vessel |
| Mortgages 4.5—- 4.5 |
Total |
| Debt 624.2 (80.3) (15.9) 528.0 |
Series |
| A Preferred Stock 62.2 (62.2)—- |
Total |
| Debt and Preferred Stock $686.4 $(142.5) $(15.9) $528.0 |
Debt |
| to Capitalization Ratio 88% 79% |
30

Third Quarter 2005 Earnings Release
Questions and Answers