 Fourth Quarter 2005 Earnings Release February 24, 2006 Exhibit 99.3 |
 2 Earnings Call Agenda Introduction and Overview – Chuck Raymond – President & Chief Executive Officer 2006 Tradelane Outlook – John Handy – Executive Vice President Operations Review – John Keenan – Senior Vice President & Chief Transportation Officer Financial Review – Mark Urbania – Senior Vice President & Chief Financial Officer Questions and Answers |
 3 Forward Looking Statements Risks, Uncertainties, Other Factors with Respect to “Forward-Looking Statements:” Certain statements contained in this presentation constitute “forward- looking statements” within the meaning of the Private Securities Litigation Reform Act of 1995. Such statements that are not of historical fact constitute “forward-looking statements” and, accordingly, involve estimates, assumptions, judgments and uncertainties. There are a number of factors that could cause actual results or outcomes to differ materially from those addressed in the “forward-looking statements”. Such factors are detailed in the Horizon Lines, Inc.’s final prospectus filed with the Securities and Exchange Commission on September 26, 2005. |
 4 Fourth Quarter 2005 Earnings Release Chuck Raymond President & Chief Executive Officer Introduction and Overview |
 5 Fourth Quarter Highlights Terrific year for Horizon Lines Record operating revenue and earnings Significant vessel and container fleet investments Senior management team further strengthened Company again recognized for service excellence |
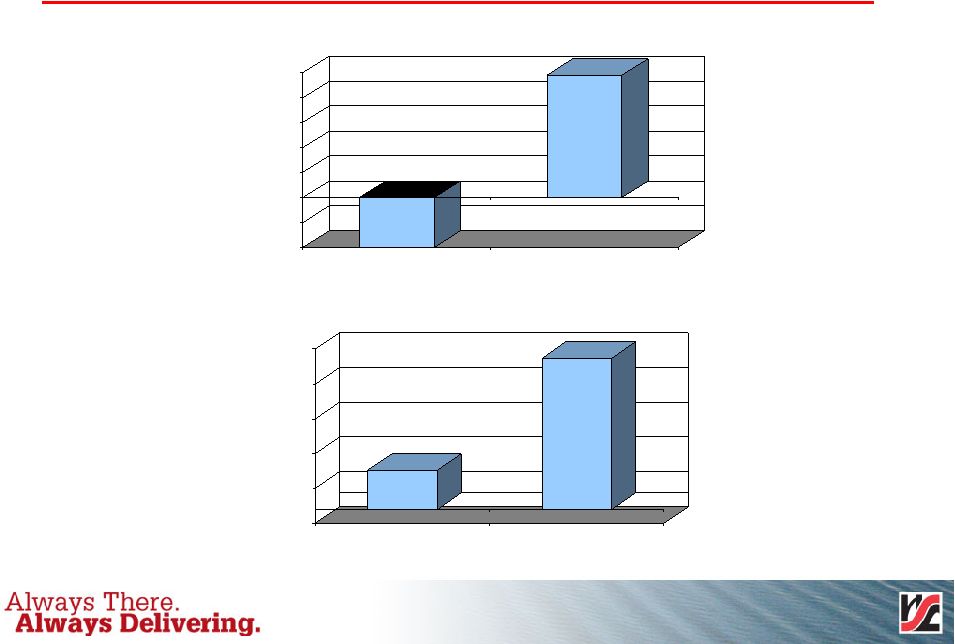
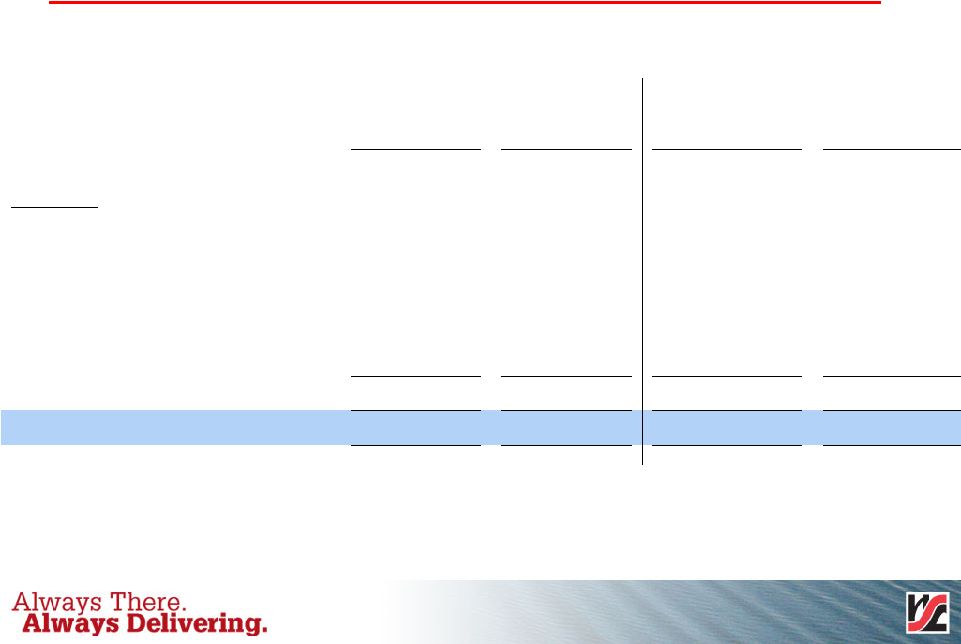
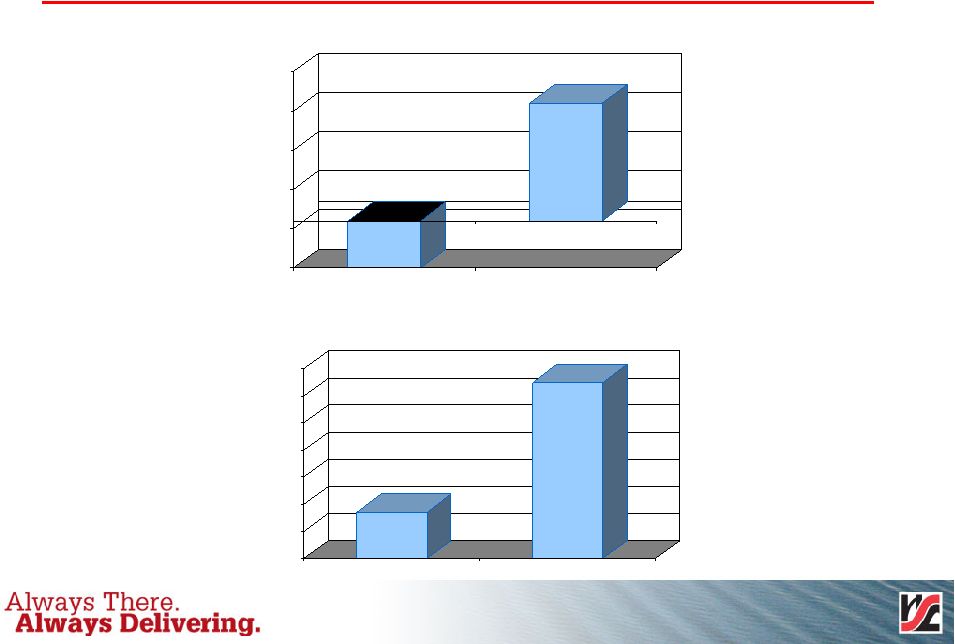 6 Adjusted EPS -0.06 0.15 -0.06 -0.01 0.04 0.09 0.14 0.19 2004 2005 Fourth Quarter 0.17 0.65 0.00 0.10 0.20 0.30 0.40 0.50 0.60 0.70 2004 2005 Year |
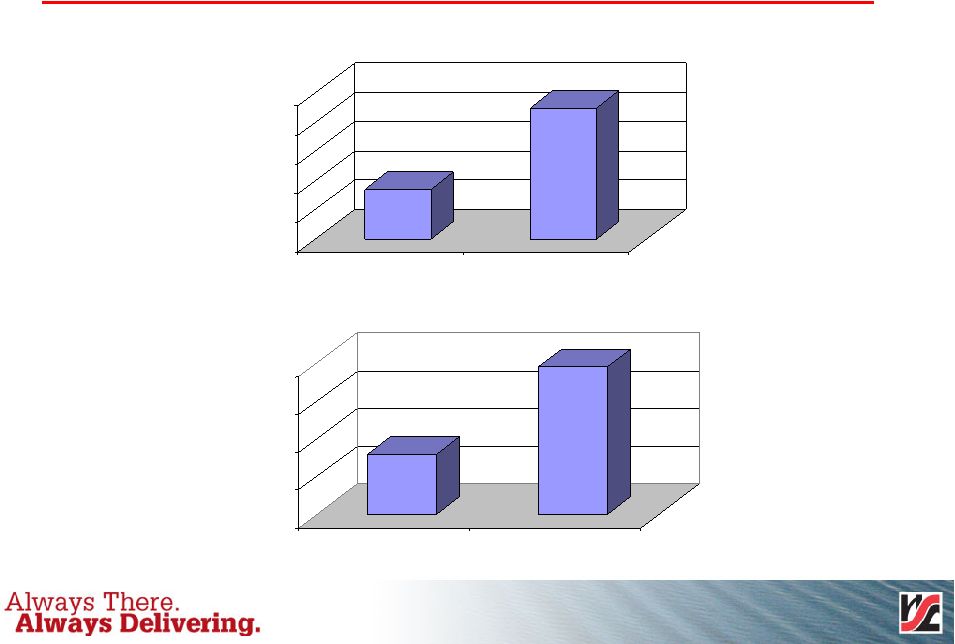 7 273.4 279.0 270.0 272.0 274.0 276.0 278.0 280.0 2004 2005 Fourth Quarter Operating Revenue ($ in Millions) ($ in Millions) 980.3 1,096.2 900.0 950.0 1,000.0 1,050.0 1,100.0 2004 2005 Year |
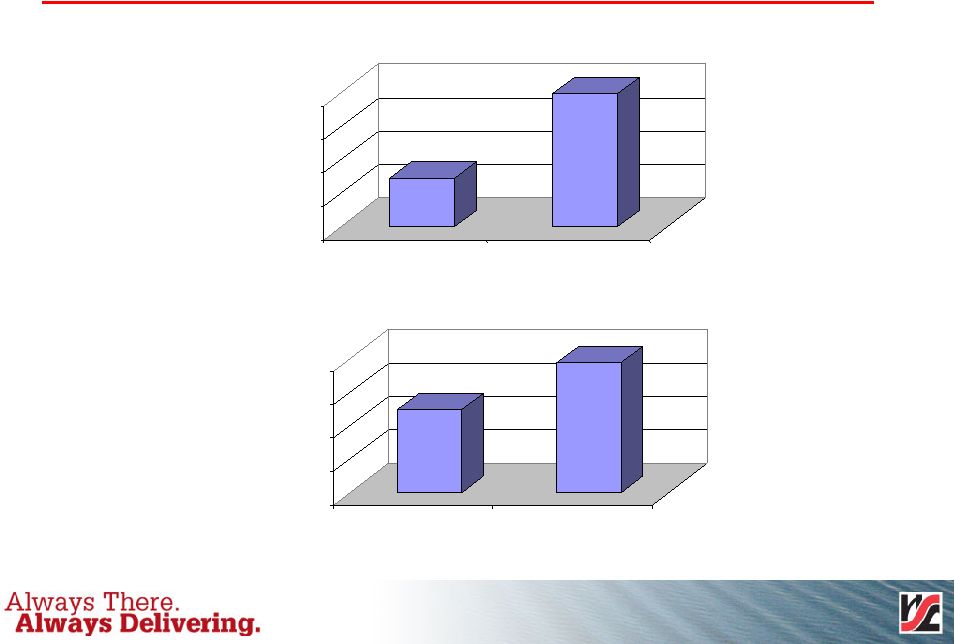 8 Adjusted Operating Income (1) (1) See reconciliation of Operating Income to Adjusted Operating Income on page 28. 49.4 77.8 - 20.0 40.0 60.0 80.0 2004 2005 Year 7.3 20.0 - 5.0 10.0 15.0 20.0 2004 2005 Fourth Quarter |
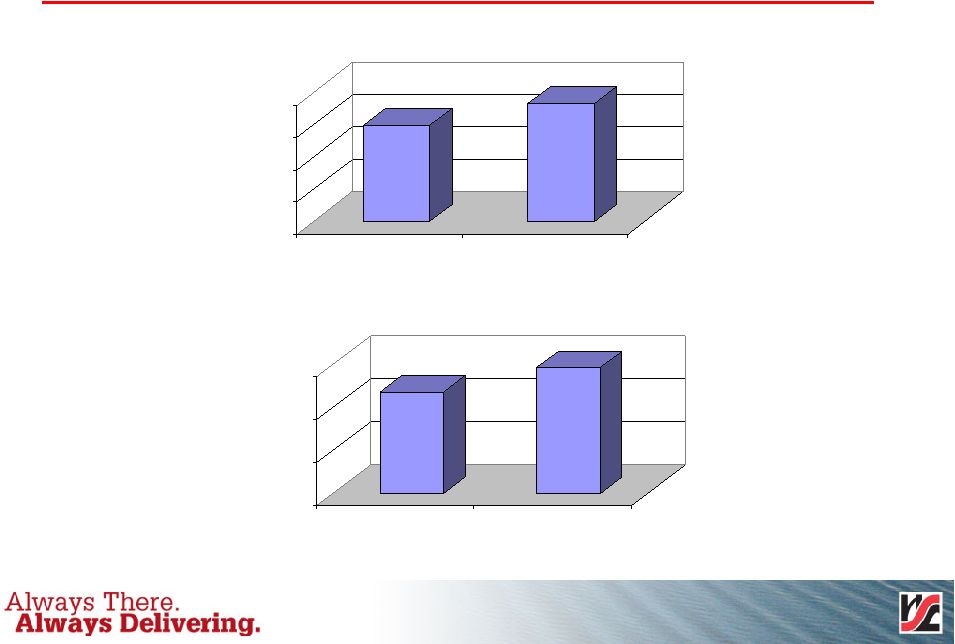 9 118.3 146.4 - 50.0 100.0 150.0 2004 2005 Year 29.9 36.6 0 10 20 30 40 2004 2005 Fourth Quarter Adjusted EBITDA (1) (1) See reconciliation of Net Income to Adjusted EBITDA on page 30. ($ in Millions) ($ in Millions) |
 10 -2.0 4.9 -2.0 -1.0 0.0 1.0 2.0 3.0 4.0 5.0 2004 2005 Fourth Quarter 5.6 21.7 -2.0 3.0 8.0 13.0 18.0 23.0 2004 2005 Year Adjusted Net Income (1) (1) See reconciliation of Net Income to Adjusted Net Income on page 29. ($ in Millions) ($ in Millions) |
 11 Fourth Quarter 2005 Earnings Release John Handy Executive Vice President 2006 Tradelane Outlook |
 12 Alaska 2006 Outlook Strong fishing industry Robust military construction spending Growing tourism industry Permanent fund assets total over $30 billion Oil based economy |
 13 Hawaii 2006 Outlook 2.0% job growth Nation’s lowest unemployment Record tourism growth Robust military spending Positive construction outlook |
 14 Puerto Rico 2006 Outlook Slower GNP growth Continued pharmaceutical and technology investment High pharmaceutical output per employee |
 15 Fourth Quarter 2005 Earnings Release John Keenan Senior Vice President & Chief Transportation Officer Operations Overview |
 16 Operating Highlights Implemented fuel initiatives Acquired new containers Record vessel availability High vessel utilization rate Excellent on-time arrival performance Service excellence awards |
 17 Vessel Fuel Expense Strategy Fuel Initiatives Fuel surcharges Best fuel buying location Focus on fuel consumption |
 18 Investments Vessel and Container Investments 3,400 12/03 – 12/05 Containers 6 12/03 – 9/05 Vessel Lease Buyouts Number Dates Acquired Assets |
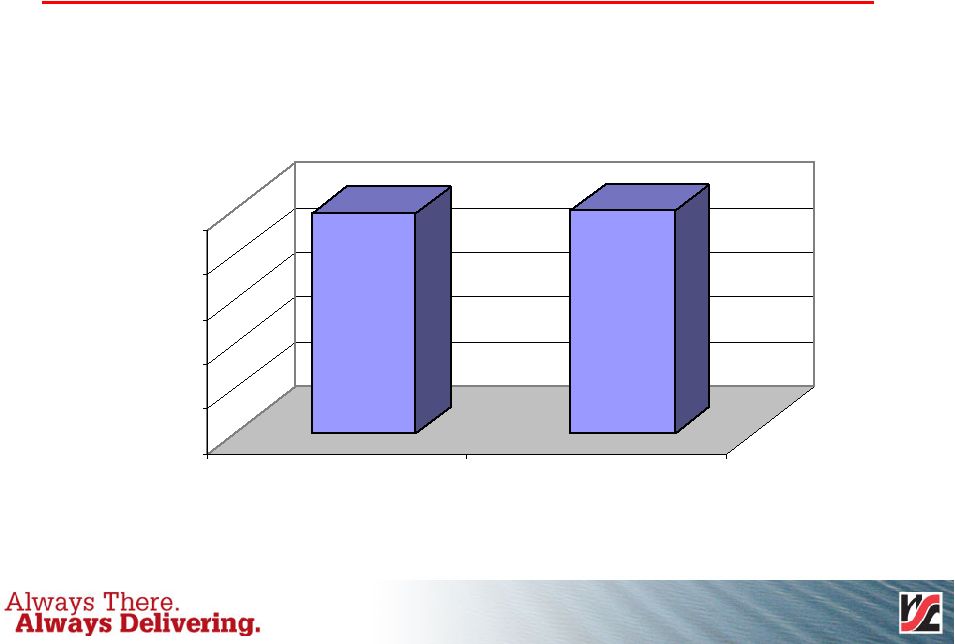 19 Vessel Availability 99.0% 99.8% 0.0% 20.0% 40.0% 60.0% 80.0% 100.0% 2004 2005 Vessel Availability Percentage |
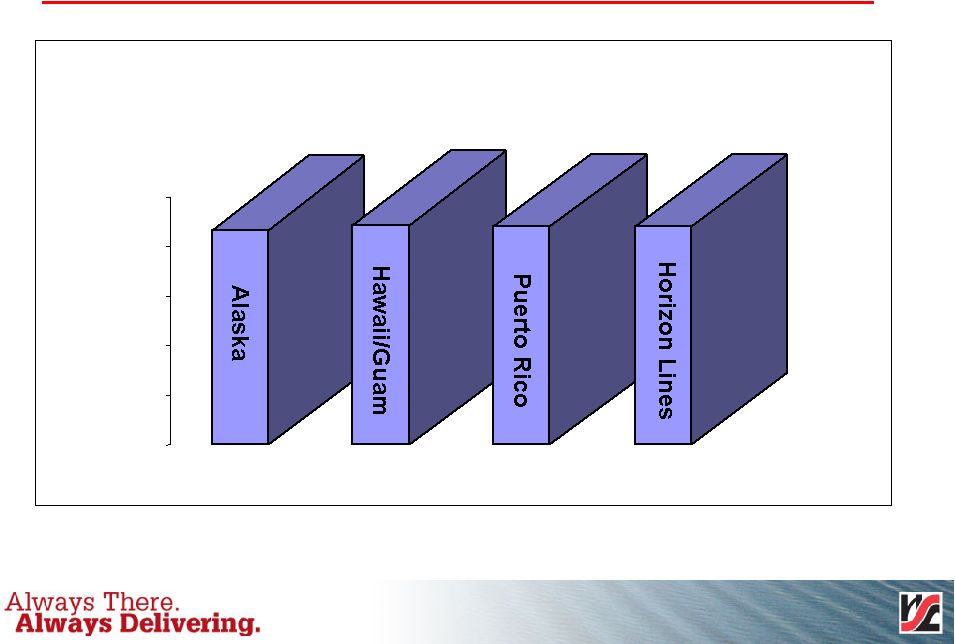 20 87% 89% 88% 88% 0% 20% 40% 60% 80% 100% Alaska Hawaii/Guam Puerto Rico Horizon Lines Vessel Utilization Vessel Utilization 2005 |
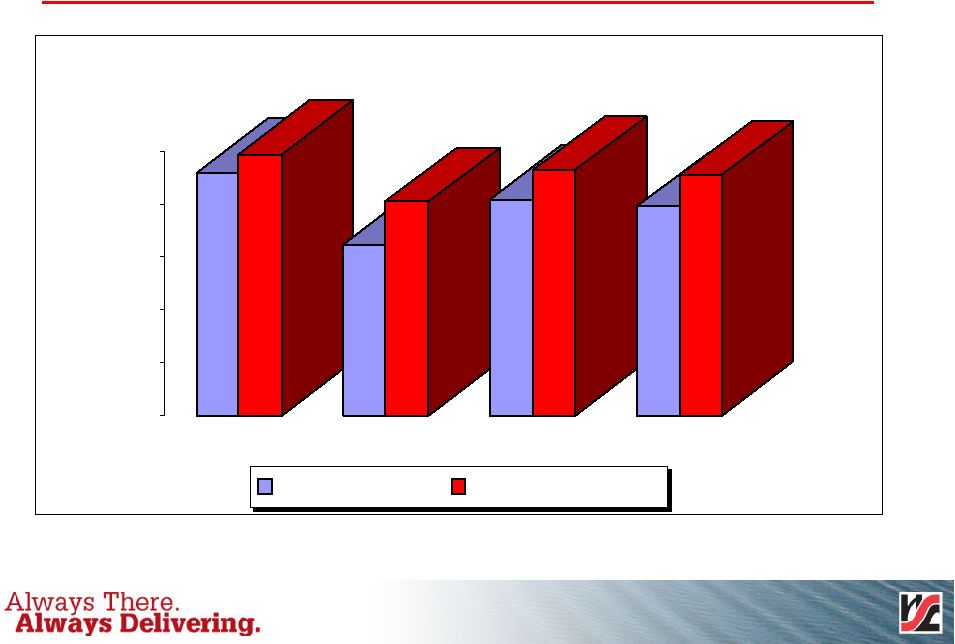 21 Vessel On-Time Arrivals 2005 92% 99% 65% 81% 82% 93% 79% 91% 0% 20% 40% 60% 80% 100% Alaska Hawaii/Guam Puerto Rico Horizon Lines Vessel On-Time Arrival Percentage Zero Tolerance 3-Hour Tolerance |
 22 Service Excellence Awards Wal-Mart Toyota Lowe’s |
 23 Fourth Quarter 2005 Earnings Release M. Mark Urbania Senior Vice President & Chief Financial Officer Financial Review |
 24 Financial Highlights Operating revenue increased Adjusted net income increased Adjusted earnings per share grew Adjusted operating income improved Strong cash flows Debt paydown from IPO proceeds |
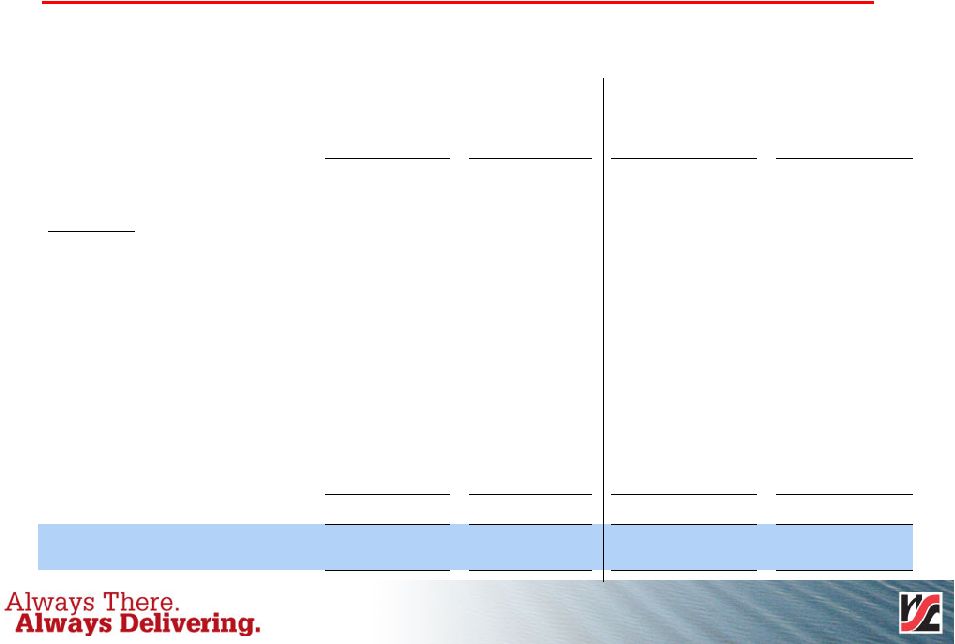
 25 Income Statement Summary – Fourth Quarter 33,544,170 33,544,170 16,411,290 32,623,848 Shares Outstanding $ (2.0) $ 4.9 $ (10.2) $ (12.4) Net Income (Loss) Common Shareholders -- -- 5.0 1.5 Preferred Stock Accretion 97.3% 92.8% 98.1% 95.5% Operating Ratio $ 29.9 $ 36.6 $ 27.8 $ 15.9 EBITDA $ (.06) $ .15 $ (.62) $ (.38) Earnings (Loss) Per Share (2.0) 4.9 (5.2) (10.9) Net Income (Loss) (1.7) 4.1 (3.7) (2.0) Income Tax Expense (Benefit) (3.7) 9.0 (8.9) (12.9) Pretax Income (Loss) 11.0 11.0 14.1 25.4 Other Expense 7.3 20.0 5.2 12.5 Operating Income 266.1 259.0 268.2 266.5 Operating Expense $ 273.4 $ 279.0 $ 273.4 $ 279.0 Operating Revenue Quarter Ended Dec. 26, 2004 Quarter Ended Dec. 25, 2005 Quarter Ended Dec. 26, 2004 Quarter Ended Dec. 25, 2005 Adjusted (1) ($ in Millions) Actual ($ in Millions) (1) Adjusted to exclude non-recurring IPO, other transaction and non-cash expenses. |
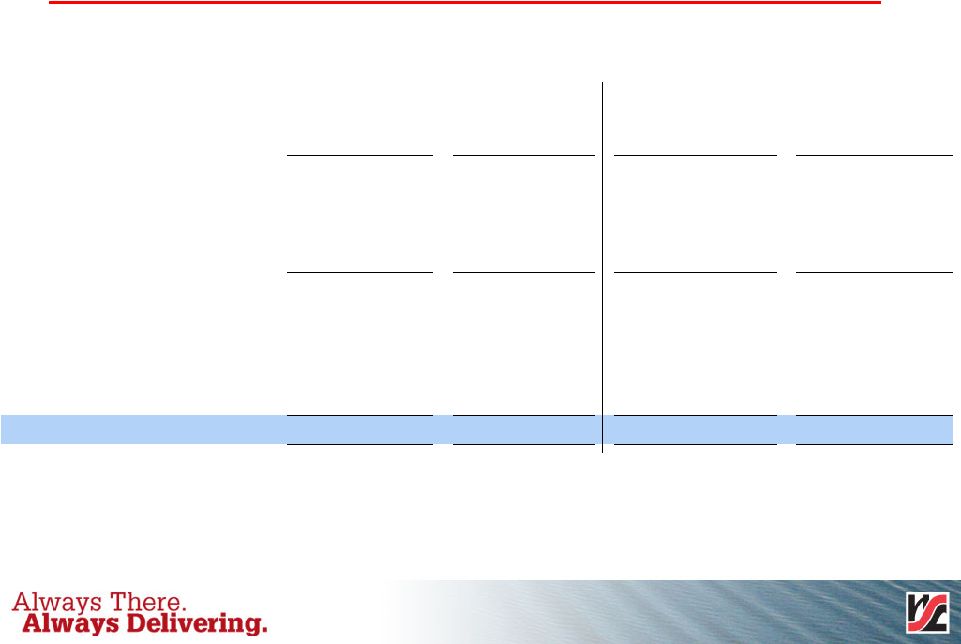
 26 Income Statement Summary – Fiscal Year 33,544,170 33,544,170 N/A 22,376,797 Shares Outstanding $ 5.6 $ 21.7 $ 6.8 $ (23.4) Net Income (Loss) Common Shareholders --- --- 6.8 5.1 Preferred Stock Accretion 94.9% 92.9% 94.7% 95.7% Operating Ratio $ 118.3 $ 146.4 $ 113.2 $ 102.1 EBITDA $ .17 $ .65 N/A $ (1.05) Earnings (Loss) Per Share 5.6 21.7 13.6 (18.3) Net Income (Loss) 3.5 13.5 8.4 .4 Income Tax Expense (Benefit) 9.1 35.2 22.0 (17.9) Pretax Income (Loss) 40.3 42.6 29.6 64.6 Other Expense 49.4 77.8 51.6 46.7 Operating Income 930.9 1,018.4 928.7 1,049.5 Operating Expense $ 980.3 $ 1,096.2 $ 980.3 $ 1,096.2 Operating Revenue Twelve Months Ended Dec. 26, 2004 Twelve Months Ended Dec. 25, 2005 Twelve Months Ended Dec. 26, 2004 Twelve Months Ended Dec. 25, 2005 Adjusted (1) ($ in Millions) Actual ($ in Millions) (1) Adjusted to exclude non-recurring IPO, other transaction and non-cash expenses. |
 27 Operating Revenue (1.6) (26.1) Volume Variance (1) Revenue Growth ($ in Millions) $ 115.9 $ 5.6 Total Revenue Increase 20.3 4.4 Other / Non-Transportation Revenue 21.7 4.7 Vessel Management Contracts 33.2 9.2 Bunker Fuel Surcharges $ 42.3 $ 13.4 Rate and Cargo Mix Improvement Year Fourth Quarter (1) 2004 had a 53-week fiscal year and 14-week fourth quarter compared to a 52-week fiscal year and 13-week fourth quarter in 2005. |
 28 Adjusted Operating Income Results 1.8 19.3 --- 7.3 Stock Compensation Expense Adjustments (a) Adjusted Operating Income ($ in Millions) (a) These charges are not anticipated to recur regularly in the ordinary course of business. $ 49.4 $ 77.8 $ 7.3 $ 20.0 Adjusted Operating Income (2.2) 31.1 2.1 7.5 Total Adjustments 1.1 2.1 .8 .2 Transaction Related Expense 2.2 9.7 1.3 --- Management Fees (7.3) --- --- --- Purchase Price Accounting Depreciation and Amortization $ 51.6 $ 46.7 $ 5.2 $ 12.5 Operating Income Twelve Months Ended Dec. 26, 2004 Twelve Months Ended Dec. 25, 2005 Quarter Ended Dec. 26, 2004 Quarter Ended Dec. 25, 2005 |
 29 Adjusted Net Income Results (7.3) --- --- --- Purchase Price Accounting Depreciation and Amortization 4.9 (13.1) (2.0) (6.1) Tax Impact (8.0) 40.0 3.2 15.8 Total Adjustments 1.1 2.1 .8 .2 Transaction Related Expense 2.2 9.7 1.3 --- Management Fees --- 13.2 --- 13.2 Loss on Extinguishment of Debt 1.8 19.3 --- 7.3 Stock Compensation Expense Adjusted Net Income (Loss) ($ in Millions) $ 5.6 $ 21.7 $ (2.0) $ 4.9 Adjusted Net Income (Loss) (10.7) 8.8 3.1 1.2 Interest Expense Reduction (Increase) Adjustments $ 13.6 $ (18.3) $ (5.2) $ (10.9) Net Income (Loss) Twelve Months Ended Dec. 26, 2004 Twelve Months Ended Dec. 25, 2005 Quarter Ended Dec. 26, 2004 Quarter Ended Dec. 25, 2005 |
 30 Net Income/EBITDA Reconciliation 1.1 2.1 .8 .2 Transaction Related Expense 2.2 9.7 1.3 --- Management Fees --- 13.2 --- 13.2 Loss on Extinguishment of Debt Note: EBITDA is defined as net income plus interest expense, income taxes, depreciation and amortization. We believe that EBITDA is a meaningful measure for investors as (i) EBITDA is a component of the measure used by our board of directors and management team to evaluate our operating performance, (ii) the senior credit facility contains covenants that require Horizon Lines Holding to maintain certain interest expense coverage and leverage ratios, which contain EBITDA and (iii) EBITDA is a measure used by our management team to make day-to-day operating decisions. 1.8 19.3 --- 7.3 Stock Compensation Expense Net Income/EBITDA Reconciliation ($ in Millions) $ 118.3 $ 146.4 $ 29.9 $ 36.6 Adjusted EBITDA 113.2 102.1 27.8 15.9 EBITDA 61.4 66.9 22.5 16.0 Depreciation and Amortization 29.8 53.1 14.2 12.8 Interest Expense 8.4 0.4 (3.7) (2.0) Tax Expense (Benefit) $ 13.6 $ (18.3) $ (5.2) $ (10.9) Net Income (Loss) Twelve Months Ended Dec. 26, 2004 Twelve Months Ended Dec. 25, 2005 Quarter Ended Dec. 26, 2004 Quarter Ended Dec. 25, 2005 |
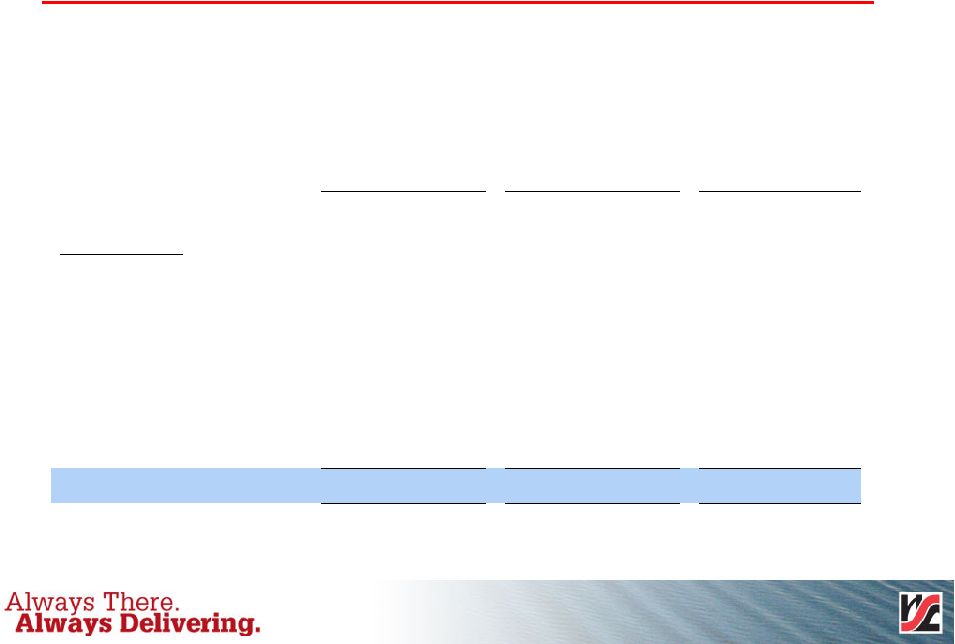 31 Adjusted Cash Flows 40.0 --- 40.0 Cash From Balance Sheet to Fund IPO Uses 2.7 1.1 3.8 Transaction Costs 5.5 19.7 25.2 Vessel Lease Buyouts 4.7 3.5 8.2 Management Fees Adjusted Cash Flow Summary ($ in Millions) $ 8.2 $ 57.4 $ 65.6 Adjusted Cash Change 3.7 --- 3.7 Dividends Adjustments: $ (48.4) $ 33.1 $ (15.3) Change in Cash Cash Increase (Decrease) Twelve Months Ended Dec. 26, 2004 Twelve Months Ended Dec. 25, 2005 |
 32 Improving Leverage 3.5x 2.9x LTM Adj. EBITDA / LTM Interest Expense (c) 78% 88% Debt / Capitalization 3.6x 4.3x Debt / LTM Adj. EBITDA Credit Statistics: $ 682.4 $ 709.6 Total Capitalization 151.8 22.7 Equity --- 62.2 Series A Preferred Stock $ 530.6 $ 624.7 Total Debt 81.7 122.2 11% Notes (b) 197.0 250.0 9% Notes $ 251.9 $ 252.5 Total Senior Secured Debt 0.5 0.5 Capital Leases 4.5 4.5 Vessel Mortgages 246.9 247.5 Term Loan $ 0.0 $ 0.0 Revolver (a) December 25, 2005 September 25, 2005 ($ in Millions) (a) Upon completion of IPO, revolver commitment increased to $50 million from $25 million. (b) Fully accreted balances are $160 million and $104 million on a pre and post IPO basis, respectively. (c) Excludes amortization of Financing Fees. December 25, 2005 LTM Interest Expense is pro forma. |
 33 2006 Earnings Guidance Year First Quarter Earnings Guidance ($ in Millions except EPS) $.85 - $.90 $.04 - $.06 EPS $158 – $162 $30 - $32 EBITDA $1,140 - $1,160 $274 - $278 Revenue |
 34 Fourth Quarter 2005 Earnings Release Questions & Answers |
 |
 36 |