 First Quarter 2006 Earnings Release April 28, 2006 Exhibit 99.3 |
 2 Earnings Call Agenda Introduction and Overview – Chuck Raymond – President & Chief Executive Officer Commercial Update – Brian Taylor – Senior Vice President, Sales & Marketing Operations Update – John Handy – Executive Vice President Financial Review Update – Mark Urbania – Senior Vice President & Chief Financial Officer Questions and Answers |
 3 Forward-Looking Statements Risks, Uncertainties, Other Factors with Respect to “Forward-Looking Statements:” Certain statements contained in this presentation constitute “forward- looking statements” within the meaning of the Private Securities Litigation Reform Act of 1995. Such statements that are not of historical fact constitute “forward-looking statements” and, accordingly, involve estimates, assumptions, judgments and uncertainties. There are a number of factors that could cause actual results or outcomes to differ materially from those addressed in the “forward-looking statements”. Such factors are detailed in the Horizon Lines, Inc.’s Form 10-K filed with the Securities and Exchange Commission on March 6, 2006. |
 4 First Quarter 2006 Earnings Release Chuck Raymond President & Chief Executive Officer Introduction and Overview |
 5 First Quarter Highlights 2006 off to a great start Strong operating revenue and earnings New vessel initiative commenced Container fleet investments continue Company again recognized for service excellence |
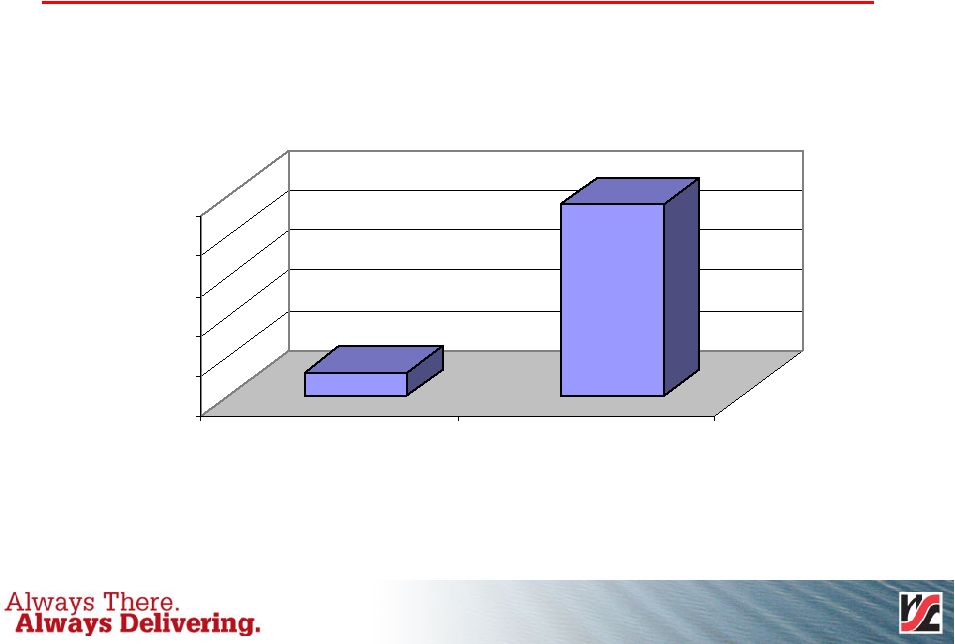
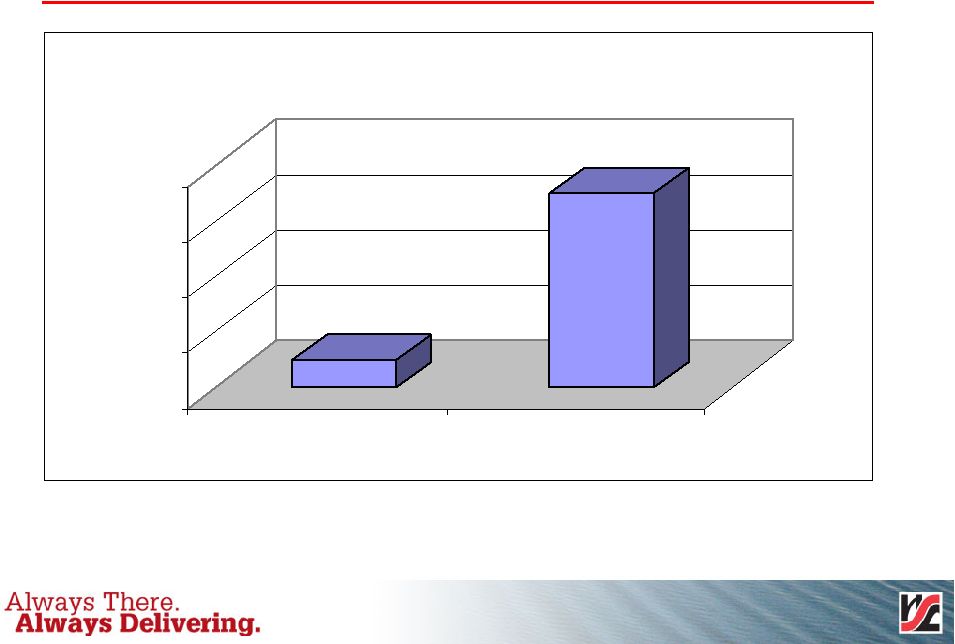 6 EPS 0.01 0.07 0 0.02 0.04 0.06 0.08 2005 2006 First Quarter (1) See Income Statement Summary – First Quarter on page 26 for calculation of adjusted EPS. (1) |
 7 257.6 274.9 245.0 250.0 255.0 260.0 265.0 270.0 275.0 2005 2006 First Quarter Operating Revenue ($ in Millions) |
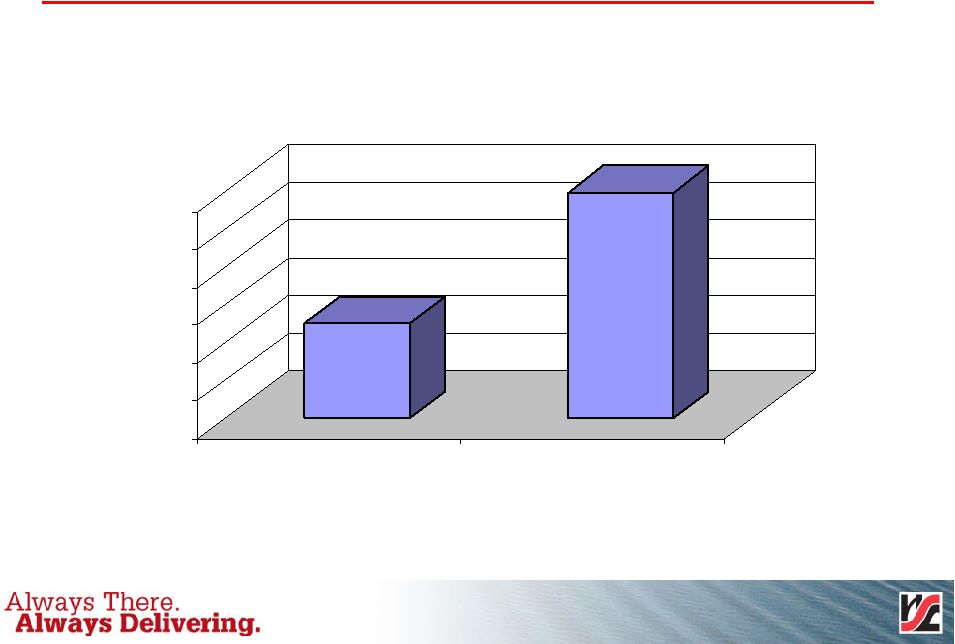
 8 11.0 15.9 - 5.0 10.0 15.0 20.0 2005 2006 First Quarter Operating Income (1) See reconciliation of Operating Income to Adjusted Operating Income on page 28. (1) |
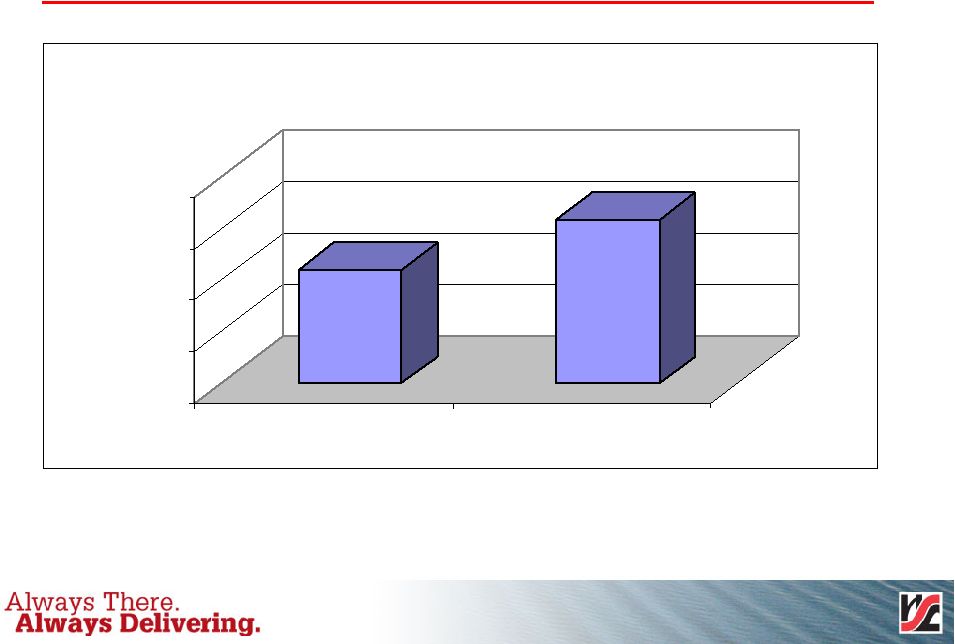
 9 27.7 31.8 24 26 28 30 32 2005 2006 First Quarter EBITDA (1) See reconciliation of Net Income to Adjusted EBITDA on page 30. ($ in Millions) (1) |
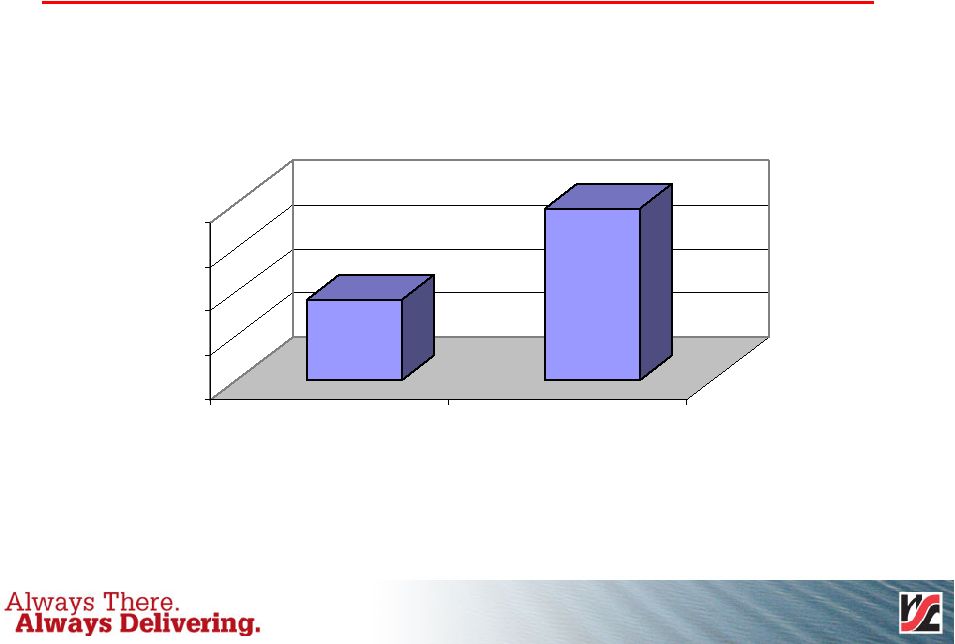
 10 0.3 2.4 0.0 0.5 1.0 1.5 2.0 2.5 2005 2006 First Quarter Net Income (1) See reconciliation of Net Income to Adjusted Net Income on page 29. ($ in Millions) (1) |
 11 First Quarter 2006 Earnings Release Brian Taylor Senior Vice President, Sales & Marketing Commercial Update |
 12 Commercial Highlights Rate/mix improvements more than offset some volume softness Well positioned competitively Economic outlook in 2006 remains bright |
 13 Volume Update First Quarter 2006 Alaska volumes remain solid despite a longer winter season Hawaii volume down slightly due to lower auto volume and economic impact of record rainfall Guam volume also impacted by a soft auto market, but market share growing in high margin segments The economic slowdown in the Puerto Rico market has continued into the first quarter, with modest recovery projected Puerto Rico market share remains robust and stable Revenue Containers (3.8)% (2,818) 74,419 71,601 Percentage Variance 2005 2006 |
 14 Rate Update First Quarter 2006 Rate improvement expected throughout 2006 offsetting the volume softness impacts on revenue Continue to implement general rate increases and individual customer contract renewal increases, indicating a stable competitive environment Continue to grow higher margin segments, which carry less cost, higher rate, or both Increasing vessel and intermodal fuel costs continue to be recovered through fuel surcharges Rate Per Container 10.4% $317 $3,049 $3,366 Percentage Variance 2005 2006 |
 15 Competitive Update First Quarter 2006 Well positioned: Excellent schedule reliability Ready to accommodate the summer surge Over the road conversions Planned reduction of autos provides capacity to handle growth Recent capacity additions have had minimal impact Reefer fleet renewal well received in all markets |
 16 Economic Outlook - 2006 Outlook company wide remains bright We are closely monitoring the situation in Puerto Rico No impact so far |
 17 First Quarter 2006 Earnings Release John Handy Executive Vice President Operations Update |
 18 Operating Highlights TP1 new vessel initiative underway Container fleet replenishment ongoing Key operating metrics all performing very well Service excellence awards continue in 2006 |
 19 TP1 New Vessels Update Vessel Charter Update Vessels secured with deliveries in the first half of 2007 Financing closed on April 11 th for 12-year charters with SFL Charters will be accounted for as operating leases Ongoing Action Items Agreement in principle with Maersk being finalized to extend TP1 and related agreements Designing 2007 vessel phase in plan to minimize cost of positioning ships and ramp up into new network |
 20 Container Investments Container Fleet 2006 Additions ($ in Millions) $ 9.9 3,300 Total Container Investment 500 250 300 250 1,000 1,000 Units 2.0 3 rd Quarter 2006 45’ High Cube Dry 0.9 2 nd Quarter 2006 45’ High Cube Dry 0.9 2 nd Quarter 2006 40’ High Cube Dry 0.8 2 nd Quarter 2006 45’ High Cube Dry 2.7 2 nd Quarter 2006 40’ High Cube Dry $ 2.6 March 2006 40’ High Cube Dry Cost (1) Acquisition Date Type (1) First 1,000 containers were acquired via purchase. Remaining containers will be acquired via operating leases. Costs of containers to be acquired in 2 nd and 3 rd quarters are estimates. |
 21 Key Metrics Fuel Initiatives Vessel Availability – 99.3% Vessel Utilization – 89.0% Vessel On-Time Arrivals – 78.0% |
 22 Service Excellence Awards in 2006 Lowe’s “2005 Gold Carrier Award” for fifth straight year Toyota “2005 Logistic Excellence Award for On-Time Performance” for seventh straight year “2005 Logistic Excellence Award for Customer Service” |
 23 First Quarter 2006 Earnings Release Mark Urbania Senior Vice President & Chief Financial Officer Financial Update |
 24 Financial Highlights Actual 2006 Results versus Adjusted 2005 17 consecutive quarters of EBITDA growth Operating revenue increased by $17.3 million or 6.7% Operating income improved by $4.9 million or 44.5% EBITDA higher by $4.1 million or 14.8% Net income increased by $2.1 million or 700% Earnings per share grew by $.06 or 600% Cash flows improved by $9.4 million or 69.6% |
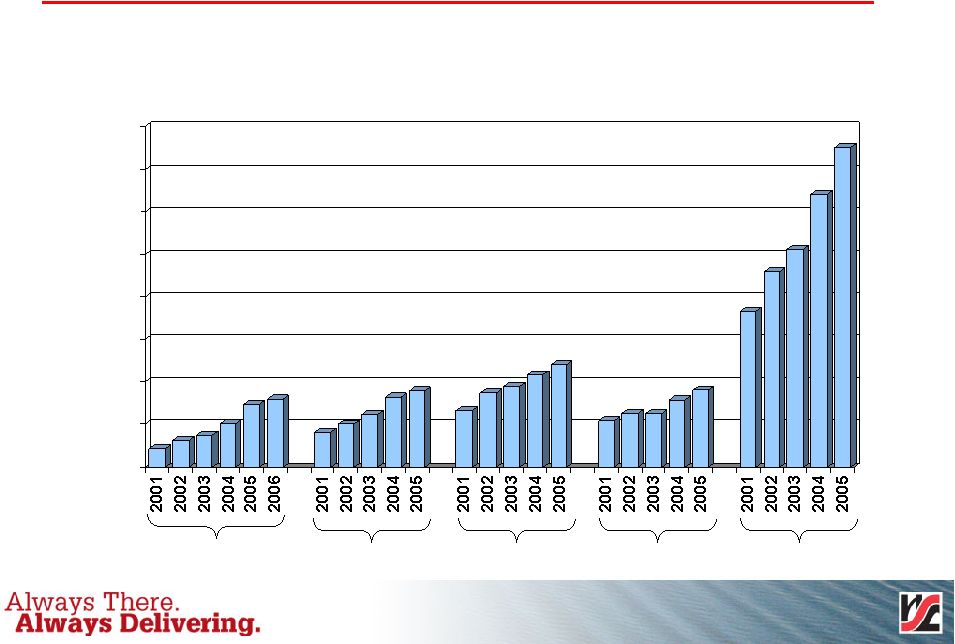 25 17 Quarters of Continuous Earnings Growth 9 12 15 20 29 32 16 20 24 33 36 27 35 38 43 48 22 25 25 32 36 73 92 102 128 150 0 20 40 60 80 100 120 140 160 Adjusted EBITDA Growth Q1 Q2 Q3 Q4 FY |
 26 Income Statement Summary – First Quarter Adjusted (1) ($ in Millions) Actual ($ in Millions) 33,544,170 18,790,879 33,544,170 Shares Outstanding $ 0.3 $ (9.7) $ 2.4 Net Income (Loss) Common Shareholders -- 1.5 -- Preferred Stock Accretion 95.7% 98.5% 94.2% Operating Ratio $ 27.7 $ 20.5 $ 31.8 EBITDA $ .01 $ (.52) $ .07 Earnings (Loss) Per Share 0.3 (8.2) 2.4 Net Income (Loss) 0.4 (0.8) 1.7 Income Tax Expense (Benefit) 0.7 (9.0) 4.1 Pretax Income (Loss) 10.3 12.8 11.8 Other Expense 11.0 3.8 15.9 Operating Income 246.6 253.8 259.0 Operating Expense $ 257.6 $ 257.6 $ 274.9 Operating Revenue Quarter Ended March 27, 2005 Quarter Ended March 27, 2005 Quarter Ended March 26, 2006 (1) Adjusted to exclude non-recurring expenses. |
 27 Operating Revenue 10.7 Rate and Cargo Mix Improvement $ (8.6) Volume Variance 12.4 Bunker and Intermodal Fuel Surcharges Revenue Growth ($ in Millions) $ 17.3 Total Revenue Increase 2.8 Other / Non-Transportation Revenue First Quarter 2006 |
 28 Adjusted Operating Income Results 6.4 -- Stock Compensation Expense Adjustments (a) Adjusted Operating Income ($ in Millions) (a) These charges are not anticipated to recur regularly in the ordinary course of business. $ 11.0 $ 15.9 Adjusted Operating Income 7.2 -- Total Adjustments 0.8 -- Management Fees $ 3.8 $ 15.9 Operating Income Quarter Ended March 27, 2005 Quarter Ended March 26, 2006 |
 29 Adjusted Net Income Results (1.2) -- Tax Impact 8.5 -- Total Adjustments 0.8 -- Management Fees 6.4 -- Stock Compensation Expense Adjusted Net Income ($ in Millions) $ 0.3 $ 2.4 Adjusted Net Income 2.5 -- Interest Expense Reduction Adjustments $ (8.2) $ 2.4 Net Income (Loss) Quarter Ended March 27, 2005 Quarter Ended March 26, 2006 |
 30 Net Income/EBITDA Reconciliation 0.8 -- Management Fees 6.4 -- Stock Compensation Expense Net Income/EBITDA Reconciliation ($ in Millions) $ 27.7 $ 31.8 Adjusted EBITDA 20.5 31.8 EBITDA 16.7 16.0 Depreciation and Amortization (0.8) 1.7 Tax Expense (Benefit) 12.8 11.7 Interest Expense, Net $ (8.2) $ 2.4 Net Income (Loss) Quarter Ended March 27, 2005 Quarter Ended March 26, 2006 Note: EBITDA is defined as net income plus net interest expense, income taxes, depreciation and amortization. We believe that EBITDA is a meaningful measure for investors as (i) EBITDA is a component of the measure used by our board of directors and management team to evaluate our operating performance, (ii) the senior credit facility contains covenants that require Horizon Lines Holding Corp. to maintain certain interest expense coverage and leverage ratios, which contain EBITDA and (iii) EBITDA is a measure used by our management team to make day-to-day operating decisions. |
 31 Cash Flows -- (1.0) Transaction Costs (0.5) -- Distribution to Holders of Preferred Stock 1.1 -- Sale of Stock 6.4 -- Stock Compensation Cash Flow Summary ($ in Millions) $ (12.9) $ (8.8) Net Cash Flow (0.6) (0.6) Debt Repayment (12.9) (7.2) Free Cash Flow (Deficit) -- (3.7) Dividend (4.2) (4.3) Interest -- -- Taxes (5.1) (4.2) Dry-Dock Expenditures (1.0) (2.0) Capital Expenditures, Net (29.5) (24.8) Working Capital $ 20.5 $ 31.8 EBITDA Quarter Ended March 27, 2005 Quarter Ended March 26, 2006 |
 32 2006 Earnings Guidance Year Second Quarter Earnings Guidance ($ in Millions except EPS) $.85 - $.90 $.18 - $.20 EPS $158 – $162 $38 - $40 EBITDA $1,140 - $1,160 $282 - $287 Operating Revenue |
 33 First Quarter 2006 Earnings Release Questions & Answers |
 |
 35 |