 ® 2006 Annual Meeting June 5, 2006 Exhibit 99.1 |
 2 2005 – The Year in Review Strong year for Horizon Lines Record operating revenue and earnings Successfully conducted an IPO Significant vessel and container fleet investments Senior management team further strengthened Company again recognized for service excellence |
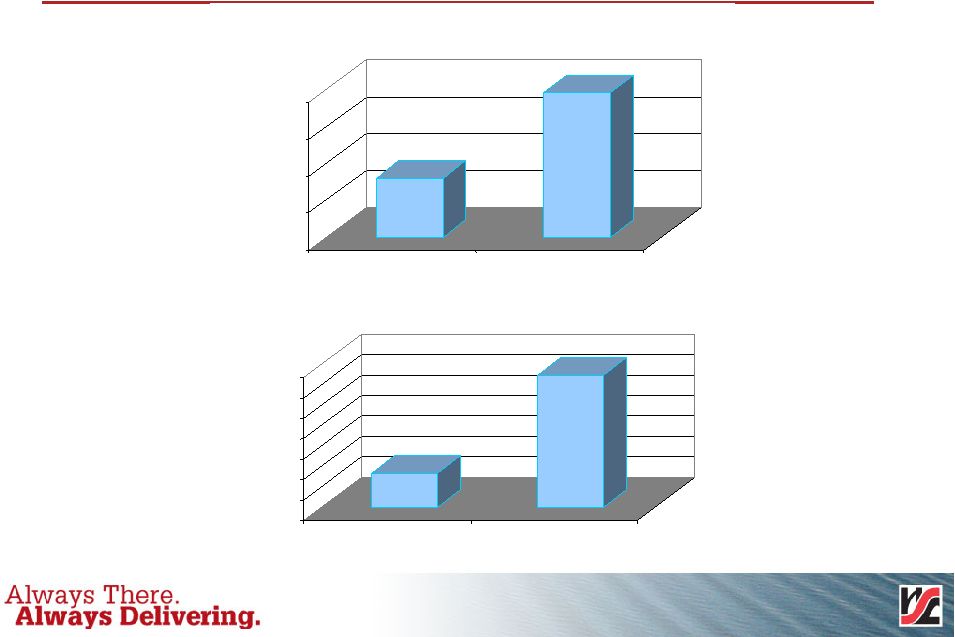 3 980.3 1,096.2 900.0 950.0 1,000.0 1,050.0 1,100.0 2004 2005 Year Operating Revenue and Adjusted EPS Operating Revenue 0.17 0.65 0.00 0.10 0.20 0.30 0.40 0.50 0.60 0.70 2004 2005 Year Adjusted EPS |
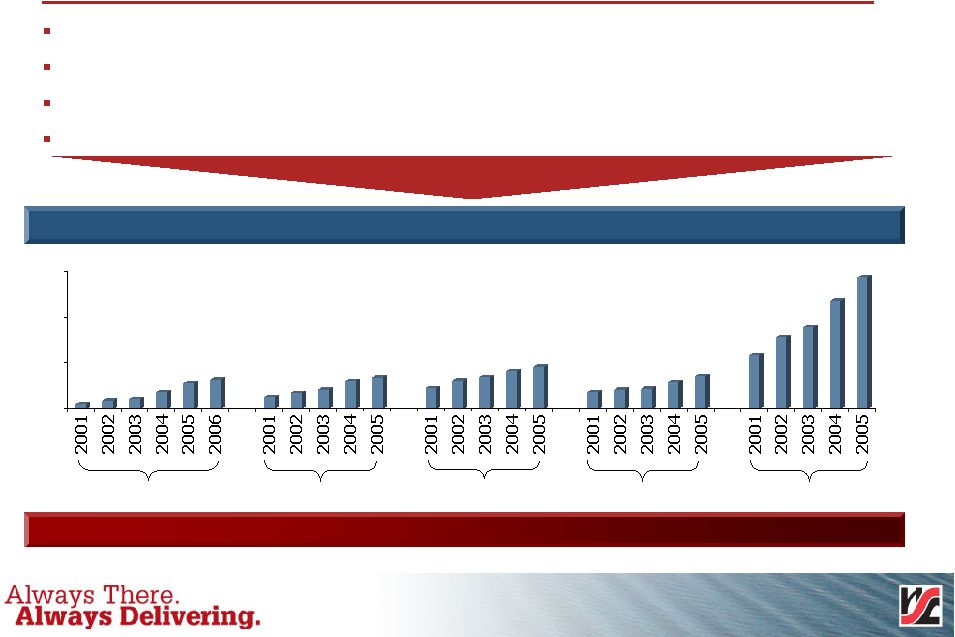 4 17 quarters of continuous earnings growth Expanded market share through volume and rate growth in a competitive environment Minimal service disruptions with 99.3% ready-to-sail status Performed consistently during recent recessions, hurricanes and West Coast port lockout Have increased management depth over the years $5 $9 $11 $18 $28 $32 $13 $17 $21 $30 $34 $23 $31 $35 $41 $46 $18 $21 $22 $29 $36 $59 $78 $89 $118 $144 $0 $50 $100 $150 EBITDA (1) Growth ($ millions) Q1 Q2 Q3 Q4 FY 11.3% revenue CAGR and 24.9% EBITDA CAGR from 2001 to 2005 (1) Adjusted EBITDA equal to EBITDA plus non-recurring items, management fees, and restricted stock compensation charges |
 5 2005 Puerto Rico Tradelane Highlights Stable competitive environment and stable market share Continued solid rate recovery program Offset escalating fuel costs with appropriate recovery surcharges Local fiscal deficit concerns dampen economic growth Incremental gains in targeted high margin segments Ongoing investment in terminal development |
 6 2005 Alaska Tradelane Highlights Stable competitive environment with growth in market share Continued offset of cost increases with rate increases Offset escalating fuel costs with appropriate recovery surcharges Deployment of a third sailing in the heavy summer season Strong economy driven by oil revenues |
 7 2005 Hawaii/Guam Tradelane Highlights Construction and Military spending fuel market growth New Refrigerated Equipment supports increase in Reefer share Automobile volume replaced with higher margin cargo Service Reliability recognized by most demanding customers Terminal Efficiency yields “Best in Class” service levels |
 8 First Quarter 2006 Highlights 2006 off to a great start Strong operating revenue and earnings New vessel initiative commenced Container fleet investments continue Company again recognized for service excellence |
 9 Fleet enhancement value proposition Lease five new non-Jones Act vessels through prudent use of capital Employ new non-Jones Act vessels in Guam/Asia trade Redeploy existing Jones Act vessels to Hawaii and Puerto Rico Optimize fleet deployment Pursue future growth opportunities in Hawaii/Guam and Puerto Rico Reduce operating costs through improved vessel network efficiency Extend Maersk relationship until 2010 Lower overall active fleet age by 11 years from 31 years to 20 years Improve operating platform Generate increased pro-forma EBITDA and operating cash flow after initial phase-in costs Create revenue upside potential from surplus Jones Act vessels Increase future profitability |
 10 Proforma EBITDA impact of fleet enhancement strategy Proforma EBITDA expansion Upside potential for surplus Jones Act vessels Coastwise service or additional Jones Act service Charter possibilities Relief vessels during existing vessel drydock periods Spare vessel capacity for peak volume surges Increased revenue from Maersk, Hawaii/Guam & Puerto Rico Operating cost savings from four idled vessels Operating costs of five new container vessels Lease expense on five new container vessels + + - - + + + + |
 11 2006 Significant Events Now have “first call” into Guam creating new opportunities Flexed capacity to Puerto Rico to match current demand scenario Focus on Operating Efficiencies (“The Edge”) Continuation of seasonal sailing to Alaska protects market position Honolulu Terminal expansion prepares for new vessel arrival in 2007 |
 |
Reconciliation of net income to EBITDA
(in thousands)
| Q1 | Q2 | Q3 | ||||||||||||||||||||||||||||||||||||||||||||||||||||||
| 2001 | 2002 | 2003 | 2004 | 2005 | 2006 | 2001 | 2002 | 2003 | 2004 | 2005 | 2001 | 2002 | 2003 | 2004 | 2005 | |||||||||||||||||||||||||||||||||||||||||
Net income (loss) | $ | (3,191 | ) | $ | 954 | $ | (162 | ) | $ | (536 | ) | $ | (8,173 | ) | $ | 2,366 | $ | 4,140 | $ | 5,227 | $ | 3,021 | $ | 7,981 | $ | (2,494 | ) | $ | 10,085 | $ | 13,666 | $ | 11,319 | $ | 11,333 | $ | 3,239 | |||||||||||||||||||
Interest expense,net | 2,316 | 453 | 1,529 | 3,528 | 12,852 | 11,720 | 170 | 434 | 3,981 | 3,462 | 13,386 | 1,035 | 634 | 3,827 | 8,443 | 12,933 | ||||||||||||||||||||||||||||||||||||||||
Income tax expense (benefit) | (1,785 | ) | (1,242 | ) | 202 | (338 | ) | (841 | ) | 1,771 | 2,348 | 2,834 | 1,862 | 4,901 | 1,067 | 5,625 | 8,398 | 6,976 | 7,605 | 2,205 | ||||||||||||||||||||||||||||||||||||
Depreciation and amortization | 9,293 | 8,616 | 9,176 | 14,712 | 16,691 | 15,917 | 7,649 | 8,021 | 10,987 | 13,286 | 17,294 | 8,032 | 8,540 | 10,612 | 10,933 | 16,900 | ||||||||||||||||||||||||||||||||||||||||
EBITDA | 6,633 | 8,781 | 10,744 | 17,366 | 20,528 | 31,774 | 14,307 | 16,516 | 19,851 | 29,630 | 29,253 | 24,777 | 31,238 | 32,735 | 38,313 | 35,278 | ||||||||||||||||||||||||||||||||||||||||
Merger related expenses | 634 | 1,129 | 425 | 189 | 1,592 | 2,076 | ||||||||||||||||||||||||||||||||||||||||||||||||||
Management fees | 123 | 750 | 123 | 750 | 125 | 635 | 8,199 | |||||||||||||||||||||||||||||||||||||||||||||||||
ILWU Lockout | ||||||||||||||||||||||||||||||||||||||||||||||||||||||||
Equipment lease-Maersk | (1,600 | ) | (1,600 | ) | (1,600 | ) | ||||||||||||||||||||||||||||||||||||||||||||||||||
Compensation charges | 6,411 | 4,000 | 1,627 | |||||||||||||||||||||||||||||||||||||||||||||||||||||
Initial Public Offering related expenses | 1,743 | |||||||||||||||||||||||||||||||||||||||||||||||||||||||
Loss on extinguishment of debt | ||||||||||||||||||||||||||||||||||||||||||||||||||||||||
Adjusted EBITDA | $ | 5,033 | $ | 8,781 | $ | 11,378 | $ | 17,489 | $ | 27,689 | $ | 31,774 | $ | 12,707 | $ | 16,516 | $ | 20,980 | $ | 30,178 | $ | 34,192 | $ | 23,177 | $ | 31,238 | $ | 34,452 | $ | 41,024 | $ | 46,847 | ||||||||||||||||||||||||
| Q4 | Full Year | ||||||||||||||||||||||||||||||||||
| 2001 | 2002 | 2003 | 2004 | 2005 | 2001 | 2002 | 2003 | 2004 | 2005 | ||||||||||||||||||||||||||
Net income (loss) | $ | 7,393 | $ | 2,596 | $ | 935 | $ | (5,217 | ) | $ | (10,894 | ) | $ | 18,428 | $ | 22,443 | $ | 15,113 | $ | 13,561 | $ | (18,321 | ) | ||||||||||||
Interest expense,net | 253 | 387 | 4,080 | 14,134 | 12,186 | 3,774 | 1,908 | 13,417 | 29,567 | 51,357 | |||||||||||||||||||||||||
Income tax expense (benefit) | 3,629 | 1,943 | 575 | (3,729 | ) | (1,992 | ) | 9,816 | 11,933 | 9,615 | 8,439 | 439 | |||||||||||||||||||||||
Depreciation and amortization | 8,709 | 8,885 | 15,677 | 22,500 | 16,022 | 33,682 | 34,062 | 46,452 | 61,431 | 66,907 | |||||||||||||||||||||||||
EBITDA | 19,984 | 13,811 | 21,267 | 27,689 | 15,322 | 65,701 | 70,346 | 84,597 | 112,998 | 100,381 | |||||||||||||||||||||||||
Merger related expenses | 932 | 433 | 268 | — | — | 4,287 | 2,934 | 457 | |||||||||||||||||||||||||||
Management fees | 125 | 1,323 | — | — | 250 | 2,204 | 9,699 | ||||||||||||||||||||||||||||
ILWU Lockout | 7,200 | — | 7,200 | — | — | — | |||||||||||||||||||||||||||||
Equipment lease-Maersk | (1,600 | ) | (6,400 | ) | — | — | — | — | |||||||||||||||||||||||||||
Compensation charges | 6,914 | — | — | — | — | 18,952 | |||||||||||||||||||||||||||||
Initial Public Offering related expenses | — | — | — | — | 1,743 | ||||||||||||||||||||||||||||||
Loss on extinguishment of debt | 13,154 | — | — | — | — | 13,154 | |||||||||||||||||||||||||||||
Adjusted EBITDA | $ | 18,384 | $ | 21,011 | $ | 22,324 | $ | 29,445 | $ | 35,658 | $ | 59,301 | $ | 77,546 | $ | 89,134 | $ | 118,136 | $ | 144,386 | |||||||||||||||
Reconciliation of Net Income (Loss) to Adjusted Net Income Per Share
(in thousands, except share amounts and earnings per share)
| Twelve Months ended December 26, 2004 | Year ended December 25, 2005 | |||||||
Net Income (loss) | $ | 13,561 | $ | (18,321 | ) | |||
Purchase price accounting depreciation and amortization | (7,255 | ) | ||||||
Stock compensation expense | 1,765 | 19,291 | ||||||
Management fees | 2,204 | 9,698 | ||||||
Transaction related expenses | 1,079 | 2,100 | ||||||
Loss on extinguishment of debt | — | 13,154 | ||||||
Interest expense reduction (increase) | (10,687 | ) | 8,780 | |||||
Tax impact | 4,906 | (13,000 | ) | |||||
Total adjustments | (7,988 | ) | 40,023 | |||||
Adjusted Net income | $ | 5,573 | $ | 21,702 | ||||
Proforma Shares outstanding | 33,544,170 | 33,544,170 | ||||||
Adjusted Net income per share | $ | 0.17 | $ | 0.65 | ||||