 Analyst’s Day Charlotte, NC July 21, 2006 Exhibit 99.1 |
 2 Agenda Introduction and Overview TP1 Fleet Enhancement Initiative HL Edge Cost Savings Initiative TP1 and HL Edge 2007 – 2012 Estimated Earnings Impact |
 3 Forward-Looking Statements Risks, Uncertainties, Other Factors with Respect to “Forward-Looking Statements:” Certain statements contained in this presentation constitute “forward- looking statements” within the meaning of the Private Securities Litigation Reform Act of 1995. Such statements that are not of historical fact constitute “forward-looking statements” and, accordingly, involve estimates, assumptions, judgments and uncertainties. There are a number of factors that could cause actual results or outcomes to differ materially from those addressed in the “forward-looking statements”. Such factors are detailed in the Horizon Lines, Inc.’s final prospectus filed with the Securities and Exchange Commission on June 12, 2006. |
 4 INTRODUCTION AND OVERVIEW CHUCK RAYMOND |
 5 Horizon Lines History 1956 – Sea-Land pioneered container shipping 1969 – Sea-Land acquired by R.J. Reynolds 1984 – Sea-Land becomes a public company 1986 – CSX purchases Sea-Land 1999 – Sale of Sea-Land international business to Maersk and formation of CSX Lines 2003 – CSX sells CSX Lines to The Carlyle Group and name changed to Horizon Lines 2004 – Horizon Lines purchased by Castle Harlan 2005 – Horizon Lines conducts an initial public offering 2006 – Horizon Lines conducts a secondary public offering |
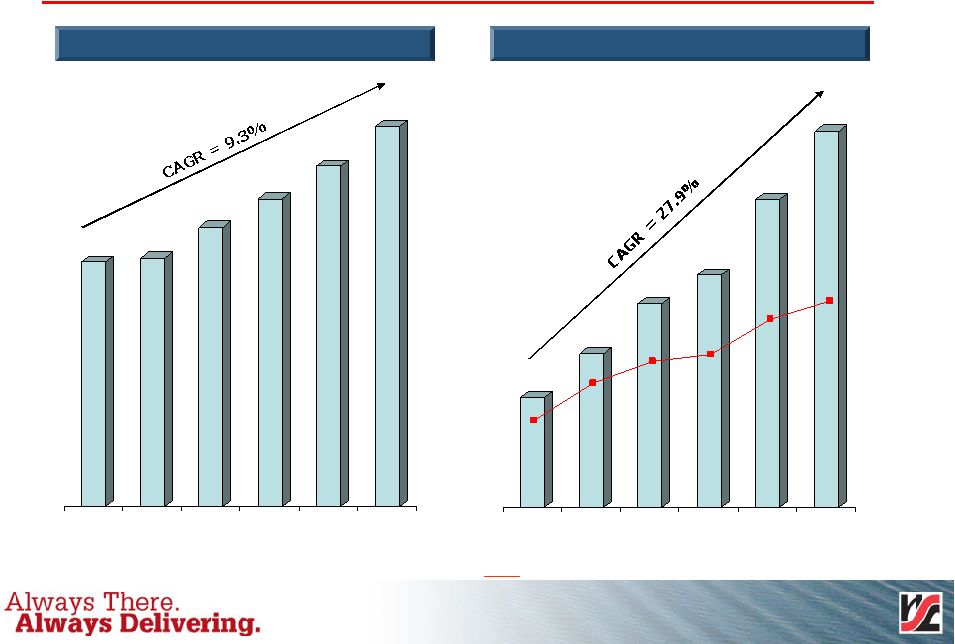 6 $42 $59 $78 $89 $118 $144 2000 2001 2002 2003 2004 2005 $703 $715 $804 $886 $980 $1,096 2000 2001 2002 2003 2004 2005 Strong Operating Performance Revenue Adjusted EBITDA (1) (1) Adjusted EBITDA equal to EBITDA plus non-recurring items, management fees, and restricted stock compensation charges 13.2% 12.1% 10.0% 9.6% 8.3% 6.0% ($ millions) ($ millions) EBIDTA Margin |
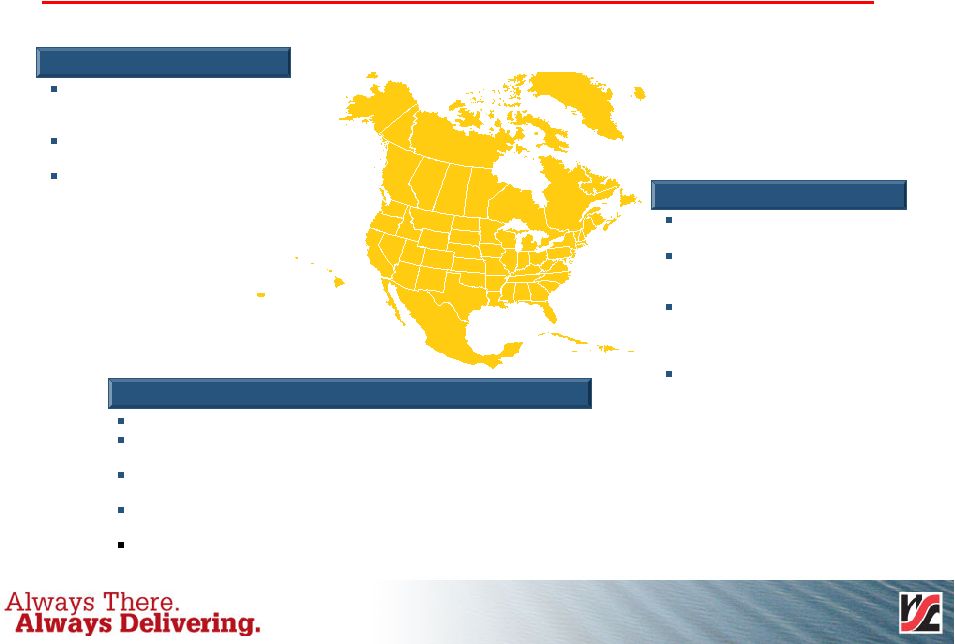 7 Core market initiatives will drive growth Building season has grown to include March and November, which has led to a 10% asset utilization increase Establishment of military Striker brigade in Alaska Alaska gas pipeline construction activity Higher margin backhaul pharmaceutical cargo Port infrastructure investments leading to higher port management revenue Vessel redeployment will add incremental capacity with newer larger vessels enjoying better operating efficiencies Improving rate environment Higher margin reefer cargo Increased port infrastructure investments will result in an additional 40% throughput capacity Significant military construction in Hawaii will result in increased demand for our services DoD plans for added Marine, Navy and Air Force presence in Guam will drive dramatic increases in cargo Cost savings will be achieved through direct hire of labor for stevedoring operations Alaska Hawaii/Guam Puerto Rico 1 |
 8 TP1 FLEET ENHANCEMENT INITIATIVE JOHN KEENAN |
 9 TP1 Project Objectives Acquire new vessels suitable for Guam/Asia trade employing a prudent use of capital while redeploying existing vessels to other Jones Act trades Extend existing Maersk agreement to December 2010 by meeting their needs for more capacity on the Transpacific Eastbound service Add vessel capacity and improve service scope to Hawaii/Guam and Puerto Rico trades Improve network cost structure in Puerto Rico Reduce overall average age of active fleet by 11 years Generate increased pro forma EBITDA and operating cash flow of approximately $28 million per year on average over 10 years after initial start-up costs and phase-in period |
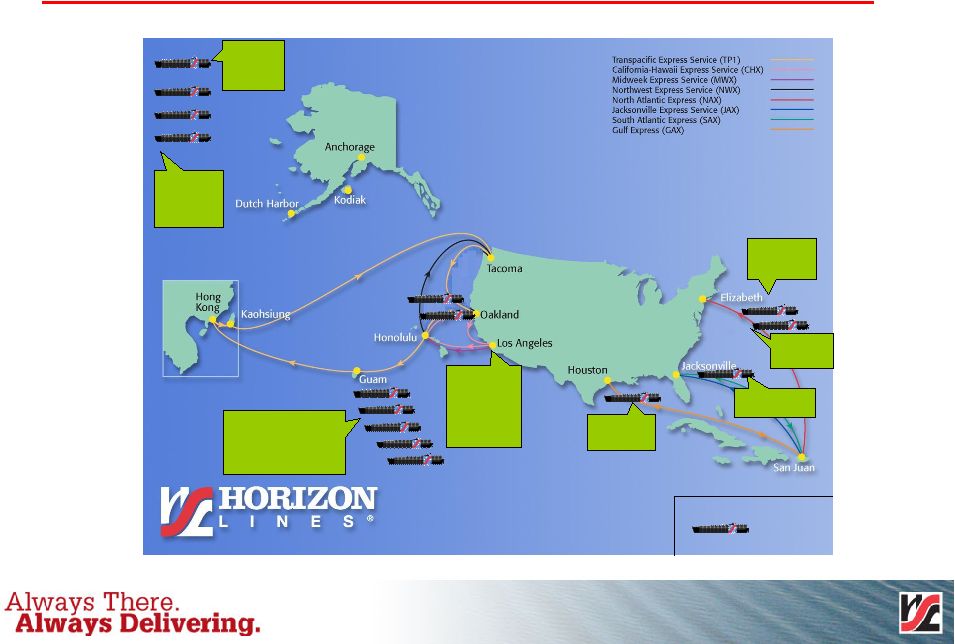
 10 Summary of TP1 Initiative Horizon Lines charters five US flag, foreign-built vessels deployed in a modified TP1 service (non-Jones Act) 2,824 TEU nominal capacity, 23 knot service speed Two of the five Jones Act vessels displaced from TP1 deployed in a new Pacific Northwest (PNW) service maintaining Jones Act Hawaii service currently covered by the TP1 service. The remaining vessels will be redeployed through the Horizon Lines network to add more capacity to the California Hawaii Express (CHX) and Puerto Rico vessels and provide a larger drydock replacement ship At least two Jones Act qualified ships (C7-class about 600 FEU) will be available to provide an intra-coastal service. Timing of the TP1 upgrade will be by the middle of 2007 |
 11 Pro-forma EBITDA Impact of TP1 Fleet Initiatives Pro forma EBITDA 10-year average annual impact - $28 million + Increased revenue from Maersk, Hawaii/Guam & Puerto Rico + Operating cost savings from four replaced vessels - Operating costs of five new container vessels - Lease expense on five new container vessels Upside Potential for surplus Jones Act vessels Coastwise service or additional Jones Act service Charter possibilities Relief vessels during existing vessel drydock periods Spare vessel capacity for peak volume surges |
 12 Vessels Delivery and Phase-In Dates TP1 ship delivery dates. March 2007 Horizon Tiger May 2007 Horizon Falcon April 2007 Horizon Eagle March 2007 Horizon Hawk November 2006 Horizon Hunter Current Outlook Targeted 2007 phase-in dates: March – Commencement of TP1 ex Asia April – Start PNW (TAC-OAK-HONO) service May – Last new TP1 vessel deployed ex Asia Third Quarter – First C8 to Puerto Rico |
 13 Deployment Change Impact Recap String # Ships Capacity # Ships Capacity # Ships Capacity Hawaii/Guam CHX 2 863 2 1,025 - 163 PNW - - 2 975 2 975 TP1 5 995 5 1,200 - 205 MWX TSA - 140 - 140 - - Total 7 1,998 9 3,340 2 1,343 Capacity Allocation Hawaii 1,748 2,140 393 Guam 250 1,200 950 Total 1,998 3,340 1,343 Puerto Rico (*Seasonal) NAX 1 650 1 900 - 250 SAX 1 650 1 900 - 250 JAX 1 570 1 700 - 130 MJX (*) 1 570 - - (1) (570) GAX 1 395 1 415 - 21 Total 5 2,835 4 2,915 (1) 81 Notes: 1) Capacity outlined as estimated average weekly effective capacity in FEU (equivalent to Loads) 2) Puerto Rico reflects seasonal deployment with MJX service and does not reference TSA with SSL 3) Jones-Act qualified ships redeployed from TP1 could be redeployed to different tradelanes Current Proposed Change |
 14 TP1 Vessel Replacement Initiative Current Vessel Deployment Anchorage Kodiak Tacoma D7 – TEU 1,668 Fairbanks C6 Vessel TEU 1,476 Seasonal Trader C8 – TEU 2,386 Pacific C8 –TEU 2,407 Enterprise C8 –TEU 2,407 Spirit C9 –TEU 2,653 Reliance C9 – TEU 2,653 Navigator C8 – TEU 2,386 Consumer SL18 – TEU 1,751 Producer SL18 – TEU 1,751 Hawaii C6 – TEU 1,420 Discovery C7 – TEU 1,442 Challenger C7 – TEU 1,424 Crusader C7 Vessel TEU – 1,376 Spare Vessels |
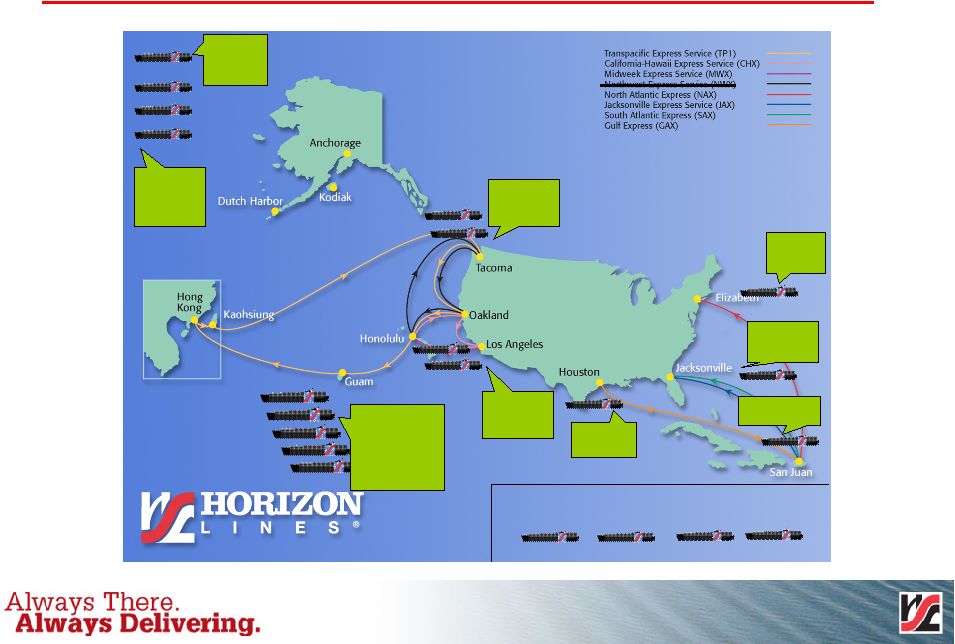 15 TP1 Vessel Replacement Initiative Fairbanks 1,476 TEU C6 Vessel Seasonal Hunter Hawk Tiger Panther Cougar D8 - Hunter Class TEU – 2,824 Pacific Enterprise C8 –TEU 2,407 Spirit Reliance C9 –TEU 2,653 Consumer SL18 Vessel TEU – 1,751 Navigator C8 –TEU 2,386 Discovery C7 Vessels TEU – 1,442 Challenger C7 Vessel TEU – 1,424 Crusader C7 Vessel TEU – 1,376 Producer SL18 –TEU 1,751 Hawaii C6 –TEU 1,420 Spare Vessels Anchorage Kodiak Tacoma D7 –TEU 1,668 Trader C8 –TEU 2,386 Pacific Northwest (PNW) Fairbanks C6 Vessel TEU 1,476 Seasonal Proposed Vessel Deployment |
 16 TP1 2007 Phase-In – Estimated Earnings Impact ($ in Millions) 1st Quarter 2nd Quarter 3rd Quarter 4th Quarter Total Phase-In Impact Network Costs (3) $ (4) $ (1) $ - $ (8) $ Network Benefits 7 1 - - 8 Total Phase-In Cost (Increase/Decrease) 4 (3) (1) - - Ramp-Up Impact Revenue Impact - 5 8 10 23 Cost Impact Cost Added for Five Foreign Vessels - (20) (25) (25) (70) Less: Vessel Cost & Fuel Savings - 4 14 14 32 Total Cost Impact - (16) (11) (11) (38) Total Ramp-Up Cost (Increase/Decrease) - (11) (3) (1) (15) Incremental EBITDA 4 $ (14) $ (4) $ (1) $ (15) $ |
 17 TP1 2008-2017 Estimated Earnings Impact $ 28 $ 30 $ 24 $ 18 $ 11 $ (2) Incremental Operating Income/EBITDA Impact (37) (37) (36) (37) (35) (36) Net Cost (Increase) / Decrease 6 6 6 6 6 6 Other Network Cost Impact 63 60 62 62 62 59 Operating Cost Saved on Replaced Vessels (32) (32) (32) (33) (32) (32) Incremental Lease Expense (74) (71) (72) (72) (71) (69) Operating Cost for 5 New Vessels Incremental Network Cost $ 65 $ 67 $ 60 $ 55 $ 46 $ 34 Incremental Revenue Average Years 1-10 2012 2011 2010 2009 2008 ($ in Millions) |
 18 HL EDGE COST SAVINGS INITIATIVE JOHN HANDY |
 19 HL Edge Project Introduction Mission / Vision Working together to realize better ways to more efficiently serve our customers and add value to our organization. Project Structure Utilizing a team of dedicated Horizon Lines employees along with Celerant Consulting Inc. for project implementation. The project implementation started in May 2006 and will end in 2008. |
 20 Project EDGE Team Structure Executive Steering Team Project Management Sales and Marketing Supply Chain Port Operations Performance Management Information Technology John Orton Danielle Miller Pete Bunero Rodney Walton Richard Nesmith Barbara Blanton (HG) Eric Britten (ANC) Tolga Cankurtaran (SJU) Doug Lapham (ANC) Javier Lojo (SJU) Juan Olbrich (SJU) Jon Bartnick (HG) Jose Gonzalez (SJU) Bob Burlando Existing Horizon Team PMO Team Lead: John Handy EST Members: Chuck Raymond, Mark Urbania, John Keenan, Brian Taylor Celerant: Richard Morgan/Joe Perovich Sai Nori Leo Leblanc Multiple Horizon Scott Fernandez Richard Kwok Support Core |
 21 Biographical Info – Horizon EDGE Team Members • Team Leader: Scott Fernandez – most recently, Regional Sales Manager – East Coast; experience in operations and sales; Coast Guard licensed vessel officer; MBA • Sales & Mktg sub-team: John Orton – most recently marketing manager for Puerto Rico trade; previously, manager-strategic planning; Kings Pointer with MBA • Supply Chain sub-team: Pete Bunero – most recently manager-financial reporting; previous experience includes various assignments in finance, equipment and inland. MBA Rodney Walton – most recently operations manager – Long Beach terminal; previous experience includes trucking operations manager and shift manager. MBA • Port Operations sub-teams: Barbara Blanton – most recently Terminal Manager – Elizabeth, NJ; previous experience in documentation, and all phases of operations Eric Britten – most recently manager – Business Planning & Dev-AK; previous experience includes work on Balanced Score Card & Operations & sales. BA in Urban Economics and Risk Management Tolga Cankurtaran – most recently manager – strategic planning; MBA • PMO sub-team: Sai Nori – most recently, manager-Applications Architecture; 10 years experience in I/T; MBA • Performance Mgt sub-team: Bob Burlando – most recently director-procurement; previous experience in finance, equipment, inland, I/T and quality; Kings Pointer and MBA |
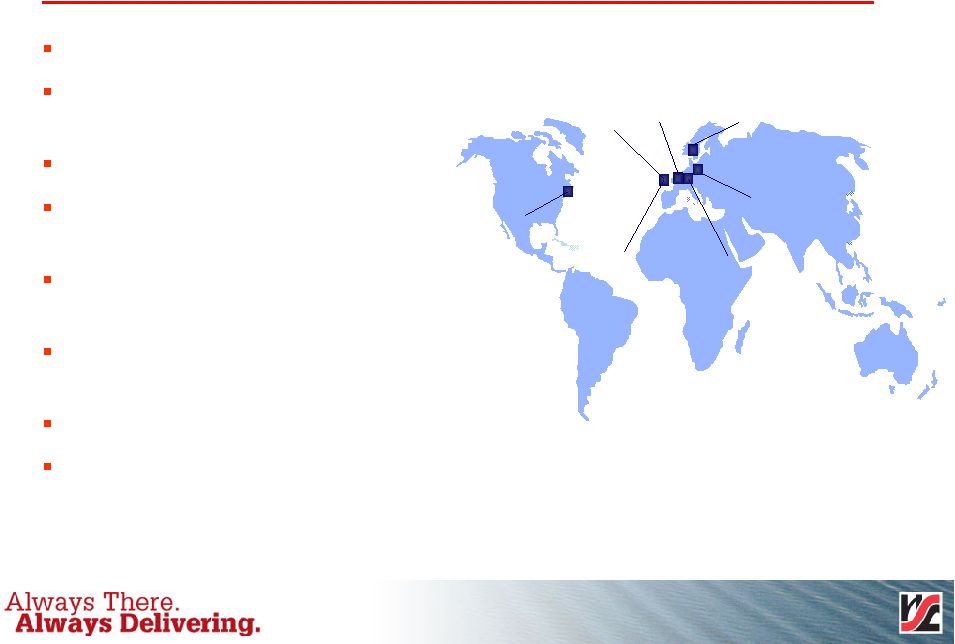 22 HL Edge – Our Partner, Celerant Founded in 1987 More than 550 professionals worldwide $150 million in 2005 revenues 38% average annual revenue growth over last 10 years Work globally where clients are located More than 900 projects completed in 44 countries More than 60% repeat business North American headquarters in Boston with major operations in the US and Europe N. America & Canada UK Paris Düsseldorf Norway Corporate Operational on a global basis |
 23 HL Edge Project Overview Sales & Marketing Improve Account Plan/Sales Force management practices and implement customer relationship management tools/techniques to align resources for improved customer profitability Supply Chain Management Refine operations planning process and integrate with Sales forecasts to control inland transportation costs Optimize container network management for improved inventory turns for all major ports and yards Integrate Sales & Operations planning tools for improved carrier performance management Information Technology Implement project management controls to optimize IT spend Port Operations Improve cost controls, increase productivity, and standardize management measures for all locations Order Fulfillment Streamline order processing to reduce rework |
  24 HL Edge Cost Savings Target Opportunities Opportunity Description 2005 Baseline ($m) Fuel Improve on-time departures 137 $ Reduce Ancillary Stevedoring Improve maintenance management Marine productivity Maintenance Improvements Operating Cost Improve labor productivity e.g. back office processes, pricing, etc. 62 Preferred Carrier, Scheduling Reduce REPO Costs (Trucks/Rail) Container Detention and Demurrage Reduce Maersk Detention, Demurrage, and Improve Collection from Customers Margin Improvement Improve Produce Mix and Container Utilization 550 TOTAL 922 $ On-Time Vessel Departure Improve Order Management, Marine Productivity and Equipment Reliability 62% Carrier Management 82 Domestic Ports 32 Offshore Ports 59 |
 25 HL Edge Project Estimated Cost Savings Target - 2007 $ 13 $ 6 $ 4 $ 2 $ 1 Net Benefits (6) (1) (1) (2) (2) One-Time Costs $ 19 $ 7 $ 5 $ 4 $ 3 Permanent Cost Savings Total 4 Quarter 3rd Quarter 2 Quarter 1 Quarter ($ in Millions) st nd th |
 26 HL Edge Estimated Cost Saving Targets – 2008 & Beyond $ 40 Total Savings 5 Margin Improvements 8 Port Operations Costs $ 27 Container / Transportation / Order Management Costs 2008 & Beyond ($ in Millions) |
 27 TP1 AND HL EDGE 2007 – 2012 ESTIMATED EARNINGS IMPACT MARK URBANIA |
 28 TP1 and HL Edge 2007 Estimated Earnings Impact $ (2) $ 5 $ - $ (12) $ 5 Total 13 6 4 2 1 HL Edge $ (15) $ (1) $ (4) $ (14) $ 4 TP1 Total 4 Quarter 3 Quarter 2 Quarter 1 Quarter ($ in Millions) nd th rd th |
 29 TP1 and HL Edge 2008 - 2012 Estimated Earnings Impact $ 70 $ 64 $ 58 $ 51 $ 38 Total 40 40 40 40 40 HL Edge $ 30 $ 24 $ 18 $ 11 $ (2) TP1 2012 2011 2010 2009 2008 ($ in Millions) |
 |
 31 |
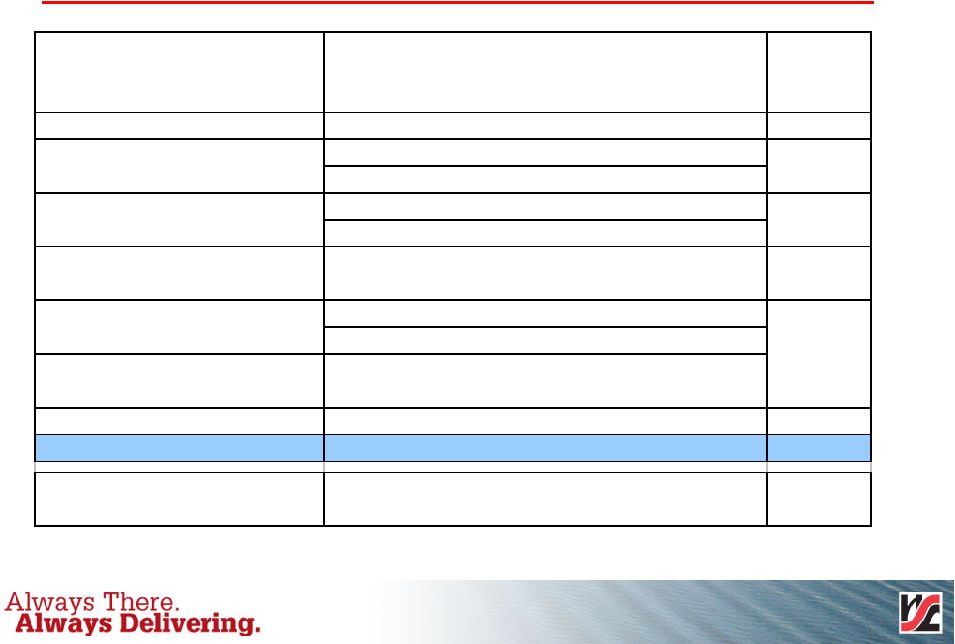
Reconciliation of net income to EBITDA
(in thousands)
| Full Year | |||||||||||||||||||||
| 2000 | 2001 | 2002 | 2003 | 2004 | 2005 | ||||||||||||||||
Net income (loss) | $ | (5,300 | ) | $ | 18,428 | $ | 22,443 | $ | 15,113 | $ | 13,561 | $ | (18,321 | ) | |||||||
Interest expense, net | 8,228 | 3,774 | 1,908 | 13,417 | 29,567 | 51,357 | |||||||||||||||
Income tax expense (benefit) | (2,805 | ) | 9,816 | 11,933 | 9,615 | 8,439 | 439 | ||||||||||||||
Depreciation and amortization | 32,138 | 33,682 | 34,062 | 46,452 | 61,431 | 66,907 | |||||||||||||||
EBITDA | 32,261 | 65,701 | 70,346 | 84,597 | 112,998 | 100,381 | |||||||||||||||
Merger related expenses | — | — | — | 4,287 | 2,934 | 457 | |||||||||||||||
Lease expense buyout | 16,141 | — | — | — | — | — | |||||||||||||||
Management fees | — | — | — | 250 | 2,204 | 9,699 | |||||||||||||||
ILWU Lockout | — | — | 7,200 | — | — | — | |||||||||||||||
Equipment lease-Maersk | (6,500 | ) | (6,400 | ) | — | — | — | — | |||||||||||||
Compensation charges | — | — | — | — | — | 18,952 | |||||||||||||||
Initial Public Offering related expenses | — | — | — | — | — | 1,743 | |||||||||||||||
Loss on extinguishment of debt | — | — | — | — | — | 13,154 | |||||||||||||||
Adjusted EBITDA | $ | 41,902 | $ | 59,301 | $ | 77,546 | $ | 89,134 | $ | 118,136 | $ | 144,386 | |||||||||