 Second Quarter 2006 Earnings Release July 28, 2006 Exhibit 99.3 |
 2 Earnings Call Agenda Introduction and Overview – Chuck Raymond – President & Chief Executive Officer Commercial and Operations Update – John Handy – Executive Vice President Financial Review – Mark Urbania – Senior Vice President & Chief Financial Officer Questions and Answers |
 3 Forward-Looking Statements Risks, Uncertainties, Other Factors with Respect to “Forward-Looking Statements:” Certain statements contained in this presentation constitute “forward- looking statements” within the meaning of the Private Securities Litigation Reform Act of 1995. Such statements that are not of historical fact constitute “forward-looking statements” and, accordingly, involve estimates, assumptions, judgments and uncertainties. There are a number of factors that could cause actual results or outcomes to differ materially from those addressed in the “forward-looking statements”. Such factors are detailed in the Horizon Lines, Inc.’s final prospectus filed with the Securities and Exchange Commission on June 12, 2006. |
 4 Second Quarter 2006 Earnings Release Chuck Raymond President & Chief Executive Officer Introduction and Overview |
 5 Second Quarter Highlights 18 quarter of consecutive adjusted EBITDA growth Double digit earnings gains Fleet enhancement strategy ahead of schedule Customer focus and service efficiency initiative launched Positive economic outlook for remainder of 2006 Horizon Lines again recognized for service excellence th |
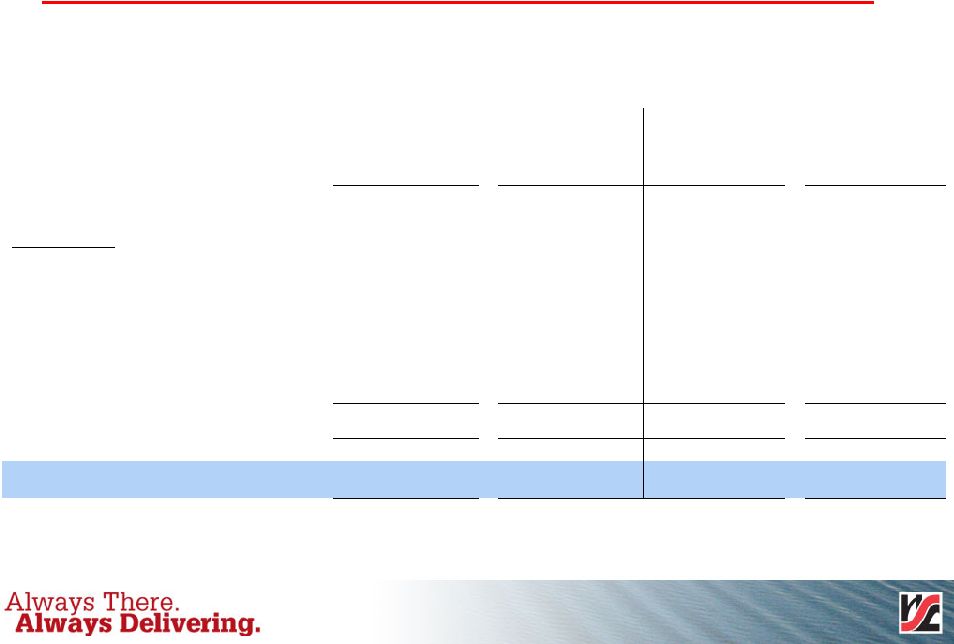
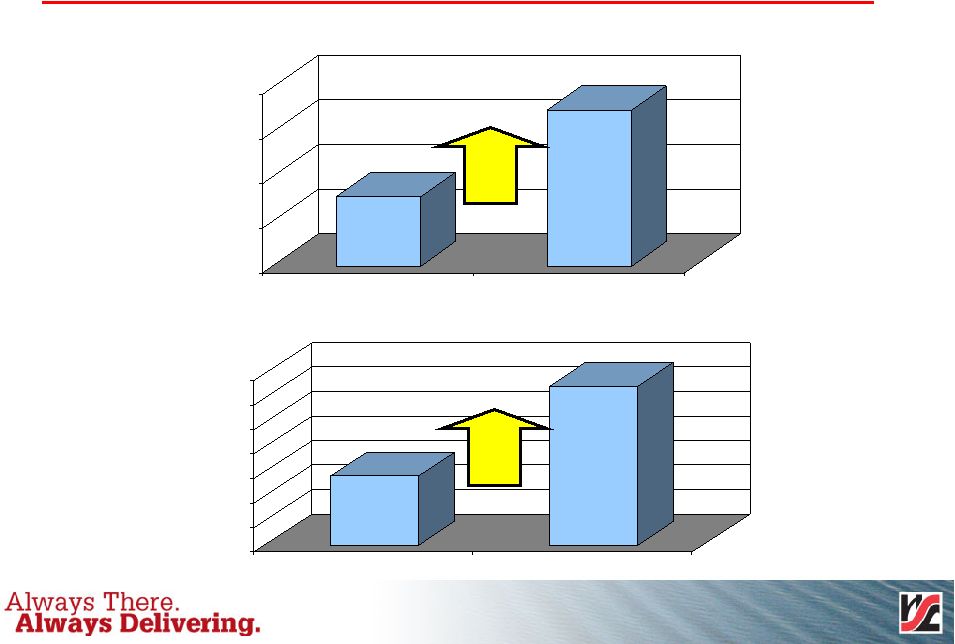 6 Operating Revenue 270.5 289.8 255 265 275 285 295 2005 2006 Second Quarter ($ in Millions) 528.1 564.8 500 510 520 530 540 550 560 570 2005 2006 Six Months ($ in Millions) 7.1% 6.9% |
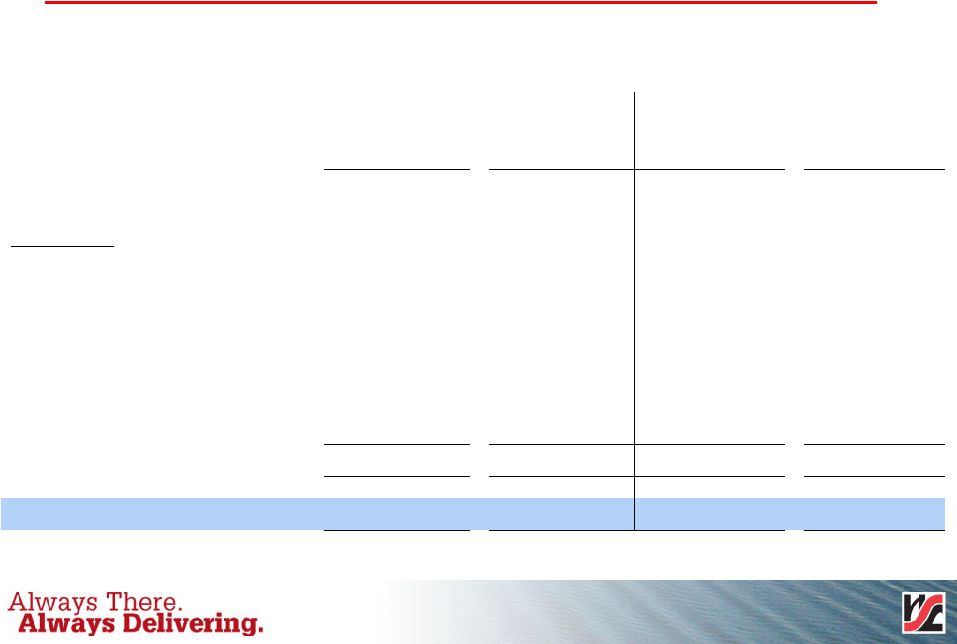
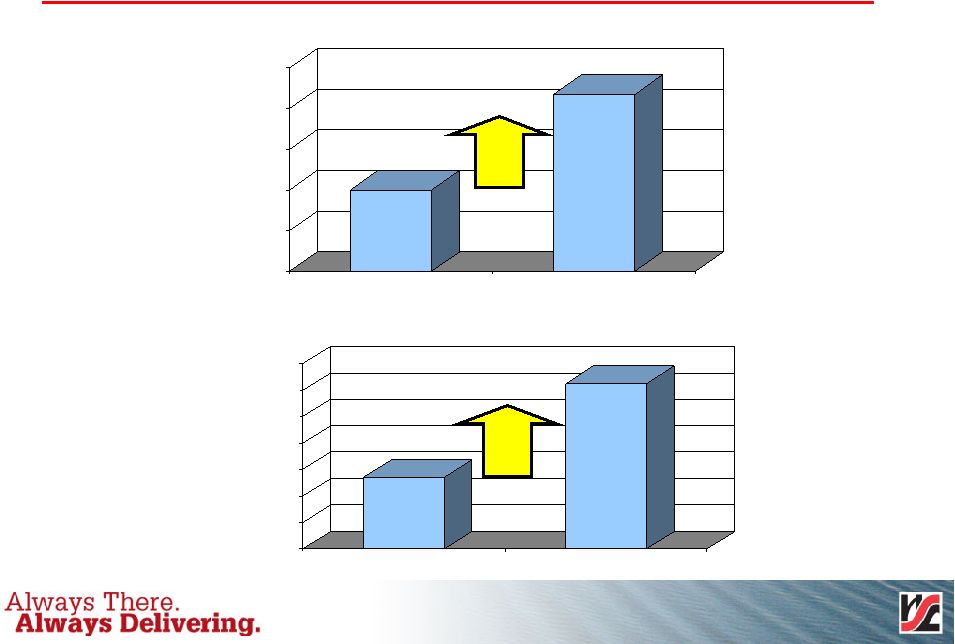 7 Adjusted EBITDA 36.0 40.7 32.0 34.0 36.0 38.0 40.0 42.0 2005 2006 Second Quarter ($ in Millions) 65.4 72.5 60.0 62.0 64.0 66.0 68.0 70.0 72.0 74.0 2005 2006 Six Months ($ in Millions) 13.1% 10.9% |
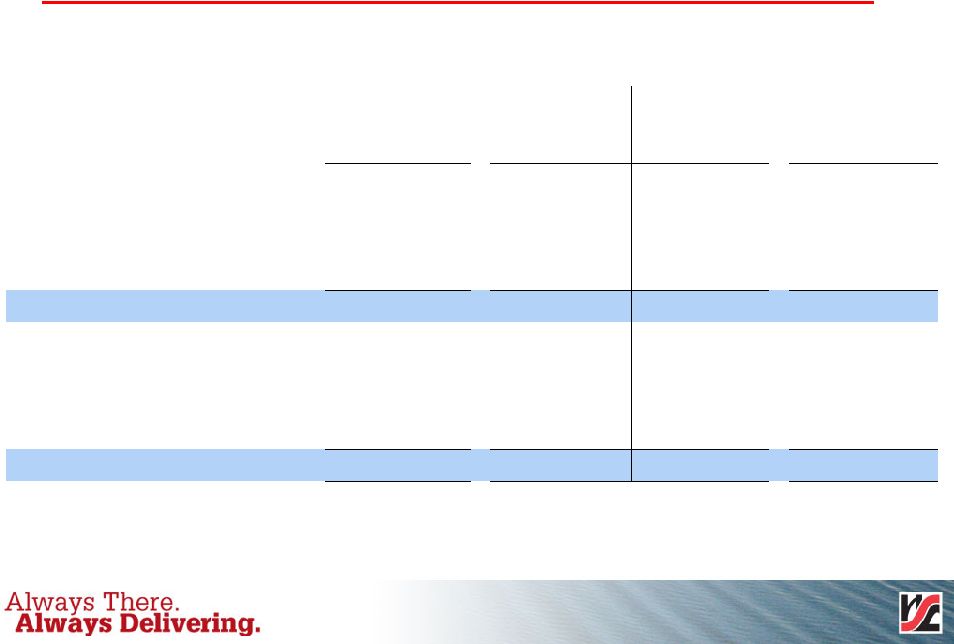
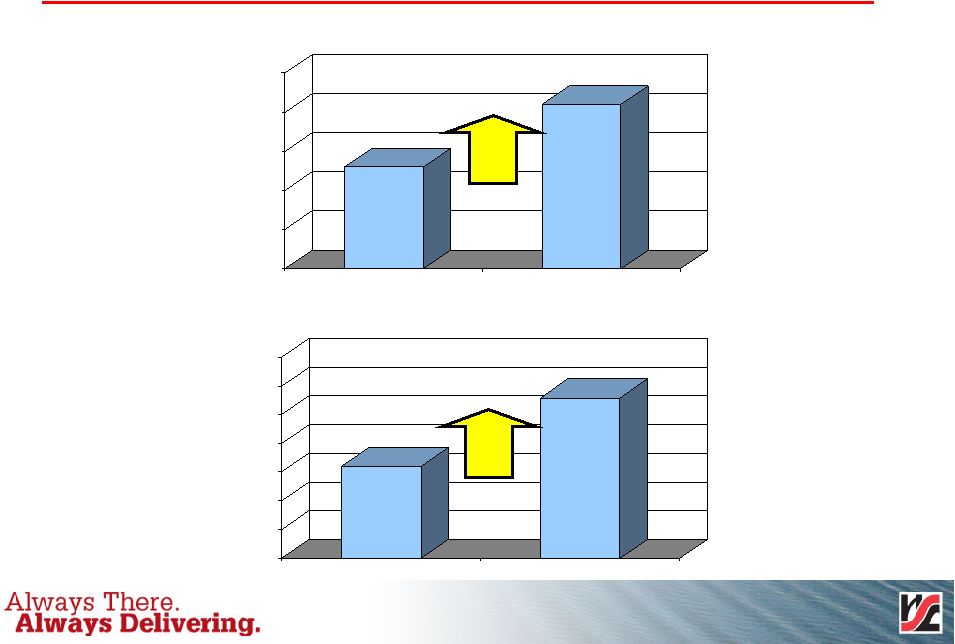 8 Adjusted EPS 0.13 0.21 0.00 0.05 0.10 0.15 0.20 0.25 2005 2006 Second Quarter 0.16 0.28 0.00 0.05 0.10 0.15 0.20 0.25 0.30 0.35 2005 2006 Six Months 75.0% 61.5% |
 9 Second Quarter 2006 Earnings Release John Handy Executive Vice President Commercial and Operations Update |
 10 Commercial Highlights Rate/mix improvements more than offset some volume softness Well positioned competitively Economic outlook for remainder of 2006 remains positive |
 11 Rate Update Second Quarter 2006 Rate improvement continues and is expected to more than offset modest volume softness in 2006 Refrigerated cargo yields solid mix upgrades in Alaska Continued gains in higher margin Hawaii cargo and gains in Guam drive revenue growth Greater mix of refrigerated cargo and less intermodal volume create revenue and margin improvement in Puerto Rico Responsible surcharge adjustments maintain fuel cost recovery |
 12 Volume Update Second Quarter 2006 Alaska volumes up modestly as delayed construction season starts Lingering impact of record rainfall in Hawaii delayed shipping cycles Puerto Rico volumes affected by the non-essential government service shutdown and tax law changes announced in June Expanding Government Business Revenue Containers (3,002) 78,606 75,604 Variance 2005 2006 |
 13 Competitive Update Second Quarter 2006 Seasonal deployment in Alaska has prevented significant cargo backlogs during the peak season Guam competitive deployment changes allow for continued penetration in the refrigerated, military and freight-all-kinds segments Tonnage reductions enacted in Puerto Rico to combat market softness |
 14 Economic Outlook - 2006 Look for stable economic conditions in Alaska and Hawaii/Guam, but continued softness in the Puerto Rico economy that could impact volume growth Focus on offsetting softer volume with mix improvement that still delivers revenue and profitability growth |
 15 Operating Highlights Fleet enhancement initiative ahead of schedule Comprehensive customer focus and service efficiency program initiative commenced Rolling stock replacement program continues with 1,250 new containers Strong performance across all key operating metrics Company extended string of service awards Wal-Mart “2005 Jones Act Carrier of the Year Award” for the fifth year since 2000 |
 16 Vessels Delivery and Phase-In Dates New Transpacific (TP)1 ships delivery dates: March 2007 Horizon Tiger May 2007 Horizon Falcon April 2007 Horizon Eagle March 2007 Horizon Hawk November 2006 Horizon Hunter Current Outlook Targeted 2007 phase-in dates: March – Commencement of TP1 ex Asia April – Commence new Jones Act Pacific Northwest (PNW) Tacoma- Oakland-Honolulu service May – Last new TP1 vessel deployed ex Asia 3Qtr – First C8 to Puerto Rico Designing 2007 vessel phase-in plan to minimize cost of positioning ships and ramp-up into new network |
 17 Horizon Edge Project Introduction Mission / Vision Working together to realize better ways to more efficiently serve our customers and add value to our organization. Project Structure Utilizing a team of dedicated Horizon Lines employees along with Celerant Consulting Inc. for project implementation. The project implementation started in May 2006 and will end in 2008. Celerant will participate throughout the entire project and their total compensation is determined based upon the savings achieved. Estimated Benefits Targets 2007 Net Benefits - $13 million 2008 & Beyond Annual Net Benefits - $40 million |
 18 Key Operating Metrics 89.0% 87.0% Vessel On-Time Arrivals (3) 87.0% 89.0% Vessel Utilization (2) 99.7% 99.6% Vessel Availability (1) Second Quarter 2005 Second Quarter 2006 Notes: (1) Employs a zero departure time delay tolerance (2) Based upon headhaul direction volume (3) Employs a zero arrival time delay tolerance |
 19 Second Quarter 2006 Earnings Release Mark Urbania Senior Vice President & Chief Financial Officer Financial Update |
 20 Second Quarter Financial Highlights Adjusted 2006 Results versus Adjusted 2005 18 consecutive quarters of adjusted EBITDA growth Operating revenue increased by $19.3 million or 7.1% Adjusted operating income improved by $5.1 million or 28.0% Adjusted EBITDA higher by $4.7 million or 13.1% Adjusted net income increased by $2.6 million or 59.1% Adjusted earnings per share grew by $.08 or 61.5% |
 21 Income Statement Summary – Second Quarter Adjusted (1) ($ in Millions) Actual ($ in Millions) 33,544,170 33,544,170 19,101,778 33,544,170 Shares Outstanding – Basic $ 4.4 $ 7.0 $ (4.1) $ 6.4 Net Income (Loss) Common Shareholders -- -- 1.6 -- Preferred Stock Accretion 93.3% 92.0% 95.6% 92.3% Operating Ratio $ 36.0 $ 40.7 $ 29.3 $ 39.8 EBITDA $ .13 $ .21 $ (.21) $ .19 Earnings (Loss) Per Share – Basic 4.4 7.0 (2.5) 6.4 Net Income (Loss) 2.8 4.2 1.1 3.9 Income Tax Expense 7.2 11.2 (1.4) 10.3 Pretax Income (Loss) 11.0 12.1 13.4 12.1 Other Expense 18.2 23.3 12.0 22.4 Operating Income 252.3 266.5 258.5 267.4 Operating Expense $ 289.8 Quarter Ended June 25, 2006 $ 270.5 $ 270.5 $ 289.8 Operating Revenue Quarter Ended June 26, 2005 Quarter Ended June 26, 2005 Quarter Ended June 25, 2006 (1) Adjusted to exclude non-recurring transaction-related expenses associated with a secondary stock offering in 2006 and an initial public stock offering in 2005. |
 22 Income Statement Summary – Six Months Adjusted (1) ($ in Millions) Actual ($ in Millions) 33,544,170 33,544,170 18,912,639 33,544,170 Shares Outstanding - Basic $ 5.5 $ 9.4 $ (13.8) $ 8.8 Net Income (Loss) Common Shareholders -- -- 3.1 -- Preferred Stock Accretion 94.2% 93.1% 97.0% 93.2% Operating Ratio $ 65.4 $ 72.5 $ 49.8 $ 71.6 EBITDA $ .16 $ .28 $ (.73) $ .26 Earnings (Loss) Per Share – Basic 5.5 9.4 (10.7) 8.8 Net Income (Loss) 3.7 6.0 0.3 5.7 Income Tax Expense 9.2 15.4 (10.4) 14.5 Pretax Income (Loss) 21.4 23.8 26.2 23.8 Other Expense 30.6 39.2 15.8 38.3 Operating Income 497.5 525.6 512.3 526.5 Operating Expense $ 564.8 Six Months Ended June 25, 2006 $ 528.1 $ 528.1 $ 564.8 Operating Revenue Six Months Ended June 26, 2005 Six Months Ended June 26, 2005 Six Months Ended June 25, 2006 (1) Adjusted to exclude non-recurring transaction-related expenses associated with a secondary stock offering in 2006 and an initial public stock offering in 2005. |
 23 Operating Revenue 22.3 11.6 Cargo Mix and Rate Improvement $ (17.8) $ (9.2) Volume Variance 27.7 15.3 Bunker and Intermodal Fuel Surcharges Revenue Growth ($ in Millions) $ 19.3 1.6 Second Quarter 2006 $ 36.7 Total Revenue Increase 4.5 Other / Non-Transportation Revenue Six Months 2006 |
 24 Cash Flows 0.3 1.1 Net Proceeds from Sale of Fixed Assets (1.1) (1.8) Financing/Transaction Costs** (0.5) -- Distribution to Holders of Preferred Stock 1.1 -- Sale of Stock 10.4 0.4 Stock Compensation Cash Flow Summary ($ in Millions) $ 4.7 $ 2.7 Net Cash Flow (1.3) (2.6) Debt Repayment* 6.2 6.0 Free Cash Flow -- (7.4) Dividends (18.0) (20.4) Interest -- -- Taxes (10.0) (12.1) Dry-Dock Expenditures (2.2) (7.2) Capital Expenditures (23.8) (18.9) Working Capital $ 49.8 $ 71.6 EBITDA Six Months June 26, 2005 Six Months June 25, 2006 *Includes open market purchase of 11% Senior Discount Notes **Includes credit agreement fees and fees associated with IPO/secondary offering |
 25 Improving Leverage 3.5x 3.5x LTM Adj. EBITDA / LTM Interest Expense (b) 78% 78% Debt / Capitalization 3.6x 3.4x Debt / LTM Adj. EBITDA Credit Statistics: $ 682.4 $ 685.4 Total Capitalization 151.8 153.0 Equity --- --- Series A Preferred Stock 530.6 532.4 Total Debt 81.7 84.9 11% Notes (a) 197.0 197.0 9% Notes 251.9 250.5 Total Senior Secured Debt 0.5 0.4 Capital Leases 4.5 4.5 Vessel Mortgages 246.9 245.6 Term Loan $ --- $ --- Revolver (a) December 25, 2005 June 25, 2006 ($ in Millions) (a) Fully accreted balances were $104 million at December 25, 2005 and $102.5 million on June 25, 2006. (b) Excludes amortization of Financing Fees. December 25, 2005 and June 25, 2006 LTM Interest Expense are pro forma. |
 26 2006 Earnings Guidance Year Third Quarter Earnings Guidance ($ in Millions except EPS) $.85 - $.90 $.40 - $.42 EPS $158 - $162 $48 - $51 EBITDA $1,155 - $1,165 $305 - $310 Operating Revenue |
 27 Financial Appendix |
 28 Adjusted Operating Income Results 0.2 0.9 0.2 0.9 Transaction Related Expense 2.7 -- 1.3 -- Lease Buyout 10.4 -- 4.0 -- IPO Restricted Stock Compensation Adjustments (a) Adjusted Operating Income ($ in Millions) (a) These charges are not anticipated to recur regularly in the ordinary course of business. $ 30.6 $ 39.2 $ 18.2 $ 23.3 Adjusted Operating Income 14.8 0.9 6.2 0.9 Total Adjustments 1.5 -- 0.7 -- Management Fees $ 12.0 Quarter Ended June 26, 2005 $ 22.4 Quarter Ended June 25, 2006 $ 15.8 $ 38.3 Operating Income Six Months Ended June 26, 2005 Six Months Ended June 25, 2006 |
 29 Adjusted Net Income Results 0.2 0.9 0.2 0.9 Transaction Related Expense 2.7 -- 1.3 -- Lease Buyout $ 5.5 16.2 (3.4) 4.8 1.5 10.4 $ (10.7) Six Months Ended June 26, 2005 $ 9.4 0.6 (0.3) -- -- -- $ 8.8 Six Months Ended June 25, 2006 (1.7) (0.3) Tax Impact 6.9 0.6 Total Adjustments 0.7 -- Management Fees 4.0 -- IPO Restricted Stock Compensation Adjusted Net Income ($ in Millions) $ 4.4 $ 7.0 Adjusted Net Income 2.4 -- Interest Expense Reduction Adjustments $ (2.5) $ 6.4 Net Income (Loss) Quarter Ended June 26, 2005 Quarter Ended June 25, 2006 |
 30 Net Income/EBITDA Reconciliation 0.2 0.9 0.2 0.9 Transaction Related Expense 3.5 -- 1.8 -- Lease Buyout $ 65.4 1.5 10.4 49.8 34.0 0.3 26.2 $ (10.7) Six Months Ended June 26, 2005 $ 72.5 -- -- 71.6 33.1 5.7 24.0 $ 8.8 Six Months Ended June 25, 2006 0.7 -- Management Fees 4.0 -- IPO Restricted Stock Compensation Net Income/EBITDA Reconciliation ($ in Millions) $ 36.0 $ 40.7 Adjusted EBITDA 29.3 39.8 EBITDA 17.3 17.2 Depreciation and Amortization 1.1 3.9 Tax Expense 13.4 12.3 Interest Expense, Net $ (2.5) $ 6.4 Net Income (Loss) Quarter Ended June 26, 2005 Quarter Ended June 25, 2006 Note: EBITDA is defined as net income plus net interest expense, income taxes, depreciation and amortization. We believe that EBITDA is a meaningful measure for investors as (i) EBITDA is a component of the measure used by our board of directors and management team to evaluate our operating performance, (ii) the senior credit facility contains covenants that require Horizon Lines Holding Corp. to maintain certain interest expense coverage and leverage ratios, which contain EBITDA and (iii) EBITDA is a measure used by our management team to make day-to-day operating decisions. |
 31 Second Quarter 2006 Earnings Release Questions & Answers |
 |
 33 |