 Third Quarter 2006 Earnings Release October 30, 2006 Exhibit 99.3 |
 2 Earnings Call Agenda Introduction and Overview – Chuck Raymond – Chairman, President & Chief Executive Officer Commercial and Operations Update – John Handy – Executive Vice President Financial Review – Mark Urbania – Senior Vice President & Chief Financial Officer Questions and Answers |
 3 Forward-Looking Statements Risks, Uncertainties, Other Factors with Respect to “Forward-Looking Statements:” Certain statements contained in this presentation constitute “forward- looking statements” within the meaning of the Private Securities Litigation Reform Act of 1995. Such statements that are not of historical fact constitute “forward-looking statements” and, accordingly, involve estimates, assumptions, judgments and uncertainties. There are a number of factors that could cause actual results or outcomes to differ materially from those addressed in the “forward-looking statements”. Such factors are detailed in the Horizon Lines, Inc.’s final prospectus filed with the Securities and Exchange Commission on September 13, 2006. Other factors may include changes in tax laws or their interpretation or application, adverse tax audits and other tax matters. |
 4 Third Quarter 2006 Earnings Release Chuck Raymond Chairman, President & Chief Executive Officer Introduction and Overview |
 5 Third Quarter Highlights Record earnings 19 th consecutive quarter of adjusted EBITDA growth Tonnage tax adopted Horizon Hunter christened and new vessels delivery and phase-in on track Horizon Edge on schedule and capturing early wins Positive economic outlook for remainder of 2006 |
 6 Third Quarter Financial Highlights Adjusted 2006 Results versus Adjusted 2005 Results 19 consecutive quarters of adjusted EBITDA growth Operating revenue increased by $15.6 million or 5.4% Adjusted operating income improved by $4.9 million or 15.8% Adjusted EBITDA higher by $3.5 million or 7.2% Adjusted net income increased by $0.9 million or 6.7% Adjusted earnings per share grew by $.03 or 7.5% |
 7 Third Quarter 2006 Earnings Release John Handy Executive Vice President Commercial and Operations Update |
 8 Rate Update Third Quarter 2006 Rate improvement in all three trades more than offset the softness in shipments Mix upgrade continues to be a factor in rate improvement with gains in refrigerated cargo Operating efficiencies help moderate contract renewal increases Maintaining responsible surcharges to offset fluctuations in fuel- related expenses |
 9 Volume Update Third Quarter 2006 Alaska volumes off to a slow start, but rebounded in September Hawaii southbound volumes impacted by the planned reduction in automobile shipments Continued uncertainty over tax law changes impacted Puerto Rico volumes Revenue Containers (3,208) 80,316 77,108 Variance 2005 2006 |
 10 Competitive Update Third Quarter 2006 No significant changes in services or market shares in any of our trades Market softness in Puerto Rico resulted in a capacity reduction in third quarter Softer summer shipping season in Alaska resulted in fewer summer sailings Horizon's competitive advantage into Guam has strengthened our position in Guam and Saipan |
 11 Economic Outlook - 2006 Optimism in Hawaii and Guam reflects the strength of military expansion and tourism Uncertainty in tax reform legislation continued to impact Puerto Rico volumes Unseasonably cool weather appeared to dampen consumer spending in Alaska Mix and margin improvements continue to deliver revenue and profitability growth |
 12 Operating Highlights Vessel enhancement initiative remains ahead of schedule Horizon Edge customer focus and service efficiency program initiative on track and delivering initial savings of $2.0 million to date Rolling stock initiative continues with 550 new replacement containers Key operating metrics illustrate excellent performance Operating efficiency and cost savings continue |
 13 Vessels Delivery and Phase-In Dates New Transpacific (TP)1 ships delivery dates remain unchanged and on schedule: March 2007 Horizon Tiger May 2007 Horizon Falcon April 2007 Horizon Eagle March 2007 Horizon Hawk November 2006 Horizon Hunter Current Outlook Horizon Hunter christened on October 11 th , with closing expected around November 30 th Targeted 2007 phase-in dates continue on track: March – Commencement of TP1 ex Asia April – Commence new Jones Act Pacific Northwest (PNW) Tacoma- Oakland-Honolulu service May – Last new TP1 vessel deployed ex Asia 3Qtr – First C8 to Puerto Rico |
 14 Horizon Edge Project Update Status Implementation commenced in May in Dallas, Honolulu, San Juan, Anchorage and Charlotte Progress and results at or ahead of schedule Early Successes Record low cost per lift in Puerto Rico Maximized container stows on TransPacific (TP) 1 vessel Record return of empty containers to Maersk in Asia Anchorage maintenance savings Initial savings of $2.0 million to date |
 15 Key Operating Metrics 84.0% 85.7% Vessel On-Time Arrivals (3) 92.9% 90.2% Vessel Utilization (2) 99.8% 99.7% Vessel Availability (1) Third Quarter 2005 Third Quarter 2006 Notes: (1) Employs a zero departure time delay tolerance (2) Based upon headhaul direction volume (3) Employs a zero arrival time delay tolerance |
 16 Operating Efficiency and Cost Savings Container Inventory – 5.9% reduction in container fleet – 40.0% reduction in containers operated by third parties – 28.5% decrease in container aging Container Maintenance – $2.9 million improvement in labor and parts costs – New refrigerated containers are costing $78.85 less on a cost per load basis – New dry boxes are costing $32.86 less on a cost per load basis |
 17 Third Quarter 2006 Earnings Release Mark Urbania Senior Vice President & Chief Financial Officer Financial Update |
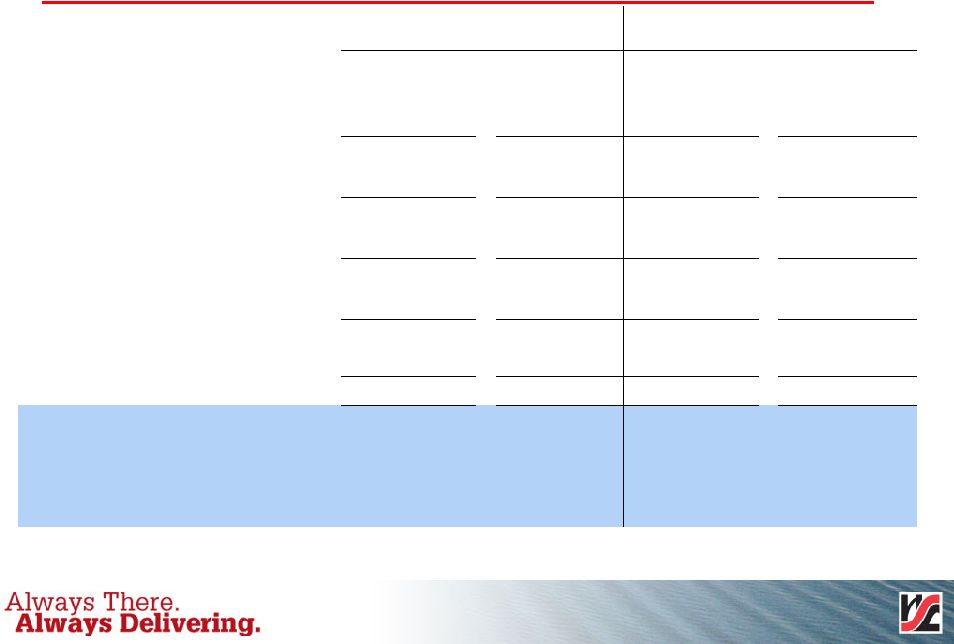
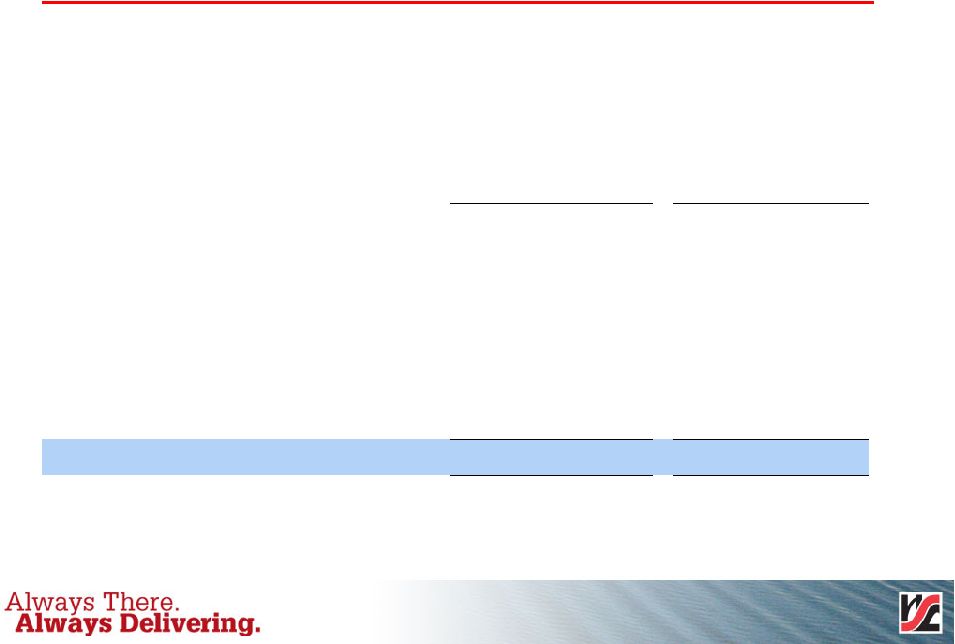
 18 Income Statement Summary – Third Quarter Adjusted (1) ($ in Millions) Actual ($ in Millions) 33,544,170 33,544,170 19,169,170 33,544,170 Shares Outstanding – Basic $ 13.4 $ 14.3 $ 2.8 $ 52.9 Net Income Common Shareholders -- -- 0.4 -- Preferred Stock Accretion 89.2% 88.2% 93.6% 88.4% Operating Ratio $ 48.3 $ 51.8 $ 35.3 $ 51.0 EBITDA $ 0.40 $ 0.43 $ 0.14 $ 1.58 Earnings Per Share – Basic 13.4 14.3 3.2 52.9 Net Income 7.2 9.5 2.2 (29.9) Income Tax Expense (Benefit) 20.6 23.8 5.4 23.0 Pretax Income 10.5 12.2 13.0 12.2 Other Expense 31.1 36.0 18.4 35.2 Operating Income 258.0 268.7 270.7 269.5 Operating Expense $ 304.7 Quarter Ended September 24, 2006 $ 289.1 $ 289.1 $ 304.7 Operating Revenue Quarter Ended September 25, 2005 Quarter Ended September 25, 2005 Quarter Ended September 24, 2006 (1) Adjusted to exclude expenses related to stock offerings and a terminated management agreement, pro forma changes in vessel lease and depreciation expense, pro forma changes in net interest expense, and impact of election of tonnage tax on 2006 results. Please see Financial Appendix for details. |
 19 Income Statement Summary – Nine Months Adjusted (1) ($ in Millions) Actual ($ in Millions) 33,544,170 33,544,170 19,043,073 33,544,170 Shares Outstanding - Basic $ 19.1 $ 24.0 $ (11.0) $ 61.7 Net Income (Loss) Common Shareholders -- -- 3.6 -- Preferred Stock Accretion 92.4% 91.4% 95.8% 91.5% Operating Ratio $ 113.7 $ 124.2 $ 85.1 $ 122.5 EBITDA $ 0.57 $ 0.72 $ (0.58) $ 1.84 Earnings (Loss) Per Share – Basic 19.1 24.0 (7.4) 61.7 Net Income (Loss) 10.8 15.1 2.4 (24.3) Income Tax Expense (Benefit) 29.9 39.1 (5.0) 37.4 Pretax Income (Loss) 31.7 36.1 39.2 36.1 Other Expense 61.6 75.2 34.2 73.5 Operating Income 755.6 794.2 783.0 795.9 Operating Expense $ 869.4 Nine Months Ended September 24, 2006 $ 817.2 $ 817.2 $ 869.4 Operating Revenue Nine Months Ended September 25, 2005 Nine Months Ended September 25, 2005 Nine Months Ended September 24, 2006 (1) Adjusted to exclude expenses related to stock offerings and a terminated management agreement, pro forma changes in vessel lease and depreciation expense, pro forma changes in net interest expense, and impact of election of tonnage tax on 2006 results. Please see Financial Appendix for details. |
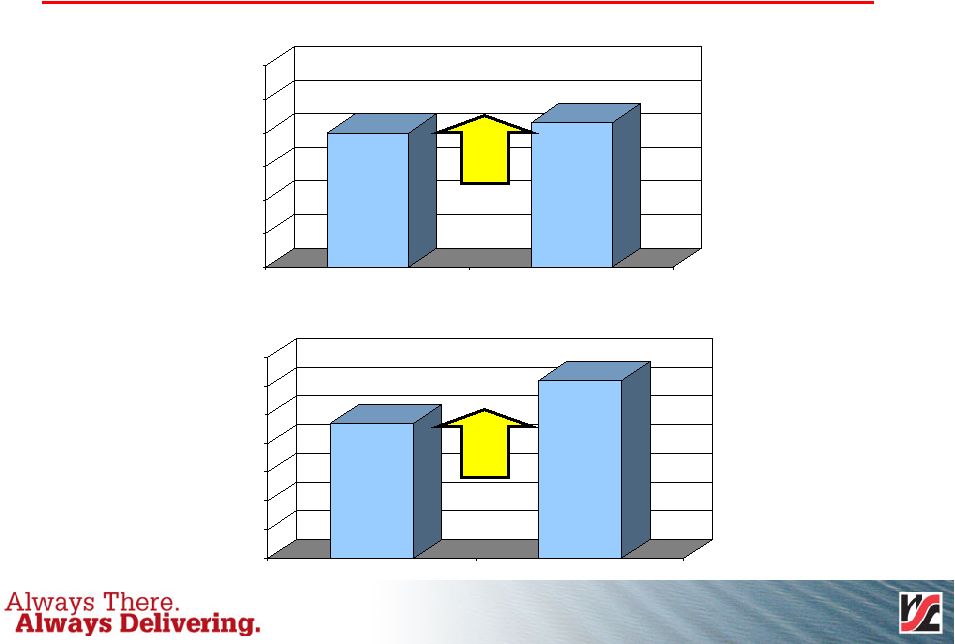
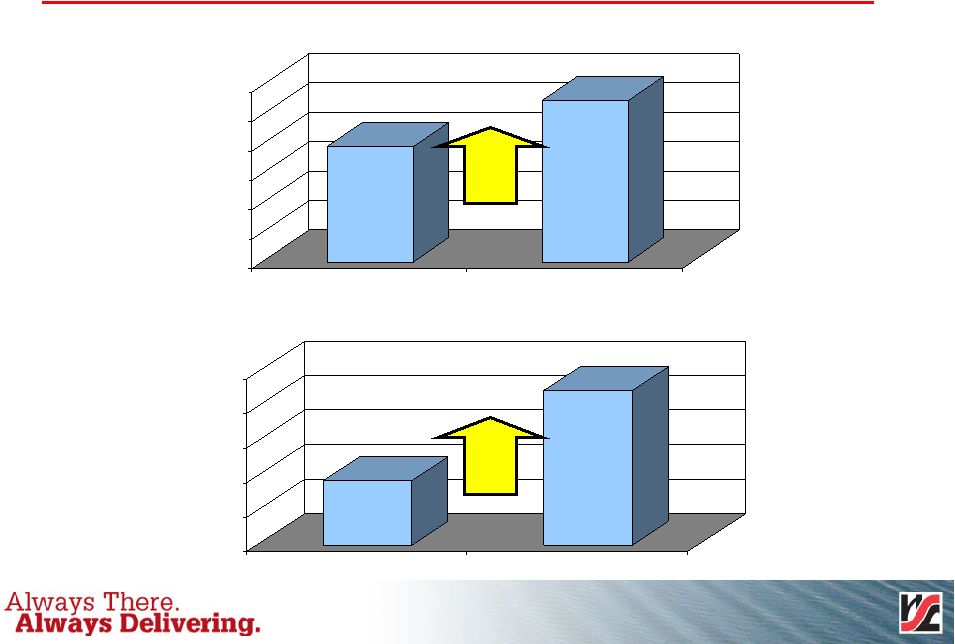 20 Operating Revenue 289.1 304.7 250 260 270 280 290 300 310 2005 2006 Third Quarter ($ in Millions) 817.2 869.4 780 800 820 840 860 880 2005 2006 Nine Months ($ in Millions) 5.4% 6.4% |
 21 Operating Revenue 34.5 12.1 Cargo Mix and Rate Improvement $ (28.0) $ (10.2) Volume Variance 42.1 14.4 Fuel Surcharges Cost Offset Revenue Growth ($ in Millions) $ 15.6 (0.7) Third Quarter 2006 $ 52.3 Total Revenue Increase 3.7 Other / Non-Transportation Revenue Nine Months 2006 |
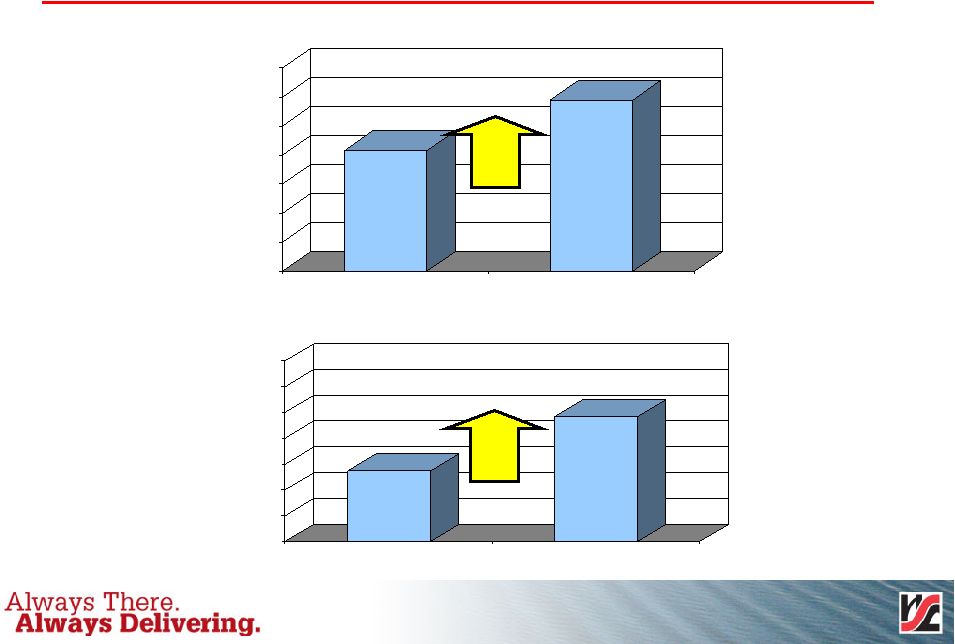 22 Adjusted EBITDA 48.3 51.8 40 42 44 46 48 50 52 54 2005 2006 Third Quarter ($ in Millions) 113.7 124.2 100 105 110 115 120 125 130 135 2005 2006 Nine Months ($ in Millions) 7.2% 9.2% |
 23 Adjusted EPS .40 .43 .00 .10 .20 .30 .40 .50 .60 2005 2006 Third Quarter .57 .72 .10 .20 .30 .40 .50 .60 .70 .80 2005 2006 Nine Months 26.3% 7.5% ($) ($) |
 24 Cash Flows 0.9 1.6 Proceeds from Asset Sales, Net of Investment (6.0) (1.2) Financing/Transaction Costs** (0.5) -- Distribution to Holders of Preferred Stock 1.1 -- Sale of Stock 12.0 0.7 Stock Compensation Cash Flow Summary ($ in Millions) $ 7.3 $ 40.4 Net Cash Flow (2.0) (3.3) Debt Repayment* 13.8 43.3 Free Cash Flow -- (11.1) Dividends (21.4) (22.5) Interest -- -- Taxes (12.6) (13.7) Dry-Dock Expenditures (29.5) (10.4) Capital Expenditures (19.8) (22.2) Working Capital $ 85.1 $ 122.5 EBITDA Nine Months September 25, 2005 Nine Months September 24, 2006 *Includes $1.3 million open market purchase of 11% Senior Discount Notes **Includes vessel financing costs and IPO and secondary offerings fees and credit agreement fees |
 25 Improving Leverage 3.5x 3.5x LTM Adj. EBITDA / LTM Interest Expense (b) 78% 72% Debt / Capitalization 3.6x 3.3x Debt / LTM Adj. EBITDA Credit Statistics: $ 682.4 $ 737.1 Total Capitalization 151.8 203.0 Equity 530.6 534.1 Total Debt 81.7 87.2 11% Notes (a) 197.0 197.0 9% Notes 251.9 249.9 Total Senior Secured Debt 0.5 0.4 Capital Leases 4.5 4.5 Vessel Mortgages 246.9 245.0 Term Loan $ --- $ --- Revolver (a) December 25, 2005 September 24, 2006 ($ in Millions) (a) Fully accreted balances were $104 million at December 25, 2005 and $102.5 million on September 24, 2006. (b) Excludes amortization of Financing Fees. December 25, 2005 and September 24, 2006 LTM Interest Expense are pro forma. |
 26 2006 Earnings Guidance $.92 - $.94 $.21 - $.23 • Adjusted (1)(2) $2.19 - $2.21 $.31 - $.33 • As Reported Full Year Fourth Quarter Earnings Guidance ($ in Millions except EPS) EPS $161 - $166 $40 - $45 EBITDA $1,155 - $1,165 $290 - $295 Operating Revenue (1) Fourth quarter excludes tonnage tax benefit of $3.3 million or $.10 per share. (2) Full year excludes tonnage tax benefit of $42.6 million or $1.28 per share, and excludes transaction costs of $1.7 million or $.04 per share. |
 27 Financial Appendix |
 28 Adjusted Operating Income Results 1.9 1.7 1.8 0.8 Transaction-Related Expense 3.8 -- 1.1 -- Lease Buyout 12.0 -- 1.6 -- IPO Restricted Stock Compensation Adjustments (a) Adjusted Operating Income ($ in Millions) (a) These charges are not anticipated to recur regularly in the ordinary course of business. $ 61.6 $ 75.2 $ 31.1 $ 36.0 Adjusted Operating Income 27.4 1.7 12.7 0.8 Total Adjustments 9.7 -- 8.2 -- Management Fees $ 18.4 Quarter Ended September 25, 2005 $ 35.2 Quarter Ended September 24, 2006 $ 34.2 $ 73.5 Operating Income Nine Months Ended September 25, 2005 Nine Months Ended September 24, 2006 |
 29 Adjusted Net Income Results -- (39.4) -- (39.4) Tonnage Tax Impact 1.9 1.7 1.8 0.8 Transaction-Related Expense 3.8 -- 1.1 -- Lease Buyout $ 19.1 30.1 (8.4) 7.5 9.7 12.0 $ (7.4) Nine Months Ended September 25, 2005 $ 24.0 (37.7) -- -- -- -- $ 61.7 Nine Months Ended September 24, 2006 (5.0) -- Tax Impact 10.6 (38.6) Total Adjustments 8.2 -- Management Fees 1.6 -- IPO Restricted Stock Compensation Adjusted Net Income ($ in Millions) $ 13.4 $ 14.3 Adjusted Net Income 2.5 -- Interest Expense Reduction Adjustments $ 3.2 $ 52.9 Net Income (Loss) Quarter Ended September 25, 2005 Quarter Ended September 24, 2006 |
 30 Net Income/EBITDA Reconciliation 1.9 1.7 1.8 0.8 Transaction-Related Expense 5.0 -- 1.4 -- Lease Buyout $ 113.7 9.7 12.0 85.1 50.9 2.4 39.2 $ (7.4) Nine Months Ended September 25, 2005 $ 124.2 -- -- 122.5 48.9 (24.3) 36.2 $ 61.7 Nine Months Ended September 24, 2006 8.2 -- Management Fees 1.6 -- IPO Restricted Stock Compensation Net Income/EBITDA Reconciliation ($ in Millions) $ 48.3 $ 51.8 Adjusted EBITDA 35.3 51.0 EBITDA 16.9 15.8 Depreciation and Amortization 2.2 (29.9) Tax Expense 13.0 12.2 Interest Expense, Net $ 3.2 $ 52.9 Net Income (Loss) Quarter Ended September 25, 2005 Quarter Ended September 24, 2006 Note: EBITDA is defined as net income plus net interest expense, income taxes, depreciation and amortization. We believe that EBITDA is a meaningful measure for investors as (i) EBITDA is a component of the measure used by our board of directors and management team to evaluate our operating performance, (ii) the senior credit facility contains covenants that require Horizon Lines Holding Corp. to maintain certain interest expense coverage and leverage ratios, which contain EBITDA and (iii) EBITDA is a measure used by our management team to make day-to-day operating decisions. |
 31 Third Quarter 2006 Earnings Release Questions & Answers |
 |
 33 ® |