Exhibit 99.3
2007 Earnings Guidance January 12, 2007
Agenda
Introduction and Overview
– Chuck Raymond – Chairman, President & Chief Executive Officer
Commercial and Operations Outlook
– John Handy – Executive Vice President
Financial Outlook
– Mike Avara – Vice President, Investor Relations & Treasurer
Questions and Answers
Forward-Looking Statements
Risks, Uncertainties, Other Factors with Respect to “Forward-Looking Statements:”
Certain statements contained in this presentation constitute “forward-looking statements” within the meaning of the Private Securities Litigation Reform Act of 1995. Such statements that are not of historical fact constitute “forward-looking statements” and, accordingly, involve estimates, assumptions, judgments and uncertainties. There are a number of factors that could cause actual results or outcomes to differ materially from those addressed in the “forward-looking statements”. Such factors are detailed in the Horizon Lines, Inc.’s final prospectus filed with the Securities and Exchange Commission on November 17, 2006. Other factors may include changes in tax laws or their interpretation or application, adverse tax audits and other tax matters.
2007 Earnings Guidance
Chuck Raymond
Chairman, President & Chief Executive Officer
Introduction and Overview
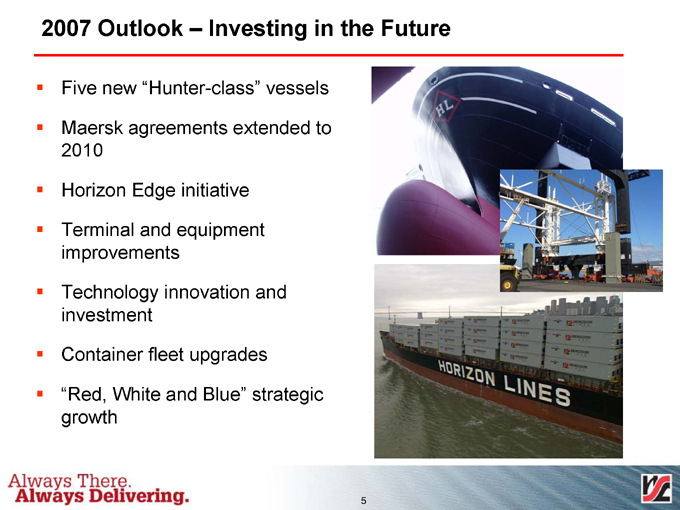
2007 Outlook – Investing in the Future
Five new “Hunter-class” vessels
Maersk agreements extended to 2010
Horizon Edge initiative
Terminal and equipment improvements
Technology innovation and investment
Container fleet upgrades
”Red, White and Blue” strategic growth
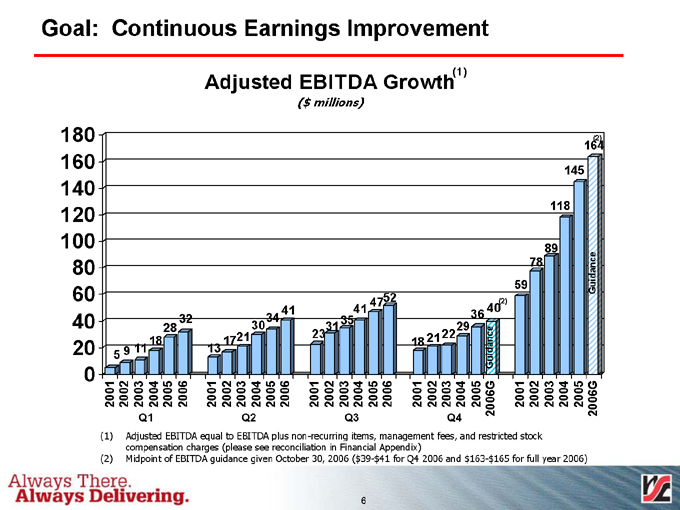
Goal: Continuous Earnings Improvement
(1)
Adjusted EBITDA Growth
($ millions)
180 160 140 120 100 80 60 40 20 0
28 32 18 5 9 11
41 3034 21 13 17
52 41 47 35 23 31 (2)
36 40 29 Guidance 18 2122 (2)
164 145 118 89 78 Guidance 59
2001 2002 2003 2004 2005 2006
2001 2002 2003 2004 2005 2006
2001 2002 2003 2004 2005 2006
2001 2002 2003 2004 2005 2006G
2001 2002 2003 2004 2005 2006G
Q1 Q2 Q3 Q4
(1) Adjusted EBITDA equal to EBITDA plus non-recurring items, management fees, and restricted stock compensation charges (please see reconciliation in Financial Appendix)
(2) Midpoint of EBITDA guidance given October 30, 2006 ($39-$41 for Q4 2006 and $163-$165 for full year 2006)
2007 Earnings Guidance
John Handy Executive Vice President
Commercial and Operations Outlook
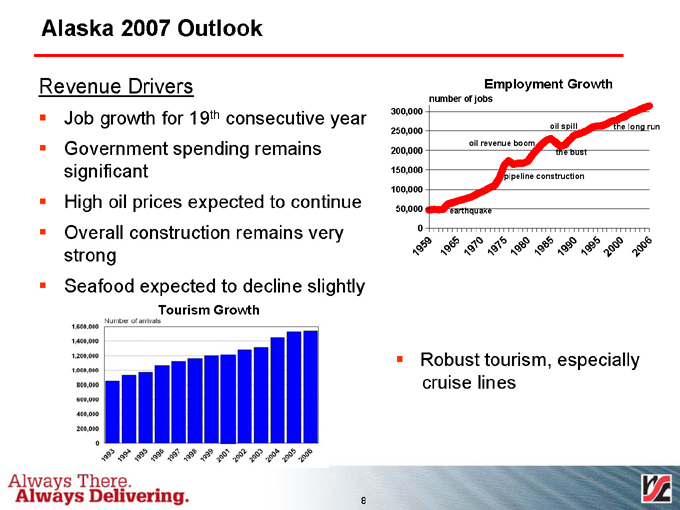
Alaska 2007 Outlook
Revenue Drivers
Job growth for 19th consecutive year
Government spending remains significant
High oil prices expected to continue
Overall construction remains very strong
Seafood expected to decline slightly
Tourism Growth
Employment Growth
number of jobs
300,000 250,000 200,000 150,000 100,000 50,000 0
19 59 19 65 19 70 19 75 19 80 19 85 19 90 19 9 5 2 00 0 20 06
Robust tourism, especially cruise lines
1,600,000 1,400,000 1,200,000 1,000,000 800,000 600,000 400,000 200,000 0
1993 1994 1995 1996 1997 1998 1999 2001 2002 2003 2004 2005 2006
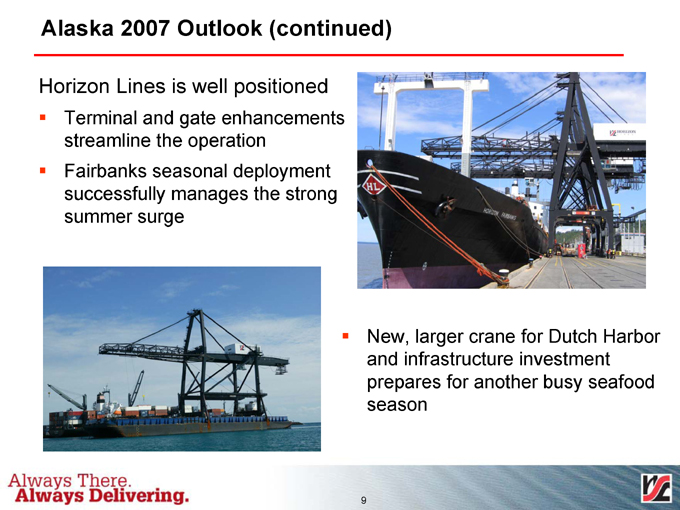
Alaska 2007 Outlook (continued)
Horizon Lines is well positioned
Terminal and gate enhancements streamline the operation
Fairbanks seasonal deployment successfully manages the strong summer surge
New, larger crane for Dutch Harbor and infrastructure investment prepares for another busy seafood season
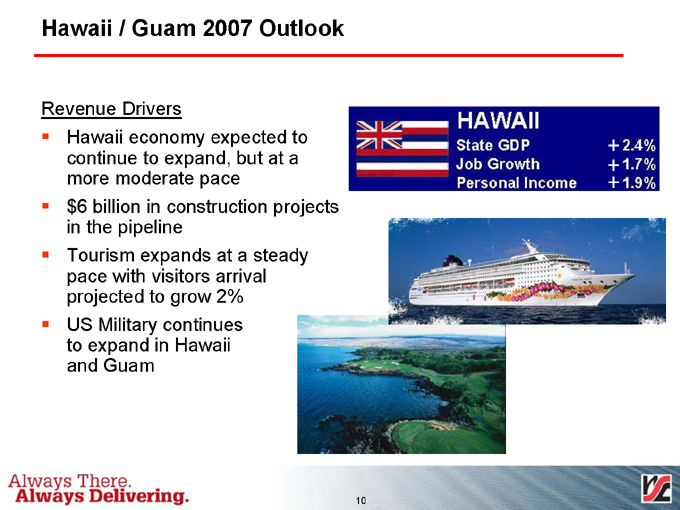
Hawaii / Guam 2007 Outlook
Revenue Drivers
Hawaii economy expected to continue to expand, but at a more moderate pace
$6 billion in construction projects in the pipeline
Tourism expands at a steady pace with visitors arrival projected to grow 2%
US Military continues to expand in Hawaii and Guam
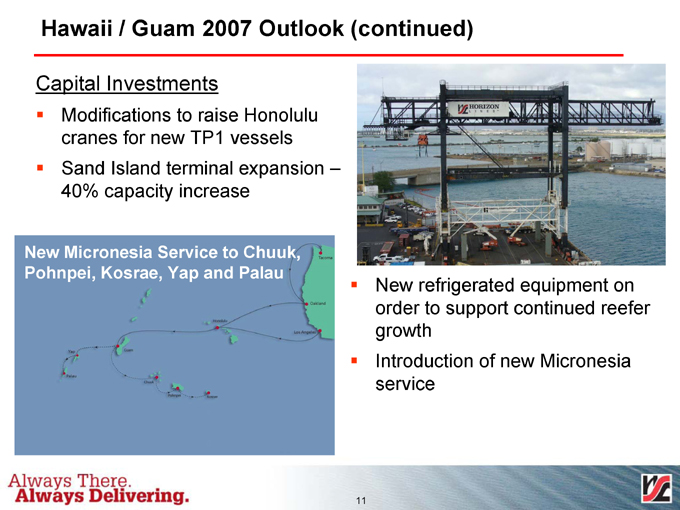
Hawaii / Guam 2007 Outlook (continued)
Capital Investments
Modifications to raise Honolulu cranes for new TP1 vessels
Sand Island terminal expansion – 40% capacity increase
New Micronesia Service to Chuuk, Pohnpei, Kosrae, Yap and Palau
New refrigerated equipment on order to support continued reefer growth
Introduction of new Micronesia service
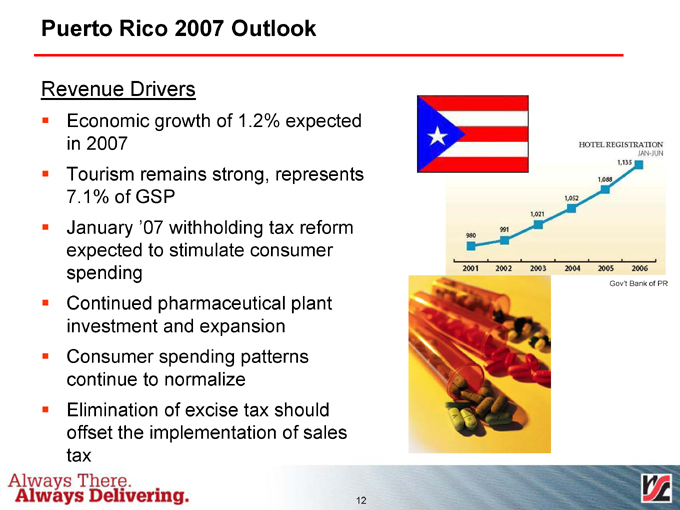
Puerto Rico 2007 Outlook
Revenue Drivers
Economic growth of 1.2% expected in 2007
Tourism remains strong, represents 7.1% of GSP
January ‘07 withholding tax reform expected to stimulate consumer spending
Continued pharmaceutical plant investment and expansion
Consumer spending patterns continue to normalize
Elimination of excise tax should offset the implementation of sales tax
HOTEL REGISTRATION JAN-JUN
980 991 1,021 1,052 1,088 1,135
2001 2002 2003 2004 2005 2006
Gov’t Bank of PR
Puerto Rico 2007 Outlook (continued)
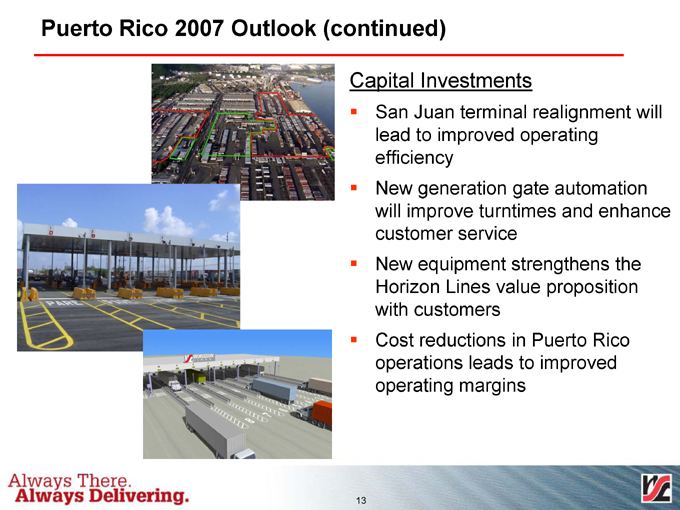
Capital Investments
San Juan terminal realignment will lead to improved operating efficiency
New generation gate automation will improve turntimes and enhance customer service
New equipment strengthens the Horizon Lines value proposition with customers
Cost reductions in Puerto Rico operations leads to improved operating margins
Refrigerated Containers
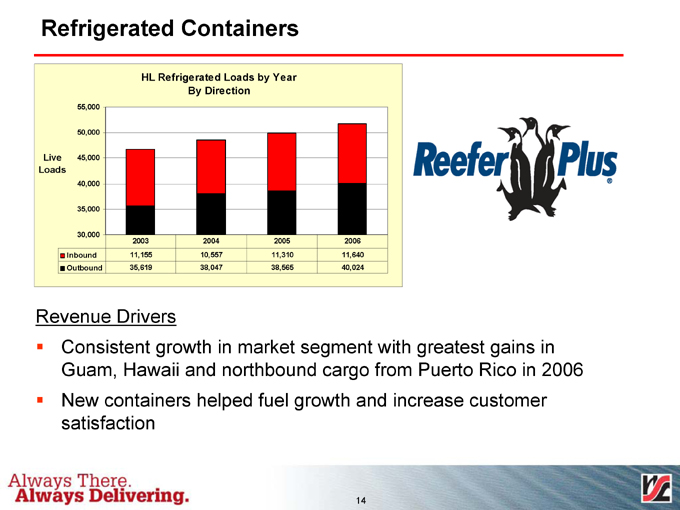
HL Refrigerated Loads by Year By Direction
Live Loads
55,000 50,000 45,000 40,000 35,000 30,000
2003 2004 2005 2006 Inbound 11,155 10,557 11,310 11,640
Outbound 35,619 38,047 38,565 40,024
Revenue Drivers
Consistent growth in market segment with greatest gains in Guam, Hawaii and northbound cargo from Puerto Rico in 2006
New containers helped fuel growth and increase customer satisfaction
Refrigerated Containers (continued)
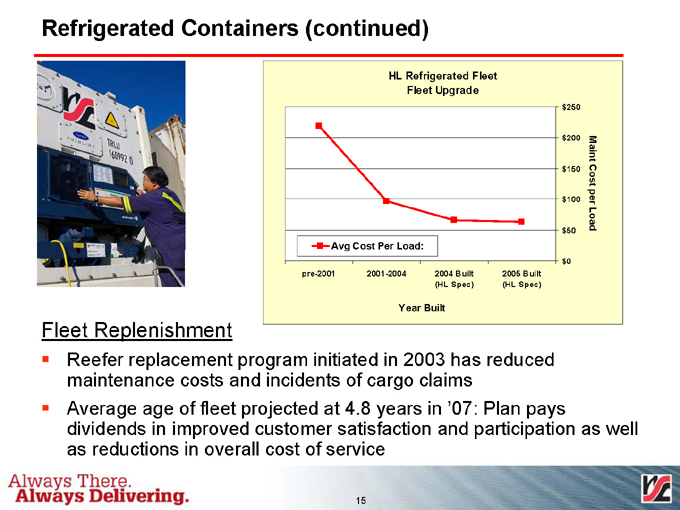
HL Refrigerated Fleet Fleet Upgrade
Avg Cost Per Load:
$250 $200 $150 $100 $50 $0
Maint Cost per Load
pre-2001 2001-2004 2004 Built 2005 Built (HL Spec)(HL Spec)
Year Built
Fleet Replenishment
Reefer replacement program initiated in 2003 has reduced maintenance costs and incidents of cargo claims
Average age of fleet projected at 4.8 years in ‘07: Plan pays dividends in improved customer satisfaction and participation as well as reductions in overall cost of service
Horizon TP1 (Transpacific 1) Significance
Replace older and smaller Jones Act vessels with new, less expensive to operate vessels in a capital efficient manner
Dedicate Jones Act vessels to serve only Jones Act markets, creating additional capacity and improving slot cost economics in our Hawaii and Puerto Rico trade lanes
Better serve customers’ needs as well as foster growth in the near term
New and improved TP1 service provides basis to extend agreements with Maersk, yielding stability and continued benefits through end of 2010
TP1 initiative is the first critical step in Horizon Lines’ fleet enhancement program that will generate long-term value for our customers and shareholders
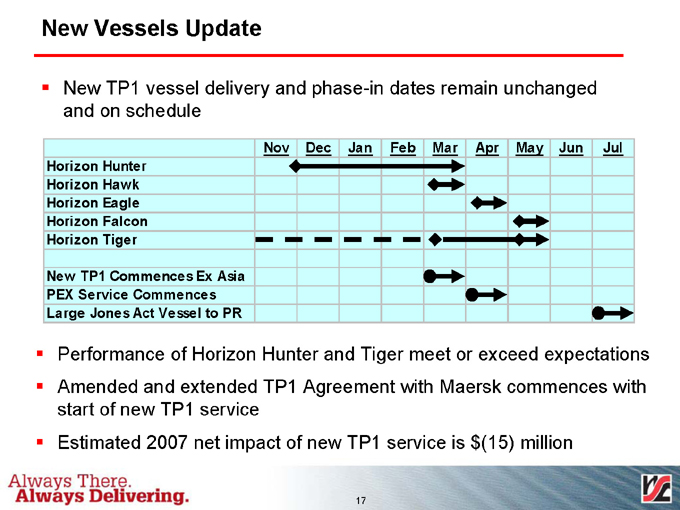
New Vessels Update
New TP1 vessel delivery and phase-in dates remain unchanged and on schedule
Horizon Hunter
Horizon Hawk
Horizon Eagle
Horizon Falcon
Horizon Tiger
New TP1 Commences Ex Asia
PEX Service Commences
Large Jones Act Vessel to PR
Nov Dec Jan Feb Mar Apr May Jun Jul
Performance of Horizon Hunter and Tiger meet or exceed expectations
Amended and extended TP1 Agreement with Maersk commences with start of new TP1 service
Estimated 2007 net impact of new TP1 service is $(15) million
Horizon Edge Significance
Edge will improve margin through better visibility into all company processes and cost drivers
Edge focus is always on customer satisfaction
Edge is also an investment in our most prized assets – our associates
Edge clarifies individual roles and responsibilities, provides training in new tools and systems, and provides clear performance expectations and accountabilities through coaching and mentoring activities
2006 Recap
All 2006 milestones achieved
Gross benefits / cost reduction ahead of plan = $3.9M vs. budget of $3.0M
2007 Savings Target
2007 net benefits projection remains at a minimum of $13M
Horizon Edge Significance (continued)
Current Sources of Benefits
Offshore Ports: Puerto Rico, Hawaii, and Alaska
Cost per lift reduced at all locations
Crane lifts per hour improved in all locations
Yard cost reductions in all locations
Crane operations and maintenance costs reduced in San Juan
Implementing in Guam, Kodiak, and Dutch Harbor in Q1 2007
Supply Chain
Web based equipment visibility tools implemented
Data integrity improvement process launched
Record number of containers returned to Asia for Maersk
Reduced cost per move over North America trucking network
Automated dispatch planning process implemented
Horizon Edge Significance (continued)
Current Sources of Benefits (cont.)
Sales
Sales performance metrics / tools implemented
System upgrades and pricing / sales tool enhancements in progress
Process alignment meetings being held
Domestic Ports
Kicked off ahead of schedule in Q4 2006
Tacoma is first of 6 domestic ports to be implemented in 2007
Horizon Edge Significance (continued)
2007 Focus = minimum of $13M of net savings / cost reduction
Equipment turntime / aging reduction program
Vessel fuel consumption reduction program
Order fulfillment process improvement
Domestic port implementation continues
Offshore port continues process improvements
Sales & Marketing revenue goals focus on integration of sales / operations goals and metrics
Inland truck / rail coordination
Organizational efficiency and process improvements
2007 Capital Outlook
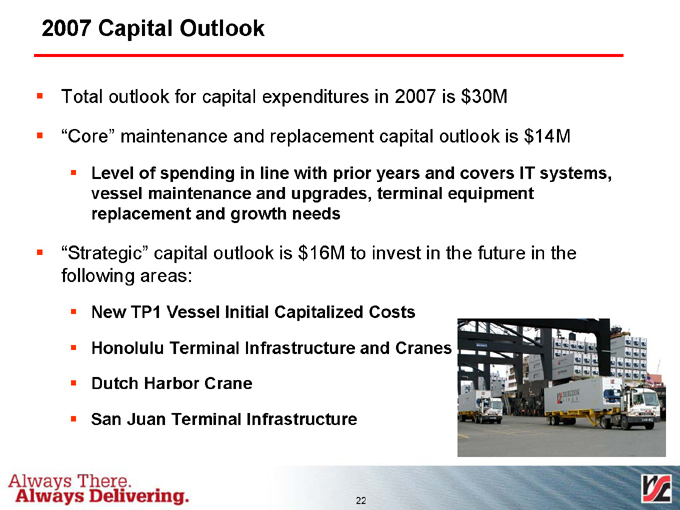
Total outlook for capital expenditures in 2007 is $30M
‘‘Core” maintenance and replacement capital outlook is $14M
Level of spending in line with prior years and covers IT systems, vessel maintenance and upgrades, terminal equipment replacement and growth needs
”Strategic��� capital outlook is $16M to invest in the future in the following areas:
New TP1 Vessel Initial Capitalized Costs
Honolulu Terminal Infrastructure and Cranes
Dutch Harbor Crane
San Juan Terminal Infrastructure
2007 Dry-dock Expense
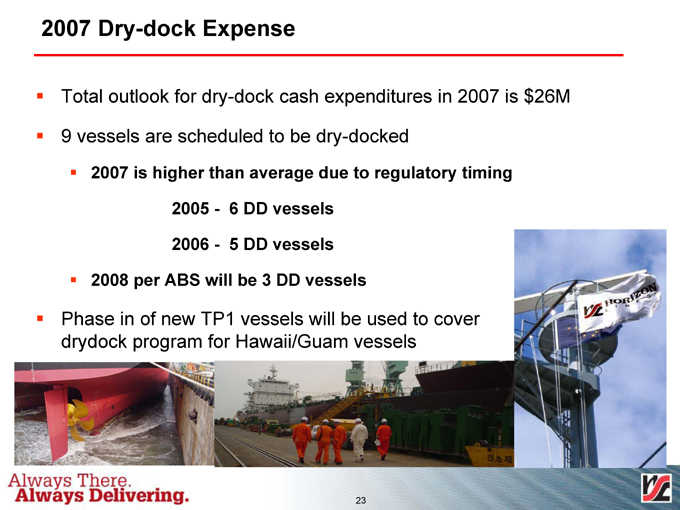
Total outlook for dry-dock cash expenditures in 2007 is $26M
9 vessels are scheduled to be dry-docked
2007 is higher than average due to regulatory timing
2005 - 6 DD vessels
2006 - 5 DD vessels
2008 per ABS will be 3 DD vessels
Phase in of new TP1 vessels will be used to cover drydock program for Hawaii/Guam vessels

2007 Earnings Guidance
Mike Avara
Vice President, Investor Relations & Treasurer
Financial Update
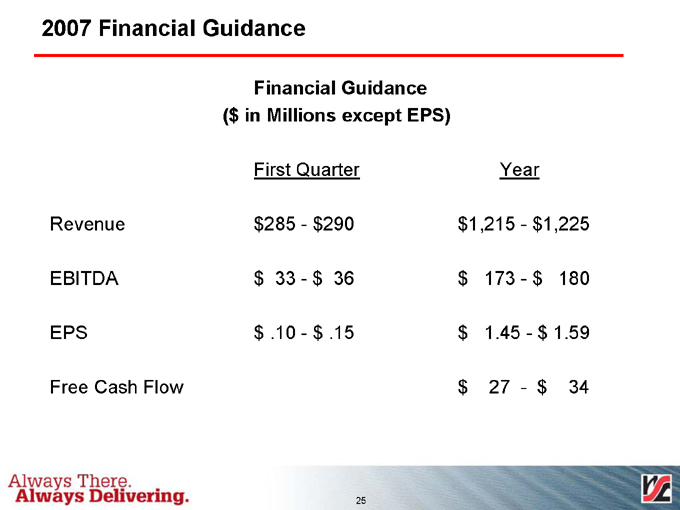
2007 Financial Guidance
Financial Guidance ($ in Millions except EPS)
Revenue EBITDA EPS Free Cash Flow
First Quarter $285 - $290 $ 33 - $ 36 $ .10 - $ .15
Year $1,215 - $1,225 $ 173 - $ 180 $ 1.45 - $ 1.59
$27 - $ 34
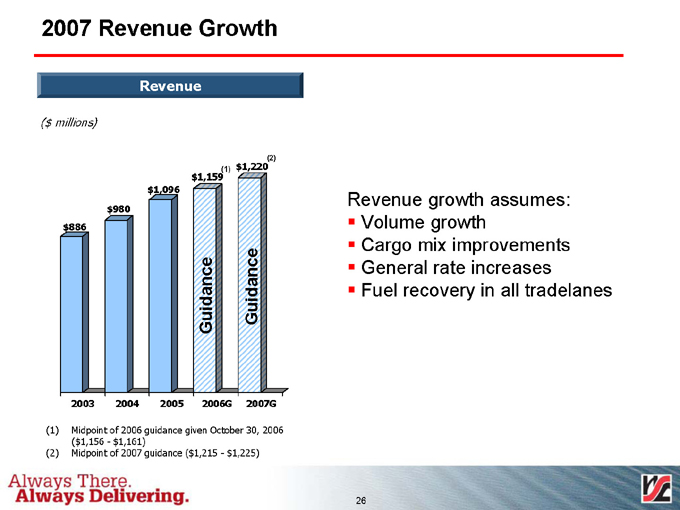
2007 Revenue Growth
Revenue
($ millions)
(2)
(1) $1,220 $1,159 $1,096 $980 $886
Guidance Guidance
2003 2004 2005 2006G 2007G
(1) Midpoint of 2006 guidance given October 30, 2006
($1,156 - $1,161)
(2) Midpoint of 2007 guidance ($1,215 - $1,225)
Revenue growth assumes:
Volume growth
Cargo mix improvements
General rate increases
Fuel recovery in all tradelanes
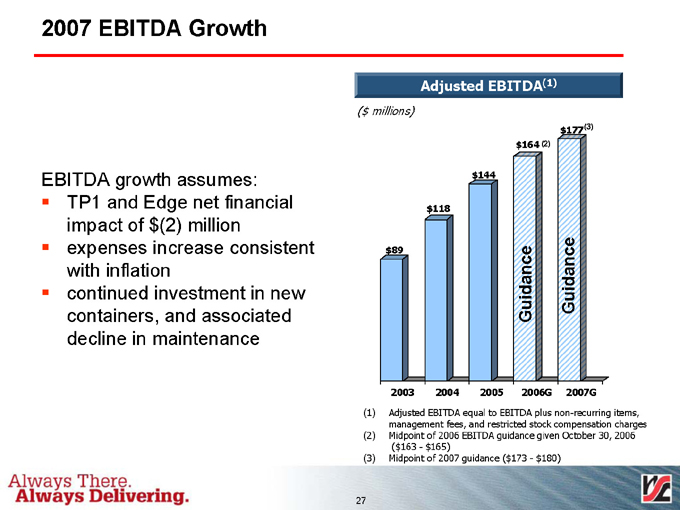
2007 EBITDA Growth
Adjusted EBITDA(1)
($ millions)
EBITDA growth assumes:
TP1 and Edge net financial impact of $(2) million
expenses increase consistent with inflation
continued investment in new containers, and associated decline in maintenance
$177(3) $164 (2)
$144
$118
$89 Guidance Guidance
2003 2004 2005 2006G 2007G
(1) Adjusted EBITDA equal to EBITDA plus non-recurring items, management fees, and restricted stock compensation charges
(2) Midpoint of 2006 EBITDA guidance given October 30, 2006 ($163 - $165)
(3) Midpoint of 2007 guidance ($173 - $180)
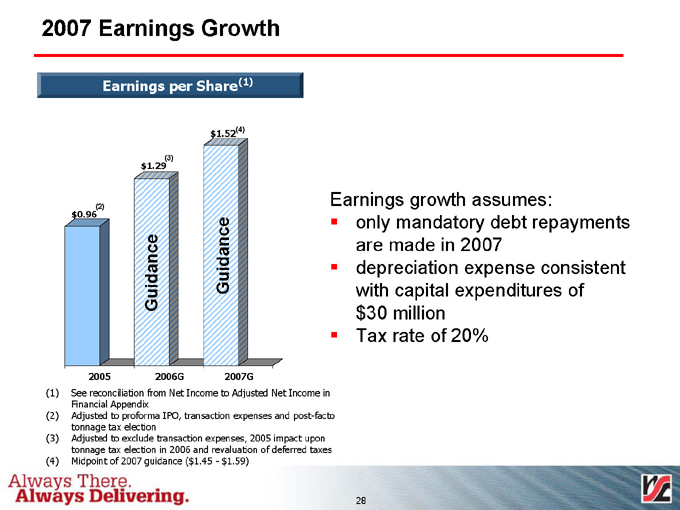
2007 Earnings Growth
Earnings per Share(1)
$1.52(4)
(3) $1.29
(2) $0.96
Guidance Guidance
2005 2006G 2007G
(1) See reconciliation from Net Income to Adjusted Net Income in Financial Appendix
(2) Adjusted to proforma IPO, transaction expenses and post-facto tonnage tax election
(3) Adjusted to exclude transaction expenses, 2005 impact upon tonnage tax election in 2006 and revaluation of deferred taxes
(4) Midpoint of 2007 guidance ($1.45 - $1.59)
Earnings growth assumes:
only mandatory debt repayments are made in 2007
depreciation expense consistent with capital expenditures of $30 million
Tax rate of 20%
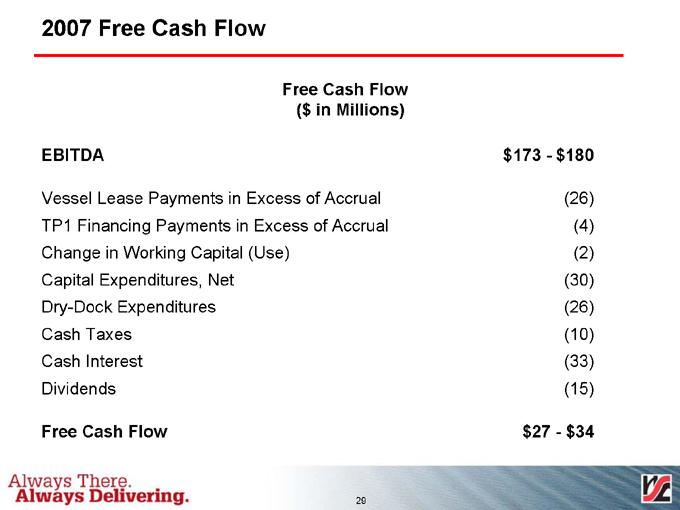
2007 Free Cash Flow
Free Cash Flow ($ in Millions)
EBITDA
Vessel Lease Payments in Excess of Accrual
TP1 Financing Payments in Excess of Accrual
Change in Working Capital (Use)
Capital Expenditures, Net
Dry-Dock Expenditures
Cash Taxes
Cash Interest
Dividends
Free Cash Flow
$173 - $180
(26) (4) (2) (30) (26) (10) (33) (15)
$27 - $34
2007 Earnings Guidance
Questions & Answers
Financial Appendix
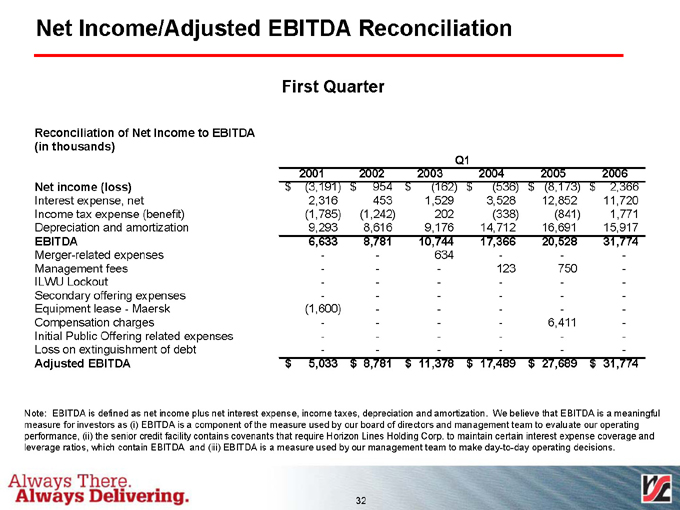
Net Income/Adjusted EBITDA Reconciliation
First Quarter
Reconciliation of Net Income to EBITDA
(in thousands)
Q1
2001
2002
2003
2004
2005
2006
Net income (loss)
$(3,191)
$954
$(162)
$(536)
$(8,173)
$2,366
Interest expense, net
2,316
453
1,529
3,528
12,852
11,720
Income tax expense (benefit)
(1,785)
(1,242)
202
(338)
(841)
1,771
Depreciation and amortization
9,293
8,616
9,176
14,712
16,691
15,917
EBITDA
6,633
8,781
10,744
17,366
20,528
31,774
Merger-related expenses
—
—
634
—
—
—
Management fees
—
—
—
123
750
—
ILWU Lockout
—
—
—
—
—
—
Secondary offering expenses
—
—
—
—
—
—
Equipment lease - Maersk
(1,600)
—
—
—
—
—
Compensation charges
—
—
—
—
6,411
—
Initial Public Offering related expenses
—
—
—
—
—
—
Loss on extinguishment of debt
—
—
—
—
—
—
Adjusted EBITDA
$5,033
$8,781
$11,378
$17,489
$27,689
$31,774
Note: EBITDA is defined as net income plus net interest expense, income taxes, depreciation and amortization. We believe that EBITDA is a meaningful measure for investors as (i) EBITDA is a component of the measure used by our board of directors and management team to evaluate our operating performance, (ii) the senior credit facility contains covenants that require Horizon Lines Holding Corp. to maintain certain interest expense coverage and leverage ratios, which contain EBITDA and (iii) EBITDA is a measure used by our management team to make day-to-day operating decisions.
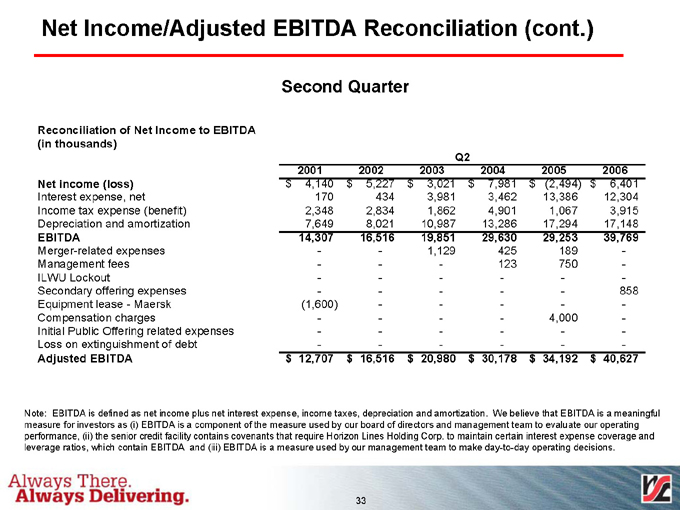
Net Income/Adjusted EBITDA Reconciliation (cont.)
Second Quarter
Reconciliation of Net Income to EBITDA
(in thousands)
Q2
2001
2002
2003
2004
2005
2006
Net income (loss)
$4,140
$5,227
$3,021
$7,981
$(2,494)
$6,401
Interest expense, net
170
434
3,981
3,462
13,386
12,304
Income tax expense (benefit)
2,348
2,834
1,862
4,901
1,067
3,915
Depreciation and amortization
7,649
8,021
10,987
13,286
17,294
17,148
EBITDA
14,307
16,516
19,851
29,630
29,253
39,769
Merger-related expenses
—
—
1,129
425
189
—
Management fees
—
—
—
123
750
—
ILWU Lockout
—
—
—
—
—
—
Secondary offering expenses
—
—
—
—
—
858
Equipment lease - Maersk
(1,600)
—
—
—
—
—
Compensation charges
—
—
—
—
4,000
—
Initial Public Offering related expenses
—
—
—
—
—
—
Loss on extinguishment of debt
—
—
—
—
—
—
Adjusted EBITDA
$12,707
$16,516
$20,980
$30,178
$34,192
$40,627
Note: EBITDA is defined as net income plus net interest expense, income taxes, depreciation and amortization. We believe that EBITDA is a meaningful measure for investors as (i) EBITDA is a component of the measure used by our board of directors and management team to evaluate our operating performance, (ii) the senior credit facility contains covenants that require Horizon Lines Holding Corp. to maintain certain interest expense coverage and leverage ratios, which contain EBITDA and (iii) EBITDA is a measure used by our management team to make day-to-day operating decisions.
Net Income/Adjusted EBITDA Reconciliation (cont.)
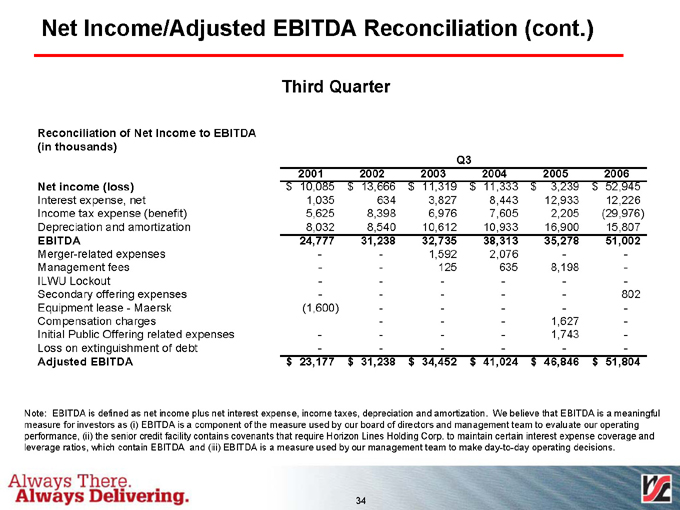
Third Quarter
Reconciliation of Net Income to EBITDA
(in thousands)
Q3
2001
2002
2003
2004
2005
2006
Net income (loss)
$10,085
$13,666
$11,319
$11,333
$3,239
$52,945
Interest expense, net
1,035
634
3,827
8,443
12,933
12,226
Income tax expense (benefit)
5,625
8,398
6,976
7,605
2,205
(29,976)
Depreciation and amortization
8,032
8,540
10,612
10,933
16,900
15,807
EBITDA
24,777
31,238
32,735
38,313
35,278
51,002
Merger-related expenses
—
—
1,592
2,076
—
—
Management fees
—
—
125
635
8,198
—
ILWU Lockout
—
—
—
—
—
—
Secondary offering expenses
—
—
—
—
—
802
Equipment lease - Maersk
(1,600)
—
—
—
—
—
Compensation charges
—
—
—
1,627
—
Initial Public Offering related expenses
—
—
—
—
1,743
—
Loss on extinguishment of debt
—
—
—
—
—
—
Adjusted EBITDA
$23,177
$31,238
$34,452
$41,024
$46,846
$51,804
Note: EBITDA is defined as net income plus net interest expense, income taxes, depreciation and amortization. We believe that EBITDA is a meaningful measure for investors as (i) EBITDA is a component of the measure used by our board of directors and management team to evaluate our operating performance, (ii) the senior credit facility contains covenants that require Horizon Lines Holding Corp. to maintain certain interest expense coverage and leverage ratios, which contain EBITDA and (iii) EBITDA is a measure used by our management team to make day-to-day operating decisions.
Net Income/Adjusted EBITDA Reconciliation (cont.)
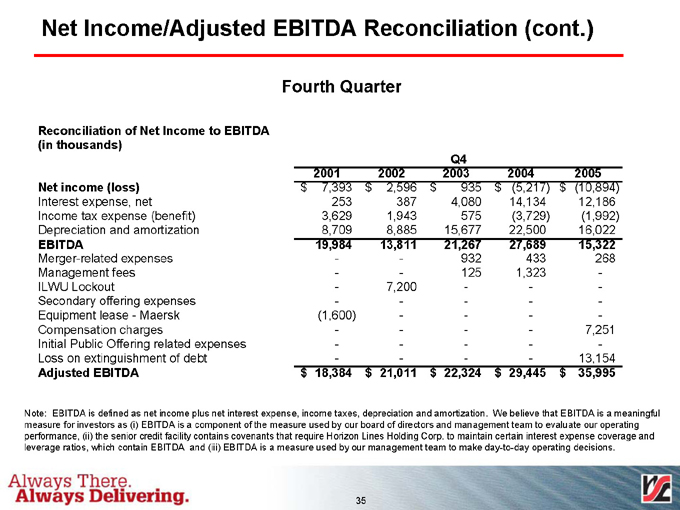
Fourth Quarter
Reconciliation of Net Income to EBITDA
(in thousands)
Q4
2001
2002
2003
2004
2005
Net income (loss)
$7,393
$2,596
$935
$(5,217)
$(10,894)
Interest expense, net
253
387
4,080
14,134
12,186
Income tax expense (benefit)
3,629
1,943
575
(3,729)
(1,992)
Depreciation and amortization
8,709
8,885
15,677
22,500
16,022
EBITDA
19,984
13,811
21,267
27,689
15,322
Merger-related expenses
—
—
932
433
268
Management fees
—
—
125
1,323
—
ILWU Lockout
—
7,200
—
—
—
Secondary offering expenses
—
—
—
—
—
Equipment lease - Maersk
(1,600)
—
—
—
—
Compensation charges
—
—
—
—
7,251
Initial Public Offering related expenses
—
—
—
—
—
Loss on extinguishment of debt
—
—
—
—
13,154
Adjusted EBITDA
$18,384
$21,011
$22,324
$29,445
$35,995
Note: EBITDA is defined as net income plus net interest expense, income taxes, depreciation and amortization. We believe that EBITDA is a meaningful measure for investors as (i) EBITDA is a component of the measure used by our board of directors and management team to evaluate our operating performance, (ii) the senior credit facility contains covenants that require Horizon Lines Holding Corp. to maintain certain interest expense coverage and leverage ratios, which contain EBITDA and (iii) EBITDA is a measure used by our management team to make day-to-day operating decisions.
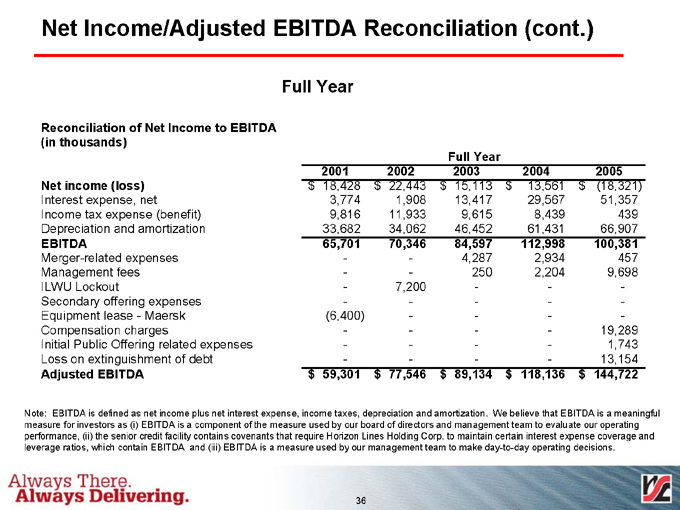
Net Income/Adjusted EBITDA Reconciliation (cont.)
Full Year
Reconciliation of Net Income to EBITDA
(in thousands)
Full Year
2001
2002
2003
2004
2005
Net income (loss)
$18,428
$22,443
$15,113
$13,561
$(18,321)
Interest expense, net
3,774
1,908
13,417
29,567
51,357
Income tax expense (benefit)
9,816
11,933
9,615
8,439
439
Depreciation and amortization
33,682
34,062
46,452
61,431
66,907
EBITDA
65,701
70,346
84,597
112,998
100,381
Merger-related expenses
—
—
4,287
2,934
457
Management fees
—
—
250
2,204
9,698
ILWU Lockout
—
7,200
—
—
—
Secondary offering expenses
—
—
—
—
—
Equipment lease - Maersk
(6,400)
—
—
—
—
Compensation charges
—
—
—
—
19,289
Initial Public Offering related expenses
—
—
—
—
1,743
Loss on extinguishment of debt
—
—
—
—
13,154
Adjusted EBITDA
$59,301
$77,546
$89,134
$118,136
$144,722
Note: EBITDA is defined as net income plus net interest expense, income taxes, depreciation and amortization. We believe that EBITDA is a meaningful measure for investors as (i) EBITDA is a component of the measure used by our board of directors and management team to evaluate our operating performance, (ii) the senior credit facility contains covenants that require Horizon Lines Holding Corp. to maintain certain interest expense coverage and leverage ratios, which contain EBITDA and (iii) EBITDA is a measure used by our management team to make day-to-day operating decisions.
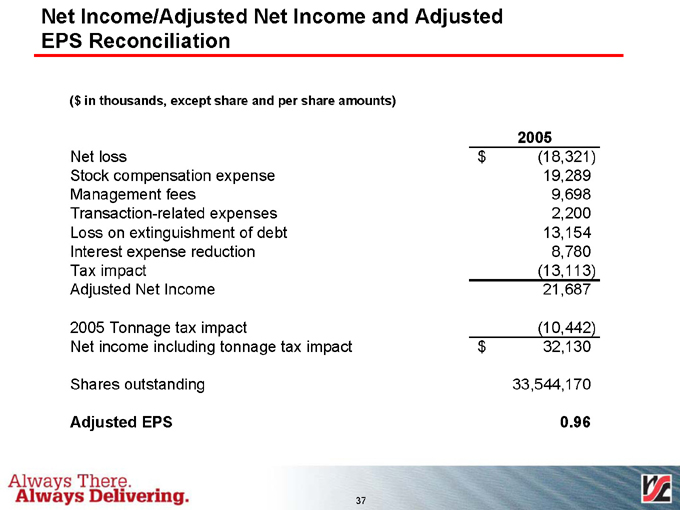
Net Income/Adjusted Net Income and Adjusted EPS Reconciliation
($ in thousands, except share and per share amounts)
2005
Net loss
$(18,321)
Stock compensation expense
19,289
Management fees
9,698
Transaction-related expenses
2,200
Loss on extinguishment of debt
13,154
Interest expense reduction
8,780
Tax impact
(13,113)
Adjusted Net Income
21,687
2005 Tonnage tax impact
(10,442)
Net income including tonnage tax impact
$32,130
Shares outstanding
33,544,170
Adjusted EPS
0.96
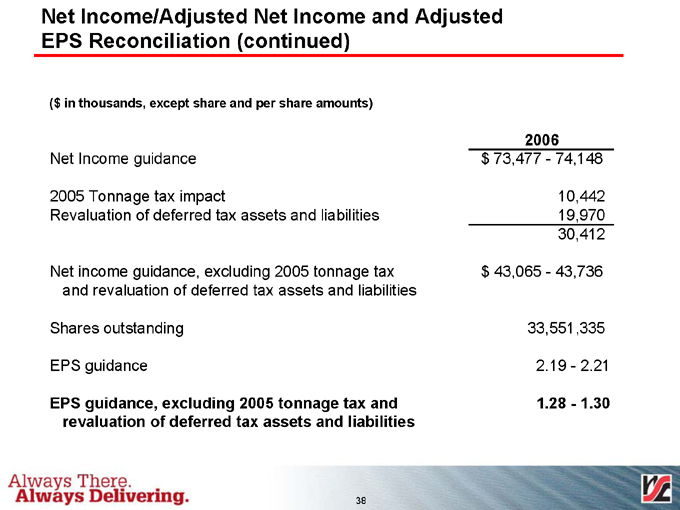
Net Income/Adjusted Net Income and Adjusted EPS Reconciliation (continued)
($ in thousands, except share and per share amounts)
Net Income guidance
2005 Tonnage tax impact
Revaluation of deferred tax assets and liabilities
Net income guidance, excluding 2005 tonnage tax and revaluation of deferred tax assets and liabilities
Shares outstanding
EPS guidance
EPS guidance, excluding 2005 tonnage tax and revaluation of deferred tax assets and liabilities
2006
$ 73,477 - 74,148
10,442 19,970
30,412
$ 43,065 - 43,736
33,551,335
2.19 - 2.21
1.28 - 1.30

40®