 FOURTH QUARTER 2006 EARNINGS RELEASE MARCH 2, 2007 Exhibit 99.3 |
 2 Forward-Looking Statements Risks, Uncertainties, Other Factors with Respect to “Forward-Looking Statements”: Certain statements contained in this presentation constitute “forward- looking statements” within the meaning of the Private Securities Litigation Reform Act of 1995. Such statements that are not of historical fact constitute “forward-looking statements” and, accordingly, involve estimates, assumptions, judgments and uncertainties. There are a number of factors that could cause actual results or outcomes to differ materially from those addressed in the “forward-looking statements”. Such factors are detailed in the Horizon Lines, Inc.’s final prospectus filed with the Securities and Exchange Commission on November 17, 2006. . |
 3 Earnings Call Agenda Introduction and Overview Chuck Raymond – Chairman, President & Chief Executive Officer Operations Review John Handy – Executive Vice President Financial Review Mark Urbania – Senior Vice President & Chief Financial Officer Questions and Answers . |
 4 Fourth Quarter 2006 Earnings Release Chuck Raymond Chairman, President & Chief Executive Officer Introduction and Overview . |
 5 Fourth Quarter and 2006 Highlights Transition to full public company status Fleet enhancement initiative on schedule Horizon EDGE initiative launched and capturing early wins Maersk agreements renewal Horizon Services Group introduces RFID technology and forms joint venture Tonnage tax election yields significant tax savings Record financial results Board of Directors additions . |
 6 Fourth Quarter 2006 Earnings Release John Handy Executive Vice President Operations Review . |
 7 Operating Highlights Rate increases and mix upgrade more than offset volume softness Competitive landscape stable and 2007 economic outlook remains positive Horizon EDGE benefits ahead of projections TP-1 fleet enhancement initiative on schedule Container fleet enhancement continues Vessel availability above 99% Increased vessel utilization rate Excellent on-time arrival performance Service excellence awards . |
 8 Rate / Volume Update – Fourth Quarter Rate improvements in all three tradelanes continue to sustain steady revenue growth in spite of softer volumes Mix upgrade success positively impacted rates, led by volume growth in the refrigerated cargo, pharmaceutical and military segments (especially in Guam) Puerto Rico volume did not rebound in the fourth quarter, but favorable rate, operating efficiencies, and intelligent deployment decisions mitigate shortfall $228 $3,297 $3,525 Variance 2005 2006 Rate Per Container (2,301) 74,554 72,253 Variance 2005 2006 Container Volume . |
 9 2007 Economic Outlook Hawaii should see a steady rebound from a stagnant fourth quarter based on planned construction projects, tourism and military growth Guam will see increasing growth as the 10-year military expansion moves forward Alaskan economy will continue to grow, supported by high oil prices, tourism, strong construction, and expansion plans of major U.S. retailers Puerto Rico is projecting modest recovery for the year as the economy continues to adjust to tax reform and high energy costs . |
 10 Competitive Update Steady market share in all tradelanes Gains in targeted segments Puerto Rico trade capacity remained balanced with lighter volumes Alaska RFID implementation creates a new technology differentiator First arrival in Guam remains a distinct competitive advantage . |
 11 Horizon EDGE Update Horizon EDGE is fully underway and captured 2006 savings in excess of targets Gross benefits ahead of plan at $3.9M versus budget of $3.0M 2007 Savings Target 2007 net benefits projection remains at a minimum of $13M . |
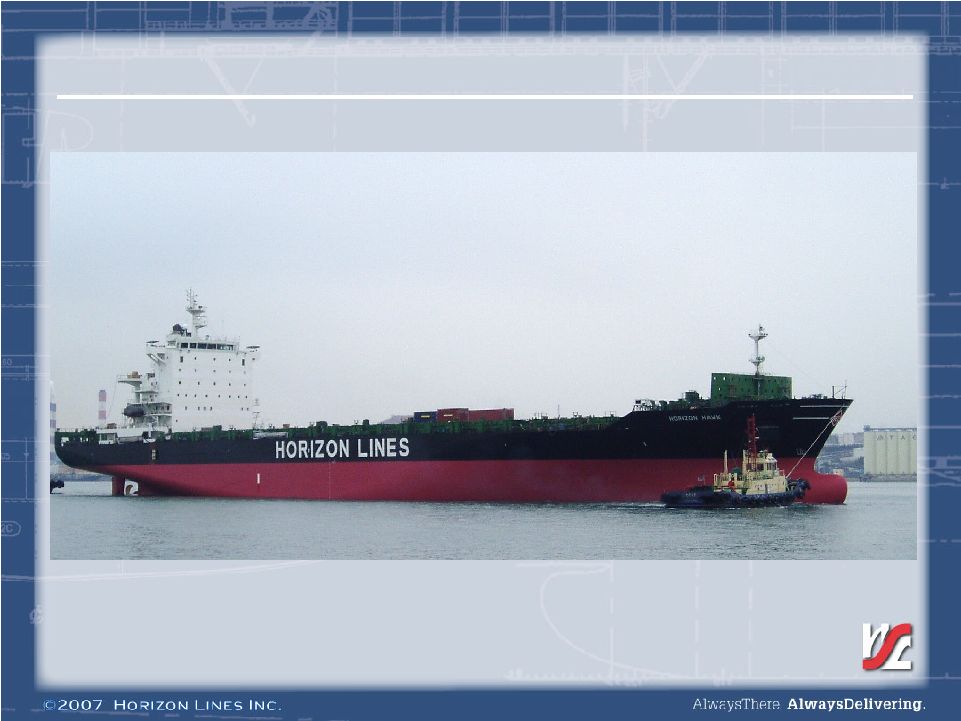 12 Horizon Lines Hawk . |
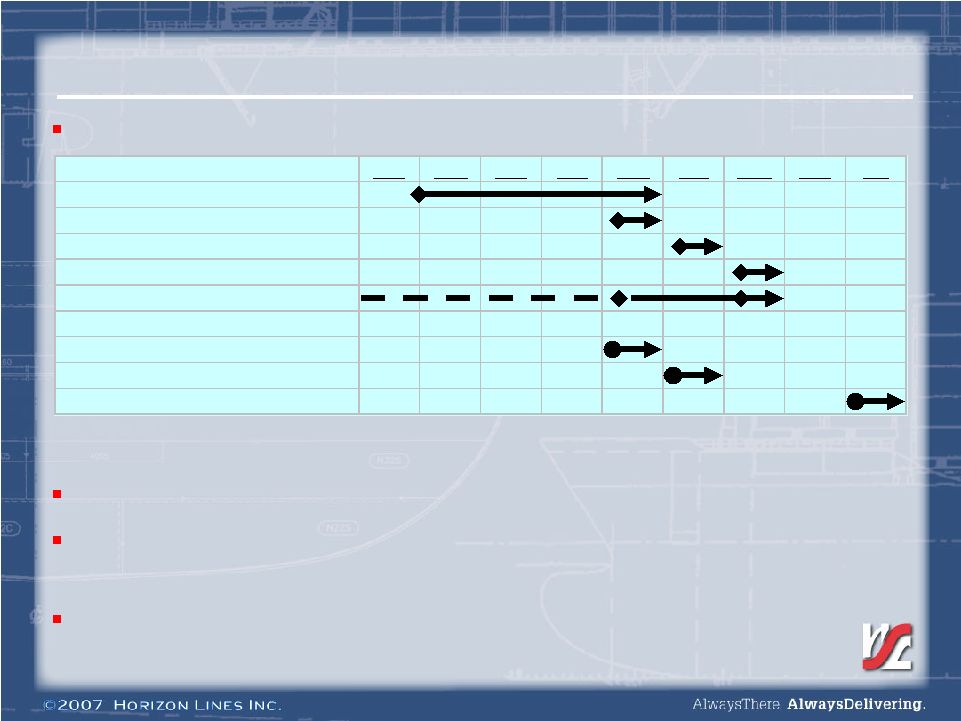 13 TP-1 Fleet Enhancement Update Vessel delivery and phase-in dates on schedule Nov Dec Jan Feb Mar Apr May Jun Jul Horizon Hunter Horizon Hawk Horizon Eagle Horizon Falcon Horizon Tiger New TP-1 Commences Ex Asia PEX Service Commences Large Jones Act Vessel to PR Performance of vessels exceed expectations Amended and extended TP-1 Agreement with Maersk commences with start of new TP-1 service Estimated 2007 net impact of new TP-1 service phase-in is $(15) million . |
 14 Container Fleet Investments 3,800 2,400 Total --- 300 2003 --- 900 2004 1,000 1,200 2005 2,800 --- 2006 Dry Containers Refrigerated Containers Year Acquired . |
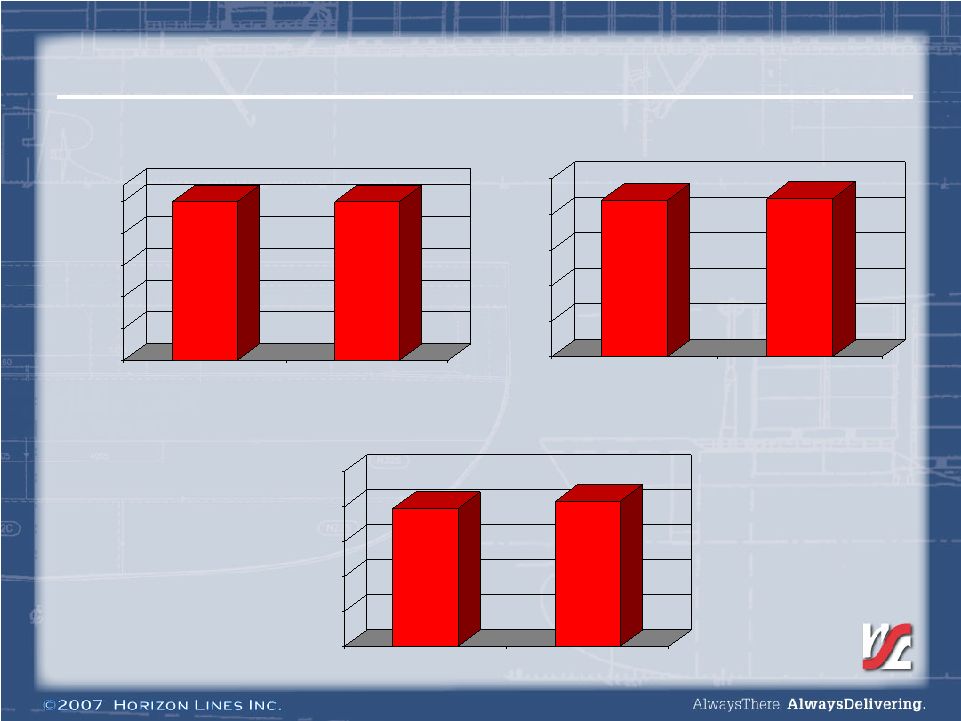 15 Vessel Performance - 2006 99.8% 99.7% 0% 20% 40% 60% 80% 100% 2005 2006 Vessel Availability 88.0% 89.0% 0.0% 20.0% 40.0% 60.0% 80.0% 100.0% 2005 2006 Vessel Utilization 79.0% 83.0% 0.0% 20.0% 40.0% 60.0% 80.0% 100.0% 2005 2006 Vessel On-Time Arrival . |
 16 Service Excellence Awards in 2006 Lowe’s 2006 “Platinum Carrier Award” for 99.9% On-Time Service Performance Lowe’s “Outstanding Ocean Service Provider” 5 th Consecutive Year Toyota “On-Time Performance” Award 7 th Consecutive Year Toyota “Customer Service Honors” award for shipments to Hawaii Wal-Mart “Carrier of the Year Award” for the Jones Act Trades Named to Global Logistics & Supply Chain Strategy’s “100 Great Supply Chain Partners” Winner of Logistics Management magazine’s coveted “Quest for Quality Award” . |
 17 Fourth Quarter 2006 Earnings Release M. Mark Urbania Senior Vice President & Chief Financial Officer Financial Review . |
 18 Financial Highlights Record earnings achieved in line with or ahead of previous guidance Operating revenue Operating income EBITDA Net income Earnings per share Record cash flow generation Capital structure continues to improve . |
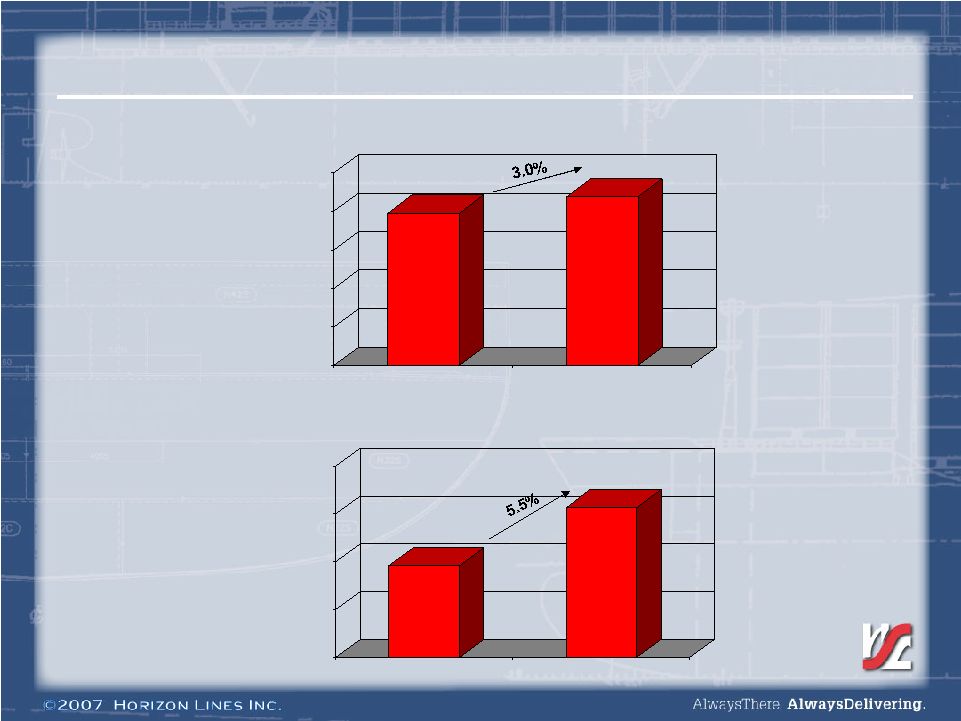 19 Operating Revenue 279.0 287.5 200 220 240 260 280 300 2005 2006 Fourth Quarter 1,096.2 1,156.9 1,000 1,050 1,100 1,150 1,200 2005 2006 Year ($ in Millions) . |
 20 Operating Revenue (35.6) (7.7) Volume Variance Revenue Growth $ 60.7 $ 8.5 Total Revenue Increase 3.3 (0.4) Other / Non-Transportation Revenue 48.6 6.6 Fuel Recovery $ 44.4 $ 10.0 Rate and Cargo Mix Improvement Year Fourth Quarter ($ in Millions) . |
 21 Adjusted Operating Income (1) 19.9 22.9 0 5 10 15 20 25 2005 2006 Fourth Quarter (1) See reconciliation of Operating Income to Adjusted Operating Income on page 31. 81.6 98.0 0 20 40 60 80 100 2005 2006 Year ($ in Millions) . |
 22 Adjusted EBITDA (1) 35.9 38.9 0.0 10.0 20.0 30.0 40.0 50.0 2005 2006 Fourth Quarter (1) See reconciliation of Net Income to Adjusted EBITDA on page 33. 149.7 163.1 0 50 100 150 200 2005 2006 Year ($ in Millions) . |
 23 Adjusted Net Income (1) 8.0 11.5 0.0 2.0 4.0 6.0 8.0 10.0 12.0 14.0 2005 2006 Fourth Quarter (1) See reconciliation of Net Income to Adjusted Net Income on page 32. 34.8 45.0 0 10 20 30 40 50 2005 2006 Year ($ in Millions) . |
 24 Adjusted EPS (1) 0.24 0.34 0.0 0.1 0.2 0.3 0.4 2005 2006 Fourth Quarter 1.04 1.34 0.0 0.5 1.0 1.5 2005 2006 Year (1) See reconciliations on pages 29 and 30. . |
 25 2006 Free Cash Flow (1.2) Financing Costs $ 52.5 Net Cash Flow (27.5) Debt Repayment (1.3) Repurchase of 11% Notes 81.3 Free Cash Flow (14.8) Dividends (36.7) Interest (0.9) Taxes (16.8) Dry-Dock Expenditures (19.1) Capital Expenditures, Net (4.2) TP-1 Related Costs (1.9) Vessel Payments in Excess of Accrual 16.4 Working Capital $ 160.5 EBITDA Free Cash Flow ($ in Millions) . |
 26 Improving Capital Structure (a) Fully accreted balances were $160 million at September 25, 2005 and $102.5 million on December 24, 2006 (b) Includes adjustment for lease expense buyouts (c) Excludes amortization of financing fees. --- 62.2 Series A preferred stock 3.7x 2.9x LTM adjusted EBITDA (b) / LTM interest expense (c) 71% 88% Debt/capitalization 3.1x 4.3x Debt/LTM adjusted EBITDA (b) Credit statistics: $719.1 $709.6 Total capitalization 208.3 22.7 Equity 510.8 624.7 Total debt 89.6 122.2 11% notes (a) 197.0 250.0 9% notes 224.2 252.5 Senior secured debt 0.3 0.5 Capital leases 4.5 4.5 Vessel mortgages 219.4 247.5 Term loan $--- $--- Revolver December 24, 2006 September 25, 2005 ($ in Millions) . |
 27 2007 Financial Guidance Financial Guidance ($ in Millions except EPS) First Quarter Year Revenue $285 - $290 $1,215 - $1,225 EBITDA $ 33 - $ 36 $ 173 - $ 180 EPS $ .10 - $ .15 $ 1.45 - $ 1.59 Free Cash Flow $ 27 - $ 34 . |
 28 Financial Appendix . |
 29 Income Statement Summary – Fourth Quarter 33,544,170 33,572,830 32,623,848 33,572,830 Shares Outstanding - Basic $ 8.0 $ 11.5 $ (12.4) $ 10.6 Net Income (Loss) Common Shareholders -- -- 1.5 -- Preferred Stock Accretion 92.9% 92.0 95.5% 92.2% Operating Ratio $ 35.9 $ 38.9 $ 15.3 $ 37.9 EBITDA $ .24 $ .34 $ (.38) $ .32 Earnings (Loss) Per Share – Basic 8.0 11.5 (10.9) 10.6 Net Income (Loss) 0.9 (0.9) (2.0) (1.0) Income Tax Expense (Benefit) 8.9 10.6 (12.9) 9.6 Pretax Income (Loss) 11.0 12.3 25.4 12.9 Other Expense 19.9 22.9 12.5 22.5 Operating Income 259.1 264.6 266.5 265.0 Operating Expense $ 279.0 $ 287.5 $ 279.0 $ 287.5 Operating Revenue Quarter Ended Dec. 25, 2005 Quarter Ended Dec. 24, 2006 Quarter Ended Dec. 25, 2005 Quarter Ended Dec. 24, 2006 Adjusted (1) Actual (1) Adjusted to exclude non-recurring IPO, other transaction and non-cash expenses, and to retroactively apply tonnage tax. ($ in Millions, Except per Share Amounts) . |
 30 Income Statement Summary – Year 33,544,170 33,551,335 22,376,797 33,551,335 Shares Outstanding - Basic $ 34.8 $ 45.0 $ (23.4) $ 72.4 Net Income (Loss) Common Shareholders --- -- 5.1 -- Preferred Stock Accretion 92.6% 91.5% 95.7% 91.7% Operating Ratio $ 149.7 $ 163.1 $ 100.4 $ 160.5 EBITDA $ 1.04 $ 1.34 $ (1.05) $ 2.16 Earnings (Loss) Per Share – Basic 34.8 45.0 (18.3) 72.4 Net Income (Loss) 4.2 4.6 .4 (25.4) Income Tax Expense (Benefit) 39.0 49.6 (17.9) 47.0 Pretax Income (Loss) 42.6 48.4 64.6 49.0 Other Expense 81.6 98.0 46.7 96.0 Operating Income 1,014.6 1,058.9 1,049.5 1,060.9 Operating Expense $ 1,096.2 $ 1,156.9 $ 1,096.2 $ 1,156.9 Operating Revenue Year Ended Dec. 25, 2005 Year Ended Dec. 24, 2006 Year Ended Dec. 25, 2005 Year Ended Dec. 24, 2006 Adjusted (1) Actual (1) Adjusted to exclude non-recurring IPO, other transaction and non-cash expenses, and to retroactively apply tonnage tax. ($ in Millions, Except per Share Amounts) . |
 31 Adjusted Operating Income Results 3.8 --- --- --- Lease Buyout Net Expense Savings 19.2 --- 7.2 --- Stock Compensation Expense Adjustments (a) Adjusted Operating Income (a) These charges are not anticipated to recur regularly in the ordinary course of business. $ 81.6 $ 98.0 $ 19.9 $ 22.9 Adjusted Operating Income 34.9 2.0 7.4 0.4 Total Adjustments 2.2 2.0 0.2 0.4 Transaction Related Expense 9.7 --- --- --- Management Fees $ 46.7 $ 96.0 $ 12.5 $ 22.5 Operating Income Year Ended Dec. 25, 2005 Year Ended Dec. 24, 2006 Quarter Ended Dec. 25, 2005 Quarter Ended Dec. 24, 2006 ($ in Millions) . |
 32 Adjusted Net Income Results --- (18.8) --- --- • Deferred Tax Revaluation 11.0 (11.0) 2.6 --- • 2005 Impact Tonnage Tax Adjustments: 3.8 --- --- --- Lease Buyout Net Expense Savings (14.8) (0.2) (5.5) (0.1) Tax Impact of Adjustments 2.2 2.0 0.2 0.4 Transaction Related Expense 9.7 --- --- --- Management Fees 13.2 0.6 13.2 0.6 Loss on Extinguishment of Debt 19.2 --- 7.2 --- Stock Compensation Expense Adjusted Net Income $ 34.8 $ 45.0 $ 8.0 $ 11.5 Adjusted Net Income 8.8 --- 1.2 --- Interest Expense Reduction Adjustments (a) $ (18.3) $ 72.4 $ (10.9) $ 10.6 Net Income (Loss) Year Ended Dec. 25, 2005 Year Ended Dec. 24, 2006 Quarter Ended Dec. 25, 2005 Quarter Ended Dec. 24, 2006 ($ in Millions) (a) These charges are not anticipated to recur regularly in the ordinary course of business. . |
 33 Net Income/EBITDA Reconciliation 5.0 --- --- --- Lease Buyout Gross Expense Savings 2.2 2.0 0.2 0.4 Transaction Related Expense 9.7 --- --- --- Management Fees 13.2 0.6 13.2 0.6 Loss on Extinguishment of Debt Note: EBITDA is defined as net income plus net interest expense, income taxes, depreciation and amortization. We believe that EBITDA is a meaningful measure for investors as (i) EBITDA is a component of the measure used by our board of directors and management team to evaluate our operating performance, (ii) the senior credit facility contains covenants that require Horizon Lines Holding to maintain certain interest expense coverage and leverage ratios, which contain EBITDA and (iii) EBITDA is a measure used by our management team to make day-to-day operating decisions. 19.2 --- 7.2 --- Stock Compensation Expense Net Income/EBITDA Reconciliation $ 149.7 $ 163.1 $ 35.9 $ 38.9 Adjusted EBITDA 100.4 160.5 15.3 37.9 EBITDA 66.9 64.9 16.0 16.0 Depreciation and Amortization 51.4 48.6 12.2 12.3 Interest Expense, Net 0.4 (25.4) (2.0) (1.0) Tax Expense (Benefit) $ (18.3) $ 72.4 $ (10.9) $ 10.6 Net Income (Loss) Year Ended Dec. 25, 2005 Year Ended Dec. 24, 2006 Quarter Ended Dec. 25, 2005 Quarter Ended Dec. 24, 2006 ($ in Millions) . |
 34 Fourth Quarter 2006 Earnings Release Questions & Answers . |
 |