 First Quarter 2007 Earnings Release April 26, 2007 Exhibit 99.3 |
 2 Forward-Looking Statements Risks, Uncertainties, Other Factors with Respect to “Forward-Looking Statements”: Certain statements contained in this presentation constitute “forward- looking statements” within the meaning of the Private Securities Litigation Reform Act of 1995. Such statements that are not of historical fact constitute “forward-looking statements” and, accordingly, involve estimates, assumptions, judgments and uncertainties. There are a number of factors that could cause actual results or outcomes to differ materially from those addressed in the “forward-looking statements”. Such factors are detailed in the Horizon Lines, Inc.’s Form 10-K filed with the Securities and Exchange Commission on March 2, 2007. |
 3 Earnings Call Agenda Introduction and Overview Chuck Raymond – Chairman, President & Chief Executive Officer Operations Review John Handy – Executive Vice President Financial Review Mark Urbania – Senior Vice President & Chief Financial Officer Questions and Answers |
 4 First Quarter 2007 Earnings Release Chuck Raymond Chairman, President & Chief Executive Officer Introduction and Overview |
 5 First Quarter 2007 – Highlights $15.9 $16.5 0 5 10 15 20 25 2006 2007 Operating Income $274.9 $273.7 200 220 240 260 280 300 2006 2007 Operating Revenue ($ in Millions) $0.11 $0.13 0.0 0.1 0.2 0.3 2006 2007 Adjusted EPS ($ in Millions) Record first quarter earnings 21 st consecutive quarter of adjusted EBITDA growth Cost controls, EDGE savings and rate improvement more than offset volume softness TP1 fleet enhancement initiative on track and nearing completion Horizon EDGE meets all milestones and delivers increasing benefits Service excellence awards continue ($) |
 6 First Quarter 2007 Earnings Release John Handy Executive Vice President Operations Review |
 7 Operating Highlights Continued soft market conditions in Puerto Rico and an extended winter in Alaska adversely impacted revenue volumes Higher margin cargo mix, general rate increases and fuel surcharge recoveries mitigated volume shortfalls Economic outlook improving and remains positive Competitive landscape stable and overall market share maintained Horizon EDGE captured first quarter benefits in line with targets and achieved all milestones TP1 fleet enhancement initiative on schedule and deployment of new vessels nearing completion Vessel operating metrics in line with 2006 Service excellence awards continue |
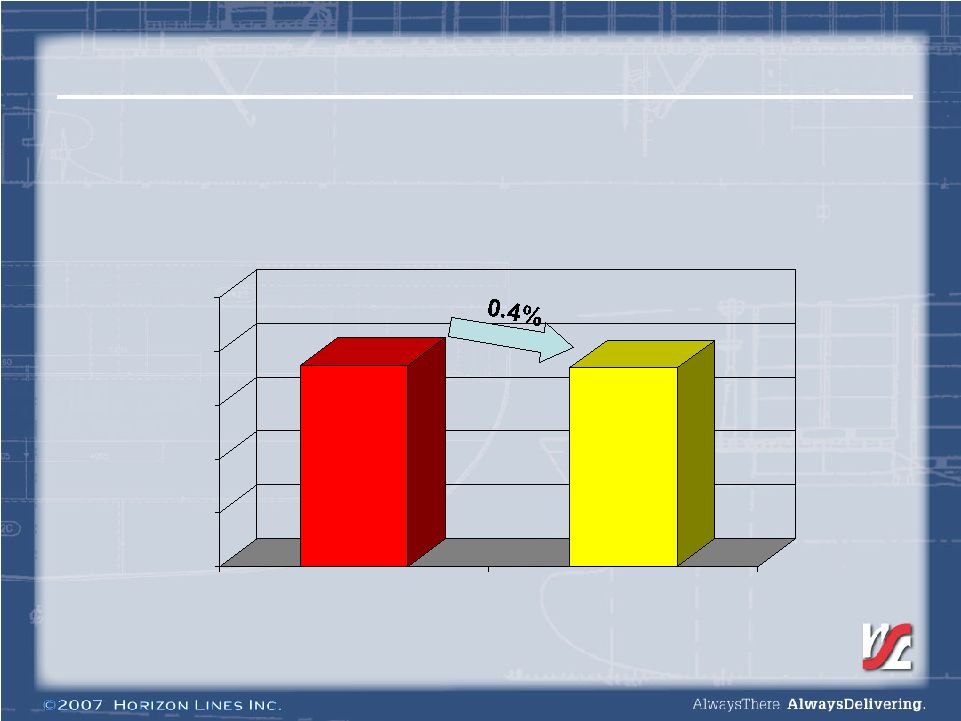
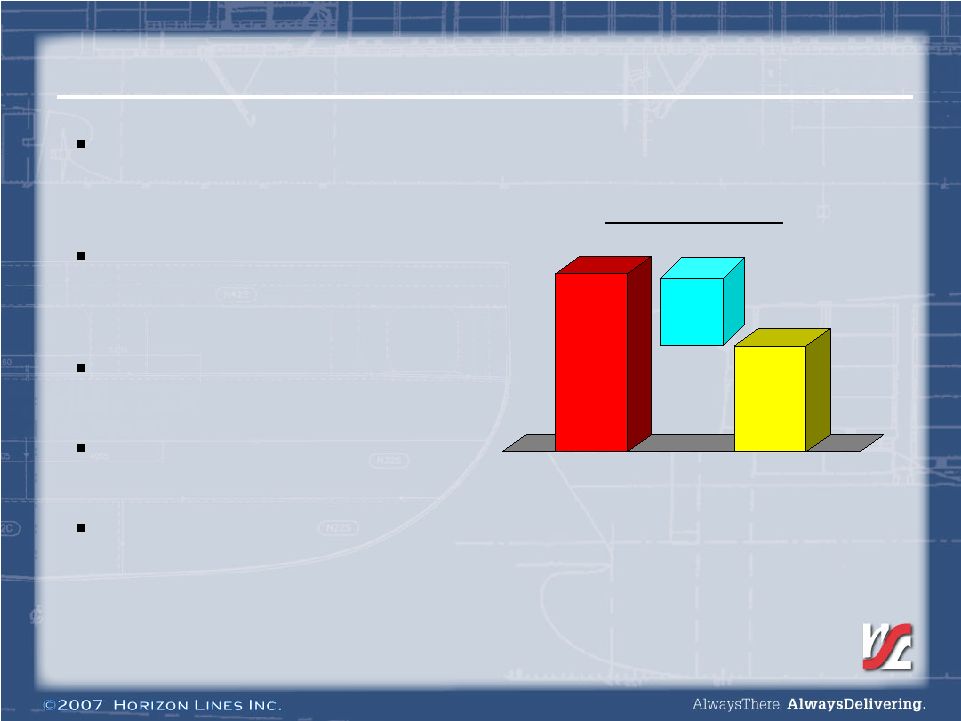 8 Volume Update Unusually cold winter in Alaska delayed spring shipments Alaska seafood late starting, but recovering with shipments extending into second quarter Hawaii volumes impacted by adverse weather conditions Guam continues to be a bright spot with solid growth Puerto Rico economy recovering slower than anticipated 71,601 66,921 2006 2007 Container Volume Variance (4,680) |
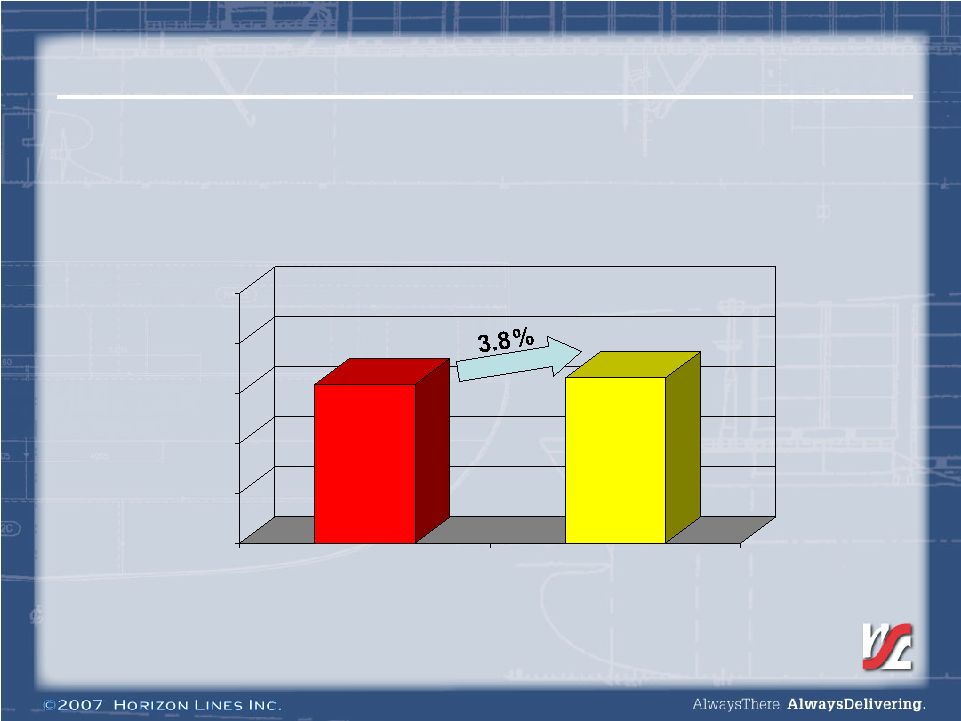
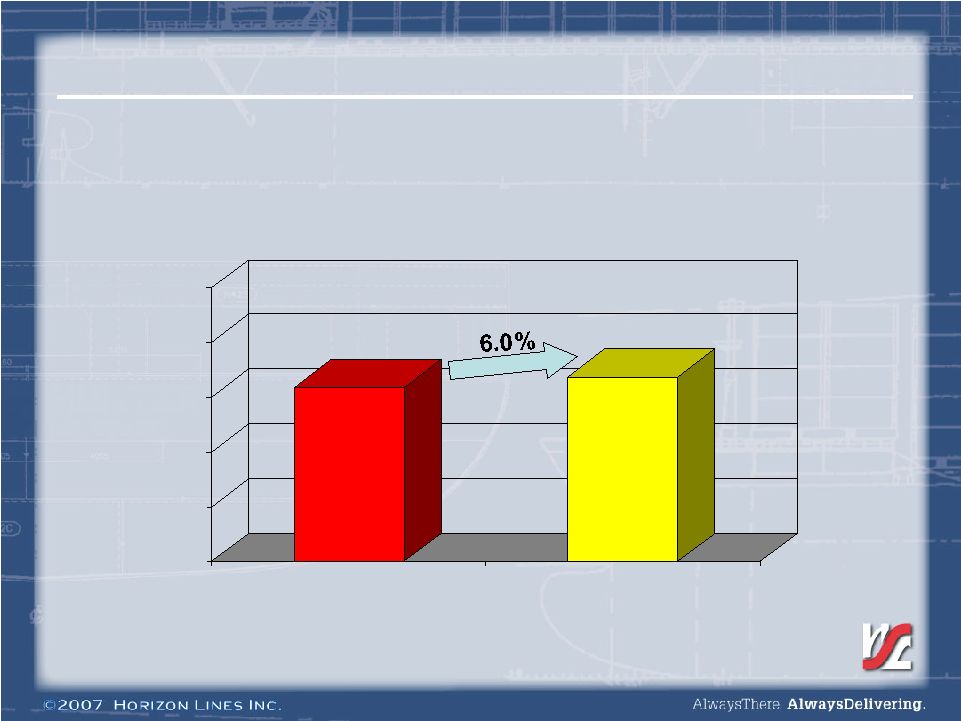
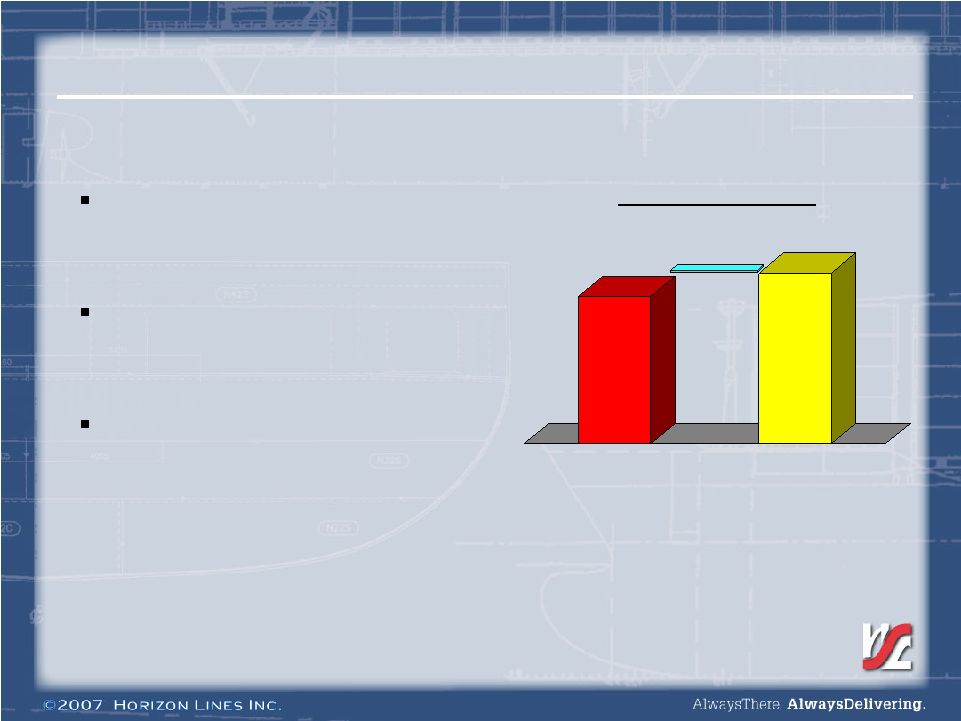 9 Unit Revenue Update $3,375 $3,587 2006 2007 Rate Per Container Variance $212 Unit rate improvements in all three tradelanes continue to offset volume softness Cargo mix focus continues to provide positive impact on overall rate improvements Fluctuations in fuel related expenses were appropriately mitigated by fleet conservation efforts and surcharges |
 10 2007 Economic Outlook Alaska thawing out and market stabilizing and returning to normal Deployment of new vessels and schedules to improve on time performances Hawaii market continues to grow and we are positioned to capitalize 2007 GNP growth of 1.2% projected by the Government Development Bank of Puerto Rico has not been seen yet |
 11 Competitive Update Overall market share in all trades remained stable Puerto Rico carriers withheld extra seasonal tonnage due to slow economic growth Regaining our arrival advantage into Guam with deployment of new, faster vessels |
 12 Horizon EDGE Update All Q1 2007 milestones completed per plan Offshore Ports – EDGE process implementation completed Supply Chain – Vessel fuel consumption initiative implemented – Data integrity improvement process ongoing – Benchmarking performed with CGM-CMA and NYK – Cost per move over North America trucking network reduced – Automated dispatch planning implemented Sales – Sales performance metrics implemented – System upgrades and pricing tool enhancements in progress Domestic Ports – EDGE process implementation accelerated 2007 Net Benefits Q1 2007 gross benefits of $3.0M and net benefits of $1.4M achieved 2007 net benefits target remains $13M or better |
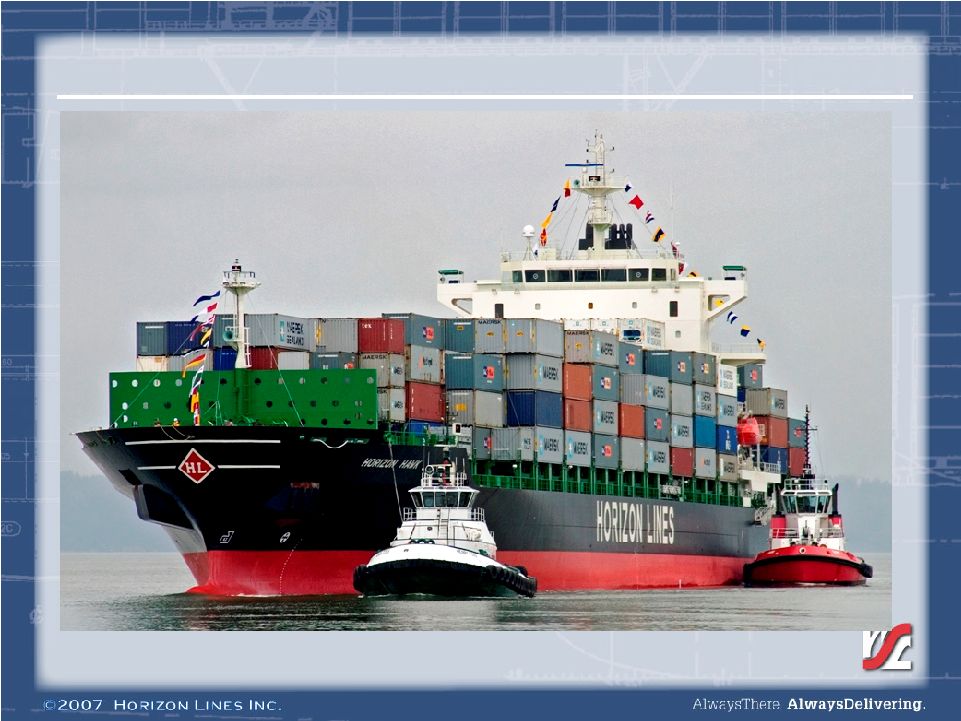 13 Horizon Lines Hawk |
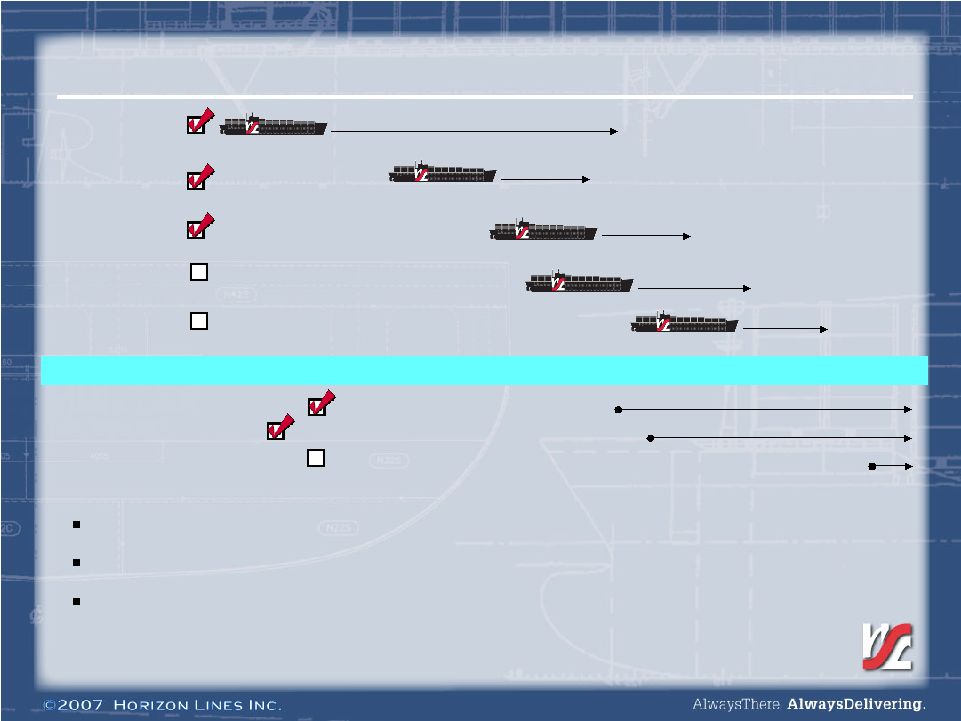 14 TP1 Fleet Enhancement Update Execution of the new TP1 Service phase-in is on schedule Performance of vessels continues to meet expectations New TP1 Service commenced as planned on March 18 Jul May Dec Jan Feb Mar Nov Apr Jun New TP1 Commences Ex Asia PEX Service Commences Large Jones Act Vessel to PR Horizon Falcon Horizon Hunter Horizon Hawk Horizon Eagle Horizon Tiger |
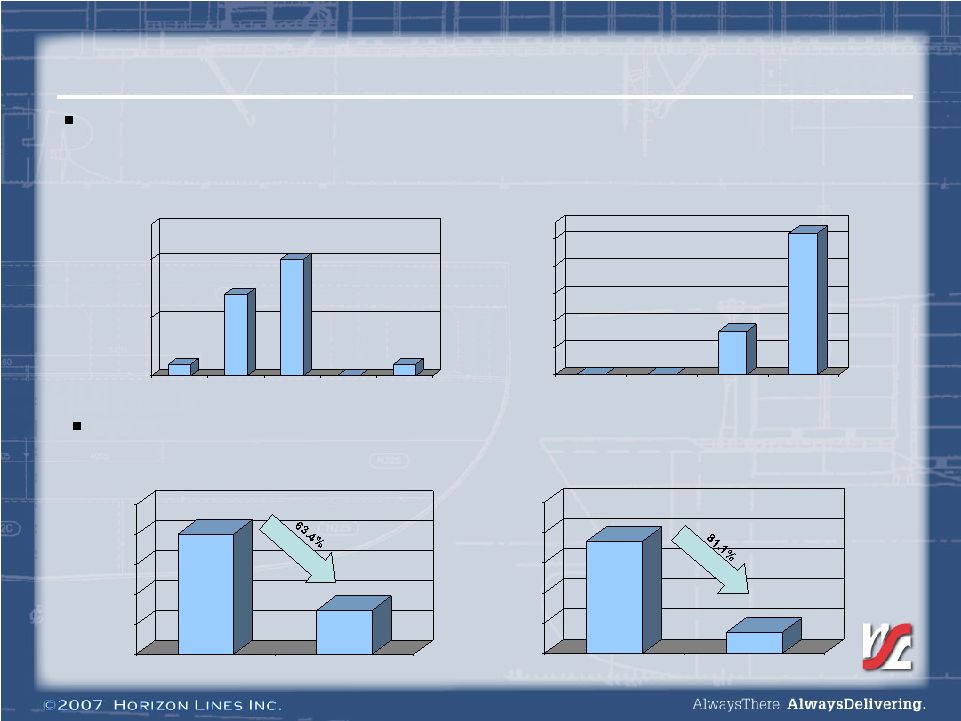 15 Container Fleet Investments 300 900 1200 0 300 200 700 1200 2003 2004 2005 2006 1Q '07 New Refrigerated Containers 0 0 1000 2800 200 700 1200 1700 2200 2700 2003 2004 2005 2006 New Dry Containers $202 $74 0 50 100 150 200 250 1Q '06 1Q '07 Refrigerated Containers Investment in our business continues with 300 new refrigerated containers (“reefers”) added in the first quarter of 2007 Maintenance cost per load has improved significantly $37 $7 0 10 20 30 40 50 1Q '06 1Q '07 Dry Containers |
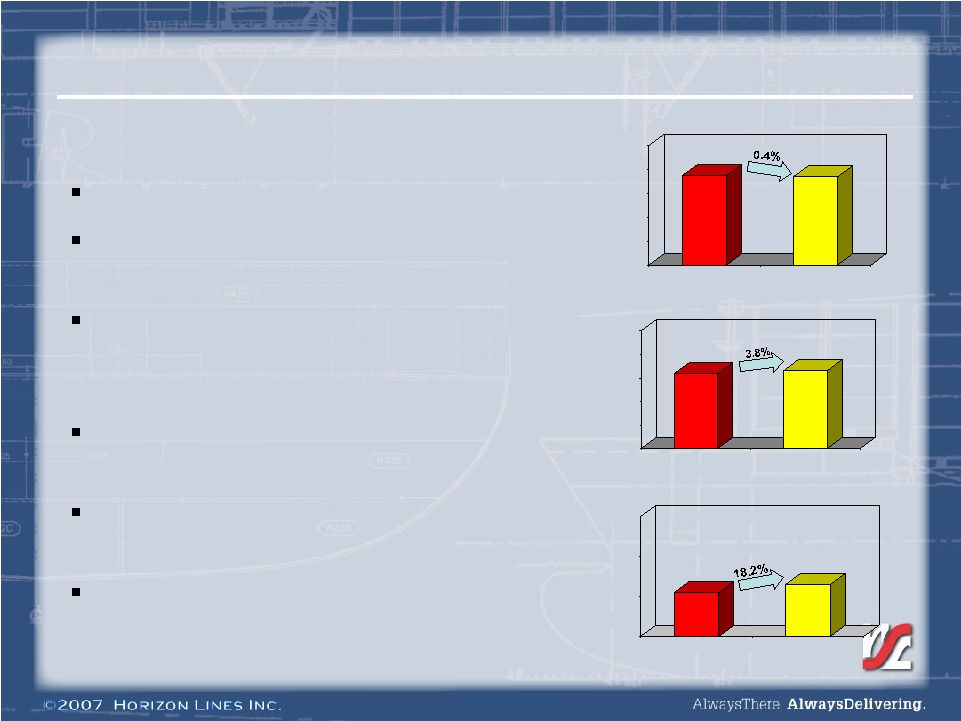
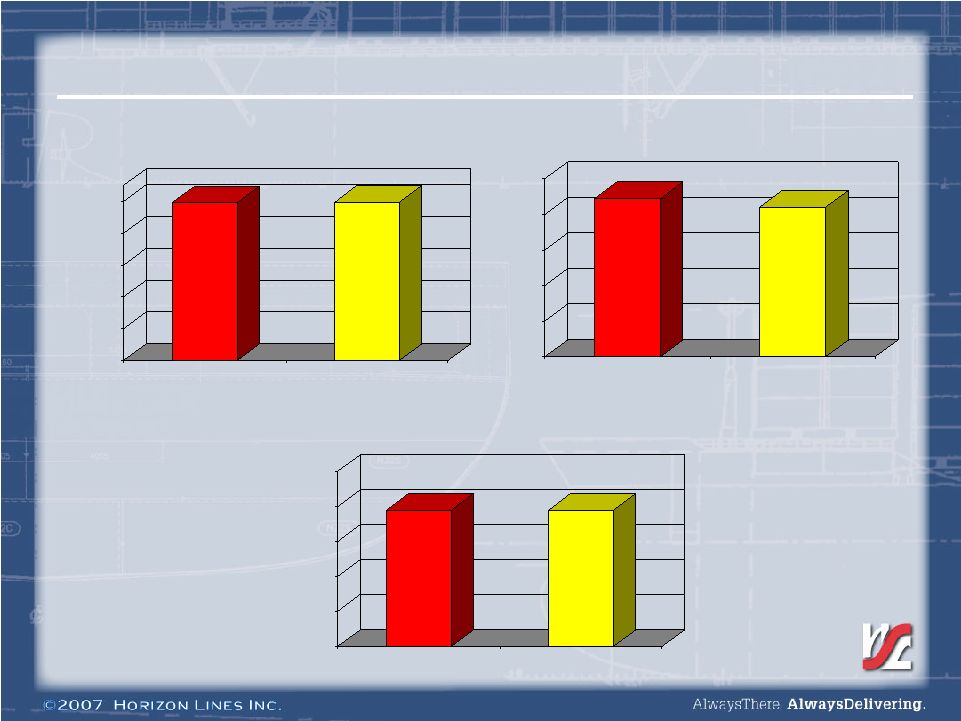 16 Vessel Performance 99.3% 99.6% 0% 20% 40% 60% 80% 100% 2006 2007 Vessel Availability 89.0% 84.0% 0% 20% 40% 60% 80% 100% 2006 2007 Vessel Utilization 78.0% 78.0% 0% 20% 40% 60% 80% 100% 2006 2007 Vessel On-Time Arrival |
 17 Service Excellence Awards Lowe’s 2006 “Platinum Carrier Award” for Outstanding Service for the sixth straight year Toyota 2006 “Logistics Excellence Award” for Quality in Export Marine for the eighth consecutive year |
 18 First Quarter 2007 Earnings Release M. Mark Urbania Senior Vice President & Chief Financial Officer Financial Review |
 19 Financial Highlights Adjusted EBITDA growth for the 21 st consecutive quarter Record first quarter earnings achieved above midpoint of guidance Stringent cost controls, Horizon EDGE benefits, cargo mix upgrade, rate increases and fuel recoveries combine to more than offset volume softness De-leveraging continues Capital structure continues to improve |
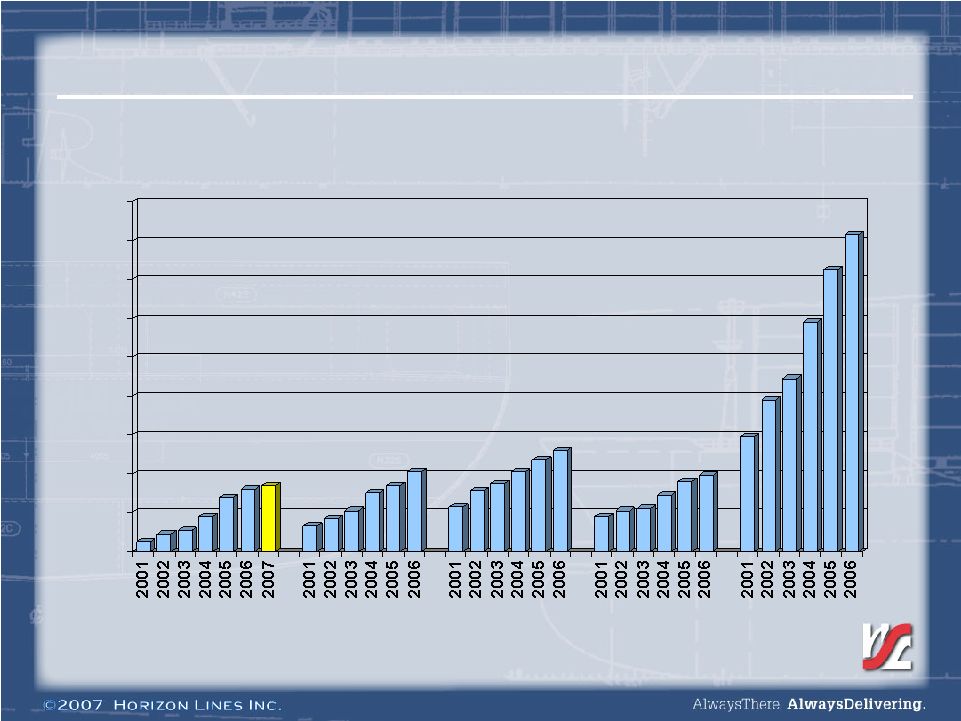 20 5 9 11 18 28 32 34 13 17 21 30 34 41 23 31 35 41 47 52 18 2122 29 36 39 59 78 89 118 145 163 0 20 40 60 80 100 120 140 160 180 Adjusted EBITDA Growth Continuous Earnings Improvement (1) (1) Adjusted EBITDA equal to EBITDA plus non-recurring items, management fees, and restricted stock compensation charges ($ in Millions) Q1 Q2 Q3 Q4 |
 21 Operating Revenue $274.9 $273.7 200 220 240 260 280 300 2006 2007 First Quarter ($ in Millions) |
 22 Operating Revenue (15.8) Volume Variance Revenue Change ($ in Millions) $ (1.2) Total Revenue Decrease 0.4 Other / Non-Transportation Revenue 1.0 Fuel Recovery $ 13.2 Rate and Cargo Mix Improvement First Quarter 2007 Cargo mix improvement and rate increases offset volume softness, after accounting for one delayed sailing that fell into the second quarter |
 23 Operating Income $15.9 $16.5 0 5 10 15 20 25 2006 2007 First Quarter ($ in Millions) |
 24 EBITDA (1) $31.8 $33.7 0 10 20 30 40 50 2006 2007 First Quarter ($ in Millions) (1) See reconciliation of Net Income to EBITDA on page 33. |
 25 Adjusted Net Income (1) $3.6 $4.5 0 2 4 6 8 2006 2007 First Quarter ($ in Millions) (1) See reconciliation of Net Income to Adjusted Net Income on page 32. |
 26 Adjusted EPS (1) $0.11 $0.13 0.0 0.1 0.2 0.3 2006 2007 First Quarter ($) (1) See reconciliations on pages 31 and 32. |
 27 Free Cash Flow (3.7) (3.7) Dividends Quarter Ended March 26, 2006 Quarter Ended March 25, 2007 $ (49.8) (5.1) (41.0) -- (3.5) (0.4) (2.4) (2.9) (3.3) (36.0) (26.2) $ 33.7 (1.0) Transaction Costs $ (8.8) Net Cash Flow (0.6) Debt Payment (4.5) Free Cash Flow (4.1) Interest (0.1) Income Taxes (4.2) Dry-Dock Expenditures (2.0) Capital Expenditures, Net -- TP1 Related Costs (11.0) Vessel Payments in Excess of Accrual (13.9) Working Capital $ 31.8 EBITDA Free Cash Flow ($ in Millions) |
 28 Improving Capital Structure (a) Fully accreted balances were $160 million at September 25, 2005 and $102.5 million on March 25, 2007 (b) Includes proforma adjustment for lease expense buyouts in September 25, 2005 EBITDA (c) Excludes amortization of financing fees -- 62.2 Series A preferred stock 3.7x 2.9x LTM adjusted EBITDA (b) / LTM interest expense (c) 71% 88% Debt/capitalization 3.1x 4.3x Debt/LTM adjusted EBITDA (b) Credit statistics: $716.9 $709.6 Total capitalization 208.8 22.7 Equity 508.1 624.7 Total debt 92.0 122.2 11% notes (a) 197.0 250.0 9% notes 219.1 252.5 Senior secured debt 0.3 0.5 Capital leases -- 4.5 Vessel mortgages 218.8 247.5 Term loan $-- $-- Revolver March 25, 2007 September 25, 2005 ($ in Millions) |
 29 2007 Financial Guidance Financial Guidance ($ in Millions except EPS) Second Quarter Year Revenue $ 295 - $ 300 $1,200 - $1,210 EBITDA $ 40 - $ 43 $ 173 - $ 180 Diluted EPS $ .29 - $ .34 $ 1.62 - $ 1.73 Free Cash Flow $ 42 - $ 49 |
 30 Financial Appendix |
 31 Income Statement Summary 33,596,230 34,135,084 33,596,230 34,135,084 Shares Outstanding – Diluted $ .11 $ .13 $ .07 $ .21 Earnings Per Share - Diluted 33,544,170 33,612,667 33,544,170 33,612,667 Shares Outstanding – Basic 94.2% 94.0% 94.2% 94.0% Operating Ratio $ 31.8 $ 33.7 $ 31.8 $ 33.7 EBITDA $ .11 $ .13 $ .07 $ .21 Earnings Per Share – Basic $ 3.6 $ 4.5 $ 2.4 $ 7.1 Net Income 0.5 0.8 1.7 (1.8) Income Tax (Benefit) Expense 4.1 5.3 4.1 5.3 Pretax Income 11.8 11.2 11.8 11.2 Other Expense 15.9 16.5 15.9 16.5 Operating Income 259.0 257.2 259.0 257.2 Operating Expense $ 274.9 $ 273.7 $ 274.9 $ 273.7 Operating Revenue Quarter Ended Mar. 26, 2006 Quarter Ended Mar. 25, 2007 Quarter Ended Mar. 26, 2006 Quarter Ended Mar. 25, 2007 Adjusted (1) Actual (1) Adjusted to exclude non-recurring IPO, other transaction and non-cash expenses, and to retroactively apply tonnage tax. ($ in Millions, Except per Share Amounts) |
 32 Adjusted Net Income Results 1.2 -- • 2006 Proforma Impact -- (2.6) • 2007 Deferred Tax Revaluation Benefit Tonnage Tax Adjustments: Adjusted Net Income ($ in Millions) $ 3.6 $ 4.5 Adjusted Net Income Adjustments (a) $ 2.4 $ 7.1 Net Income Quarter Ended Mar 26, 2006 Quarter Ended Mar. 25, 2007 (a) These charges are not anticipated to recur regularly in the ordinary course of business. |
 33 Net Income/EBITDA Reconciliation 11.7 11.2 Interest Expense, Net Note: EBITDA is defined as net income plus net interest expense, income taxes, depreciation and amortization. We believe that EBITDA is a meaningful measure for investors as (i) EBITDA is a component of the measure used by our board of directors and management team to evaluate our operating performance, (ii) the senior credit facility contains covenants that require Horizon Lines Holding to maintain certain interest expense coverage and leverage ratios, which contain EBITDA and (iii) EBITDA is a measure used by our management team to make day-to-day operating decisions. Net Income/EBITDA Reconciliation ($ in Millions) $ 31.8 $ 33.7 EBITDA 16.0 17.2 Depreciation and Amortization 1.7 (1.8) Tax (Benefit) Expense $ 2.4 $ 7.1 Net Income Quarter Ended Mar. 26, 2006 Quarter Ended Mar. 25, 2007 |
 34 First Quarter 2007 Earnings Release Questions & Answers |
 |