Table of Contents
UNITED STATES
SECURITIES AND EXCHANGE COMMISSION
Washington, D.C. 20549
Form 10-K
(Mark one)
| x | Annual Report Pursuant to Section 13 or 15(d) of the Securities Exchange Act of 1934 |
For the fiscal year ended December 25, 2011
OR
| ¨ | Transition report pursuant to Section 13 or 15(d) of the Securities Exchange Act of 1934 |
For the transition period from to
Commission File Number 001-32627
HORIZON LINES, INC.
(Exact name of registrant as specified in its charter)
| Delaware | 74-3123672 | |
(State or other jurisdiction of incorporation or organization) | (I.R.S. Employer Identification No.) |
4064 Colony Road, Suite 200,
Charlotte, North Carolina 28211
(Address of principal executive offices)
(704) 973-7000
(Registrant’s telephone number, including area code)
NOT APPLICABLE
(Former name, former address and former fiscal year, if changed since last report)
Securities registered pursuant to Section 12 (b) of the Act:
Title of each class | Name of each exchange on which registered | |
| Common stock, par value $0.01 per share | OTCQB |
Securities registered pursuant to Section 12 (g) of the Act:
None
Indicate by check mark if the registrant is a well-known seasoned issuer, as defined in Rule 405 of the Securities Act. Yes ¨ No x
Indicate by check mark if the registrant is not required to file reports pursuant to Section 13 or Section 15 (d) of the Act. Yes ¨ No x
Indicate by check mark whether the registrant (1) has filed all reports required to be filed by Section 13 or 15(d) of the Securities Exchange Act of 1934 during the preceding 12 months (or for such a period that the registrant was required to file such reports), and (2) has been subject to such filing requirements for the past 90 days. Yes x No ¨
Indicate by check mark whether the registrant has submitted electronically and posted on its corporate website, if any, every Interactive Data File required to be submitted and posted pursuant to Rule 405 of Regulation S-T (§ 232.405 of this chapter) during the preceding 12 months (or for shorter period that the registrant was required to submit and post such files). Yes x No ¨
Indicate by check mark if disclosure of delinquent filers pursuant to Item 405 of Regulation S-K (229.405) of this chapter) is not contained herein, and will not be contained, to the best of the registrant’s knowledge, in definitive proxy or information statements incorporated by reference in Part III of this Form 10-K or any amendment to this Form 10-K ¨
Indicate by check mark whether the registrant is a large accelerated filer, an accelerated filer, a non-accelerated filer, or a smaller reporting company. See the definitions of “large accelerated filer,” “accelerated filer” and “smaller reporting company” in Rule 12b-2 of the Exchange Act. (Check one):
| Large accelerated filer | ¨ | Accelerated filer | ¨ | |||||
| Non-accelerated filer | x | (Do not check if a smaller reporting company) | Smaller reporting company | ¨ | ||||
Indicate by check mark whether the Registrant is a shell company (as defined in Rule 12b-2 of the Exchange Act). Yes ¨ No x
The aggregate market value of common stock held by non-affiliates, computed by reference to the closing price of the common stock as of the last business day of the registrant’s most recently completed second fiscal quarter, was approximately $23.7 million.
As of March 19, 2012, 3,296,190 shares of common stock, par value $.01 per share, were outstanding.
DOCUMENTS INCORPORATED BY REFERENCE
The information required in Part III of this Form 10-K is incorporated by reference to the registrant’s definitive proxy statement to be filed for the Annual Meeting of Stockholders to be held June 7, 2012.
Table of Contents
Horizon Lines, Inc.
Safe Harbor Statement
This Form 10-K (including the exhibits hereto) contains “forward-looking statements” within the meaning of the federal securities laws. These forward-looking statements are intended to qualify for the safe harbor from liability established by the Private Securities Litigation Reform Act of 1995. Forward-looking statements are those that do not relate solely to historical fact. They include, but are not limited to, any statement that may predict, forecast, indicate or imply future results, performance, achievements or events. Words such as, but not limited to, “believe,” “expect,” “anticipate,” “estimate,” “intend,” “plan,” “targets,” “projects,” “likely,” “will,” “would,” “could” and similar expressions or phrases identify forward-looking statements.
All forward-looking statements involve risks and uncertainties. The occurrence of the events described, and the achievement of the expected results, depend on many events, some or all of which are not predictable or within our control. Actual results may differ materially from expected results.
Factors that may cause actual results to differ from expected results include:
| • | our ability to maintain adequate liquidity to operate our business, |
| • | our ability to make interest payments on our outstanding indebtedness, |
i
Table of Contents
| • | failure to comply with the terms of our probation imposed by the court in connection with our pleas relating to antitrust and environmental matters, |
| • | volatility in fuel prices, |
| • | decreases in shipping volumes, |
| • | government investigations related to (i) the imposition of fuel surcharges in connection with government contracts, (ii) regulations covering products transported on our vessels, including the FDA and USDA, or (iii) any other government investigations and legal proceedings, |
| • | suspension or debarment by the federal government, |
| • | compliance with safety and environmental protection and other governmental requirements, |
| • | increased inspection procedures and tighter import and export controls, |
| • | repeal or substantial amendment of the coastwise laws of the United States, also known as the Jones Act, |
| • | catastrophic losses and other liabilities, |
| • | our ability to integrate new and retain management, |
| • | the successful start-up of any Jones-Act competitor, |
| • | failure to comply with the various ownership, citizenship, crewing, and build requirements dictated by the Jones Act, |
| • | the arrest of our vessels by maritime claimants, |
| • | severe weather and natural disasters, and |
| • | the aging of our vessels and unexpected substantial dry-docking or repair costs for our vessels. |
In light of these risks and uncertainties, expected results or other anticipated events or circumstances discussed in this Form 10-K (including the exhibits hereto) might not occur. We undertake no obligation, and specifically decline any obligation, to publicly update or revise any forward-looking statements, even if experience or future developments make it clear that projected results expressed or implied in such statements will not be realized, except as may be required by law.
See the section entitled “Risk Factors” in this Form 10-K for a more complete discussion of these risks and uncertainties and for other risks and uncertainties. Those factors and the other risk factors described in this Form 10-K are not necessarily all of the important factors that could cause actual results or developments to differ materially from those expressed in any of our forward-looking statements. Other unknown or unpredictable factors also could harm our results. Consequently, there can be no assurance that actual results or developments anticipated by us will be realized or, even if substantially realized, that they will have the expected consequences to, or effects on, us. Given these uncertainties, prospective investors are cautioned not to place undue reliance on such forward-looking statements.
ii
Table of Contents
Part I.
| Item 1. | Business |
Background
Horizon Lines, Inc., a Delaware corporation, (the “Company” and together with its subsidiaries, “we”) operates as a holding company for Horizon Lines, LLC (“Horizon Lines”), a Delaware limited liability company and wholly-owned subsidiary, Horizon Logistics, LLC (“Horizon Logistics”), a Delaware limited liability company and wholly-owned subsidiary, Horizon Lines of Puerto Rico, Inc. (“HLPR”), a Delaware corporation and wholly-owned subsidiary, and Hawaii Stevedores, Inc. (“HSI”), a Hawaii corporation.
Our long operating history dates back to 1956, when Sea-Land Service, Inc. (“Sea-Land”) pioneered the marine container shipping industry and established our business. In 1958, we introduced container shipping to the Puerto Rico market, and in 1964 we pioneered container shipping in Alaska with the first year-round scheduled vessel service. In 1987, we began providing container shipping services between the U.S. west coast and Hawaii and Guam through our acquisition from an existing carrier of all of its vessels and certain other assets that were already serving that market. In December 1999, CSX Corporation, the former parent of Sea-Land Domestic Shipping, LLC (“SLDS”), sold the international marine container operations of Sea-Land to the A.P. Møller Maersk Group (“Maersk”) and SLDS continued to be owned and operated by CSX Corporation as CSX Lines, LLC. On February 27, 2003, Horizon Lines Holding Corp. (“HLHC”) (which at the time was indirectly majority-owned by Carlyle-Horizon Partners, L.P.) acquired from CSX Corporation, 84.5% of CSX Lines, LLC, and 100% of CSX Lines of Puerto Rico, Inc., which together with Horizon Logistics and Hawaii Stevedores, Inc. (“HSI”) constitute our business today. CSX Lines, LLC is now known as Horizon Lines, LLC and CSX Lines of Puerto Rico, Inc. is now known as Horizon Lines of Puerto Rico, Inc. The Company was formed as an acquisition vehicle to acquire, on July 7, 2004, the equity interest in HLHC. The Company was formed at the direction of Castle Harlan Partners IV. L.P. (“CHP IV”), a private equity investment fund managed by Castle Harlan, Inc. (“Castle Harlan”). In 2005, the Company completed its initial public offering. Subsequent to the initial public offering, the Company completed three secondary offerings, including a secondary offering (pursuant to a shelf registration) whereby CHP IV and other affiliated private equity investment funds managed by Castle Harlan divested their ownership in the Company. Today, as the only Jones Act vessel operator with one integrated organization serving Alaska, Hawaii and Puerto Rico, we are uniquely positioned to serve customers requiring shipping and logistics services in more than one of these markets.
Recent Developments
Refinancing
On October 5, 2011, we completed a comprehensive refinancing. The refinancing included: (a) the exchange of $327.8 million in aggregate principal amount of our 4.25% Convertible Senior Notes due 2012 (the “4.25% Notes”) for 1.0 million shares of our common stock, warrants to purchase 1.0 million shares of our common stock, at a conversion price of $0.01 per common share, $178.8 million in aggregate principal amount of 6.00% Series A Convertible Senior Secured Notes due 2017 (the “Series A Notes”) and $99.3 million in aggregate principal amount of 6.00% Series B Mandatorily Convertible Senior Secured Notes (the “Series B Notes”), (b) the issuance of $225.0 million aggregate principal amount of First-Lien Notes, (c) the issuance of $100.0 million of Second-Lien Notes, and (d) the repayment of $193.8 million in existing borrowings under our prior Senior Credit Facility. We also entered into a new $100.0 million asset-based revolving credit facility (the “New ABL Facility”).
Mandatory Conversion of Series B Notes
Under the terms of our comprehensive refinancing completed on October 5, 2011, on January 4, 2012, approximately $49.7 million of the Series B Notes were mandatorily converted into shares of common stock or warrants. The Series B Notes were converted at a conversion rate of 54.7196 shares of common stock (reflecting the 1-for-25 reverse stock split of our common stock effective December 7, 2011) per $1,000 principal amount of Series B Notes. Approximately $18.5 million of the Series B Notes were converted into 1.0 million shares of
1
Table of Contents
common stock with the remainder being converted into warrants exercisable into 1.7 million shares of common stock. The distribution of common stock and warrants was based upon the U.S. citizenship verifications of the holders of the Series B Notes.
Conversion of Remaining Series A and Series B Notes
On March 27, 2012, we announced that we had signed restructuring support agreements with more than 96% of our noteholders to further deleverage our balance sheet in connection with and contingent upon a restructuring of the vessel charter obligations related to our discontinued trans-Pacific service. The restructuring support agreements provide, among other things, that substantially all of the remaining $228.4 million of our Series A and Series B Notes will be converted into 90% of our stock, or warrants for non-U.S. citizens (subject to limited equity retention to existing equity holders on terms to be agreed, and to dilution for a management incentive plan), as described below. The remaining 10% of our common stock would be available in connection with the restructuring of our obligations related to the vessels formerly used in the FSX service pursuant to the Global Termination Agreement, as described above. To that end, the conversion of the Series A and Series B Notes was contingent upon a number of conditions, including the restructuring of our charter obligations with respect to the vessels formerly used in the FSX service.
On April 9, 2012, pursuant to the restructuring support agreements and following the completion of the consent solicitations described below, 99% of the holders of our Series A Notes and 98.5% of the holders of our Series B Notes submitted irrevocable conversion notices to us. Upon completion of the conversion process, we expect, on an as-converted basis, holders of Series A Notes to hold approximately 81% of our outstanding shares and holders of Series B Notes to hold approximately 3% of our outstanding shares. In addition, on an as-converted basis, we expect SFL will hold approximately 10% of our outstanding shares (pursuant to the Global Termination Agreement described below). As a result, we issued common shares and warrants equivalent to 86,490,929 shares on an as-converted basis. The warrants contain a conversion price of $0.01 per common share. The remaining 6% of our outstanding shares will be held by existing share and warrant holders. The remaining 7.5 million shares, or approximately 8% of our authorized share capital, will be reserved for future management incentive plans.
The conversion of the Series A Notes and the Series B Notes could have a material impact on our 2012 financial statements. Until such time we are able to obtain a definitive allocation between shares of our common stock and warrants to purchase shares of our common stock, we are unable to determine the potential impact on earnings per share.
Consent Solicitations
As part of the overall agreement under the restructuring support agreements described above, on March 29, 2012, we launched consent solicitations to make certain amendments to the indentures which govern the First Lien Notes, Second Lien Notes, and the Series A Notes and Series B Notes. These amendments provided (i) for the issuance of $40.0 million in aggregate principal amount of Second Lien Notes to SFL pursuant to the Global Termination Agreement, subordinated to the existing Second Lien Notes under certain circumstances, as described above, (ii) for us to pay-in-kind (PIK) the interest payments on the Second Lien Notes, the Series A Notes and the Series B Notes, (iii) that SFL may purchase all other outstanding Second Lien Notes from the holders (at a purchase price equal to the principal amount of the Second Lien Notes, plus accrued and unpaid interest) under circumstances where, among other things, we commence liquidation, administration, or receivership or other similar proceedings and (iv) for Series B Note holders to convert their notes at their option.
On April 9, 2012, we obtained the requisite consents under each of the consent solicitations and entered into supplemental indentures with the U.S. Bank National Association, the trustee for the Notes, to amend the indentures pursuant to the consent solicitations. We concurrently obtained an amendment and acknowledgment
2
Table of Contents
from the lenders under our ABL credit agreement, among other things, to clarify that the amendments to the indentures which govern the First Lien Notes, Second Lien Notes, and the Series A Notes and Series B Notes and the issuance of the additional $40.0 million of Second Lien Notes are permitted under the ABL credit agreement.
Five Star Express Service
During the third quarter of 2011, we began a review of strategic alternatives for our Five Star Express (“FSX”) service. As a result of several factors, including the projected continuation of volatile trans-Pacific freight rates, high fuel prices, and operating losses, we decided to discontinue our FSX service. On October 21, 2011, we finalized a decision to terminate the FSX service, and we ceased all operations related to our FSX service during the fourth quarter of 2011. The entire component comprising the FSX service has been discontinued and there will not be any significant future cash flows related to these operations. Accordingly, we have classified the FSX service as discontinued operations beginning in our fiscal fourth quarter and revised all prior periods to conform to this presentation.
As a result of the shutdown of our FSX service, we recorded a pretax restructuring charge of $119.3 million during the fourth quarter of 2011. This charge includes costs to return excess rolling stock equipment, severance, and facility and vessel lease expense, net of estimated sublease income.
On April 5, 2012, we entered into a Global Termination Agreement with Ship Finance International Limited and certain of its subsidiaries (“SFL”) which enabled us to early terminate the bareboat charters of the five foreign-built, U.S.-flag vessels that formerly operated in the FSX service. The Global Termination Agreement could have a material impact on our 2012 financial statements.
Pursuant to the Global Termination Agreement, in consideration for the early termination of the vessel leases, and related agreements and the mutual release of all claims thereunder, we agreed to: (i) issue to SFL $40.0 million in aggregate principal amount of Second Lien Senior Secured Notes due 2016; (ii) issue to SFL the number of warrants to purchase 9,250,000 shares of our common stock at a conversion price of $0.01 per common share, which in the aggregate represents 10% of the fully diluted shares of such common stock after giving effect to such issuance but subject to approximately 8% dilution for a management incentive plan; (iii) transfer to SFL certain property on board the vessels (such as bunker fuel, spare parts and equipment, and consumable stores) at the time of redelivery to SFL without any additional payment; (iv) reimburse reasonable costs incurred by SFL to (a) return the vessels from their current laid up status to operating status, which reimbursement shall not exceed $0.6 million, (b) reposition the vessels from the Philippines to either Hong Kong or Singapore, which reimbursement shall not exceed $0.1 million, (c) remove our stack insignia and name from the vessels, which reimbursement shall not exceed $0.1 million, and (d) complete the reflagging of the vessels to the Marshall Islands registry, which reimbursement is currently expected to approximate $0.1 million; and (v) reimburse SFL for their reasonable costs and expenses incurred in connection with the transaction, which we estimate represents an aggregate maximum reimbursement obligation to the SFL Parties of $0.6 million.
NYSE Delisting
On October 14, 2011, the NYSE notified us trading in our common stock would be suspended on October 20, 2011. On October 20, 2011, our common stock began trading on the over-the-counter (“OTC”) market under a new stock symbol, HRZL. We requested a review of the NYSE’s determination by a committee of the Board of Directors of the NYSE Regulation. Upon the conclusion of the appeal process, the NYSE confirmed, on February 29, 2012, its determination to delist our common stock. Our common stock was removed from listing on the NYSE and a Form 25 was filed on March 1, 2012.
Election of New Directors
In connection with the comprehensive recapitalization plan discussed above, we and certain holders (the “Exchanging Holders”) of our 4.25% Notes entered into a restructuring support agreement dated August 26,
3
Table of Contents
2011, as amended on September 29, 2011 and October 3, 2011 (collectively, the “Restructuring Support Agreement”). The Restructuring Support Agreement clarified certain understandings regarding post-closing corporate governance-related items, including a provision providing the Exchanging Holders with the ability to designate seven director nominees to our Board of Directors. On November 11, 2011, our Board of Directors increased the size of our Board of Directors to eleven members.
Effective November 25, 2011, four of our eight then current directors retired. Four persons then serving as members of our Board of Directors, William J. Flynn, Stephen H. Fraser, Bobby J. Griffin and Alex J. Mandl, did not resign. In addition, effective November 25, 2011, our Board of Directors appointed Jeffrey A. Brodsky, Kurt M. Cellar, Carol B. Hallett, James LaChance, Steven L. Rubin, Martin Tuchman, and David N. Weinstein to serve as members of our Board of Directors.
In connection with the April 5, 2012 transactions, we reduced the size of our Board of Directors to seven members from eleven. Board member Jeffrey A. Brodsky has succeeded Alex J. Mandl as Chairman. Mr. Mandl is retiring from the Board, along with William J. Flynn, Bobby J. Griffin and Carol B. Hallett. Mr. Fraser will remain interim President and CEO until a new CEO is named.
Puerto Rico Opt-Out Settlement
On November 23, 2011, we entered into a Settlement Agreement (the “Settlement Agreement”) with attorneys representing those shippers who opted out of the Puerto Rico direct purchaser class-action settlement and had indicated an intention to pursue an antitrust claim against us related to the Puerto Rico tradelane (such persons referred to collectively as the “Settling Claimants”).
See the section entitled “Legal Proceedings” for a description of the class-action settlement. The Settling Claimants elected to opt-out of the settlement class to preserve their rights, if any, against us relating to the Puerto Rico tradelane.
Pursuant to the terms of the Settlement Agreement, in exchange for the full, complete and final settlement of the alleged claims from the Settling Claimants, we agreed to pay the Settling Claimants an aggregate amount of $13.8 million in three installments. As such, we recorded a charge of $12.7 million during the fourth quarter of 2011, which represents the present value of the $13.8 million in installment payments. Under the terms of the settlement agreement, we made a payment of $5.8 million during December 2011, and are required to make the second installment payment of $4.0 million on or before June 24, 2012 and the final $4.0 million payment on or before December 24, 2012.
Special Meeting of Stockholders
On December 2, 2011, a special meeting of stockholders was held to consider: (i) a proposal to amend the Company’s Amended and Restated Certificate of Incorporation to effect a 1-for-25 reverse stock split of the Common Stock; (ii) a proposal to amend the Company’s Amended and Restated Certificate of Incorporation to increase the number of authorized shares of Common Stock from 100,000,000 to 2,500,000,000; however, such amendment did not become effective because Proposal No. 1 was approved; (iii) a proposal to amend the Company’s Amended and Restated Certificate of Incorporation to authorize the issuance of warrants in lieu of cash or redemption notes in consideration for “Excess Shares” to facilitate compliance with the Jones Act; and (iv) a proposal to approve the Company’s Restated Certificate of Incorporation.
At the special meeting, the shareholders voted for the proposal to amend the Company’s Amended and Restated Certificate of Incorporation to effect a 1-for-25 reverse stock split of the Common Stock; for the proposal to amend the Company’s Amended and Restated Certificate of Incorporation to increase the number of authorized shares of Common Stock from 100,000,000 to 2,500,000,000; for the proposal to amend the Company’s Amended and Restated Certificate of Incorporation to authorize the issuance of warrants in lieu of
4
Table of Contents
cash or redemption notes in consideration for “Excess Shares” to facilitate compliance with the Jones Act; and for the proposal to approve the Company’s Restated Certificate of Incorporation. As the proposal to amend the Company’s Amended and Restated Certificate of Incorporation to effect a 1-for-25 reverse stock split of the Common Stock was approved by stockholders, the Board of Directors did take action to effect the proposal to amend the Company’s Amended and Restated Certificate of Incorporation to increase the number of authorized shares of Common Stock from 100,000,000 to 2,500,000,000.
An amended and restated certificate of incorporation reflecting the 1-for-25 reverse stock split was filed with the Secretary of the State of Delaware on December 7, 2011. As such, each holders’ ownership of our common stock has been reduced uniformly as a result of the reverse stock split. The reverse stock split will not affect any stockholder’s percentage ownership interest in the Company, except to the extent that the reverse split results in any stockholders receiving cash in lieu of fractional shares. Unless otherwise noted, all share-related amounts herein reflect the reverse stock split.
Operations
We believe that we are the nation’s leading Jones Act container shipping and integrated logistics company, accounting for approximately 36% of total U.S. marine container shipments from the continental U.S. to Alaska, Puerto Rico and Hawaii, constituting the three non-contiguous Jones Act markets. We own or lease 20 vessels, 15 of which are fully qualified Jones Act vessels, and approximately 31,400 cargo containers. Five of our leased vessels are not in use on December 25, 2011. We have access to terminal facilities in each of our ports, operating our terminals in Alaska, Hawaii, and Puerto Rico, as well as contracting for terminal services in the seven ports in the continental U.S.
We ship a wide spectrum of consumer and industrial items used every day in our markets, ranging from foodstuffs (refrigerated and non-refrigerated) to household goods and auto parts to building materials and various materials used in manufacturing. Many of these cargos are consumer goods vital to the populations in our markets, thereby providing us with a relatively stable base of demand for our shipping and logistics services. We have many long-standing customer relationships with large consumer and industrial products companies, such as Costco Wholesale Corporation, Johnson & Johnson, Lowe’s Companies, Inc., Safeway, Inc., and Wal-Mart Stores, Inc. We also serve several agencies of the U.S. government, including the Department of Defense and the U.S. Postal Service. Our customer base is broad and diversified, with our top ten customers accounting for approximately 34% of revenue and our largest customer accounting for approximately 9% of total revenue.
We have divested our third-party logistics services and ceased operations related to our FSX service. There will not be any significant future cash flows related to these operations. As such, these services have been classified as discontinued operations. The divestiture of our logistics operations did not include our Sea-Logix trucking operation, our warehouse operation or Horizon Services Group, our information technology operation.
The Jones Act
Our revenues are generated from our shipping and integrated logistics services in markets where the marine trade is subject to the coastwise laws of the United States, also known as the Jones Act.
The Jones Act is a long-standing cornerstone of U.S. maritime policy. Under the Jones Act, all vessels transporting cargo between covered U.S. ports must, subject to limited exceptions, be built in the U.S., registered under the U.S. flag, manned by predominantly U.S. crews, and owned and operated by U.S.-organized companies that are controlled and 75% owned by U.S. citizens. U.S.-flagged vessels are generally required to be maintained at higher standards than foreign-flagged vessels and are supervised by, as well as subject to rigorous inspections by, or on behalf of the U.S. Coast Guard, which requires appropriate certifications and background checks of the crew members. Our trade routes between Alaska, Hawaii and Puerto Rico and the continental U.S. represent the
5
Table of Contents
three non-contiguous Jones Act markets. Vessels operating on these trade routes are required to be fully qualified Jones Act vessels.
Cabotage laws, which reserve the right to ship cargo between domestic ports to domestic vessels, are not unique to the United States; similar laws are common around the world and exist in over 50 countries. In general, all interstate and intrastate marine commerce within the U.S. falls under the Jones Act, which is a cabotage law. We believe the Jones Act enjoys broad support from President Obama and both major political parties in both houses of Congress. We believe that the ongoing war on terrorism has further solidified political support for the Jones Act, as a vital and dedicated U.S. merchant marine is a cornerstone for a strong homeland defense, as well as a critical source of trained U.S. mariners for wartime support.
Market Overview and Competition
The Jones Act distinguishes the U.S. domestic shipping market from international shipping markets. Given the limited number of existing Jones Act qualified vessels, the high capital investment and long delivery lead times associated with building a new containership in the U.S., the substantial investment required in infrastructure and the need to develop a broad base of customer relationships, the markets in which we operate have been less vulnerable to overcapacity and volatility than international shipping markets.
To ensure on-time pick-up and delivery of cargo, shipping companies must maintain strict vessel schedules and efficient terminal operations for expediting the movement of containers in and out of terminal facilities. The departure and arrival of vessels on schedule is heavily influenced by both vessel maintenance standards (i.e., minimizing mechanical breakdowns) and terminal operating discipline. Marine terminal gate and yard efficiency can be enhanced by efficient yard layout, high-quality information systems, and streamlined gate processes.
The Jones Act markets are not as fragmented as international shipping markets. We are one of only two major container shipping operators currently serving the Alaska market. Horizon Lines and Totem Ocean Trailer Express, Inc. (“TOTE”) serve the Alaska market. Horizon Lines and Matson Navigation Co (“Matson”) serve the Hawaii market. The Pasha Group also serves the Hawaii market with a roll-on/roll-off vessel. The Puerto Rico market is currently served by two containership companies, Horizon Lines and Sea Star Lines. Two barge operators, Crowley and Trailer Bridge, Inc., also currently serve this market.
Vessel Fleet
Our management team executes an effective strategy for the maintenance of our vessels. Early in our 55-year operating history, when we pioneered Jones Act container shipping, we recognized the vital importance of maintaining our valuable Jones Act qualified vessels. Our on-shore vessel management team carefully manages all of our ongoing regular maintenance and dry-docking activity.
We maintain our vessels according to our own strict maintenance procedures, which meet or exceed U.S. government requirements. All of our vessels are regulated pursuant to rigorous standards promulgated by the U.S. Coast Guard and subject to periodic inspection and certification, for compliance with these standards, by the American Bureau of Shipping, on behalf of the U.S. Coast Guard. Our procedures protect and preserve our fleet to the highest standards in our industry and enable us to preserve the usefulness of our ships. During each of the last four years, our vessels have been in operational condition, ready to sail, over 99% of the time when they were required to be ready to sail.
6
Table of Contents
The table below lists our vessel fleet, which is the largest containership fleet within the Jones Act markets, as of December 25, 2011. Our vessel fleet consists of 20 vessels of varying classes and specifications, 15 of which are fully Jones Act qualified. All of the 11 vessels that are actively deployed are Jones Act qualified. Two Jones Act qualified vessels are spare vessels available for seasonal and dry-dock needs and to respond to potential new revenue opportunities. Two additional spare Jones Act qualified vessels could be available for deployment after undergoing dry-docking for inspection and maintenance.
| September 30, | September 30, | September 30, | September 30, | September 30, | September 30, | September 30, | ||||||||||||||||
Vessel Name | Market | Year Built | TEU(1) | Reefer Capacity(2) | Max. Speed | Owned/ Chartered | Charter Expiration | |||||||||||||||
U.S Built — Jones Act Qualified | ||||||||||||||||||||||
Horizon Anchorage | Alaska | 1987 | 1,668 | 280 | 20.0 kts | Chartered | Jan 2015 | |||||||||||||||
Horizon Tacoma | Alaska | 1987 | 1,668 | 280 | 20.0 kts | Chartered | Jan 2015 | |||||||||||||||
Horizon Kodiak | Alaska | 1987 | 1,668 | 280 | 20.0 kts | Chartered | Jan 2015 | |||||||||||||||
Horizon Fairbanks(3) | Alaska | 1973 | 1,476 | 140 | 22.5 kts | Owned | — | |||||||||||||||
Horizon Pacific | Hawaii | 1980 | 2,407 | 150 | 21.0 kts | Owned | — | |||||||||||||||
Horizon Enterprise | Hawaii | 1980 | 2,407 | 150 | 21.0 kts | Owned | — | |||||||||||||||
Horizon Spirit | Hawaii | 1980 | 2,653 | 150 | 22.0 kts | Owned | — | |||||||||||||||
Horizon Reliance | Hawaii | 1980 | 2,653 | 156 | 22.0 kts | Owned | — | |||||||||||||||
Horizon Producer | Puerto Rico | 1974 | 1,751 | 170 | 22.0 kts | Owned | — | |||||||||||||||
Horizon Challenger | Puerto Rico | 1968 | 1,424 | 71 | 21.2 kts | Owned | — | |||||||||||||||
Horizon Navigator | Puerto Rico | 1972 | 2,386 | 190 | 21.0 kts | Owned | — | |||||||||||||||
Horizon Trader | Puerto Rico | 1973 | 2,386 | 190 | 21.0 kts | Owned | — | |||||||||||||||
Horizon Discovery(4) | — | 1968 | 1,442 | 100 | 21.2 kts | Owned | — | |||||||||||||||
Horizon Consumer(4) | — | 1973 | 1,751 | 170 | 22.0 kts | Owned | — | |||||||||||||||
Horizon Hawaii(4) | — | 1973 | 1,420 | 170 | 22.5 kts | Owned | — | |||||||||||||||
Foreign Built — Non-Jones Act Qualified | ||||||||||||||||||||||
Horizon Hunter(5) | — | 2006 | 2,824 | 566 | 23.0 kts | Chartered | Nov 2018 | |||||||||||||||
Horizon Hawk(5) | — | 2007 | 2,824 | 566 | 23.0 kts | Chartered | Mar 2019 | |||||||||||||||
Horizon Tiger(5) | — | 2006 | 2,824 | 566 | 23.0 kts | Chartered | May 2019 | |||||||||||||||
Horizon Eagle(5) | — | 2007 | 2,824 | 566 | 23.0 kts | Chartered | Apr 2019 | |||||||||||||||
Horizon Falcon(5) | — | 2007 | 2,824 | 566 | 23.0 kts | Chartered | Apr 2019 | |||||||||||||||
| (1) | Twenty-foot equivalent unit, or TEU, is a standard measure of cargo volume correlated to the volume of a standard 20-foot dry cargo container. |
| (2) | Reefer capacity, or refrigerated container capacity, refers to the total number of 40-foot equivalent units, or FEUs, which the vessel can hold. The FEU is a standard measure of refrigerated cargo volume correlated to the volume of a standard 40-foot reefer, or refrigerated cargo container. |
| (3) | Horizon Fairbanks could serve as a spare vessel available for deployment in any of our markets and seasonal operation in the Alaska trade after undergoing inspection and maintenance (dry-docking). |
| (4) | Vessels are available for seasonal needs, dry-dock relief and to respond to potential new revenue opportunities, and thus are not specific to any given market. Horizon Hawaii must undergo inspection and maintenance (dry-docking) in order to be available for deployment. Given current economic conditions, and if the new revenue opportunities fail to materialize, we may make a decision to scrap one or more of the spare vessels. |
| (5) | The leases associated with these vessels have been terminated pursuant to an agreement with SFL. See “Recent Developments” for more details. |
Vessel Charters
Eight of our vessels, the Horizon Anchorage, Horizon Tacoma, Horizon Kodiak, Horizon Hunter, Horizon Hawk, Horizon Eagle, Horizon Falcon and Horizon Tiger are leased, or chartered. The charters for the Horizon Anchorage, Horizon Tacoma, and Horizon Kodiak are due to expire in January 2015; the Horizon Hunter in
7
Table of Contents
2018; and the Horizon Hawk, Horizon Eagle, Horizon Falcon and Horizon Tiger in 2019. For each chartered vessel, we generally have the following options in connection with the expiration of the charter: (i) purchase the vessel for its fair market value, (ii) extend the charter for an agreed upon period of time at a fair market value charter rate or, (iii) return the vessel to its owner.
The Horizon Hunter, Horizon Hawk, Horizon Tiger, Horizon Eagle and Horizon Falcon were used solely in our FSX service that was discontinued in the fourth quarter of 2011. We have terminated the leases associated with these vessels pursuant to an agreement with SFL. See “Recent Developments” for more details.
The obligations under the existing charters for the Horizon Anchorage, Horizon Tacoma and Horizon Kodiak are guaranteed by our former parent, CSX Corporation, and certain of its affiliates. In turn, certain of our subsidiaries are parties to the Amended and Restated Guarantee and Indemnity Agreement, referred to herein as the GIA, with CSX Corporation and certain of its affiliates, pursuant to which these subsidiaries have agreed to indemnify these CSX entities if any of them should be called upon by any owner of the chartered vessels to make payments to such owner under the guarantees referred to above.
Container Fleet
As summarized in the table below, our container fleet as of December 25, 2011 consists of owned and leased containers of different types and sizes. All but one of our container leases are accounted for as operating leases.
Container Type | Owned | Leased | Combined | |||||||||
20’ Standard Dry | 18 | 955 | 973 | |||||||||
20’ Flat Rack | 1 | — | 1 | |||||||||
20’ High-Cube Reefer | 72 | — | 72 | |||||||||
20’ Miscellaneous | 63 | — | 63 | |||||||||
20’ Tank | 1 | — | 1 | |||||||||
40’ Standard Dry | 55 | 2,233 | 2,288 | |||||||||
40’ Flat Rack | 333 | 378 | 711 | |||||||||
40’ High-Cube Dry | 2,843 | 11,545 | 14,388 | |||||||||
40’ Standard Insulated | 4 | — | 4 | |||||||||
40’ High-Cube Insulated | 472 | — | 472 | |||||||||
40’ Standard Opentop | — | 54 | 54 | |||||||||
40’ Miscellaneous | 56 | — | 56 | |||||||||
40’ Tank | 1 | — | 1 | |||||||||
40’ Car Carrier | 165 | — | 165 | |||||||||
40’ High-Cube Reefer | 4,176 | 1,365 | 5,541 | |||||||||
45’ High-Cube Dry | 3,098 | 2,470 | 5,568 | |||||||||
45’ High-Cube Flatrack | 25 | — | 25 | |||||||||
45’ High-Cube Insulated | 464 | — | 464 | |||||||||
45’ High-Cube Reefer | 323 | — | 323 | |||||||||
48’ High-Cube Dry | 237 | — | 237 | |||||||||
|
|
|
|
|
| |||||||
Total | 12,407 | 19,000 | 31,407 | |||||||||
|
|
|
|
|
| |||||||
In connection with the expiration of our equipment sharing agreements with Maersk, we increased the quantity of containers in preparation of the launch of our FSX service. As a result of the shutdown of our Guam/FSX Service, we have begun the process of returning excess containers, and expect to offhire a total of approximately 8,200 containers.
Maersk Arrangements
In connection with the sale of the international marine container operations of Sea-Land by our former parent, CSX Corporation, to Maersk, in December 1999, our predecessor, CSX Lines, LLC and certain of its
8
Table of Contents
subsidiaries entered into a number of commercial agreements with various Maersk entities that encompassed terminal services, equipment sharing, sales agency services, trucking services, cargo space charters, and transportation services. Certain of these agreements expired at the end of 2010. Maersk continues to serve as our terminal service provider in the continental U.S., at our ports in Elizabeth, New Jersey, Jacksonville, Florida, Houston, Texas, Los Angeles, California, and Tacoma, Washington. We are Maersk’s terminal operator in Alaska and Puerto Rico. Certain equipment sharing agreements, sales agency agreements and the TP1 Space Charter and Transportation Service Contract with Maersk expired in December 2010.
Under our previous cargo space charter and transportation service agreements with Maersk, we utilized Maersk containers to carry a portion of our cargo westbound to Hawaii and Guam, where the contents of the containers were unloaded. We shipped the empty containers to Yantian and Xiamen, China and Kaohsiung, Taiwan. When the vessels arrived in Asia, Maersk unloaded the empty containers and replaced them with loaded containers for the return trip to the U.S. west coast. We achieved significantly greater vessel capacity utilization and revenue on this route as a result of this arrangement. We also used Maersk equipment on our service to Hawaii from our U.S. west coast ports, as well as from select U.S. inland locations.
Capital Construction Fund
The Merchant Marine Act, 1936, as amended, permits the limited deferral of U.S. federal income taxes on earnings from eligible U.S.-built and U.S.-flagged vessels and U.S.-built containers if the earnings are deposited into a Capital Construction Fund (“CCF”), pursuant to an agreement with the U.S. Maritime Administration, (“MARAD”). Any amounts deposited in a CCF can be withdrawn and used for the acquisition, construction or reconstruction of U.S.-built and U.S.-flagged vessels or U.S.-built containers.
Horizon Lines has a CCF agreement with MARAD under which it occasionally deposits earnings attributable to the operation of its Jones Act qualified vessels into the CCF and makes withdrawals of funds from the CCF to acquire U.S.-built and U.S.-flagged vessels. From 2003-2005, Horizon Lines utilized CCF deposits totaling $50.4 million to acquire six U.S.-built and U.S.-flagged vessels (Horizon Enterprise, Horizon Pacific, Horizon Hawaii, Horizon Fairbanks, Horizon Navigator, and Horizon Trader).
Any amounts deposited in a CCF cannot be withdrawn for other than the qualified purposes specified in the CCF agreement. Any nonqualified withdrawals are subject to federal income tax at the highest marginal rate. In addition, such tax is subject to an interest charge based upon the number of years the funds have been on deposit. If Horizon Lines’ CCF agreement was terminated, funds then on deposit in the CCF would be treated as nonqualified withdrawals for that taxable year. In addition, if a vessel built, acquired, or reconstructed with CCF funds is operated in a nonqualified operation, the owner must repay a proportionate amount of the tax benefits as liquidated damages. These restrictions apply (i) for 20 years after delivery in the case of vessels built with CCF funds, (ii) ten years in the case of vessels reconstructed or acquired with CCF funds more than one year after delivery from the shipyard, and (iii) ten years after the first expenditure of CCF funds in the case of vessels in regard to which qualified withdrawals from the CCF fund have been made to pay existing indebtedness (five years if the vessels are more than 15 years old on the date the withdrawal is made). In addition, the sale or mortgage of a vessel acquired with CCF funds requires MARAD’s approval. Our consolidated balance sheets at December 25, 2011 and December 26, 2010 include liabilities of approximately $7.3 million and $14.8 million, respectively, for deferred taxes on deposits in our CCF.
Sales and Marketing
We manage a sales and marketing team of 83 employees strategically located in our various ports, as well as in five regional offices across the continental U.S., including our headquarters in Charlotte, North Carolina and from Compton, California. Senior sales and marketing professionals are responsible for developing sales and marketing strategies and are closely involved in servicing our largest customers. All pricing activities are also coordinated from Charlotte, North Carolina; Dallas, Texas; and from Renton, Washington, enabling us to manage our customer relationships. The marketing team located in Charlotte is responsible for providing appropriate
9
Table of Contents
market intelligence and direction to the Puerto Rico sales organization. The marketing team located in Dallas is responsible for providing appropriate market intelligence and direction to the members of the organization who focus on the Hawaii and our Renton marketing team focuses on the Alaska markets.
Our regional sales and marketing presence ensures close and direct interaction with customers on a daily basis. Many of our regional sales professionals have been servicing the same customers for over ten years. We believe that we have the largest sales force of all container shipping and integrated logistics companies active in our domestic markets. We believe that the breadth and depth of our relationships with our customers is the principal driver of repeat business from our customers.
Customers
We serve a diverse base of long-standing, established customers consisting of many of the world’s largest consumer and industrial products companies. Such customers include Costco Wholesale Corporation, Johnson & Johnson, Lowe’s Companies, Inc., Safeway, Inc., and Wal-Mart Stores, Inc. In addition, we serve several agencies of the U.S. government, including the Department of Defense and the U.S. Postal Service.
We believe that we are uniquely positioned to serve these and other large national customers due to our position as the only shipping and integrated logistics company serving all three non-contiguous Jones Act markets. Approximately 55% of our transportation revenue in 2011 was derived from customers shipping with us in more than one of our markets and approximately 34% of our transportation revenue in 2011 was derived from customers shipping with us in all three domestic markets.
We generate most of our revenue through customer contracts with specified rates and volumes, and with durations ranging from one to six years, providing stable revenue streams. The majority of our customer contracts contain provisions that allow us to implement fuel surcharges based on fluctuations in our fuel costs. In addition, our relationships with many of our customers extend far beyond the length of any given contract. For example, some of our customer relationships extend back over 40 years and our top ten customer relationships average 33 years.
We serve customers in numerous industries and carry a wide variety of cargos, mitigating our dependence upon any single customer or single type of cargo. During 2011, our top ten largest customers comprised approximately 34% of total revenue, with our largest customer accounting for approximately 9% of total revenue. Total revenue includes transportation, non-transportation and other revenue.
Industry and market data used throughout this Form 10-K, including information relating to our relative position in the shipping and integrated logistics industries are approximations based on the good faith estimates of our management. These estimates are generally based on internal surveys and sources, and other publicly available information, including local port information. Unless otherwise noted, financial, industry and market data presented herein are for the period ending in December 2011.
Operations Overview
Our operations share corporate and administrative functions such as finance, information technology, human resources, legal, and sales and marketing. Centralized functions are performed primarily at our Charlotte headquarters and at our operations center in Irving.
We book and monitor all of our shipping and integrated logistics services with our customers through the Horizon Information Technology System (“HITS”). HITS, our proprietary ocean shipping and logistics information technology system, provides a platform to execute a shipping transaction from start to finish in a cost-effective, streamlined manner. HITS provides an extensive database of information relevant to the shipment of containerized cargo and captures all critical aspects of every shipment booked with us. In a typical transaction,
10
Table of Contents
our customers go on-line to book a shipment or call, fax or e-mail our customer service department. Once applicable shipping information is input into the booking system, a booking number is generated. The booking information then downloads into other systems used by our dispatch team, terminal personnel, vessel planners, documentation team, integrated logistics team and other teams and personnel who work together to produce a seamless transaction for our customers.
We strive to minimize our empty repositioning costs. Our dispatch team coordinates truck and/or rail shipping between inland locations and ports on intermodal bookings. We currently purchase rail services directly from the railroads involved through confidential transportation service contracts. Our terminal personnel schedule equipment availability for containers picked up at the port. Our vessel planners develop stowage plans and our documentation teams process the cargo bill. We review space availability and inform our other teams and personnel when additional bookings are required and when bookings need to be changed or pushed to the next vessel. After containers arrive at the port of origin, they are loaded on board the vessel. Once the containers are loaded and are at sea, our destination terminal staff initiates the process of receiving and releasing containers to our customers. Customers accessing HITS via our internet portal have the option to receive e-mail alerts as specific events take place throughout this process. All of our customers have the option to call our customer service department or to access HITS via our internet portal, 24 hours a day, seven days a week, to track and trace shipments. Customers may also view their payment histories and make payments on-line.
Insurance
We maintain insurance policies to cover risks related to physical damage to our vessels and vessel equipment, other equipment (including containers, chassis, terminal equipment and trucks) and property, as well as with respect to third-party liabilities arising from the carriage of goods, the operation of vessels and shoreside equipment, and general liabilities which may arise through the course of our normal business operations. We also maintain workers compensation insurance, business interruption insurance, and insurance providing indemnification for our directors, officers, and certain employees for some liabilities.
Security
Heightened awareness of maritime security needs, brought about by the events of September 11, 2001 and numerous maritime piracy attacks around the globe, have caused the United Nations through its International Maritime Organization (“IMO”), the U.S. Department of Homeland Security, through its Coast Guard, and the states and local ports to adopt a more stringent set of security procedures relating to the interface between port facilities and vessels. In addition, the U.S. Congress has enacted legislation requiring the implementation of Coast Guard approved vessel and facility security plans.
Certain aspects of our security plans require our investing in infrastructure upgrades to ensure compliance. We have applied in the past and will continue to apply going forward for federal grants to offset the incremental expense of these security investments. While we were successful through two early rounds of funding to secure substantial grants for specific security projects, the current grant award criteria favor the largest ports and stakeholder consortia applications, limiting the available funds for standalone private maritime industry stakeholders. In addition, the current administration is continuously reviewing the criteria for awarding such grants. Such changes could have a negative impact on our ability to win grant funding in the future. Security surcharges are evaluated regularly and we may at times incorporate these surcharges into the base transportation rates that we charge.
Employees
As of February 19, 2012, we had 1,635 employees, of which approximately 1,150 were represented by seven labor unions.
11
Table of Contents
The table below sets forth the unions which represent our employees, the number of employees represented by these unions as of February 19, 2012 and the expiration dates of the related collective bargaining agreements:
| September 30, | September 30, | |||||
Union | Collective Bargaining Agreement(s) Expiration Date | Number of Our Employees Represented | ||||
International Brotherhood of Teamsters | March 31, 2013 | 257 | ||||
International Brotherhood of Teamsters, Alaska | June 30, 2011(1) | 126 | ||||
International Longshore & Warehouse Union (ILWU) | June 30, 2014 | 205 | ||||
International Longshore and Warehouse Union, Alaska (ILWU-Anchorage, Alaska) | June 30, 2011(1) | 39 | ||||
International Longshore and Warehouse Union, Alaska (ILWU-Kodiak and Dutch Harbor, Alaska) | June 30, 2012 | 57 | ||||
International Longshoremen’s Association, AFL-CIO (ILA) | September 30, 2012 | — | (2) | |||
International Longshoremen’s Association, AFL-CIO, Puerto Rico | September 30, 2012 | 86 | ||||
Marine Engineers Beneficial Association (MEBA) | June 15, 2022 | 75 | (3) | |||
International Organization of Masters, Mates & Pilots, AFL-CIO (MMP) | June 15, 2017 | 49 | (3) | |||
Office & Professional Employees International Union, AFL-CIO | November 9, 2012 | 53 | ||||
Seafarers International Union (SIU) | June 30, 2012 | 203 | ||||
| (1) | Our employees covered under these agreements are continuing to work under old agreements while we negotiate new agreements. |
| (2) | Multi-employer arrangement representing workers in the industry, including workers who may perform services for us but are not our employees. |
| (3) | We expect a reduction to these headcount amounts once we reach a final resolution related to the vessels that formerly operated in the FSX service. |
The table below provides a breakdown of headcount by non-contiguous Jones Act market and function for our non-union employees as of February 19, 2012.
| Alaska Market | Hawaii Market | Puerto Rico Market | Corporate(a) | Total | ||||||||||||||||
Senior Management | 1 | 1 | 1 | 13 | 16 | |||||||||||||||
Operations | 33 | 63 | 44 | 47 | 187 | |||||||||||||||
Sales and Marketing | 17 | 21 | 40 | 5 | 83 | |||||||||||||||
Administration(b) | 2 | 23 | 8 | 166 | 199 | |||||||||||||||
|
|
|
|
|
|
|
|
|
| |||||||||||
Total Headcount | 53 | 108 | 93 | 231 | 485 | |||||||||||||||
|
|
|
|
|
|
|
|
|
| |||||||||||
| (a) | Corporate headcount includes employees in both Charlotte, North Carolina (headquarters) and in Irving, Texas and other locations. |
| (b) | Administration headcount is comprised of back-office functions and also includes customer service and documentation. |
12
Table of Contents
Environmental Initiatives
We strive to support our commitment to protect the environment with programs that promote best practices in environmental stewardship. During 2008, we launched our Horizon Green initiative and in March 2012 we provided a progress report. Through our Horizon Green initiative, we strive to better understand and measure our impact on the environment, and to develop programs that incorporate environmental stewardship into our core operations. Within the Horizon Green initiative, we are addressing three key areas:
Marine Environment
To protect the marine environment, we have established several programs in addition to the MARPOL and ISM codes created by the International Maritime Organization. These include vessel management controls, low sulfur diesel fuel usage and marine terminal pollution mitigation plans.
Emissions
We are focused on reducing transportation emissions, including carbon dioxide, nitrous oxide and sulfur dioxide, through improvements in vessel fuel consumption and truck efficiency; the use of alternative fuels; and the development of more fuel-efficient transportation solutions.
Sustainability
We believe in a long-term sustainable approach to integrated logistics management that benefits the company, customers, associates, shareholders and the community. Examples include reducing empty backhaul miles through logistics network optimization and using recycled materials to build containers.
Available Information
The mailing address of the Company’s Executive Office is 4064 Colony Road, Suite 200, Charlotte, North Carolina 28211 and the telephone number at that location is (704) 973-7000. The Company’s most recent SEC filings can be found on the SEC’s website, www.sec.gov, and on the Company’s website, www.horizonlines.com. The Company’s 2011 annual report on Form 10-K will be available on the Company’s website as soon as reasonably practicable. All such filings are available free of charge. The contents of our website are not incorporated by reference into this Form 10-K. The public may read and copy any materials the Company files with the SEC at the SEC’s Public Reference Room at 100 F Street, NE, Washington, DC 20549. The public may obtain information on the operation of the Public Reference Room by calling 1-800-SEC-0330.
| Item 1A. | Risk Factors |
We have incurred significant net losses from continuing operations in the recent past, and such losses may continue in the future, which may result in a need for increased access to capital. If our cash provided by operating and financing activities is insufficient to fund our cash requirements, we could face substantial liquidity problems.
Our net losses from continuing operations were $53.2 million and $35.6 million for the fiscal years ending 2011 and 2010, respectively. In the event we require capital in the future due to continued losses, such capital may not be available on satisfactory terms, or available at all.
Our liquidity derived from our $100.0 million principal amount asset-based revolving credit facility (the “ABL Facility”) is based on availability determined by a borrowing base. We may not be able to maintain adequate levels of eligible assets to support our required liquidity in the future.
Our cash flows and capital resources may be insufficient to make required payments on our substantial indebtedness and future indebtedness.
As of March 31, 2012, after giving effect to the April 5, 2012 transactions described in Recent Developments, on a consolidated basis, we had (i) $404.3 million of outstanding funded long-term debt (exclusive of capital lease obligations of $7.1 million and outstanding letters of credit with an aggregate face
13
Table of Contents
amount of $19.6 million), (ii) approximately $284.9 million of aggregate trade payables, accrued liabilities and other balance sheet liabilities (other than the long-term debt referred to above) and (iii) a negative funded debt-to-equity ratio. Accrued liabilities as of December 25, 2011 include $17.0 million of expected cash payments related to the shutdown of the FSX service, excluding our vessel lease obligations. In addition, we have $29.5 million of interest anticipated to be payable in fiscal 2012 under our debt agreements
Because we have substantial debt, we require significant amounts of cash to fund our debt service obligations. Our ability to generate cash to meet scheduled payments or to refinance our obligations with respect to our debt depends on our financial and operating performance which, in turn, is subject to prevailing economic and competitive conditions and to the following financial and business factors, some of which may be beyond our control:
| • | operating difficulties; |
| • | increased operating costs; |
| • | increased fuel costs; |
| • | general economic conditions; |
| • | decreased demand for our services; |
| • | market cyclicality; |
| • | tariff rates; |
| • | prices for our services; |
| • | the actions of competitors; |
| • | regulatory developments; and |
| • | delays in implementing strategic projects. |
If our cash flow and capital resources are insufficient to fund our debt service obligations, we could face substantial liquidity problems and might be forced to reduce or delay capital expenditures, dispose of material assets or operations, seek to obtain additional equity capital, or restructure or refinance our indebtedness. Such alternative measures may not be successful and may not permit us to meet our scheduled debt service obligations. In particular, in the event that we are required to dispose of material assets or operations to meet our debt service obligations, we cannot be sure as to the timing of such dispositions or the proceeds that we would realize from those dispositions. The value realized from such dispositions will depend on market conditions and the availability of buyers, and, consequently, any such disposition may not, among other things, result in sufficient cash proceeds to repay our indebtedness.
Further issuances of our common stock could be dilutive.
The market price of our common stock could decline due to the issuance or sales of a large number of shares in the market, including the issuance of shares underlying our convertible notes or warrants, or the perception that these issuances could occur. These issuances could also make it more difficult or impossible for us to sell equity securities in the future at a time and price that we deem appropriate to raise funds through future offerings of common stock.
In connection with our 2011 comprehensive refinancing, we issued 1,003,485 shares of our common stock and warrants to purchase 982,975 shares of our common stock. In addition, on January 11, 2012, we issued 1,014,839 shares of our common stock and warrants to purchase up to 1,702,592 shares of common stock to complete the mandatory debt-to-equity conversion of approximately $49.7 million of the Series B Notes. In connection with the April 5, 2012 transactions, we issued common shares and warrants equivalent to 86,490,929 shares on an as-converted basis. Collectively, all of the holders of our common stock prior to the April 5, 2012 transactions have a remaining 6.5% interest in our outstanding common stock. Holders of our common stock prior to the October 5, 2011 comprehensive refinancing, collectively, have a remaining 1.4% interest in our outstanding common stock.
14
Table of Contents
Recent transactions have significantly diluted the ownership interest of holders of our common stock. Any further issuances of our common stock could further dilute existing holders of our common stock and could cause the price of our common stock to decrease and the value of each share of our common stock to decrease substantially.
Certain of our investors hold a significant percentage of our outstanding common stock or securities convertible into our common stock, which could reduce the ability of minority shareholders to effect certain corporate actions.
A small group of investors holds approximately 98.6% of our outstanding common stock on an as-converted basis. As a result, they possess significant influence and can elect a majority of our board of directors and authorize or prevent proposed significant corporate transactions. Their ownership and control may also have the effect of delaying or preventing a future change in control, impeding a merger, consolidation, takeover or other business combination or discourage a potential acquirer from making a tender offer.
We are subject to risks associated with government investigations, lawsuits and claims.
In February 2011, we resolved an investigation by the Antitrust Division of the U.S. Department of Justice (“DOJ”) and are required to pay a fine of $15.0 million over five years and are subject to a probationary period of five years. In January 2012, we resolved another investigation by the DOJ relating to environmental record-keeping violations and are required to pay a fine of $1.0 million and donate an additional $0.5 million to the National Fish & Wildlife Foundation and are subject to a probationary period of three years. Any violation of probation could result in additional penalties, costs or sanctions being imposed on us.
We have also received a notice of alleged violation from the United States Department of Agriculture relating to the sale of meat transported on one of our vessels, and we are also investigating a matter relating to alleged fuel surcharges imposed by freight forwarders on cargo transported for the Department of Defense.
In addition to government investigations, we have been involved in several significant lawsuits and claims relating to antitrust matters, and additional lawsuits may be filed in connection with any future government investigations. We may face significant additional claims and substantial additional expenses in connection with antitrust matters and related lawsuits or any other matters related to any government investigations.
We are also likely to incur additional expenses in the future in connection with our obligation to cooperate with governmental authorities and civil claimants with whom we have settled. The expenses of such cooperation could have a material adverse effect on our business, results of operations or cash flows.
Our substantial indebtedness and future indebtedness could significantly impair our operating and financial condition.
Our substantial indebtedness could have important consequences to investors and significant effects on our business, including the following:
| • | it may make it difficult for us to satisfy our obligations under our indebtedness and contractual and commercial commitments and, if we fail to comply with these requirements, an event of default could result; |
| • | we will be required to use a substantial portion of our cash flow from operations to pay interest on our existing indebtedness, which will reduce the funds available to us for other purposes; |
| • | our ability to obtain additional debt financing in the future for working capital, capital expenditures, acquisitions or general corporate purposes may be limited; |
15
Table of Contents
| • | our flexibility in reacting to changes in our industry may be limited and we could be more vulnerable to adverse changes in our business or economic conditions in general; and |
| • | we may be at a competitive disadvantage compared to our competitors that are not as highly leveraged. |
The occurrence of any one of these events could have a material adverse effect on our business, financial condition, results of operations, prospects and ability to satisfy our obligations under our indebtedness.
Under agreements governing our outstanding indebtedness, we are not permitted to pay dividends on our common stock and we may not meet Delaware law requirements or have sufficient cash to pay dividends in the future.
We are not required to pay dividends to our stockholders and our stockholders do not have contractual or other rights to receive them. The agreements governing our outstanding indebtedness allow us to pay dividends only under limited circumstances, and pursuant to those agreements, we currently are not permitted to pay such dividends.
In addition, under Delaware law, our Board of Directors may not authorize a dividend unless it is paid out of our surplus (calculated in accordance with the Delaware General Corporation law), or, if we do not have a surplus, it is paid out of our net profits for the fiscal year in which the dividend is declared and the preceding fiscal year.
Our ability to pay dividends in the future will depend on numerous factors, including:
| • | our obligations under agreements governing our outstanding indebtedness; |
| • | the state of our business, the environment in which we operate, and the various risks we face, including financing risks and other risks summarized in this report; |
| • | our results of operations, financial condition, liquidity needs and capital resources; |
| • | our expected cash needs, including for interest and any future principal payments on indebtedness, capital expenditures and payment of fines and settlements related to antitrust matters; and |
| • | Potential sources of liquidity, including borrowing under our revolving credit facility or possible asset sales. |
We depend on the federal government for a substantial portion of our business, and we could be adversely affected by suspension or debarment by the federal government.
Some of our revenue is derived from contracts with agencies of the U.S. government, and as a U.S. government contractor, we are subject to federal regulations regarding the performance of our government contracts. In addition, we are required to certify our compliance with numerous federal laws, including environmental laws. Failure to comply with relevant federal laws may result in suspension or debarment. In March 2011, we pled guilty to a charge of violating federal antitrust laws in our Puerto Rico tradelane and in February 2012, we pled guilty to a charge relating to environmental record-keeping on one of our vessels. We have received a notice of alleged violation from the United States Department of Agriculture. If the federal government suspends or debars us for violation of legal and regulatory requirements, it could have a material adverse effect on our business, results of operations or prospects.
Further economic decline and decrease in market demand for the company’s services will adversely affect the Company’s operating results and financial condition.
A further slowdown in economic conditions of our markets may adversely affect our business. Demand for our shipping services depends on levels of shipping in our markets, as well as on economic and trade growth. Cyclical or other recessions in the continental U.S. or in these markets can negatively affect our operating results. Consumer purchases or discretionary items generally decline during periods where disposable income is
16
Table of Contents
adversely affected or there is economic uncertainty, and, as a result our customers may ship fewer containers or may ship containers only at reduced rates. For example, shipping volumes in Hawaii and Puerto Rico were down approximately 5% and 6%, respectively, during the year ended December 25, 2011 as compared to the year ended December 26, 2010, as a result of the slow economic recovery. The economic downturn in our tradelanes has negatively affected our earnings. We cannot predict the length of the current economic downturn, the pace of the protracted economic recovery, or whether further economic decline may occur.
Volatility in fuel prices may adversely affect our results of operations.
Fuel is a significant operating expense for our shipping operations. The price and supply of fuel is unpredictable and fluctuates based on events outside our control, including geopolitical developments, supply and demand for oil and gas, actions by OPEC and other oil and gas producers, war and unrest in oil producing countries and regions, regional production patterns and environmental concerns. As a result, variability in the price of fuel, such as we are currently experiencing, may adversely affect profitability. There can be no assurance that our customers will agree to bear such fuel price increases via fuel surcharges without a reduction in their volumes of business with us, nor any assurance that our future fuel hedging efforts, if any, will be successful.
Repeal, substantial amendment, or waiver of the Jones Act or its application could have a material adverse effect on our business.
If the Jones Act was to be repealed, substantially amended, or waived and, as a consequence, competitors with lower operating costs by utilizing their ability to acquire and operate foreign-flag and foreign-built vessels were to enter any of our Jones Act markets, our business would be materially adversely affected. In addition, our advantage as a U.S.-citizen operator of Jones Act vessels could be eroded by periodic efforts and attempts by foreign and domestic interests to circumvent certain aspects of the Jones Act. If maritime cabotage services were included in the General Agreement on Trade in Services, the North American Free Trade Agreement or other international trade agreements, or if the restrictions contained in the Jones Act were otherwise altered, the shipping of maritime cargo between covered U.S. ports could be opened to foreign-flag or foreign-built vessels.
Due to our participation in multi-employer pension plans, we may have exposure under those plans that extends beyond what our obligations would be with respect to our employees.
We contribute to fifteen multi-employer pension plans. In the event of a partial or complete withdrawal by us from any plan which is underfunded, we would be liable for a proportionate share of such plan’s unfunded vested benefits. Based on the limited information available from plan administrators, which we cannot independently validate, we believe that our portion of the contingent liability in the case of a full withdrawal or termination would be material to our financial position and results of operations. In the event that any other contributing employer withdraws from any plan which is underfunded, and such employer (or any member in its controlled group) cannot satisfy its obligations under the plan at the time of withdrawal, then we, along with the other remaining contributing employers, would be liable for our proportionate share of such plan’s unfunded vested benefits. While we have no current intention of taking any action that would subject us to any withdrawal liability, we cannot assure you that no other contributing employer will take such action.
In addition, if a multi-employer plan fails to satisfy the minimum funding requirements, the Internal Revenue Service, pursuant to Section 4971 of the Internal Revenue Code of 1986, as amended, referred to herein as the Code, will impose an excise tax of five (5%) percent on the amount of the accumulated funding deficiency. Under Section 413(c)(5) of the Code, the liability of each contributing employer, including us, will be determined in part by each employer’s respective delinquency in meeting the required employer contributions under the plan. The Code also requires contributing employers to make additional contributions in order to reduce the deficiency to zero, which may, along with the payment of the excise tax, have a material adverse impact on our financial results.
17
Table of Contents
Compliance with safety and environmental protection and other governmental requirements may adversely affect our operations.
The shipping industry in general and our business and the operation of our vessels and terminals in particular are affected by extensive and changing safety, environmental protection and other international, national, state and local governmental laws and regulations. For example, our vessels, as U.S.-flagged vessels, generally must be maintained “in class” and are subject to periodic inspections by the American Bureau of Shipping or similar classification societies, and must be periodically inspected by, or on behalf of, the U.S. Coast Guard. Federal environmental laws and certain state laws require us, as a vessel operator, to comply with numerous environmental regulations and to obtain certificates of financial responsibility and to adopt procedures for oil or hazardous substance spill prevention, response and clean up. In complying with these laws, we have incurred expenses and may incur future expenses for ship modifications and changes in operating procedures. Changes in enforcement policies for existing requirements and additional laws and regulations adopted in the future could limit our ability to do business or further increase the cost of our doing business.
Our vessels’ operating certificates and licenses are renewed periodically during the required annual surveys of the vessels. However, there can be no assurance that such certificates and licenses will be renewed. Also, in the future, we may have to alter existing equipment, add new equipment to, or change operating procedures for, our vessels to comply with changes in governmental regulations, safety or other equipment standards to meet our customers’ changing needs. If any such costs are material, they could adversely affect our financial condition.
We are subject to regulation and liability under environmental laws that could result in substantial fines and penalties that may have a material adverse affect on our results of operations.
The U.S. Act to Prevent Pollution from Ships, implementing the MARPOL convention, provides for severe civil and criminal penalties related to ship-generated pollution for incidents in U.S. waters within three nautical miles and in some cases in the 200-mile exclusive economic zone. The EPA requires vessels to obtain permits and comply with inspection, monitoring, recordkeeping and reporting requirements. Occasionally, our vessels may not operate in accordance with such permits or we may not adequately comply with recordkeeping and reporting requirements. Any such violations could result in substantial fines or penalties that could have a material adverse affect on our results of operations and our business.
Restrictions on foreign ownership of our vessels could limit our ability to sell off any portion of our business or result in the forfeiture of our vessels.
The Jones Act restricts the foreign ownership interests in the entities that directly or indirectly own the vessels which we operate in our Jones Act markets. If we were to seek to sell any portion of our business that owns any of these vessels, we would have fewer potential purchasers, since some potential purchasers might be unable or unwilling to satisfy the foreign ownership restrictions described above. As a result, the sales price for that portion of our business may not attain the amount that could be obtained in an unregulated market. Furthermore, at any point Horizon Lines, LLC, our indirect wholly-owned subsidiary and principal operating subsidiary, ceases to be controlled and 75% owned by U.S. citizens, we would become ineligible to operate in our current Jones Act markets and may become subject to penalties and risk forfeiture of our vessels.
Interruption or failure of our information technology and communications systems could impair our ability to effectively provide our shipping and logistics services, especially HITS, which could damage our reputation and harm our operating results.
Our provision of our shipping and logistics services depends on the continuing operation of our information technology and communications systems, especially our Horizon Information Technology System (“HITS”). We have experienced brief system failures in the past and may experience brief or substantial failures in the future. Any failure of our systems could result in interruptions in our service reducing our revenue and profits and
18
Table of Contents
damaging our brand. Some of our systems are not fully redundant, and our disaster recovery planning does not account for all eventualities. The occurrence of a natural disaster, or other unanticipated problems at our facilities at which we maintain and operate our systems could result in lengthy interruptions or delays in our shipping and integrated logistics services, especially HITS.
Our vessels could be arrested by maritime claimants, which could result in significant loss of earnings and cash flow.
Crew members, suppliers of goods and services to a vessel, shippers of cargo, lenders and other parties may be entitled to a maritime lien against a vessel for unsatisfied debts, claims or damages. In many jurisdictions, a claimant may enforce its lien by either arresting or attaching a vessel through foreclosure proceedings. Moreover, crew members may place liens for unpaid wages that can include significant statutory penalty wages if the unpaid wages remain overdue (e.g., double wages for every day during which the unpaid wages remain overdue). The arrest or attachment of one or more of our vessels could result in a significant loss of earnings and cash flow for the period during which the arrest or attachment is continuing.
We are susceptible to severe weather and natural disasters.
Our operations are vulnerable to disruption as a result of weather and natural disasters such as bad weather at sea, hurricanes, typhoons and earthquakes. Such events will interfere with our ability to provide the on-time scheduled service our customers demand resulting in increased expenses and potential loss of business associated with such events. In addition, severe weather and natural disasters can result in interference with our terminal operations, and may cause serious damage to our vessels, loss or damage to containers, cargo and other equipment and loss of life or physical injury to our employees. Terminals on the east coast of the continental U.S. and in the Caribbean are particularly susceptible to hurricanes and typhoons. In the past, our terminal in Puerto Rico was seriously damaged by a hurricane, resulting in damage to cranes and other equipment and closure of the facility. Earthquakes in Anchorage have also damaged our terminal facilities resulting in delay in terminal operations and increased expenses. Any such damage will not be fully covered by insurance.
We may face new competitors.
Other established or start-up shipping operators may enter our markets to compete with us for business.
Existing non-Jones Act qualified shipping operators whose container ships sail between ports in Asia and the U.S. west coast could add Hawaii or Alaska as additional stops on their sailing routes for non-U.S. originated or destined cargo. Shipping operators could also add Puerto Rico as a new stop on sailings of their vessels between the continental U.S. and ports in Europe, the Caribbean, and Latin America for non-U.S. originated or destined cargo. In addition, current or new U.S. citizen shipping operators may order the building of new vessels by U.S. shipyards and may introduce these U.S.-built vessels into Jones Act qualified service on one or more of our trade routes. For example, one of our competitors in the Hawaii market plans to introduce a combination container and roll-on/roll-off vessel during the second half of 2013. This vessel will serve the U.S. west coast to Hawaii trade lane on a fortnightly basis and will provide regularly scheduled calls to Kahului and Hilo for both roll-on/roll-off and container shipments. The container capacity of the vessel is expected to be 1,500 TEUs and the automobile capacity is expected to be 2,750 autos. These potential competitors may have access to financial resources substantially greater than our own. The entry of a new competitor on any of our trade routes could result in a significant increase in available shipping capacity that could have a material adverse effect on our business, financial condition, results of operations and cash flows.
We may face significant costs as the vessels currently in our fleet age.
We believe that each of the vessels we currently operate has an estimated useful life of approximately 45 years from the year it was built. As of the date hereof, the average age of our Jones Act vessels is approximately
19
Table of Contents
35 years. We expect to incur increasing costs to operate and maintain the vessels in good condition as they age. Eventually, these vessels will need to be replaced. We may not be able to replace our existing vessels with new vessels based on uncertainties related to costs, financing, timing and shipyard availability.
We may face unexpected substantial dry-docking costs for our vessels.
Our vessels are dry-docked periodically to comply with regulatory requirements and to effect maintenance and repairs, if necessary. The cost of such repairs at each dry-docking are difficult to predict with certainty and can be substantial. Our established processes have enabled us to make on average six dry-dockings per year over the last five years with a minimal impact on schedule. There are some years when we have more than the average of six dry-dockings annually. In addition, our vessels may have to be dry-docked in the event of accidents or other unforeseen damage. Our insurance may not cover all of these costs. Large unpredictable repair and dry-docking expenses could significantly decrease our profits.
Our certificate of incorporation limits the ownership of common stock by individuals and entities that are not U.S. citizens. This may affect the liquidity of our common stock and may result in non-U.S. citizens being required to disgorge profits, sell their shares at a loss or relinquish their voting, dividend and distribution rights.
Under applicable U.S. maritime laws, at least 75% of the outstanding shares of each class or series of our capital stock must be owned and controlled by U.S. citizens within the meaning of such laws. Certain provisions of our certificate of incorporation are intended to facilitate compliance with this requirement and may have an adverse effect on holders of shares of the common stock.
Under the provisions of our certificate of incorporation, any transfer, or attempted transfer, of any shares of our capital stock will be void if the effect of such transfer, or attempted transfer, would be to cause one or more non-U.S. citizens in the aggregate to own (of record or beneficially) shares of any class or series of our capital stock in excess of 19.9% of the outstanding shares of such class or series. To the extent such restrictions voiding transfers are effective, the liquidity or market value of the shares of common stock may be adversely impacted.
In the event such restrictions voiding transfers would be ineffective for any reason, our certificate of incorporation provides that if any transfer would otherwise result in the number of shares of any class or series of our capital stock owned (of record or beneficially) by non-U.S. citizens being in excess of 19.9% of the outstanding shares of such class or series, such transfer will cause such excess shares to be automatically transferred to a trust for the exclusive benefit of one or more charitable beneficiaries that are U.S. citizens. The proposed transferee will have no rights in the shares transferred to the trust, and the trustee, who is a U.S. citizen chosen by us and unaffiliated with us or the proposed transferee, will have all voting, dividend and distribution rights associated with the shares held in the trust. The trustee will sell such excess shares to a U.S. citizen within 20 days of receiving notice from us and distribute to the proposed transferee the lesser of the price that the proposed transferee paid for such shares and the amount received from the sale, and any gain from the sale will be paid to the charitable beneficiary of the trust.
These trust transfer provisions also apply to situations where ownership of a class or series of our capital stock by non-U.S. citizens in excess of 19.9% would be exceeded by a change in the status of a record or beneficial owner thereof from a U.S. citizen to a non-U.S. citizen, in which case such person will receive the lesser of the market price of the shares on the date of such status change and the amount received from the sale. In addition, under our certificate of incorporation, if the sale or other disposition of shares of common stock would result in non-U.S. citizens owning (of record or beneficially) in excess of 19.9% of the outstanding shares of common stock, the excess shares shall be automatically transferred to a trust for disposal by a trustee in accordance with the trust transfer provisions described above. As part of the foregoing trust transfer provisions, the trustee will be deemed to have offered the excess shares in the trust to us at a price per share equal to the
20
Table of Contents
lesser of (i) the market price on the date we accept the offer and (ii) the price per share in the purported transfer or original issuance of shares, as described in the preceding paragraph, or the market price per share on the date of the status change, that resulted in the transfer to the trust.
As a result of the above trust transfer provisions, a proposed transferee that is a non-U.S. citizen or a record or beneficial owner whose citizenship status change results in excess shares may not receive any return on its investment in shares it purportedly purchases or owns, as the case may be, and it may sustain a loss.
To the extent that the above trust transfer provisions would be ineffective for any reason, our certificate of incorporation provides that, if the percentage of the shares of any class or series of our capital stock owned (of record or beneficially) by non-U.S. citizens is known to us to be in excess of 19.9% for such class or series, we, in our sole discretion, shall be entitled to redeem all or any portion of such shares most recently acquired (as determined by our board of directors in accordance with guidelines that are set forth in our certificate of incorporation), by non-U.S. citizens, or owned (of record or beneficially) by non-U.S. citizens as a result of a change in citizenship status, in excess of such maximum permitted percentage for such class or series at a redemption price based on a fair market value formula that is set forth in our certificate of incorporation. Such excess shares shall not be accorded any voting, dividend or distribution rights until they have ceased to be excess shares, provided that they have not been already redeemed by us. As a result of these provisions, a stockholder who is a non-U.S. citizen may be required to sell its shares of common stock at an undesirable time or price and may not receive any return on its investment in such shares. Further, we may have to incur additional indebtedness, or use available cash (if any), to fund all or a portion of such redemption, in which case our financial condition may be materially weakened.
So that we may ensure our compliance with the applicable maritime laws, our certificate of incorporation permits us to require that any record or beneficial owner of any shares of our capital stock provide us from time to time with certain documentation concerning such owner’s citizenship and comply with certain requirements. These provisions include a requirement that every person acquiring, directly or indirectly, 5% or more of the shares of any class or series of our capital stock must provide us with specified citizenship documentation. In the event that a person does not submit such requested or required documentation to us, our certificate of incorporation provides us with certain remedies, including the suspension of the voting rights of such person’s shares of our capital stock and the payment of dividends and distributions with respect to those shares into an escrow account. As a result of non-compliance with these provisions, a record or beneficial owner of the shares of our common stock may lose significant rights associated with those shares.
In addition to the risks described above, the foregoing foreign ownership restrictions could delay, defer or prevent a transaction or change in control that might involve a premium price for our common stock or otherwise be in the best interest of our stockholders.
If non-U.S. citizens own more than 19.9% of our stock, we may not have the funds or the ability to redeem any excess shares and we could be forced to suspend our Jones Act operations.
Our certificate of incorporation contains provisions voiding transfers of shares of any class or series of our capital stock that would result in non-U.S. citizens, in the aggregate, owning in excess of 19.9% of the shares of such class or series. In the event that this transfer restriction would be ineffective, our certificate of incorporation provides for the automatic transfer of such excess shares to a trust specified therein. These trust provisions also apply to excess shares that would result from a change in the status of a record or beneficial owner of shares of our capital stock from a U.S. citizen to a non-U.S. citizen. In the event that these trust transfer provisions would also be ineffective, our certificate of incorporation permits us to redeem such excess shares. The per share redemption price may be paid, as determined by our Board of Directors, by cash, redemption notes, or warrants. However, we may not be able to redeem such excess shares for cash because our operations may not have generated sufficient excess cash flow to fund such redemption.
21
Table of Contents
If, for any reason, we are unable to effect such a redemption when such ownership of shares by non-U.S. citizens is in excess of 25.0% of such class or series, or otherwise prevent non-U.S. citizens in the aggregate from owning shares in excess of 25.0% of any such class or series, or fail to exercise our redemption right because we are unaware that such ownership exceeds such percentage, we will likely be unable to comply with applicable maritime laws. If all of the citizenship-related safeguards in our certificate of incorporation fail at a time when ownership of shares of any class or series of our stock is in excess of 25.0% of such class or series, we will likely be required to suspend our Jones Act operations. Any such actions by governmental authorities would have a severely detrimental impact on our results of operations.
We are subject to statutory and regulatory directives in the United States addressing homeland security concerns that may increase our costs and adversely affect our operations.
Various government agencies within the Department of Homeland Security (“DHS”), including the Transportation Security Administration, the U.S. Coast Guard, and U.S. Bureau of Customs and Border Protection, have adopted, and may adopt in the future, rules, policies or regulations or changes in the interpretation or application of existing laws, rules, policies or regulations, compliance with which could increase our costs or result in loss of revenue.
The Coast Guard’s maritime security regulations, issued pursuant to the Maritime Transportation Security Act of 2002 (“MTSA”), require us to operate our vessels and facilities pursuant to both the maritime security regulations and approved security plans. Our vessels and facilities are subject to periodic security compliance verification examinations by the Coast Guard. A failure to operate in accordance with the maritime security regulations or the approved security plans may result in the imposition of a fine or control and compliance measures, including the suspension or revocation of the security plan, thereby making the vessel or facility ineligible to operate. We are also required to audit these security plans on an annual basis and, if necessary, submit amendments to the Coast Guard for its review and approval. Failure to timely submit the necessary amendments may lead to the imposition of the fines and control and compliance measures mentioned above. Failure to meet the requirements of the maritime security regulations could have a material adverse effect on our results of operations.
DHS may adopt additional security-related regulations, including new requirements for screening of cargo and our reimbursement to the agency for the cost of security services. These new security-related regulations could have an adverse impact on our ability to efficiently process cargo or could increase our costs. In particular, our customers typically need quick shipping of their cargos and rely on our on-time shipping capabilities. If these regulations disrupt or impede the timing of our shipments, we may fail to meet the needs of our customers, or may increase expenses to do so.
Increased inspection procedures and tighter import and export controls could increase costs and disrupt our business.
Domestic container shipping is subject to various security, inspection, and related procedures, referred to herein as inspection procedures. Inspection procedures can result in the seizure of containers or their contents, delays in the loading, offloading, transshipment or delivery of containers and the levying of fines or other penalties.
We understand that, currently, only a small proportion of all containers delivered to the United States are physically inspected by U.S., state or local authorities prior to delivery to their destinations. The U.S. government, foreign governments, international organizations, and industry associations have been considering ways to improve and expand inspection procedures. There are numerous proposals to enhance the existing inspection procedures, which if implemented would likely affect shipping and integrated logistics companies such as us. Such changes could impose additional financial and legal obligations on us, including additional responsibility for physically inspecting and recording the contents of containers we are shipping. In
22
Table of Contents
addition, changes to inspection procedures could impose additional costs and obligations on our customers and may, in certain cases, render the shipment of certain types of cargo by container uneconomical or impractical. Any such changes or developments may have a material adverse effect on our business, financial condition and results of operations.
No assurance can be given that our insurance costs will not escalate.
Our protection and indemnity insurance (“P&I”) is provided by a mutual P&I club which is a member of the International Group of P&I clubs. As a mutual club, it relies on member premiums, investment reserves and income, and reinsurance to manage liability risks on behalf of its members.
Our coverage under the Longshore Act for U.S. Longshore and Harbor Workers compensation is provided by Signal Mutual Indemnity Association Ltd. Signal Mutual is a non-profit organization whose members pool risks of a similar nature to achieve long-term and stable insurance protection at cost. Signal Mutual is now the largest provider of Longshore benefits in the country. This program provides for first-dollar coverage without a deductible.
Increased investment losses, underwriting losses, or reinsurance costs could cause international marine insurance clubs to increase the cost of premiums, resulting not only in higher premium costs, but also higher levels of deductibles and self-insurance retentions.
Catastrophic losses and other liabilities could adversely affect our results of operations and such losses and liability may be beyond insurance coverage.
The operation of any oceangoing vessel carries with it an inherent risk of catastrophic maritime disaster, mechanical failure, collision, and loss of or damage to cargo. Also, in the course of the operation of our vessels, marine disasters, such as oil spills and other environmental mishaps, cargo loss or damage, and business interruption due to political or other developments, as well as maritime disasters not involving us, labor disputes, strikes and adverse weather conditions, could result in loss of revenue, liabilities or increased costs, personal injury, loss of life, severe damage to and destruction of property and equipment, pollution or environmental damage and suspension of operations. Damage arising from such occurrences may result in lawsuits asserting large claims.
Although we maintain insurance, including retentions and deductibles, at levels that we believe are consistent with industry norms against the risks described above, including loss of life, there can be no assurance that this insurance would be sufficient to cover the cost of damages suffered by us from the occurrence of all of the risks described above or the loss of income resulting from one or more of our vessels being removed from operation. We also cannot be assured that a claim will be paid or that we will be able to obtain insurance at commercially reasonable rates in the future. Further, if we are negligent or otherwise responsible in connection with any such event, our insurance may not cover our claim.
In the event that any of the claims arising from any of the foregoing possible events were assessed against us, all of our assets could be subject to attachment and other judicial process.
Our share price will fluctuate.
Stock markets in general and our common stock in particular have experienced significant price and volume volatility over the past year. The market price and trading volume of our common stock may continue to be subject to significant fluctuations due not only to general stock market conditions, but also to variability in the prevailing sentiment regarding our operations or business prospects, as well as potential further decline of our common stock due to margin calls on loans secured by pledges of our common stock.
23
Table of Contents
Environmental and Other Regulation
Our marine operations are subject to various federal, state and local environmental laws and regulations implemented principally by the United States Coast Guard (“Coast Guard”), Environmental Protection Agency (“EPA”), and the United States Department of Transportation (“DOT”), as well as related state regulatory agencies. These requirements generally govern the safe operations of our ships and pollution prevention in U.S. internal waters, the territorial sea, and the 200-mile exclusive economic zone of the United States.
The operation of our vessels is also subject to regulation under various international conventions adopted by the International Maritime Organization (“IMO”) that are implemented by the laws of domestic and foreign jurisdictions, and enforced by the Coast Guard and port state authorities in our non-U.S. ports of call. In addition, our vessels are required to meet construction, maintenance and repair standards established by the American Bureau of Shipping (“ABS”), Det Norske Veritas (“DNV”), IMO and/or the Coast Guard, as well as to meet operational, environmental, security, and safety standards and regulations presently established by the Coast Guard and IMO. The Coast Guard also licenses our seagoing officers and certifies our seamen.
Our marine operations are further subject to regulation by various federal agencies, including the Surface Transportation Board (“STB”), MARAD, the Federal Maritime Commission, the EPA, U.S. Customs and Border Protection, and the Coast Guard. These regulatory authorities have broad powers over operational safety, tariff filings of freight rates, service contracts, transfer or sale of our vessels, certain mergers, contraband, pollution prevention, financial reporting, and homeland, port and vessel security.
Our common and contract motor carrier operations are regulated by the STB and various state agencies. Our drivers also must comply with the safety and fitness regulations promulgated by the DOT, including certain regulations for drug and alcohol testing and hours of service. The ship’s officers and unlicensed crew members employed aboard our vessels must also comply with numerous safety and fitness regulations promulgated by the Coast Guard, the DOT, and the IMO, including certain regulations for drug testing and hours of service.
The United States Oil Pollution Act of 1990 and the Comprehensive Environmental Response, Compensation and Liability Act
The Oil Pollution Act of 1990 (“OPA”) was enacted in 1990 and established a comprehensive regulatory and liability regime designed to increase pollution prevention, ensure better spill response capability, increase liability for oil spills, and facilitate prompt compensation for cleanup and damages. OPA is applicable to owners and operators whose vessels trade with the United States or its territories or possessions, or whose vessels operate in the navigable waters of the United States (generally three nautical miles from the coastline) and the 200 nautical mile exclusive economic zone of the United States. Under OPA, vessel owners, operators and bareboat charterers are “responsible parties” and are jointly, severally and strictly liable (unless it is determined by the Coast Guard or a court of competent jurisdiction that the spill results solely from the act or omission of a third party, an act of God or an act of war) for removal costs and damages arising from discharges or threatened discharges of oil from their vessels up to their limits of liability, unless the limits are broken as described below. “Damages” are defined broadly under OPA to include:
| • | natural resources damages and the costs of assessment thereof; |
| • | damages for injury to, or economic losses resulting from the destruction of, real or personal property; |
| • | the net loss of taxes, royalties, rents, fees and profits by the United States government, and any state or political subdivision thereof; |
| • | lost profits or impairment of earning capacity due to property or natural resources damage; |
| • | the net costs of providing increased or additional public services necessitated by a spill response, such as protection from fire, safety or other hazards; and |
| • | the loss of subsistence use of natural resources. |
24
Table of Contents
Effective July 31, 2009, the OPA regulations were amended to increase the liability limits for responsible parties for non-tank vessels to $1,000 per gross ton or $854,400, whichever is greater. These limits of liability do not apply: (1) if an incident was proximately caused by violation of applicable federal safety, construction or operating regulations or by a responsible party’s gross negligence or willful misconduct, or (2) if the responsible party fails or refuses to report the incident, fails to provide reasonable cooperation and assistance requested by a responsible official in connection with oil removal activities, or without sufficient cause fails to comply with an order issued under OPA.
In 1980, the Comprehensive Environmental Response, Compensation and Liability Act (“CERCLA”) was adopted and is applicable to the discharge of hazardous substances (other than oil) whether on land or at sea. CERCLA also imposes liability similar to OPA and provides compensation for cleanup, removal and natural resource damages. Liability per vessel under CERCLA is limited to the greater of $300 per gross ton or $5 million, unless the incident is caused by gross negligence, willful misconduct, or a violation of certain regulations, in which case liability is unlimited.
OPA requires owners and operators of vessels to establish and maintain with the Coast Guard evidence of financial responsibility sufficient to meet their potential liabilities under the OPA. Effective July 1, 2009, the Coast Guard regulations requiring evidence of financial responsibility were amended to conform the OPA financial responsibility requirements to the July 2009 increases in liability limits. Current Coast Guard regulations require evidence of financial responsibility for oil pollution in the amount of $1,000 per gross ton or $854,400, whichever is greater, for non-tank vessels, plus the CERCLA liability limit of $300 per gross ton for hazardous substance spills. As a result of the Delaware River Protection Act, which was enacted by Congress in 2006, the OPA limits of liability must be adjusted not less than every three years to reflect significant increases in the Consumer Price Index.
Under the Coast Guard regulations, vessel owners and operators may evidence their financial responsibility through an insurance guaranty, surety bond, self-insurance, financial guaranty or other evidence of financial responsibility acceptable to the Coast Guard. Under OPA, an owner or operator of a fleet of vessels may demonstrate evidence of financial responsibility in an amount sufficient to cover the vessels in the fleet having the greatest maximum liability under OPA.
The Coast Guard’s regulations concerning Certificates of Financial Responsibility provide, in accordance with OPA, that claimants may bring suit directly against an insurer or guarantor that furnishes Certificates of Financial Responsibility. In the event that such insurer or guarantor is sued directly, it is prohibited from asserting any contractual defense that it may have had against the responsible party and is limited to asserting those defenses available to the responsible party and the defense that the incident was caused by the willful misconduct of the responsible party. OPA allows individual states to impose their own liability regimes, consistent with though more stringent than OPA, with regard to oil pollution incidents occurring within their boundaries, and some states have enacted legislation providing for unlimited liability for oil spills, as well as requirements for response and contingency planning and requirements for financial responsibility. We intend to comply with all applicable state regulations in the states where our vessels call.
OPA allows individual states to impose their own liability regimes with regard to oil pollution incidents occurring within their boundaries, and some states have enacted legislation providing for unlimited liability for oil spills as well as requirements for response and contingency planning and requirements for financial responsibility. We intend to comply with all applicable state regulations in the states where our vessels call.
We maintain Certificates of Financial Responsibility as required by the Coast Guard and various states for our vessels.
25
Table of Contents
In 2010, Congress enacted the Coast Guard Authorization Act of 2010, which contained provisions related to oil pollution prevention, including a provision that amended OPA to broaden the term “responsible party” to include owners of oil being transported in a tank vessel with a single hull after December 31, 2011. In 2011, Congress failed to enact any notable oil pollution legislation. However, it is expected that Congress will take up and introduce new spill legislation in 2012 as a result of lessons learned from the Deepwater Horizon incident in 2010 now that all of the significant investigation reports have been completed. If Congress passes oil spill legislation in 2012, we could be subject to greater potential liability or penalties if any of our vessels has an incident or we could be required to comply with other requirements thereby increasing our operating costs.
The Act to Prevent Pollution from Ships and MARPOL requirements for oil pollution prevention
The International Convention for the Prevention of Pollution from Ships, 1973, as modified by the Protocol of 1978 relating thereto (“MARPOL”), is the main international convention covering prevention of pollution of the marine environment by vessels from operational or accidental causes. It has been updated by amendments through the years and is implemented in the United States by the Act to Prevent Pollution from Ships. MARPOL has six specific annexes and Annex I governs oil pollution and Annex V governs garbage pollution.
Since the 1990s, the DOJ has been aggressively enforcing U.S. criminal laws against vessel owners, operators, managers, crewmembers, shoreside personnel, and corporate officers for actions related to violations of Annex I and Annex V, in particular. Prosecutions generally involve violations related to pollution prevention devices, such as the oily water separator, and include falsifying the Oil Record Book, the Garbage Record Book, obstruction of justice, false statements and conspiracy. Over the past 15 to 20 years, the DOJ has imposed significant criminal penalties in vessel pollution cases and the vast majority of such cases did not actually involve pollution in the United States, but rather efforts to conceal or cover up pollution that occurred in international waters. In certain cases, responsible shipboard officers and shoreside officials have been sentenced to prison. In addition, the DOJ has required defendants to implement a comprehensive environmental compliance plan (“ECP”).
On February 14, 2012, we plead guilty to two count of providing federal authorities with false vessel oil record-keeping entries on a containership in the U.S. west coast-Hawaii service. As part of our probation obligation, we have developed, adopted, and implemented an ECP. Should we face DOJ criminal prosecutions in the future, we could face significant criminal penalties and defense costs as well as costs associated with the implementation of an ECP.
The United States Clean Water Act
Enacted in 1972, the United States Clean Water Act (“CWA”) prohibits the discharge of “pollutants,” which includes oil or hazardous substances, into navigable waters of the United States and imposes civil and criminal penalties for unauthorized discharges. The CWA complements the remedies available under OPA and CERCLA discussed above.
The CWA also established the National Pollutant Discharge Elimination System (“NPDES”) permitting program, which governs discharges of pollutants into navigable waters of the United States. Pursuant to the NPDES permitting program, EPA issued a Vessel General Permit (“VGP”), which has been in effect since February 6, 2009, covering 26 types of discharges incidental to normal vessel operations. The VGP applies to U.S. and foreign-flag commercial vessels that are at least 79 feet in length, and therefore applies to our vessels.
The VGP requires vessel owners and operators to adhere to “best management practices” to manage the 26 listed discharge streams, including ballast water, that occur incidental to the normal operation of a vessel. Vessel owners and operators must implement various training, inspection, monitoring, record keeping, and reporting requirements, as well as corrective actions upon identification of any deficiency. Several states have specified significant, additional requirements in connection with state mandated CWA certifications relating to the VGP.
26
Table of Contents
On February 11, 2011, the EPA and the Coast Guard entered into a Memorandum of Understanding (“MOU”) outlining the steps the agencies will take to better coordinate efforts to implement and enforce the VGP. Under the MOU, the Coast Guard will identify and report to EPA detected VGP deficiencies as a result of its normal boarding protocols for U.S.-flag and foreign-flag vessels. However, EPA retains responsibility and enforcement authority to address VGP violations. We have filed a Notice of Intent to be covered by the VGP for each of our ships and have implemented its requirements. We have also filed and had certified by EPA the required one time report under the VGP. Failure to comply with the VGP may result in civil or criminal penalties. The current VGP expires on December 19, 2013. EPA published, on December 8, 2011, a draft VGP for public comment, which will replace the current VGP. Comments were due on the proposal by February 21, 2012. The draft VGP may result in additional requirements that could increase our operating costs.
The National Invasive Species Act
The United States National Invasive Species Act (“NISA”) was enacted in 1996 in response to growing reports of harmful organisms being released into United States waters through ballast water taken on by vessels in foreign ports. The Coast Guard adopted regulations under NISA in July 2004 that impose mandatory ballast water management practices for all vessels equipped with ballast water tanks entering United States waters. These requirements can be met by performing mid-ocean ballast exchange, by retaining ballast water on board the vessel, or by using environmentally sound ballast water treatment methods approved by the Coast Guard. Mid-ocean ballast exchange is the primary method for compliance with the Coast Guard regulations; alternative methods for ballast water treatment are still under development. Vessels that are unable to conduct mid-ocean ballast exchange due to voyage or safety concerns may discharge minimum amounts of ballast water in U.S. waters, provided that they comply with recordkeeping requirements and document the reasons they could not follow the required ballast water management requirements.
On August 28, 2009, the Coast Guard proposed to amend its regulations on ballast water management by establishing standards for the allowable concentration of living organisms in a vessel’s ballast water discharged in United States waters. As proposed, it would establish a two tier standard. Phase one would set the initial limits to match those set internationally by IMO in the Ballast Water Convention, which has not yet entered into force. A limited number of ballast water treatment technologies have been approved by other nations as enabling vessels to meet these discharge standards. However, tests done under Coast Guard auspices question the actual efficacy of these systems, and they will not, based simply on their approval by another nation, be automatically approved by the Coast Guard for use on U.S.-flag vessels. There are currently no systems approved for use on U.S. flag-vessels. In addition, the Coast Guard’s phase two standard would be more stringent and cannot be met using existing treatment technology. The Coast Guard requirements will be phased in over a several year period depending on a vessel’s ballast water capacity and dry-docking schedule. The Coast Guard’s interim final rule to implement this proposal was sent to the Office of Management and Budget for review on November 11, 2011. Final regulations are expected to be published in the first quarter of 2012. Upon entry into force of the IMO Ballast Water Convention, two of our vessels will be required to have a ballast water treatment system on board by their first survey date after January 1, 2015. All of our remaining vessels will be required to have an approved system on board by their first survey after January 1, 2016. Systems are available that will meet the IMO standards.
Both houses of Congress have proposed a number of bills to amend NISA, but it cannot be predicted which bill, if any, will be enacted into law.
In the absence of stringent federal standards, states have enacted legislation or regulations to address invasive species through ballast water and hull cleaning management, and permitting requirements, which in many cases have also become part of the state’s VGP certification. For instance, California requires vessels to comply with state ballast water discharge and hull fouling requirements. New York requires vessels to meet ballast water treatment standards by January 1, 2012 with technology that is not available today, but has granted extensions to this deadline until August 1, 2013. Other states may proceed with the enactment of similar requirements that could increase the costs of operating in state waters.
27
Table of Contents
The United States Clean Air Act and Air Emission Standards under MARPOL
In 1970, the United States Clean Air Act (as amended by the Clean Air Act Amendments of 1977 and 1990, the “CAA”) was enacted and required the EPA to promulgate standards applicable to emissions of volatile organic compounds and other air contaminants. The CAA also requires states to submit State Implementation Plans (“SIPs”), which are designed to attain national health-based air quality standards throughout the United States, including major metropolitan and/or industrial areas. Several SIPs regulate emissions resulting from vessel loading and unloading operations by requiring the installation of vapor control equipment. The EPA and some states have each proposed more stringent regulations of air emissions from propulsion and auxiliary engines on oceangoing vessels. For example, the California Air Resources Board (“CARB”) has published regulations requiring oceangoing vessels visiting California ports to reduce air pollution through the use of marine distillate fuels once they sail within 24 miles of the California coastline effective July 1, 2009. CARB expanded the boundaries of where these requirements apply and began enforcing these new requirements on December 1, 2011. More stringent fuel oil requirements for marine gas oil are scheduled to go into effect on August 1, 2012.
The state of California also began on January 1, 2010, implementing regulations on a phased in basis that require vessels to either shut down their auxiliary engines while in port in California and use electrical power supplied at the dock or implement alternative means to significantly reduce emissions from the vessel’s electric power generating equipment while it is in port. Generally, a vessel will run its auxiliary engines while in port in order to power lighting, ventilation, pumps, communication and other onboard equipment. The emissions from running auxiliary engines while in port may contribute to particulate matter in the ambient air. The purpose of the regulations is to reduce the emissions from a vessel while it is in port. The cost of reducing vessel emissions while in port may be substantial if we determine that we cannot use or the ports will not permit us to use electrical power supplied at the dock. Alternatively, the ports may pass the cost of supplying electrical power at the port to us, and we may incur additional costs in connection with modifying our vessels to use electrical power supplied at the dock.
Annex VI of MARPOL, addressing air emissions from vessels, came into force in the United States on January 8, 2009 and requires the use of low sulfur fuels worldwide in both auxiliary and main propulsion diesel engines on vessels. By July 1, 2010, amendments to MARPOL required all diesel engines on vessels built between 1990 and 2000 to meet a Nitrous Oxide (“NOx”) standard of 17.0g-NOx/kW-hr. On January 1, 2011 the NOx standard will be lowered to 14.4 g-NOx/kW-hr and on January 1, 2016 it will be further lowered to 3.4 g-NOx/kW-hr, for vessels operating in a designated Emission Control Area (“ECA”).
In addition, the current global sulfur cap of 4.5% sulfur was reduced to 3.5% effective January 1, 2012 and will be further reduced to as low as 0.5% sulfur in 2020. The recommendations made in connection with a MARPOL fuel availability study scheduled for 2018 at IMO may cause this date to slip to 2025. The current 1.0% maximum sulfur emissions permitted in designated ECAs around the world will be reduced to 0.1% sulfur on January 1, 2015. These sulfur limitations will be applied to all subsequently approved ECAs.
In addition, the EPA received approval of the IMO, in coordination with Environment Canada, to designate all waters, with certain limited exceptions, within 200 nautical miles of Hawaii and the U.S. and Canadian coasts as ECAs. The North American ECA will go into force on August 1, 2012 limiting the sulfur content in fuel that is burned as described above. Beginning in 2016, NOx after-treatment requirements become applicable in this ECA as well. Furthermore, on July 15, 2011, the IMO officially adopted amendments to MARPOL to designate certain waters around Puerto Rico and the U.S. Virgin Islands as the United States — Caribbean ECA, where stringent international emission standards will also apply to ships. For this area, the effective date of the first-phase fuel sulfur standard is January 2014, and the second phase begins in 2015. Stringent NOx engine standards begin in 2016.
With the adoption of the North American ECA, ships operating within 200 miles of the U.S. coast will be required to burn 1% sulfur content fuel oil as of August 1, 2012 (when the ECA goes into effect) and 0.1% sulfur content fuel oil as of January 1, 2015. Our 12 steamships cannot safely burn 0.1% fuel oil without extensive
28
Table of Contents
modification to or replacement of their boilers or fuel systems. It is not yet known if such a modification can be designed. EPA has received approval at IMO to exempt and has exempted steamships from the 0.1% sulfur content fuel oil requirement until 2020.
The Resource Conservation and Recovery Act
Our operations occasionally generate and require the transportation, treatment and disposal of both hazardous and non-hazardous solid wastes that are subject to the requirements of the United States Resource Conservation and Recovery Act (“RCRA”) or comparable international, state or local requirements. From time to time we arrange for the disposal of hazardous waste or hazardous substances at offsite disposal facilities. With respect to our marine operations, EPA has a longstanding policy that RCRA only applies after wastes are “purposely removed” from the vessel. As a general matter, with certain exceptions, vessel owners and operators are required to determine if their wastes are hazardous, obtain a generator identification number, comply with certain standards for the proper management of hazardous wastes, and use hazardous waste manifests for shipments to disposal facilities. The degree of RCRA regulation will depend on the amount of hazardous waste a generator generates in any given month. Moreover, vessel owners and operators may be subject to more stringent state hazardous waste requirements in those states where they land hazardous wastes. If such materials are improperly disposed of by third parties that we contract with, we may still be held liable for cleanup costs under applicable laws.
Endangered Species Regulation
The Endangered Species Act, federal conservation regulations and comparable state laws protect species threatened with possible extinction. Protection of endangered and threatened species may include restrictions on the speed of vessels in certain ocean waters and may require us to change the routes of our vessels during particular periods. For example, in an effort to prevent the collision of vessels with the North Atlantic right whale, federal regulations restrict the speed of vessels to ten knots or less in certain areas along the Atlantic Coast of the United States during certain times of the year. The reduced speed and special routing along the Atlantic Coast results in the use of additional fuel, which affects our results of operations.
Greenhouse Gas Regulation
In February 2005, the Kyoto Protocol to the United Nations Framework Convention on Climate Change (the “Kyoto Protocol”) entered into force. Pursuant to the Kyoto Protocol, countries that are parties to the Convention are required to implement national programs to reduce emissions of certain gases, generally referred to as greenhouse gases, which are suspected of contributing to global warming. In October 2007, the California Attorney General and a coalition of environmental groups petitioned the EPA to regulate greenhouse gas emissions from oceangoing vessels under the CAA. On July 11, 2008, the EPA published an advance notice for proposed rulemaking with regard to greenhouse gases and CO2 emissions from ships. These proposed rules are currently not coordinated with those under development by the United Nations Framework Convention on climate change or the IMO. Any passage of climate control legislation or other regulatory initiatives in the United States that restrict emissions of greenhouse gases could entail financial impacts on our operations that cannot be predicted with certainty at this time. The issue is being heavily debated within various international regulatory bodies, such as the IMO, as well, and climate control measures that affect shipping could also be implemented on an international basis potentially affecting our vessel operations.
Vessel Security Regulations
Following the terrorist attacks on September 11, 2001, there have been a variety of initiatives intended to enhance vessel security within the United States and internationally. On November 25, 2002, MTSA was signed into law. To implement certain portions of MTSA, in July 2003, the Coast Guard issued regulations requiring the implementation of certain security requirements aboard vessels operating in waters subject to the jurisdiction of
29
Table of Contents
the United States. Similarly, in December 2002, the IMO adopted amendments to the International Convention for the Safety of Life at Sea (“SOLAS”), known as the International Ship and Port Facilities Security Code (the “ISPS Code”), creating a new chapter dealing specifically with maritime security. The new chapter came into effect in July 2004 and imposes various detailed security obligations on vessels and port authorities. Among the various requirements under MTSA and/or the ISPS Code are:
| • | on-board installation of automatic information systems to enhance vessel-to-vessel and vessel-to-shore communications; |
| • | on-board installation of ship security alert systems; |
| • | the development of vessel and facility security plans; |
| • | the implementation of a Transportation Worker Identification Credential program; and |
| • | compliance with flag state security certification requirements. |
The Coast Guard regulations, intended to align with international maritime security standards, generally deem foreign-flag vessels to be in compliance with MTSA’s vessel security measures provided such vessels have on board a valid International Ship Security Certificate that attests to the vessel’s compliance with SOLAS security requirements and the ISPS Code. U.S.-flag vessels, however, must comply with all of the security measures required by MTSA, as well as SOLAS and the ISPS Code, if engaged in international trade. We believe that we have implemented the various security measures required by the MTSA, SOLAS and the ISPS Code.
| Item 1B. | Unresolved Staff Comments |
None.
| Item 2. | Properties |
We lease all of our facilities, including our terminal and office facilities located at each of the ports upon which our vessels call, as well as our central sales and administrative offices and regional sales offices. The following table sets forth the locations, descriptions, and square footage of our significant facilities as of the date hereof:
| September 30, | September 30, | |||||
Location | Description of Facility | Square Footage(1) | ||||
Anchorage, Alaska | Stevedoring building and various terminal and related property | 1,633,385 | ||||
Charlotte, North Carolina | Corporate headquarters | 28,900 | ||||
Chicago, Illinois | Regional sales office | 1,929 | ||||
Compton, California | Terminal supervision office and warehouse | 176,676 | ||||
Dominican Republic | Operations office | 1,500 | ||||
Dutch Harbor, Alaska | Office and various terminal and related property | 658,167 | ||||
Elizabeth, New Jersey | Terminal supervision and sales office | 3,151 | ||||
Honolulu, Hawaii | Terminal property and office | 52,168 | (2) | |||
Irving, Texas | Operations center | 51,989 | ||||
Jacksonville, Florida | Terminal supervision, sales office & warehousing | 15,943 | ||||
Kenilworth, New Jersey | Ocean shipping services office | 12,110 | ||||
Kodiak, Alaska | Office and various terminal and related property | 265,232 | ||||
Oakland, California | Office and various terminal and related property | 247,732 | ||||
Renton, Washington | Regional sales office | 5,162 | ||||
San Juan, Puerto Rico | Office and various terminal and related property | 3,256,404 | ||||
Sparks, Nevada | Warehousing | 20,000 | ||||
Tacoma, Washington | Office and various terminal and related property | 797,348 | ||||
| (1) | Square footage for marine terminal facilities excludes common use areas used by other terminal customers and us. |
| (2) | Excludes 1,647,952 square feet of terminal property, which we have the option to use and pay for on an as-needed basis. |
30
Table of Contents
| Item 3. | Legal Proceedings |
Antitrust Matters
On April 17, 2008, we received a grand jury subpoena and search warrant from the United States District Court for the Middle District of Florida seeking information regarding an investigation by the Antitrust Division of the DOJ into possible antitrust violations in the domestic ocean shipping business. On February 23, 2011, we entered into a plea agreement with the DOJ, and the Court has entered judgment accepting our plea agreement and has imposed a fine of $15.0 million payable over five years without interest. The first $1.0 million of the fine was paid in April 2011, the second $1.0 million was paid in March 2012, and we must make payments of $2.0 million on or before March 24, 2013, $3.0 million on or before March 24, 2014, $4.0 million on or before March 24, 2015, and $4.0 million on or before March 21, 2016. The plea agreement provides that we will not face additional charges relating to the Puerto Rico tradelane. In addition, the plea agreement provides that we will not face any additional charges in connection with the Alaska trade, and the DOJ has indicated that we are not a target or subject of any Hawaii or Guam aspects of its investigation.
Subsequent to the commencement of the DOJ investigation, thirty-two class action lawsuits on behalf of direct purchasers of ocean shipping services in the Puerto Rico tradelane were consolidated into a single multidistrict litigation (“MDL”) proceeding in the District of Puerto Rico. On June 11, 2009, we entered into a settlement agreement with the named plaintiff class representatives in the Puerto Rico MDL. Under the settlement agreement, we paid $20.0 million and agreed to provide a base-rate freeze to class members who elect such freeze in lieu of a cash payment.
Some class members elected to opt-out of the settlement. We and attorneys representing those shippers who (i) opted out of the Puerto Rico direct purchaser settlement and (ii) indicated an intention to pursue an antitrust claim against us relating to the Puerto Rico tradelane, entered into a settlement agreement, dated November 23, 2011. Pursuant to the terms of the settlement agreement, we paid $5.8 million and have agreed to make payments of $4.0 million on each of June 30, 2012 and December 24, 2012.
Twenty-five class action lawsuits relating to ocean shipping services in the Hawaii and Guam tradelanes were consolidated into a MDL proceeding in the Western District of Washington. We filed a motion to dismiss the claims in the Hawaii and Guam MDL, and the United States District Court for the Western District of Washington dismissed the plaintiffs’ complaint and amended complaint. Subsequently, the Court of Appeals affirmed the Court’s decision to dismiss the amended complaint.
One class action lawsuit relating to the Alaska tradelane is pending in the District of Alaska. We and the class plaintiffs have agreed to stay the Alaska litigation, and we intend to vigorously defend against the purported class action lawsuit in Alaska.
In addition, on July 9, 2008, a complaint was filed by Caribbean Shipping Services, Inc. in the Circuit Court, 4th Judicial Circuit in and for Duval County, Florida, against us and other domestic shipping carriers alleging price-fixing in violation of the Florida Antitrust Act and the Florida Deceptive and Unlawful Trade Practices Act. The complaint sought treble damages, injunctive relief, costs and attorneys’ fees. On October 31, 2011, the plaintiff dismissed its complaint against us.
Environmental Matters
The U.S. Coast Guard and the offices of the U.S. Attorney for the Northern and Central Districts of California investigated the use of one of our vessel’s oily water separator and related oil record bookkeeping on that vessel. We previously recorded provisions in our Consolidated Statement of Operations of $1.5 million relating to this contingency. On January 27, 2012, we entered into an agreement with the DOJ and the Court has entered judgment accepting our plea agreement. We pleaded guilty to two counts of providing federal authorities with false vessel oil record bookkeeping entries, and agreed to pay a fine of $1.0 million and donate an additional
31
Table of Contents
$0.5 million to the National Fish & Wildlife Foundation for environmental community service programs. The donation of $0.5 million is required to be paid on or before April 13, 2012, and the $1.0 million fine will be paid in $0.5 million installments due on or before January 27, 2013 and January 27, 2014, respectively.
Other Matters
On February 21, 2012, HLPR received a notice of alleged violation from the United States Department of Agriculture (“USDA”) relating to the sale of meat that was transported by us and eventually sold to a third party in Puerto Rico in the spring of 2009. We are investigating this matter and intend to cooperate fully with the USDA.
We received an administrative subpoena from the Department of Defense (“DOD”) for documents relating to an investigation involving fuel surcharges that freight forwarders may have improperly charged to the DOD. We are cooperating with the government with respect to this matter.
In the ordinary course of business, from time to time, we become involved in various legal proceedings. These relate primarily to claims for loss or damage to cargo, employees’ personal injury claims, and claims for loss or damage to the person or property of third parties. We generally maintain insurance, subject to customary deductibles or self-retention amounts, and/or reserves to cover these types of claims. We also, from time to time, become involved in routine employment-related disputes and disputes with parties with which we have contractual relations.
| Item 4. | Mine Safety Disclosures |
Not applicable.
32
Table of Contents
Part II
| Item 5. | Market for Registrant’s Common Equity, Related Stockholder Matters and Issuer Purchases of Equity Securities |
On October 13, 2011, we received notice from the NYSE that trading in our common stock would be suspended on October 20, 2011, and it commenced suspension procedures with respect to our common stock due to our failure to satisfy the NYSE’s continued listing standards. On October 20, 2011, our common stock began trading on the over-the-counter (“OTC”) market under a new stock symbol, HRZL. Our common stock was removed from listing on the NYSE and a Form 25 was filed on March 1, 2012.
At a special meeting of our stockholders held on December 2, 2011, our stockholders approved an amendment to our certificate of incorporation effecting a reverse stock split. On December 7, 2011, the Company filed its restated certificate of incorporation to, among other things, effect the 1-for-25 reverse stock split. In connection with the reverse stock split, stockholders received one share of common stock for every 25 shares of common stock held at the effective time. The stock prices and dividends listed below reflect the reverse stock split.
As of March 19, 2012, there were approximately 36 holders of record of the Common Stock. The following table sets forth the intraday high and low sales price of the Company’s common stock for the fiscal periods presented.
2012 | High | Low | Cash Dividend Declared | |||||||||
First Quarter (through March 19, 2012) | $ | 8.50 | $ | 2.05 | $ | — | ||||||
2011 | High | Low | Cash Dividend Declared | |||||||||
First Quarter | $ | 147.75 | $ | 80.75 | $ | — | ||||||
Second Quarter | $ | 81.00 | $ | 20.75 | $ | — | ||||||
Third Quarter | $ | 38.75 | $ | 8.75 | $ | — | ||||||
Fourth Quarter | $ | 12.00 | $ | 2.50 | $ | — | ||||||
2010 | High | Low | Cash Dividend Declared | |||||||||
First Quarter | $ | 163.50 | $ | 92.00 | $ | 1.25 | ||||||
Second Quarter | $ | 152.25 | $ | 95.00 | $ | 1.25 | ||||||
Third Quarter | $ | 124.25 | $ | 91.25 | $ | 1.25 | ||||||
Fourth Quarter | $ | 119.25 | $ | 88.25 | $ | 1.25 | ||||||
During the fourth quarter of 2011, there were no purchases of shares of the Company’s common stock, by or on behalf of the Company or any “affiliated purchaser” as defined by Rule 10b-18(a)(3) of the Securities Exchange Act of 1934.
Equity Compensation Plan Information
The information required by this item will be included in the Company’s proxy statement to be filed for the Annual Meeting of Stockholders to be held on June 7, 2012, and is incorporated herein by reference.
33
Table of Contents
Total Return Comparison Graph
The below graph compares the cumulative total shareholder return of the public common stock of Horizon Lines, Inc. to the cumulative total returns of the Dow Jones U.S. Industrial Transportation Index and the S&P 500 Index. Cumulative total returns assume reinvestment of dividends.
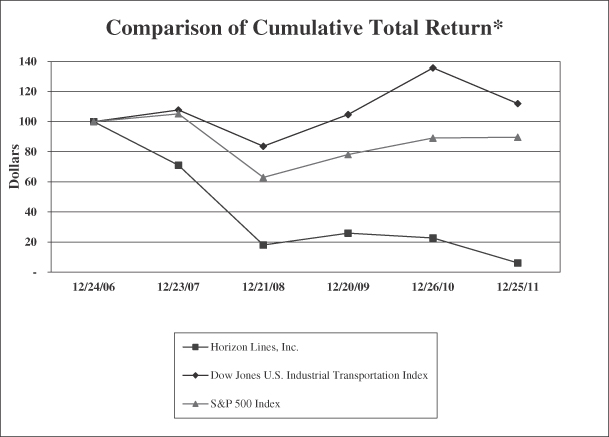
Notwithstanding anything to the contrary set forth in any of our filings under the Securities Act of 1933, as amended, or the Securities Exchange Act of 1934, as amended, that might incorporate other filings with the Securities and Exchange Commission, including this annual report on Form 10-K, in whole or in part, the Total Return Comparison Graph shall not be deemed incorporated by reference into any such filings.
| * | Comparison graph is based upon $100 invested in the given average or index at the close of trading on December 23, 2006 and $100 invested in the Company’s stock by the opening bell on December 24, 2006, as well as the reinvestment of dividends. |
| September 30, | September 30, | September 30, | September 30, | September 30, | September 30, | |||||||||||||||||||
| 12/24/2006 | 12/23/2007 | 12/21/2008 | 12/20/2009 | 12/26/2010 | 12/25/2011 | |||||||||||||||||||
Horizon Lines, Inc. | 100.00 | 71.05 | 17.98 | 25.90 | 22.66 | 6.07 | ||||||||||||||||||
Dow Jones U.S. Industrial Transportation Index | 100.00 | 107.78 | 83.67 | 104.73 | 135.77 | 112.03 | ||||||||||||||||||
S&P 500 Index | 100.00 | 105.22 | 62.94 | 78.15 | 89.08 | 89.69 | ||||||||||||||||||
34
Table of Contents
| Item 6. | Selected Financial Data |
The five year selected financial data below should be read in conjunction with “Management’s Discussion and Analysis of Financial Condition and Results of Operations,” included in this Form 10-K, and our consolidated financial statements and the related notes appearing in Item 15 of this Form 10-K.
We have a 52- or 53-week fiscal year (every sixth or seventh year) that ends on the Sunday before the last Friday in December. Fiscal year 2010 consisted of 53 weeks and each of the other years presented below consisted of 52 weeks.
Selected Financial Data is as follows (in thousands, except share and per share data):
| September 30, | September 30, | September 30, | September 30, | September 30, | ||||||||||||||||
| Fiscal Years Ended | ||||||||||||||||||||
| Dec. 25, 2011 | Dec. 26, 2010 | Dec. 20, 2009 | Dec. 21, 2008 | Dec. 23, 2007 | ||||||||||||||||
Statement of Operations Data: | ||||||||||||||||||||
Operating revenue | $ | 1,026,164 | $ | 1,000,055 | $ | 979,352 | $ | 1,113,616 | $ | 1,093,192 | ||||||||||
Legal settlements(1) | (5,483 | ) | 32,270 | 20,000 | — | — | ||||||||||||||
Goodwill impairment(2) | 115,356 | — | — | — | — | |||||||||||||||
Impairment of assets | 2,997 | 2,655 | 1,867 | 6,030 | — | |||||||||||||||
Restructuring costs | — | 1,843 | 747 | 3,012 | — | |||||||||||||||
Operating (loss) income | (97,856 | ) | 4,894 | 24,426 | 54,414 | 99,041 | ||||||||||||||
Interest expense, net | 55,677 | 40,117 | 38,036 | 39,923 | 43,567 | |||||||||||||||
(Gain) loss on modification/early extinguishment of debt | (16,017 | ) | — | 50 | — | 38,546 | ||||||||||||||
Gain on change in value of debt conversion features | (84,480 | ) | — | — | — | — | ||||||||||||||
Income tax expense (benefit)(3) | 126 | 324 | 10,573 | (4,152 | ) | (15,152 | ) | |||||||||||||
Net (loss) income from continuing operations | (53,194 | ) | (35,574 | ) | (24,251 | ) | 18,705 | 32,000 | ||||||||||||
Net (loss) income from discontinued operations(4) | (176,223 | ) | (22,395 | ) | (7,021 | ) | (21,298 | ) | (5,175 | ) | ||||||||||
|
|
|
|
|
|
|
|
|
| |||||||||||
Net (loss) income | $ | (229,417 | ) | $ | (57,969 | ) | $ | (31,272 | ) | $ | (2,593 | ) | $ | 26,825 | ||||||
Basic net (loss) income per share: | ||||||||||||||||||||
Continuing operations | $ | (36.33 | ) | $ | (29.01 | ) | $ | (20.06 | ) | $ | 15.45 | $ | 24.00 | |||||||
Discontinued operations | (120.37 | ) | (18.27 | ) | (5.81 | ) | (17.59 | ) | (3.88 | ) | ||||||||||
|
|
|
|
|
|
|
|
|
| |||||||||||
Basic net (loss) income per share | $ | (156.70 | ) | $ | (47.28 | ) | $ | (25.87 | ) | $ | (2.14 | ) | $ | 20.12 | ||||||
Diluted net (loss) income per share: | ||||||||||||||||||||
Continuing operations | $ | (36.33 | ) | $ | (29.01 | ) | $ | (20.06 | ) | $ | 15.32 | $ | 23.61 | |||||||
Discontinued operations | (120.37 | ) | (18.27 | ) | (5.81 | ) | (17.44 | ) | (3.82 | ) | ||||||||||
|
|
|
|
|
|
|
|
|
| |||||||||||
Diluted net (loss) income per share | $ | (156.70 | ) | $ | (47.28 | ) | $ | (25.87 | ) | $ | (2.12 | ) | $ | 19.79 | ||||||
Number of shares used in calculations(5): | ||||||||||||||||||||
Basic | 1,463,535 | 1,225,730 | 1,209,188 | 1,211,143 | 1,333,103 | |||||||||||||||
Diluted | 1,463,535 | 1,225,730 | 1,209,188 | 1,220,927 | 1,354,593 | |||||||||||||||
Cash dividends declared | $ | — | $ | 6,281 | $ | 13,397 | $ | 13,273 | $ | 14,653 | ||||||||||
Cash dividends declared per common share(5) | $ | — | $ | 5.00 | $ | 11.00 | $ | 11.00 | $ | 11.00 | ||||||||||
Balance Sheet Data: | ||||||||||||||||||||
Cash | $ | 21,147 | $ | 2,751 | $ | 6,419 | $ | 5,487 | $ | 6,276 | ||||||||||
Total assets | 639,809 | 785,776 | 818,510 | 872,629 | 920,886 | |||||||||||||||
Total debt, including capital lease obligations | 515,848 | 516,323 | 514,855 | 532,811 | 532,108 | |||||||||||||||
Long term debt, including capital lease obligations, net of current portion(6) | 509,741 | 7,530 | 496,105 | 526,259 | 525,571 | |||||||||||||||
Stockholders’ (deficiency) equity(7) | (165,986 | ) | 39,792 | 101,278 | 136,836 | 183,409 | ||||||||||||||
Other Financial Data: | ||||||||||||||||||||
EBITDA(7) | $ | 60,868 | $ | 63,444 | $ | 81,546 | $ | 115,434 | $ | 125,004 | ||||||||||
Capital expenditures | 15,111 | 15,991 | 9,750 | 29,314 | 21,288 | |||||||||||||||
Vessel dry-docking payments | 12,547 | 19,110 | 14,696 | 21,414 | 16,815 | |||||||||||||||
Cash flows (used in) provided by: | ||||||||||||||||||||
Operating activities | (11,452 | ) | 53,441 | 62,991 | 98,167 | 74,834 | ||||||||||||||
Investing activities | (12,837 | ) | (14,437 | ) | (8,535 | ) | (34,844 | ) | (24,733 | ) | ||||||||||
Financing activities | 93,978 | (25,119 | ) | (44,753 | ) | (51,319 | ) | (83,023 | ) | |||||||||||
35
Table of Contents
| (1) | We entered into a plea agreement, dated February 23, 2011, with the United States of America, under which we agreed to pay a fine of $45.0 million over five years without interest. On April 28, 2011, the U.S. District Court for the District of Puerto Rico amended the fine imposed on us by reducing the amount from $45.0 million to $15.0 million. We recorded a charge during the year ended December 26, 2010, of $30.0 million, which represents the present value of the expected installment payments. During the second quarter of 2011, we reversed $19.2 million of the $30.0 million charge recorded during the year ended December 26, 2010, related to the reduction in this legal settlement. In November 2011, we entered into a settlement agreement with all of the remaining significant shippers who opted out of the Puerto Rico direct purchaser antitrust class action settlement. We recorded a charge of $12.7 million during the fourth quarter of 2011, which represents the present value of the $13.8 million in installment payments. The year ended December 20, 2009, includes a $20.0 million charge for the settlement of the Puerto Rico MDL. In addition, the year ended December 26, 2010, includes a charge of $1.8 million for settlement of the investigation by the Puerto Rico office of Monopolistic Affairs and the lawsuit filed by the Commonwealth of Puerto Rico and the class action lawsuit in the indirect purchasers’ case. In January 2012, we entered into an agreement with the U.S. Department of Justice and pled guilty to two counts of providing federal authorities with false vessel oil record-keeping entries. Pursuant to the agreement and judgment entered by the United States District Court for the Northern District of California, we agreed to pay a fine of $1.0 million and donate an additional $0.5 million to the National Fish & Wildlife Foundation for environmental community service programs. Based on our best estimate at the time, we recorded a charge of $0.5 million related to this investigation during the year ended December 26, 2010. We recorded an additional $1.0 million during the year ended December 25, 2011. |
| (2) | During the third quarter of 2011, due to qualitative and quantitative indicators including the expected shutdown of the FSX service and a deterioration in earnings, we reviewed goodwill for impairment. A discounted cash flow model was used to derive the fair value of the reporting unit. The step one analysis indicating that the carrying value of the reporting unit exceeds the fair value of the reporting unit resulted in the need to perform step two. Our step two analysis indicates that the fair value of long term assets, including property, plant, and equipment, and customer contracts, exceeds book value. Thus, the goodwill impairment is due to both the deterioration in earnings as well as the fair value of certain of our underlying assets being in excess of their book value. As such, we recorded a $115.4 million goodwill impairment charge during the year ended December 25, 2011. |
| (3) | During the second quarter of 2009, we determined that it was unclear as to the timing of when we will generate sufficient taxable income to realize our deferred tax assets. Accordingly, we recorded a full valuation allowance against our deferred tax assets. |
| (4) | During the third quarter of 2011, we began a review of strategic alternatives for our FSX service. As a result of several factors, including: 1) the projected continuation of volatile trans-Pacific freight rates, 2) high fuel prices, and 3) operating losses, we decided to discontinue the FSX service. As a result, the FSX service has been classified as discontinued operations in all periods presented. During the 4th quarter of 2010, we decided to discontinue our logistics operations and determined that as a result of several factors, including: 1) the historical operating losses within the logistics operations, 2) the projected continuation of operating losses and 3) focus on the recently commenced international shipping activities, we would begin exploring the sale of our logistics operations. We reclassified our logistics operations as discontinued operations in all periods presented, and the logistics operations were transferred during the second quarter of 2011. |
| (5) | On December 7, 2011, we filed our restated certificate of incorporation to, among other things, effect a 1-for-25 reverse stock split. All prior periods presented have been adjusted to reflect the impact of this reverse stock split, including the impact on basic and diluted weighted-average shares and dividends declared per share. |
| (6) | On March 28, 2011, we expected that we would experience a covenant default under the indenture related to our Notes and would have had until May 21, 2011, to obtain a waiver from the holders of the old notes. Due to cross default provisions, we classified our obligations under the old notes and senior credit facility as current liabilities in the accompanying Consolidated Balance Sheet as of December 26, 2010. Noncompliance with these financial covenants constituted an event of default, which could have resulted in acceleration of maturity. None of the indebtedness under the Senior Credit Facility or Notes was accelerated prior to completion of a comprehensive refinancing on October 5, 2011. |
| (7) | EBITDA is defined as net income plus net interest expense, income taxes, depreciation and amortization. We believe that in addition to GAAP based financial information, EBITDA and Adjusted EBITDA are meaningful disclosures for the following reasons: (i) EBITDA and Adjusted EBITDA are components of the measure used by our board of directors and management team to evaluate our operating performance, (ii) EBITDA and Adjusted EBITDA are components of the measure used by our management team to make day-to-day operating decisions, (iii) EBITDA and Adjusted EBITDA are components of the measure used by our management to facilitate internal comparisons to competitors’ results and the marine container shipping and logistics industry in general and (iv) the payment of discretionary bonuses to certain members of our management is contingent upon, among other things, the satisfaction by Horizon Lines of certain targets, which contain EBITDA and Adjusted EBITDA as components. We acknowledge that there are limitations when using EBITDA and Adjusted EBITDA. EBITDA and Adjusted EBITDA are not recognized terms under GAAP and do not purport to be an alternative to net income as a measure of operating performance or to cash flows from operating activities as a measure of liquidity. Additionally, EBITDA and Adjusted EBITDA are not intended to be a measure of free cash flow for management’s discretionary use, as it does not consider certain cash requirements such as tax payments and debt service requirements. Because all companies do not use identical calculations, this presentation of |
36
Table of Contents
| EBITDA and Adjusted EBITDA may not be comparable to other similarly titled measures of other companies. The EBITDA amounts presented below contain certain charges that our management team excludes when evaluating our operating performance, for making day-to-day operating decisions and that have historically been excluded from EBITDA to arrive at Adjusted EBITDA when determining the payment of discretionary bonuses. A reconciliation of net (loss) income to EBITDA and Adjusted EBITDA is included below (in thousands): |
| Year Ended Dec. 25, 2011 | Year Ended Dec. 26, 2010 | Year Ended Dec. 20, 2009 | Year Ended Dec. 21, 2008 | Year Ended Dec. 23, 2007 | ||||||||||||||||
Net (loss) income | $ | (229,417 | ) | $ | (57,969 | ) | $ | (31,272 | ) | $ | (2,593 | ) | $ | 26,825 | ||||||
Net (loss) income from discontinued operations | (176,223 | ) | (22,395 | ) | (7,021 | ) | (21,298 | ) | (5,175 | ) | ||||||||||
|
|
|
|
|
|
|
|
|
| |||||||||||
Net (loss) income from continuing operations | (53,194 | ) | (35,574 | ) | (24,251 | ) | 18,705 | 32,000 | ||||||||||||
Interest expense, net | 55,677 | 40,117 | 38,036 | 39,923 | 43,567 | |||||||||||||||
Income tax expense (benefit) | 126 | 324 | 10,573 | (4,152 | ) | (15,152 | ) | |||||||||||||
Depreciation and amortization | 58,259 | 58,577 | 57,188 | 60,958 | 64,589 | |||||||||||||||
|
|
|
|
|
|
|
|
|
| |||||||||||
EBITDA | 60,868 | 63,444 | 81,546 | 115,434 | 125,004 | |||||||||||||||
Goodwill impairment | 115,356 | — | — | — | — | |||||||||||||||
Department of Justice antitrust investigation costs | 4,480 | 5,243 | 12,192 | 10,711 | — | |||||||||||||||
Other severance charges | 3,470 | 542 | 306 | 765 | — | |||||||||||||||
Impairment charge | 2,997 | 2,655 | 1,867 | 6,030 | — | |||||||||||||||
Legal settlements and contingencies. | (5,483 | ) | 32,270 | 20,000 | — | — | ||||||||||||||
(Gain) loss on modification/ extinguishment of debt and other refinancing costs | (15,112 | ) | — | 50 | — | 38,546 | ||||||||||||||
Gain on change in value of debt conversion features | (84,480 | ) | — | — | — | — | ||||||||||||||
Restructuring charge | — | 1,843 | 747 | 3,012 | — | |||||||||||||||
|
|
|
|
|
|
|
|
|
| |||||||||||
Adjusted EBITDA | $ | 82,096 | $ | 105,997 | $ | 116,708 | $ | 135,952 | $ | 163,550 | ||||||||||
|
|
|
|
|
|
|
|
|
| |||||||||||
37
Table of Contents
| Item 7. | Management’s Discussion and Analysis of Financial Condition and Results of Operations |
The following discussion and analysis of our consolidated financial condition and results of operations should be read in conjunction with Selected Consolidated and Combined Financial Data and our annual audited consolidated financial statements and related notes thereto included elsewhere in this Form 10-K. The following discussion includes forward-looking statements that involve certain risks and uncertainties. For additional information regarding forward looking statements, see the Safe Harbor Statement on page (i) of this Form 10-K.
Recent Developments
Refinancing
On October 5, 2011, we completed a comprehensive refinancing. The refinancing included: (a) the exchange of $327.8 million in aggregate principal amount of our 4.25% Convertible Senior Notes due 2012 (the “4.25% Notes”) for 1.0 million shares of our common stock, warrants to purchase 1.0 million shares of our common stock, at a conversion price of $0.01 per common share, $178.8 million in aggregate principal amount of 6.00% Series A Convertible Senior Secured Notes due 2017 (the “Series A Notes”) and $99.3 million in aggregate principal amount of 6.00% Series B Mandatorily Convertible Senior Secured Notes (the “Series B Notes”), (b) the issuance of $225.0 million aggregate principal amount of First-Lien Notes, (c) the issuance of $100.0 million of Second-Lien Notes, and (d) the repayment of $193.8 million in existing borrowings under our Senior Credit Facility. We also entered into a new $100.0 million asset-based revolving credit facility (the “New ABL Facility”).
Mandatory Conversion of Series B Notes
Under the terms of our comprehensive refinancing completed on October 5, 2011, on January 4, 2012, approximately $49.7 million of the Series B Notes were mandatorily converted into shares of common stock or warrants. The Series B Notes were converted at a conversion rate of 54.7196 shares of common stock (reflecting the 1-for-25 reverse stock split of our common stock effective December 7, 2011) per $1,000 principal amount of Series B Notes. Approximately $18.5 million of the Series B Notes were converted into 1.0 million shares of common stock with the remainder being converted into warrants exercisable into 1.7 million shares of common stock. The distribution of common stock and warrants was based upon the U.S. citizenship verifications of the holders of the Series B Notes.
Conversion of Remaining Series A and Series B Notes
On March 27, 2012, we announced that we had signed restructuring support agreements with more than 96% of our noteholders to further deleverage our balance sheet in connection with and contingent upon a restructuring of the vessel charter obligations related to our discontinued trans-Pacific service. The restructuring support agreements provide, among other things, that substantially all of the remaining $228.4 million of our Series A and Series B Notes will be converted into 90% of our stock, or warrants for non-U.S. citizens (subject to limited equity retention to existing equity holders on terms to be agreed, and to dilution for a management incentive plan), as described below. The remaining 10% of our common stock would be available in connection with the restructuring of our obligations related to the vessels formerly used in the FSX service pursuant to the Global Termination Agreement, as described above. To that end, the conversion of the Series A and Series B Notes was contingent upon a number of conditions, including the restructuring of our charter obligations with respect to the vessels formerly used in the FSX service.
On April 9, 2012, pursuant to the restructuring support agreements and following the completion of the consent solicitations described below, 99% of the holders of our Series A Notes and 98.5% of the holders of our Series B Notes submitted irrevocable conversion notices to us. Upon completion of the conversion process, we expect, on an as-converted basis, holders of Series A Notes to hold approximately 81% of our outstanding shares and holders of Series B Notes to hold approximately 3% of our outstanding shares. In addition, on an
38
Table of Contents
as-converted basis, we expect SFL will hold approximately 10% of our outstanding shares (pursuant to the Global Termination Agreement described below). As a result, we issued common shares and warrants equivalent to 86,490,929 shares on an as-converted basis. The warrants contain a conversion price of $0.01 per common share. The remaining 6% of our outstanding shares will be held by existing share and warrant holders. The remaining 7.5 million shares, or approximately 8% of our authorized share capital, will be reserved for future management incentive plans.
The conversion of the Series A Notes and the Series B Notes could have a material impact on our 2012 financial statements. Until such time we are able to obtain a definitive allocation between shares of our common stock and warrants to purchase shares of our common stock, we are unable to determine the potential impact on earnings per share.
Consent Solicitations
As part of the overall agreement under the restructuring support agreements described above, on March 29, 2012, we launched consent solicitations to make certain amendments to the indentures which govern the First Lien Notes, Second Lien Notes, and the Series A Notes and Series B Notes. These amendments provided (i) for the issuance of $40.0 million in aggregate principal amount of Second Lien Notes to SFL pursuant to the Global Termination Agreement, subordinated to the existing Second Lien Notes under certain circumstances, as described above, (ii) for us to pay-in-kind (PIK) the interest payments on the Second Lien Notes, the Series A Notes and the Series B Notes, (iii) that SFL may purchase all other outstanding Second Lien Notes from the holders (at a purchase price equal to the principal amount of the Second Lien Notes, plus accrued and unpaid interest) under circumstances where, among other things, we commence liquidation, administration, or receivership or other similar proceedings and (iv) for Series B Note holders to convert their notes at their option.
On April 9, 2012, we obtained the requisite consents under each of the consent solicitations and entered into supplemental indentures with the U.S. Bank National Association, the trustee for the Notes, to amend the indentures pursuant to the consent solicitations. We concurrently obtained an amendment and acknowledgment from the lenders under our ABL credit agreement, among other things, to clarify that the amendments to the indentures which govern the First Lien Notes, Second Lien Notes, and the Series A Notes and Series B Notes and the issuance of the additional $40.0 million of Second Lien Notes are permitted under the ABL credit agreement.
Five Star Express Service
During the third quarter of 2011, we began a review of strategic alternatives for our Five Star Express (“FSX”) service. As a result of several factors, including the projected continuation of volatile trans-Pacific freight rates, high fuel prices, and operating losses, we decided to discontinue our FSX service. On October 21, 2011, we finalized a decision to terminate the FSX service, and we ceased all operations related to our FSX service during the fourth quarter of 2011. The entire component comprising the FSX service has been discontinued and there will not be any significant future cash flows related to these operations. Accordingly, we have classified the FSX service as discontinued operations beginning in our fiscal fourth quarter and revised all prior periods to conform to this presentation.
As a result of the shutdown of our FSX service, we recorded a pretax restructuring charge of $119.3 million during the fourth quarter of 2011. This charge includes costs to return excess rolling stock equipment, severance, and facility and vessel lease expense, net of estimated sublease income.
On April 5, 2012, we entered into a Global Termination Agreement with Ship Finance International Limited and certain of its subsidiaries (“SFL”) which enabled us to early terminate the bareboat charters of the five foreign-built, U.S.-flag vessels that formerly operated in the FSX service. The Global Termination Agreement could have a material impact on our 2012 financial statements.
39
Table of Contents
Pursuant to the Global Termination Agreement, in consideration for the early termination of the vessel leases, and related agreements and the mutual release of all claims thereunder, we agreed to: (i) issue to SFL $40.0 million in aggregate principal amount of Second Lien Senior Secured Notes due 2016; (ii) issue to SFL the number of warrants to purchase 9,250,000 shares of our common stock at a conversion price of $0.01 per common share, which in the aggregate represents 10% of the fully diluted shares of such common stock after giving effect to such issuance but subject to approximately 8% dilution for a management incentive plan; (iii) transfer to SFL certain property on board the vessels (such as bunker fuel, spare parts and equipment, and consumable stores) at the time of redelivery to SFL without any additional payment; (iv) reimburse reasonable costs incurred by SFL to (a) return the vessels from their current laid up status to operating status, which reimbursement shall not exceed $0.6 million, (b) reposition the vessels from the Philippines to either Hong Kong or Singapore, which reimbursement shall not exceed $0.1 million, (c) remove our stack insignia and name from the vessels, which reimbursement shall not exceed $0.1 million, and (d) complete the reflagging of the vessels to the Marshall Islands registry, which reimbursement is currently expected to approximate $0.1 million; and (v) reimburse SFL for their reasonable costs and expenses incurred in connection with the transaction, which we estimate represents an aggregate maximum reimbursement obligation to the SFL Parties of $0.6 million.
NYSE Delisting
On October 14, 2011, the NYSE notified us trading in our common stock would be suspended on October 20, 2011. On October 20, 2011, our common stock began trading on the over-the-counter (“OTC”) market under a new stock symbol, HRZL. We requested a review of the NYSE’s determination by a committee of the Board of Directors of the NYSE Regulation. Upon the conclusion of the appeal process, the NYSE confirmed, on February 29, 2012, its determination to delist our common stock. Our common stock was removed from listing on the NYSE and a Form 25 was filed on March 1, 2012.
Election of New Directors
In connection with the comprehensive recapitalization plan discussed above, we and certain holders (the “Exchanging Holders”) of our 4.25% Notes entered into a restructuring support agreement dated August 26, 2011, as amended on September 29, 2011 and October 3, 2011 (collectively, the “Restructuring Support Agreement”). The Restructuring Support Agreement clarified certain understandings regarding post-closing corporate governance-related items, including a provision providing the Exchanging Holders with the ability to designate seven director nominees to our Board of Directors. On November 11, 2011, our Board of Directors increased the size of our Board of Directors to eleven members.
Effective November 25, 2011, four of our eight then current directors retired. Four persons then serving as members of our Board of Directors, William J. Flynn, Stephen H. Fraser, Bobby J. Griffin and Alex J. Mandl, did not resign. In addition, effective November 25, 2011, our Board of Directors appointed Jeffrey A. Brodsky, Kurt M. Cellar, Carol B. Hallett, James LaChance, Steven L. Rubin, Martin Tuchman, and David N. Weinstein to serve as members of our Board of Directors.
In connection with the April 5, 2012 transactions, we reduced the size of our Board of Directors to seven members from eleven. Board member Jeffrey A. Brodsky has succeeded Alex J. Mandl as Chairman. Mr. Mandl is retiring from the Board, along with William J. Flynn, Bobby J. Griffin and Carol B. Hallett. Mr. Fraser will remain interim President and CEO until a new CEO is named.
Puerto Rico Opt-Out Settlement
On November 23, 2011, we entered into a Settlement Agreement (the “Settlement Agreement”) with attorneys representing those shippers who opted out of the Puerto Rico direct purchaser class-action settlement and had indicated an intention to pursue an antitrust claim against us related to the Puerto Rico tradelane (such persons referred to collectively as the “Settling Claimants”).
40
Table of Contents
See the section entitled “Legal Proceedings” for a description of the class-action settlement. The Settling Claimants elected to opt-out of the settlement class to preserve their rights, if any, against us relating to the Puerto Rico tradelane.
Pursuant to the terms of the Settlement Agreement, in exchange for the full, complete and final settlement of the alleged claims from the Settling Claimants, we agreed to pay the Settling Claimants an aggregate amount of $13.8 million in three installments. As such, we recorded a charge of $12.7 million during the fourth quarter of 2011, which represents the present value of the $13.8 million in installment payments.
Special Meeting of Stockholders
On December 2, 2011, a special meeting of stockholders was held to consider: (i) a proposal to amend the Company’s Amended and Restated Certificate of Incorporation to effect a 1–for–25 reverse stock split of the Common Stock; (ii) a proposal to amend the Company’s Amended and Restated Certificate of Incorporation to increase the number of authorized shares of Common Stock from 100,000,000 to 2,500,000,000; however, such amendment did not become effective because Proposal No. 1 was approved; (iii) a proposal to amend the Company’s Amended and Restated Certificate of Incorporation to authorize the issuance of warrants in lieu of cash or redemption notes in consideration for “Excess Shares” to facilitate compliance with the Jones Act; and (iv) a proposal to approve the Company’s Restated Certificate of Incorporation.
At the special meeting, the shareholders voted for the proposal to amend the Company’s Amended and Restated Certificate of Incorporation to effect a 1-for-25 reverse stock split of the Common Stock; for the proposal to amend the Company’s Amended and Restated Certificate of Incorporation to increase the number of authorized shares of Common Stock from 100,000,000 to 2,500,000,000; for the proposal to amend the Company’s Amended and Restated Certificate of Incorporation to authorize the issuance of warrants in lieu of cash or redemption notes in consideration for “Excess Shares” to facilitate compliance with the Jones Act; and for the proposal to approve the Company’s Restated Certificate of Incorporation. As the proposal to amend the Company’s Amended and Restated Certificate of Incorporation to effect a 1-for-25 reverse stock split of the Common Stock was approved by stockholders, the Board of Directors did not take action to effect the proposal to amend the Company’s Amended and Restated Certificate of Incorporation to increase the number of authorized shares of Common Stock from 100,000,000 to 2,500,000,000.
An amended and restated certificate of incorporation reflecting the 1-for-25 reverse stock split was filed with the Secretary of the State of Delaware on December 7, 2011. As such, each holders’ ownership of our common stock has been reduced uniformly as a result of the reverse stock split, although the reverse stock split will not affect any stockholder’s percentage ownership interest in the Company, except to the extent that the reverse split results in any stockholders receiving cash in lieu of fractional shares.
Executive Overview
Rising fuel prices, lower container volumes in our Hawaii and Puerto Rico tradelanes, and incremental container lift costs and equipment costs in connection with the expiration of certain agreements with Maersk caused our 2011 results of operations to decline compared to 2010. The economic recovery in our domestic markets has continued at a slow and uneven pace. Persistent high unemployment and uncertainty in the economy have affected consumers and impacted their spending. In addition, construction spending remains at depressed levels and many state governments have enacted spending cutbacks, including workforce reductions and furloughs. As a result of the still uncertain macroeconomic environment, we are continuing our efforts to reduce expenses and preserve liquidity, including, significantly reducing operating costs, and pursuing the sale of selected assets.
Operating revenue for the year ended December 25, 2011 increased as a result of higher fuel surcharges and improved third party terminal services, which was partially offset by the loss of revenue as a result of a decrease in container volumes.
41
Table of Contents
The increase in operating expense during the year ended December 25, 2011 is primarily due to a goodwill impairment charge, higher fuel prices, and an increase in selling, general and administrative expenses, partially offset by a reversal of a portion of the charge recorded for the DOJ settlement. Due to the deterioration in earnings during 2011, we recorded a goodwill impairment charge of $115.4 million in the year ended December 25, 2011. The increase in selling, general and administrative expenses is largely due to a separation agreement with our former chief executive officer and costs incurred in conjunction with our refinancing efforts.
We entered into a plea agreement, dated February 23, 2011, with the United States of America, under which we agreed to plead guilty to a charge of violating federal antitrust laws solely with respect to the Puerto Rico tradelane. We agreed to pay a fine of $45.0 million over five years without interest. We recorded a charge during the year ended December 26, 2010 of $30.0 million, which represents the present value of the expected installment payments. On April 28, 2011, the Court reduced the fine from $45.0 million to $15.0 million payable over five years without interest. During the second quarter of 2011, we reversed $19.2 million of the $30.0 million charge recorded during the year ended December 26, 2010 related to this legal settlement.
On February 22, 2011, we and two other companies providing ocean shipping services in the Puerto Rico tradelane entered into a Memorandum of Understanding with the Commonwealth of Puerto Rico and attorneys representing a putative class of indirect purchasers. Under the Memorandum of Understanding, we have agreed to resolve all of the alleged claims of the Commonwealth of Puerto Rico and the indirect purchasers related to ocean shipping services in the Puerto Rico tradelane. Pursuant to the Memorandum of Understanding, the parties will enter into a settlement agreement pursuant to which we and the other two companies each agreed to pay $1.8 million as our share of the settlement amount in exchange for a full release. Such settlement agreement, when negotiated and entered into by the parties, will be subject to court approval.
On November 23, 2011, we entered into a settlement agreement with attorneys representing those shippers who opted out of the Puerto Rico direct purchaser class-action settlement and had indicated an intention to pursue an antitrust claim against us related to the Puerto Rico tradelane. Pursuant to the terms of the settlement agreement, in exchange for the full, complete and final settlement of the alleged claims from the settling claimants, we agreed to pay the settling claimants an aggregate amount of $13.8 million in three installments. As such, we recorded a charge of $12.7 million during the fourth quarter of 2011, which represents the present value of the $13.8 million in installment payments.
Operating expense for the year ended December 20, 2009 includes a $20 million charge for the settlement of the Puerto Rico MDL.
| Year Ended December 25, 2011 | Year Ended December 26, 2010 | Year Ended December 20, 2009 | ||||||||||
| (In thousands) | ||||||||||||
Operating revenue | $ | 1,026,164 | $ | 1,000,055 | $ | 979,352 | ||||||
Operating expense | 1,124,020 | 995,161 | 954,926 | |||||||||
|
|
|
|
|
| |||||||
Operating (loss) income | $ | (97,856 | ) | $ | 4,894 | $ | 24,426 | |||||
|
|
|
|
|
| |||||||
Operating ratio | 109.5 | % | 99.5 | % | 97.5 | % | ||||||
Revenue containers (units) | 234,311 | 243,575 | 257,625 | |||||||||
General
We believe that we are the nation’s leading Jones Act container shipping and integrated logistics company, accounting for approximately 36% of total U.S. marine container shipments from the continental U.S. to Alaska, Puerto Rico and Hawaii, constituting the three non-contiguous Jones Act markets. Under the Jones Act, all vessels transporting cargo between U.S. ports must, subject to limited exceptions, be built in the U.S., registered under the U.S. flag, manned by predominantly U.S. crews, and owned and operated by U.S.-organized companies that are controlled and 75% owned by U.S. citizens.
42
Table of Contents
We own or lease 20 vessels, 15 of which are fully qualified Jones Act vessels, and approximately 31,400 cargo containers. Five of our leased vessels are not in use at December 25, 2011. As a result of the shutdown of the FSX service, we expect to offhire a total of approximately 8,200 containers. We provide comprehensive shipping and integrated logistics services in our markets. We have long-term access to terminal facilities in each of our ports, operating our terminals in Alaska, Hawaii, and Puerto Rico and contracting for terminal services in the seven ports in the continental U.S.
History and Transactions
Our long operating history dates back to 1956, when Sea-Land pioneered the marine container shipping industry and established our business. In 1958, we introduced container shipping to the Puerto Rico market and in 1964 we pioneered container shipping in Alaska with the first year-round scheduled vessel service. In 1987, we began providing container shipping services between the U.S. west coast and Hawaii and Guam through our acquisition from an existing carrier of all of its vessels and certain other assets that were already serving that market. Today, as the only Jones Act vessel operator with an integrated organization serving Alaska, Puerto Rico, and Hawaii, we are uniquely positioned to serve our customers that require shipping and logistics services in more than one of these markets.
Horizon Lines, Inc., a Delaware corporation, (the “Company” and together with its subsidiaries, “we”) operates as a holding company for Horizon Lines, LLC (“Horizon Lines”), a Delaware limited liability company and wholly-owned subsidiary, Horizon Logistics, LLC (“Horizon Logistics”), a Delaware limited liability company and wholly-owned subsidiary, Horizon Lines of Puerto Rico, Inc. (“HLPR”), a Delaware corporation and wholly-owned subsidiary, and Hawaii Stevedores, Inc., a Hawaii corporation (“HSI”).
In December 1999, CSX Corporation, the former parent of Sea-Land Domestic Shipping, LLC (“SLDS”), sold the international marine container operations of Sea-Land to the A.P. Møller Maersk Group (“Maersk”) and SLDS continued to be owned and operated by CSX Corporation as CSX Lines, LLC. On February 27, 2003, Horizon Lines Holding Corp. (“HLHC”) (which at the time was indirectly majority-owned by Carlyle-Horizon Partners, L.P.) acquired from CSX Corporation, 84.5% of CSX Lines, LLC, and 100% of CSX Lines of Puerto Rico, Inc., which together with Horizon Logistics and HSI constitute our business today. CSX Lines, LLC is now known as Horizon Lines, LLC and CSX Lines of Puerto Rico, Inc. is now known as Horizon Lines of Puerto Rico, Inc. The Company was formed as an acquisition vehicle to acquire, on July 7, 2004, the equity interest in HLHC. The Company was formed at the direction of Castle Harlan Partners IV. L.P. (“CHP IV”), a private equity investment fund managed by Castle Harlan, Inc. (“Castle Harlan”). In 2005, the Company completed its initial public offering. Subsequent to the initial public offering, the Company completed three secondary offerings, including a secondary offering (pursuant to a shelf registration) whereby CHP IV and other affiliated private equity investment funds managed by Castle Harlan divested their ownership in the Company.
Basis of Presentation
The accompanying consolidated financial statements include the consolidated accounts of the Company as of December 25, 2011, December 26, 2010 and December 20, 2009 and for the fiscal years ended December 25, 2011, December 26, 2010 and December 20, 2009. Certain prior period balances have been reclassified to conform to current period presentation.
At a special meeting of the Company’s stockholders held on December 2, 2011, our stockholders approved an amendment to our certificate of incorporation effecting a reverse stock split. On December 7, 2011, we filed our restated certificate of incorporation to, among other things, effect the 1-for-25 reverse stock split. In connection with the reverse stock split, stockholders received one share of common stock for every 25 shares of common stock held at the effective time. The reverse stock split reduced the number of shares of outstanding common stock from 56.7 million to 2.3 million. Unless otherwise noted, all share-related amounts herein reflect the reverse stock split.
43
Table of Contents
During the third quarter of 2011, we began a review of strategic alternatives for our FSX service. As a result of several factors, including: 1) the projected continuation of volatile trans-Pacific freight rates, 2) high fuel prices, and 3) operating losses, we decided to discontinue our FSX service. On October 21, 2011, we finalized a decision to terminate the FSX service, and ceased all operations related to the FSX service during the fourth quarter of 2011. The entire component comprising the FSX service has been discontinued. As such, there will not be any future cash inflows received from the FSX customers and no significant cash outflows related to these operations. As a result, the FSX service has been classified as discontinued operations in all periods presented.
During 2011, the entire component comprising the third-party logistics operations was discontinued and former logistics customers are no longer our customers. As part of the divestiture, we transitioned some of the operations and personnel to other logistics providers. There will not be any future cash inflows received from these logistics customers and no cash outflows related to these operations. In addition, we do not have any significant continuing involvement in the divested logistics operations. As a result, the logistics operations have been classified as discontinued operations in all periods presented.
Fiscal Year
We have a 52- or 53-week (every sixth or seventh year) fiscal year that ends on the Sunday before the last Friday in December. The fiscal years ended December 25, 2011 and December 20, 2009 each consisted of 52 weeks and the fiscal year ended December 26, 2010 consisted of 53 weeks.
Critical Accounting Policies
We prepare our financial statements in conformity with accounting principles generally accepted in the United States of America. The preparation of our financial statements requires us to make estimates and assumptions in the reported amounts of revenues and expenses during the reporting period and in reporting the amounts of assets and liabilities, and disclosures of contingent assets and liabilities at the date of our financial statements. Since many of these estimates and assumptions are based on future events which cannot be determined with certainty, the actual results could differ from these estimates.
We believe that the application of our critical accounting policies, and the estimates and assumptions inherent in those policies, are reasonable. These accounting policies and estimates are periodically re-evaluated and adjustments are made when facts or circumstances dictate a change. Historically, we have found the application of accounting policies to be appropriate and actual results have not differed materially from those determined using necessary estimates.
We believe the following accounting principles are critical because they involve significant judgments, assumptions, and estimates used in the preparation of our financial statements.
Revenue Recognition
We account for transportation revenue based upon method two under Emerging Issues Task Force No. 91-9 “Revenue and Expense Recognition for Freight Services in Process.” Under this method we record transportation revenue for the cargo when shipped and an expense accrual for the corresponding costs to complete delivery when the cargo first sails from its point of origin. We believe that this method of revenue recognition does not result in a material difference in reported net income on an annual or quarterly basis as compared to recording transportation revenue between accounting periods based upon the relative transit time within each respective period with expenses recognized as incurred. We recognize revenue and related costs of sales for our terminal and other services upon completion of services.
44
Table of Contents
Allowance for Doubtful Accounts and Revenue Adjustments
We maintain an allowance for doubtful accounts based upon the expected collectability of accounts receivable reflective of our historical collection experience. In circumstances in which we are aware of a specific customer’s inability to meet its financial obligation (for example, bankruptcy filings, accounts turned over for collection or litigation), we record a specific reserve for the bad debts against amounts due. For all other customers, we recognize reserves for these bad debts based on the length of time the receivables are past due and other customer specific factors including, type of service provided, geographic location and industry. We monitor our collection risk on an ongoing basis through the use of credit reporting agencies. Accounts are written off after all means of collection, including legal action, have been exhausted. We do not require collateral from our trade customers.
In addition, we maintain an allowance for revenue adjustments consisting of amounts reserved for billing rate changes that are not captured upon load initiation. These adjustments generally arise: (1) when the sales department contemporaneously grants small rate changes (“spot quotes”) to customers that differ from the standard rates in the system; (2) when freight requires dimensionalization or is reweighed resulting in a different required rate; (3) when billing errors occur; and (4) when data entry errors occur. When appropriate, permanent rate changes are initiated and reflected in the system. These revenue adjustments are recorded as a reduction to revenue.
Casualty and Property Insurance Reserves
We purchase insurance coverage for our exposures related to employee injuries (state worker’s compensation and compensation under the Longshore and Harbor workers’ compensation Act), vessel collisions and allisions, property loss and damage, third party liability, and cargo loss and damage. Most insurance policies include a deductible applicable to each incident or vessel voyage and deductibles can change from year to year as policies are renewed or replaced. Our current insurance program includes individual and aggregate deductibles ranging from $0 to $2,000,000. In most cases, our claims personnel work directly with our insurers’ claims professionals or our third-party claim administrators to continually update the anticipated residual exposure for each claim. In this process, we evaluate and monitor each claim individually, and use resources such as historical experience, known trends, and third-party estimates to determine the appropriate reserves for potential liability. Changes in the perceived severity of previously reported claims, significant changes in medical costs, and legislative changes affecting the administration of our plans could significantly impact the determination of appropriate reserves.
Goodwill and Other Identifiable Intangible Assets
Goodwill and other intangible assets with indefinite useful lives are not amortized but are subject to annual impairment tests as of the first day of the fourth quarter. At least annually, or sooner if there is an indicator of impairment, the fair value of the reporting unit is calculated. If the calculated fair value is less than the carrying amount, an impairment loss might be recognized. In these instances, a discounted cash flow model is used to determine the current estimated fair value of the reporting unit. A number of significant assumptions and estimates are involved in the application of the discounted cash flow model to forecast operating cash flows, including market growth and market share, sales volumes and prices, costs of service, discount rate and estimated capital needs. Management considers historical experience and all available information at the time the fair values of its reporting units are estimated. Assumptions in estimating future cash flows are subject to a high degree of judgment and complexity. Changes in assumptions and estimates may affect the carrying value of goodwill and could result in additional impairment charges in future periods.
We assess goodwill for impairment at the reporting unit level, which is defined as an operating segment or one level below an operating segment, referred to as a component. We identified our reporting units by first determining our operating segments, and then assessed whether any components of the operating segments constituted a business for which discrete financial information is available and where segment management regularly reviews the operating results of the component. With the discontinuance of the logistics services segment in 2010, we concluded we had one operating segment and one reporting unit consisting of the container shipping business.
45
Table of Contents
We use the two-step method, to determine goodwill impairment. If the carrying amount of our single reporting unit exceeds its fair value (step one), we measure the possible goodwill impairment based on a hypothetical allocation of the estimated fair value of the reporting unit to all of the underlying assets and liabilities, including previously unrecognized intangible assets (step two). The excess of the reporting unit’s fair value over the amounts assigned to its assets and liabilities is the implied fair value of goodwill. An impairment loss is recognized to the extent a reporting unit’s recorded goodwill exceeds the implied fair value of goodwill.
Goodwill is reviewed annually, or when events or circumstances dictate, more frequently. The impairment review for goodwill consists of a two- step process of first determining the fair value of the reporting unit and comparing it to the carrying value of the net assets allocated to the reporting unit. If the fair value of the reporting unit exceeds the carrying value, no further analysis or write-down of goodwill is required. If the fair value of the reporting unit is less than the carrying value of the net assets, the implied fair value of the reporting unit is allocated to all the underlying assets and liabilities, including both recognized and unrecognized tangible and intangible assets, based on their fair value. If necessary, goodwill is then written down to its implied fair value. The indefinite-life intangible asset impairment review consists of a comparison of the fair value of the indefinite-life intangible asset with its carrying amount. If the carrying amount exceeds its fair value, an impairment loss is recognized in an amount equal to that excess. If the fair value exceeds its carrying amount, the indefinite-life intangible asset is not considered impaired.
The customer contracts and trademarks on the balance sheet as of December 25, 2011 were valued on July 7, 2004, as part of the Acquisition-Related Transactions, using the income appraisal methodology. The income appraisal methodology includes a determination of the present value of future monetary benefits to be derived from the anticipated income, or ownership, of the subject asset. The value of our customer contracts includes the value expected to be realized from existing contracts as well as from expected renewals of such contracts and is calculated using unweighted and weighted total undiscounted cash flows as part of the income appraisal methodology. The value of our trademarks and service marks is based on various factors including the strength of the trade or service name in terms of recognition and generation of pricing premiums and enhanced margins. We amortize customer contracts and trademarks and service marks on a straight-line method over the estimated useful life of four to fifteen years. Long-lived assets are reviewed annually, or more frequently if events or changes in circumstances indicate that the carrying amount of these assets may not be fully recoverable. The assessment of possible impairment is based on our ability to recover the carrying value of our asset based on our estimate of its undiscounted future cash flows. If these estimated future cash flows are less than the carrying value of the asset, an impairment charge would be recognized for the difference between the asset’s estimated fair value and its carrying value.
The determination of fair value is based on quoted market prices in active markets, if available. Such quoted market prices are often not available for our identifiable intangible assets. Accordingly, we base fair value on projected future cash flows discounted at a rate determined by management to be commensurate with the business risk. The estimation of fair value utilizing discounted forecasted cash flows includes numerous uncertainties which require our significant judgment when making assumptions of revenues, operating costs, marketing, selling and administrative expenses, as well as assumptions regarding the overall shipping and logistics industries, competition, and general economic and business conditions, among other factors.
Vessel Dry-docking
Under U.S. Coast Guard Rules, administered through the American Bureau of Shipping’s alternative compliance program, all vessels must meet specified seaworthiness standards to remain in service carrying cargo between U.S. marine terminals. Vessels must undergo regular inspection, monitoring and maintenance, referred to as dry-docking, to maintain the required operating certificates. These dry-dockings generally occur every two and a half years, or twice every five years. The costs of these scheduled dry-dockings are customarily deferred and amortized over a 30-month period beginning with the accounting period following the vessel’s release from dry-dock because dry-dockings enable the vessel to continue operating in compliance with U.S. Coast Guard requirements.
46
Table of Contents
We also take advantage of vessel dry-dockings to perform normal repair and maintenance procedures on our vessels. These routine vessel maintenance and repair procedures are expensed as incurred. In addition, we will occasionally, during a vessel dry-docking, replace vessel machinery or equipment and perform procedures that materially enhance capabilities of a vessel. In these circumstances, the expenditures are capitalized and depreciated over the estimated useful lives.
Income Taxes
Deferred tax assets represent expenses recognized for financial reporting purposes that may result in tax deductions in the future and deferred tax liabilities represent expense recognized for tax purposes that may result in financial reporting expenses in the future. Certain judgments, assumptions and estimates may affect the carrying value of the deferred tax assets and income tax expense in the consolidated financial statements. We record an income tax valuation allowance when the realization of certain deferred tax assets, net operating losses and capital loss carryforwards is not likely. In conjunction with the election of tonnage tax, we revalued our deferred taxes to accurately reflect the rates at which we expect such items to reverse in future periods.
The application of income tax law is inherently complex. As such, we are required to make many assumptions and judgments regarding our income tax positions and the likelihood whether such tax positions would be sustained if challenged. Interpretations and guidance surrounding income tax laws and regulations change over time. As such, changes in our assumptions and judgments can materially affect amounts recognized in the consolidated financial statements.
Stock-Based Compensation
The value of each equity-based award is estimated on the date of grant using the Black-Scholes option-pricing model. The Black-Scholes model takes into account volatility in the price of our stock, the risk-free interest rate, the estimated life of the equity-based award, the closing market price of our stock and the exercise price. The estimates utilized in the Black-Scholes calculation involve inherent uncertainties and the application of management judgment. In addition, we are required to estimate the expected forfeiture rate and only recognize expense for those options expected to vest.
Property and Equipment
We capitalize property and equipment as permitted or required by applicable accounting standards, including replacements and improvements when costs incurred for those purposes extend the useful life of the asset. We charge maintenance and repairs to expense as incurred. Depreciation on capital assets is computed using the straight-line method and ranges from 3 to 40 years. Our management makes assumptions regarding future conditions in determining estimated useful lives and potential salvage values. These assumptions impact the amount of depreciation expense recognized in the period and any gain or loss once the asset is disposed.
We evaluate long-lived assets for impairment whenever events or changes in circumstances indicate that the carrying amount of an asset may not be recoverable. If impairment indicators are present or if other circumstances indicate that an impairment may exist, we must then determine whether an impairment loss should be recognized. An impairment loss can be recognized for a long-lived asset (or asset group) that is held and used only if the sum of its estimated future undiscounted cash flows used to test for recoverability is less than its carrying value. Estimates of future cash flows used to test a long-lived asset (or asset group) for recoverability shall include only the future cash flows (cash inflows and associated cash outflows) that are directly associated with and that are expected to arise as a direct result of the use and eventual disposition of the long-lived asset (or asset group). Estimates of future cash flows should be based on an entity’s own assumptions about its use of a long-lived asset (or asset group). The cash flow estimation period should be based on the long-lived asset’s (or asset group’s) remaining useful life to the entity. When long-lived assets are grouped for purposes of performing the recoverability test, the remaining useful life of the asset group should be based on the useful life of the
47
Table of Contents
primary asset. The primary asset of the asset group is the principal long-lived tangible asset being depreciated that is the most significant component asset from which the group derives its cash-flow-generating capacity. Estimates of future cash flows used to test the recoverability of a long-lived asset (or asset group) that is in use shall be based on the existing service potential of the asset (or asset group) at the date tested. Existing service potential encompasses the long-lived asset’s estimated useful life, cash flow generating capacity, and, the physical output capacity. The estimated cash flows should include cash flows associated with future expenditures necessary to maintain the existing service potential, including those that replace the service potential of component parts, but they should not include cash flows associated with future capital expenditures that would increase the service potential. When undiscounted future cash flows will not be sufficient to recover the carrying amount of an asset, the asset is written down to its fair value.
Recent Accounting Pronouncements
In September 2011, the Financial Accounting Standards Board (“FASB”) issued ASU No. 2011-09, “Compensation-Retirement Benefits-Multiemployer Plans (Subtopic 715-80): Disclosures about an Employer’s Participation in a Multiemployer Plan”. This subtopic addresses concerns from users of financial statements on the lack of transparency about an employer’s participation in a multiemployer pension plan. The disclosures also indicate the financial health of all of the significant plans in which the employer participates and assist a financial statement user to access additional information that is available outside of the financial statements. The subtopic is effective for annual reporting periods ending after December 15, 2011. We adopted this topic as of December 25, 2011 and have included the required disclosures in this Form 10-K. The adoption did not have a material effect on our consolidated financial statements.
In June 2011, the FASB issued changes to the manner in which entities present comprehensive income in their financial statements. The new guidance requires entities to report components of comprehensive income in either (1) a continuous statement of comprehensive income or (2) two separate but consecutive statements. The new guidance does not change the items that must be reported in other comprehensive income. In December 2011, the FASB deferred the requirement that companies present reclassification adjustments for each component of accumulated other comprehensive income in both net income and other comprehensive income on the face of the financial statements. The new reporting requirement is effective for fiscal years and interim reporting periods within those years beginning after December 15, 2011, with early adoption permitted. We have elected to early adopt the accounting pronouncement and the effect on our consolidated financial statements was to present activity impacting net income and other comprehensive loss in two consecutive statements.
In January 2010, the FASB issued an amendment to the accounting for fair value measurements and disclosures. This amendment details additional disclosures on fair value measurements, requires a gross presentation of activities within a Level 3 roll-forward, and adds a new requirement to disclose transfers in and out of Level 1 and Level 2 measurements. The new disclosures are required of all entities that are required to provide disclosures about recurring and nonrecurring fair value measurements. This amendment is effective in the first interim or reporting period beginning after December 15, 2009, with an exception for the gross presentation of Level 3 roll-forward information, which is required for annual reporting periods beginning after December 15, 2010, and for interim reporting periods within those years. The adoption of the provisions of this amendment required in the first interim period after December 15, 2009 did not have a material impact on our financial statement disclosures. In addition, the adoption of the provisions of this amendment during the quarter ended March 27, 2011 did not have a material impact on our financial statement disclosures.
Shipping Rates
We publish tariffs with rates rules and practices for all three of our Jones Act trade routes. These tariffs are subject to regulation by the Surface Transportation Board (“STB”). However, in the case of our Puerto Rico and Alaska trade routes, we primarily ship containers on the basis of confidential negotiated transportation service contracts that are not subject to rate regulation by the STB.
48
Table of Contents
Seasonality
Our container volumes are subject to seasonal trends common in the transportation industry. Financial results in the first quarter are normally lower due to reduced loads during the winter months. Volumes typically build to a peak in the third quarter and early fourth quarter, which generally results in higher revenues, improved margins, and increased earnings and cash flows.
Results of Operations
Operating Revenue Overview
We derive our revenue primarily from providing comprehensive shipping and integrated logistics services to and from the continental U.S. and Alaska, Puerto Rico, and Hawaii. We charge our customers on a per load basis and price our services based primarily on the length of inland and ocean cargo transportation hauls, type of cargo, and other requirements such as shipment timing and type of container. In addition, we assess fuel surcharges on a basis consistent with industry practice and at times may incorporate these surcharges into our basic transportation rates. There is occasionally a timing disparity between volatility in our fuel costs and related adjustments to our fuel surcharges (or the incorporation of adjusted fuel surcharges into our base transportation rates) that may result in variances in our fuel recovery.
During 2011, over 90% of our revenue was generated from our shipping and integrated logistics services in markets where the marine trade is subject to the Jones Act. The balance of our revenue was derived from (i) vessel loading and unloading services that we provide for vessel operators at our terminals, (ii) agency services that we provide for third-party shippers lacking administrative presences in our markets, (iv) warehousing services for third-parties, and (v) other non-transportation services.
As used in this Form 10-K, the term “revenue containers” refers to containers that are transported for a charge, as opposed to empty containers.
Cost of Services Overview
Our cost of services consist primarily of vessel operating costs, marine operating costs, inland transportation costs, land costs and rolling stock rent. Our vessel operating costs consist primarily of vessel fuel costs, crew payroll costs and benefits, vessel maintenance costs, space charter costs, vessel insurance costs and vessel rent. We view our vessel fuel costs as subject to potential fluctuation as a result of changes in unit prices in the fuel market. Our marine operating costs consist of stevedoring, port charges, wharfage and various other costs to secure vessels at the port and to load and unload containers to and from vessels. Our inland transportation costs consist primarily of the costs to move containers to and from the port via rail, truck or barge. Our land costs consist primarily of maintenance, yard and gate operations, warehousing operations and terminal overhead in the terminals in which we operate. Rolling stock rent consists primarily of rent for street tractors, yard equipment, chassis, gensets and various dry and refrigerated containers.
49
Table of Contents
Year Ended December 25, 2011 Compared to Year Ended December 26, 2010
We have a 52- or 53-week fiscal year (every sixth or seventh year) that ends on the Sunday before the last Friday in December. Fiscal year 2011 consisted of 52 weeks and fiscal year 2010 consisted of 53 weeks.
| Year Ended December 25, 2011 | Year Ended December 26, 2010 | % Change | ||||||||||
| (In thousands) | ||||||||||||
Operating revenue | $ | 1,026,164 | $ | 1,000,055 | 2.6 | % | ||||||
Operating expense: | ||||||||||||
Vessel | 311,645 | 276,351 | 12.8 | % | ||||||||
Marine | 194,002 | 188,086 | 3.1 | % | ||||||||
Inland | 179,583 | 175,394 | 2.4 | % | ||||||||
Land | 144,072 | 142,299 | 1.2 | % | ||||||||
Rolling stock rent | 40,727 | 38,330 | 6.3 | % | ||||||||
|
|
|
| |||||||||
Cost of services | 870,029 | 820,460 | 6.0 | % | ||||||||
|
|
|
| |||||||||
Depreciation and amortization | 42,883 | 43,563 | (1.6 | )% | ||||||||
Amortization of vessel dry-docking | 15,376 | 15,014 | 2.4 | % | ||||||||
Selling, general and administrative | 82,125 | 79,930 | 2.7 | % | ||||||||
Goodwill impairment | 115,356 | — | 100.0 | % | ||||||||
Impairment of assets | 2,997 | 2,655 | 12.9 | % | ||||||||
Legal settlements | (5,483 | ) | 32,270 | (117.0 | )% | |||||||
Restructuring costs | — | 1,843 | (100.0 | )% | ||||||||
Miscellaneous expense (income), net | 737 | (574 | ) | 228.4 | % | |||||||
|
|
|
| |||||||||
Total operating expense | 1,124,020 | 995,161 | 12.9 | % | ||||||||
|
|
|
| |||||||||
Operating (loss) income | $ | (97,856 | ) | $ | 4,894 | (2,099.5 | )% | |||||
|
|
|
| |||||||||
Operating ratio | 109.5 | % | 99.5 | % | 10.0 | % | ||||||
Revenue containers (units) | 234,311 | 243,575 | (3.8 | )% | ||||||||
Operating Revenue. Operating revenue increased $26.1 million, or 2.6% during the year ended December 25, 2011. This revenue increase can be attributed to the following factors (in thousands):
Bunker and intermodal fuel surcharges increase | $ | 54,293 | ||
Other non-transportation services revenue increase | 2,572 | |||
Revenue container volume decrease | (29,266 | ) | ||
Revenue container rate decrease | (797 | ) | ||
Space charter revenue decreases | (693 | ) | ||
|
| |||
Total operating revenue increase | $ | 26,109 | ||
|
|
Bunker and intermodal fuel surcharges, which are included in our transportation revenue, accounted for approximately 20.7% of total revenue in the year ended December 25, 2011 and approximately 15.8% of total revenue in the year ended December 26, 2010. We adjust our bunker and intermodal fuel surcharges as a result of changes in the cost of bunker fuel for our vessels, in addition to diesel fuel fluctuations passed on to us by our truck, rail, and barge service providers. Fuel surcharges are evaluated regularly as the price of fuel fluctuates, and we may at times incorporate these surcharges into our base transportation rates that we charge. The increase in non-transportation revenue is primarily due to improved third party terminal services. The decrease in revenue container volume was the result of continued soft market conditions in our Puerto Rico and Hawaii markets. The decrease in revenue container rate was primarily due to rate pressures in our Puerto Rico market.
50
Table of Contents
Cost of Services. The $49.6 million increase in cost of services is primarily due to higher fuel costs arising from elevated fuel prices and an increase in rolling stock expense
Vessel expense, which is not primarily driven by revenue container volume, increased $35.3 million for the year ended December 25, 2011. This increase can be attributed to the following factors (in thousands):
Vessel fuel costs increase | $ | 44,854 | ||
Labor and other vessel operating decrease | (5,606 | ) | ||
Vessel lease expense decrease | (3,135 | ) | ||
Vessel space charter expense decrease | (819 | ) | ||
|
| |||
Total vessel expense increase | $ | 35,294 | ||
|
|
The $44.9 million increase in fuel costs is comprised of a $48.4 million increase due to higher fuel prices, offset by a $3.5 million decrease in consumption due to fewer vessel operating days. The decrease in labor and other vessel operating expense during 2011 is primarily due to additional vessel operating expense associated with a higher number of dry-dockings during 2010 and the extra week during 2010. We continue to incur labor expenses with the vessel in dry-dock, while also incurring expenses associated with the spare vessel deployed as dry-dock relief. The decrease in vessel lease charter expense during 2011 is due to the amendment of the charter hire payments to reflect concessions for certain of our vessels and the extra week during fiscal year 2010.
Marine expense is comprised of the costs incurred to bring vessels into and out of port, and to load and unload containers. The types of costs included in marine expense are stevedoring and associated benefits, pilotage fees, tug fees, government fees, wharfage fees, dockage fees, and line handler fees. The $5.9 million increase in marine expense during the year ended December 25, 2011 was primarily due to contractual rate increases and the newly enacted cargo scanning fee in Puerto Rico, partially offset by lower container volumes.
Inland expense increased to $179.6 million for the year ended December 25, 2011 compared to $175.4 million during the year ended December 26, 2010. The $4.2 million increase in inland expense is primarily due to higher fuel costs and contractual increases, partially offset by lower container volumes.
Land expense is comprised of the costs included within the terminal for the handling, maintenance and storage of containers, including yard operations, gate operations, maintenance, warehouse and terminal overhead.
| Year Ended December 25, 2011 | Year Ended December 26, 2010 | % Change | ||||||||||
| (In thousands) | ||||||||||||
Land expense: | ||||||||||||
Maintenance | $ | 56,019 | $ | 53,571 | 4.6 | % | ||||||
Terminal overhead | 52,983 | 52,191 | 1.5 | % | ||||||||
Yard and gate | 28,497 | 28,818 | (1.1 | )% | ||||||||
Warehouse | 6,573 | 7,719 | (14.8 | )% | ||||||||
|
|
|
| |||||||||
Total land expense | $ | 144,072 | $ | 142,299 | 1.2 | % | ||||||
|
|
|
| |||||||||
Non-vessel related maintenance expenses increased primarily due to higher fuel costs and contractual rate increases in our offshore locations.
Rolling stock expense increased $2.4 million or 6.3% during the year ended December 25, 2011 versus the year ended December 26, 2010. This increase is primarily related to an increase in the quantity of leased containers and chassis in replacement of our previous equipment sharing arrangements.
Depreciation and Amortization. Depreciation and amortization was $42.9 million during the year ended December 25, 2011 compared to $43.6 million for the year ended December 26, 2010. The decrease in depreciation-owned vessels was due to certain vessel assets becoming fully depreciated and no longer subject to
51
Table of Contents
depreciation expense and the extra week of fiscal 2010. The increase in depreciation and amortization-other was due to an increase in the number of containers and certain improvements made to our leased vessels, partially offset by depreciation recorded during the extra week of 2010. The decrease in amortization of intangible assets was due to the extra week of amortization recorded during 2010.
| Year Ended December 25, 2011 | Year Ended December 26, 2010 | % Change | ||||||||||
| (In thousands) | ||||||||||||
Depreciation and amortization: | ||||||||||||
Depreciation — owned vessels | $ | 9,160 | $ | 10,083 | (9.2 | )% | ||||||
Depreciation and amortization — other | 13,406 | 12,783 | 4.9 | % | ||||||||
Amortization of intangible assets | 20,317 | 20,697 | (1.8 | )% | ||||||||
|
|
|
| |||||||||
Total depreciation and amortization | $ | 42,883 | $ | 43,563 | (1.6 | )% | ||||||
|
|
|
| |||||||||
Amortization of vessel dry-docking | $ | 15,376 | $ | 15,014 | 2.4 | % | ||||||
|
|
|
| |||||||||
Amortization of Vessel Dry-docking. Amortization of vessel dry-docking was $15.4 million during the year ended December 25, 2011 compared to $15.0 million for the year ended December 26, 2010. Amortization of vessel dry-docking fluctuates based on the timing of dry-dockings, the number of dry-dockings that occur during a given period, and the amount of expenditures incurred during the dry-dockings. Dry-dockings generally occur every two and a half years and historically we have dry-docked approximately six vessels per year.
Selling, General and Administrative. Selling, general and administrative costs increased to $82.1 million for the year ended December 25, 2011 compared to $79.9 million for the year ended December 26, 2010, an increase of $2.2 million or 2.7%. This increase is primarily comprised of a $2.3 million charge related to a separation agreement with our former chief executive officer, $1.6 million of costs incurred in connection with the U.S. Coast Guard and U.S. Attorney’s investigation of one of our vessels, partially offset by a $1.3 million reduction in stock-based compensation expense, a $0.4 million decline in legal and professional fees expenses associated with the Department of Justice antitrust investigation and related legal proceedings, and decreases in employee related expenses as a result of our workforce reduction initiative.
Legal Settlements. As discussed in Legal Proceedings, on March 22, 2011, the Court entered a judgment against us whereby we were required to pay a fine of $45.0 million to resolve the investigation by the DOJ. On April 28, 2011, the Court reduced the fine from $45.0 million to $15.0 million payable over five years without interest. During the second quarter of 2011, we reversed $19.2 million of the $30.0 million charge recorded during the year ended December 26, 2010 related to this legal settlement.
In November 2011, we entered into a settlement agreement with all of the remaining significant shippers who opted out of the Puerto Rico direct purchaser antitrust class action settlement. Under the terms of the settlement agreement, we made a payment of $5.8 million during December 2011, and are required to make the second installment payment of $4.0 million on or before June 24, 2012 and the final $4.0 million payment on or before December 24, 2012. We recorded a charge of $12.7 million during the fourth quarter of 2011, which represents the present value of the $13.8 million in installment payments.
In January 2012, we entered into an agreement with the U.S. Department of Justice and pled guilty to two counts of providing federal authorities with false vessel oil record-keeping entries. Pursuant to the agreement and judgment entered by the United States District Court for the Northern District of California, we agreed to pay a fine of $1.0 million and donate an additional $0.5 million to the National Fish & Wildlife Foundation for environmental community service programs. Based on our best estimate at the time, we recorded a charge of $0.5 million related to this investigation during the year ended December 26, 2010. We recorded an additional $1.0 million during the year ended December 25, 2011.
52
Table of Contents
Impairment Charge.We have made payments for the construction of three new cranes which are not yet placed into service. These cranes were initially purchased for use in our Anchorage, Alaska terminal and were expected to be installed and become fully operational in December 2010. However, the Port of Anchorage Intermodal Expansion Project is encountering delays that could continue until 2014 or beyond. As such, at that time, we were marketing these cranes for sale and expected to complete the sale within one year. As a result of the reclassification to assets held for sale during the second quarter of 2011, we recorded an impairment charge of $2.8 million to write down the carrying value of the cranes to their estimated fair value less costs to sell. The impairment charge of $2.7 million recorded during the year ended December 26, 2010 related to certain leased equipment not expected to be deployed during the foreseeable future.
Restructuring Charge. Restructuring costs during the year ended December 26, 2010 included $1.8 million related to severance costs and other costs associated with our 2010 workforce reduction initiative.
Miscellaneous Expense (Income), Net. Miscellaneous expense (income) net increased during 2011 as a result of higher bad debt expense and a $0.7 million gain on the sale of our interest in a joint venture recorded during 2010.
Interest Expense, Net. Interest expense, net of $55.7 million for the year ended December 25, 2011 was higher compared to $40.1 million during the year ended December 26, 2010. This increase was primarily due to higher debt balances outstanding, a rise in interest rates due to the amendment to our prior senior credit facility and the comprehensive refinancing, interest associated with a capital lease, and the accretion of non-cash interest related to our legal settlements.
Income Tax Expense.The effective tax rate for the years ended December 25, 2011 and December 26, 2010 was 0.2% and (1.0)%, respectively. During the second quarter of 2009, we determined that it was unclear as to the timing of when we will generate sufficient taxable income to realize our deferred tax assets. Accordingly, we recorded a valuation allowance against our deferred tax assets. Although we have recorded a valuation allowance against our deferred tax assets, it does not affect our ability to utilize our deferred tax assets to offset future taxable income. Until such time that we determine it is more likely than not that we will generate sufficient taxable income to realize our deferred tax assets, income tax benefits associated with future period losses will be fully reserved. As a result, we do not expect to record a current or deferred tax benefit or expense and only minimal state tax provisions during those periods.
53
Table of Contents
Year Ended December 26, 2010 Compared to Year Ended December 20, 2009
| Year Ended December 26, 2010 | Year Ended December 20, 2009 | % Change | ||||||||||
| (In thousands) | ||||||||||||
Operating revenue | $ | 1,000,055 | $ | 979,352 | 2.1 | % | ||||||
Operating expense: | ||||||||||||
Vessel | 276,351 | 249,821 | 10.6 | % | ||||||||
Marine | 188,086 | 184,730 | 1.8 | % | ||||||||
Inland | 175,394 | 170,743 | 2.7 | % | ||||||||
Land | 142,299 | 136,992 | 3.9 | % | ||||||||
Rolling stock rent | 38,330 | 36,196 | 5.9 | % | ||||||||
|
|
|
| |||||||||
Cost of services | 820,460 | 778,482 | 5.4 | % | ||||||||
|
|
|
| |||||||||
Depreciation and amortization | 43,563 | 43,502 | 0.1 | % | ||||||||
Amortization of vessel dry-docking | 15,014 | 13,686 | 9.7 | % | ||||||||
Selling, general and administrative | 79,930 | 95,766 | (16.5 | )% | ||||||||
Legal settlements | 32,270 | 20,000 | 61.4 | % | ||||||||
Impairment of assets | 2,655 | 1,867 | 42.2 | % | ||||||||
Restructuring costs | 1,843 | 747 | 146.7 | % | ||||||||
Miscellaneous (income) expense, net | (574 | ) | 876 | (165.5 | )% | |||||||
|
|
|
| |||||||||
Total operating expense | 995,161 | 954,926 | 4.2 | % | ||||||||
|
|
|
| |||||||||
Operating income | $ | 4,894 | $ | 24,426 | (80.0 | )% | ||||||
|
|
|
| |||||||||
Operating ratio | 99.5 | % | 97.5 | % | 2.0 | % | ||||||
Revenue containers (units) | 243,575 | 257,625 | (5.5 | )% | ||||||||
Operating Revenue. Operating revenue increased $20.7 million, or 2.1%, during the year ended December 26, 2010. This revenue increase can be attributed to the following factors (in thousands):
Bunker and intermodal fuel surcharges increase | $ | 38,340 | ||
Other non-transportation services revenue increase | 11,883 | |||
Revenue container rate increase | 373 | |||
Revenue container volume decrease | (1,147 | ) | ||
Space charter revenue decreases | (5,997 | ) | ||
Expiration of government vessel management contract | (22,749 | ) | ||
|
| |||
Total operating revenue increase | $ | 20,703 | ||
|
|
Bunker and intermodal fuel surcharges, which are included in our transportation revenue, accounted for approximately 15.8% of total revenue in the year ended December 26, 2010 and approximately 12.3% of total revenue in the year ended December 20, 2009. We adjusted our bunker and intermodal fuel surcharges several times throughout 2010 and 2009 as a result of fluctuations in the cost of fuel for our vessels, in addition to fuel fluctuations passed on to us by our truck, rail, and barge service providers. Fuel surcharges are evaluated regularly as the price of fuel fluctuates, and we may at times incorporate these surcharges into our base transportation rates that we charge. The increase in non-transportation revenue is primarily due to third party terminal services, which was partially offset by the expiration of certain space charter agreements.
Cost of Services. The $42.0 million increase in cost of services is primarily due to higher fuel costs as a result of a rise in fuel prices.
54
Table of Contents
Vessel expense, which is not primarily driven by revenue container volume, increased $26.5 million for the year ended December 26, 2010. This decrease can be attributed to the following factors (in thousands):
Vessel fuel costs increase | $ | 41,433 | ||
Labor and other vessel operating increases | 8,895 | |||
Vessel space and lease charter expense increase | 628 | |||
Government vessel management expense decrease | (24,426 | ) | ||
|
| |||
Total vessel expense increase | $ | 26,530 | ||
|
|
The $41.4 million increase in fuel costs is comprised of a $36.2 million increase due to higher fuel prices and a $5.1 million increase due to higher active vessel operating days as a result of the 53 week fiscal year in 2010 and more dry-dockings during 2010. The increase in labor and other vessel operating expense is primarily due to additional vessel operating expense associated with a higher number of dry-dockings during 2010, contractual rate increases, and the extra week during 2010. We continue to incur labor expenses with the vessel in dry-dock, while also incurring expenses associated with the spare vessel deployed as dry-dock relief. The increase in vessel lease charter expense is due to the extra week during fiscal year 2010.
Marine expense is comprised of the costs incurred to bring vessels into and out of port, and to load and unload containers. The types of costs included in marine expense are stevedoring and associated benefits, pilotage fees, tug fees, government fees, wharfage fees, dockage fees, and line handler fees. The $3.4 million increase in marine expense during the year ended December 26, 2010 was primarily due to increases in multi-employer plan benefit assessments for our west coast union employees, contractual rate increases, and an extra week during fiscal year 2010, partially offset by terminal savings.
Inland expense increased to $175.4 million for the year ended December 26, 2010 compared to $170.7 million during the year ended December 20, 2009. The $4.7 million increase in inland expense is primarily due to higher fuel costs, partially offset by our cost control efforts.
Land expense is comprised of the costs included within the terminal for the handling, maintenance and storage of containers, including yard operations, gate operations, maintenance, warehouse and terminal overhead.
| Year Ended December 26, 2010 | Year Ended December 20, 2009 | % Change | ||||||||||
| (In thousands) | ||||||||||||
Land expense: | ||||||||||||
Maintenance | $ | 53,571 | $ | 48,823 | 9.7 | % | ||||||
Terminal overhead | 52,191 | 51,883 | 0.6 | % | ||||||||
Yard and gate | 28,818 | 28,945 | (0.4 | )% | ||||||||
Warehouse | 7,719 | 7,341 | 5.1 | % | ||||||||
|
|
|
| |||||||||
Total land expense | $ | 142,299 | $ | 136,992 | 3.9 | % | ||||||
|
|
|
| |||||||||
Non-vessel related maintenance expenses increased primarily due to higher fuel costs and contractual rate increases in our offshore locations.
Rolling stock expense increased $2.1 million or 5.9% during the year ended December 26, 2010 as compared to the year ended December 20, 2009. This increase is primarily related to an increase in the quantity of leased containers and chassis in replacement of our previous equipment sharing arrangements.
55
Table of Contents
Depreciation and Amortization. Depreciation and amortization was $43.6 million during the year ended December 26, 2010 compared to $43.5 million for the year ended December 20, 2009.
| Year Ended December 26, 2010 | Year Ended December 20, 2009 | % Change | ||||||||||
| (In thousands) | ||||||||||||
Depreciation and amortization: | ||||||||||||
Depreciation — owned vessels | $ | 10,083 | $ | 9,980 | 1.0 | % | ||||||
Depreciation and amortization — other | 12,783 | 13,217 | (3.3 | )% | ||||||||
Amortization of intangible assets | 20,697 | 20,305 | 1.9 | % | ||||||||
|
|
|
| |||||||||
Total depreciation and amortization | $ | 43,563 | $ | 43,502 | 0.1 | % | ||||||
|
|
|
| |||||||||
Amortization of vessel dry-docking | $ | 15,014 | $ | 13,686 | 9.7 | % | ||||||
|
|
|
| |||||||||
The increase in depreciation-owned vessels and amortization of intangible assets is due to additional depreciation and amortization expense recorded during the extra week of fiscal 2010. The decrease in depreciation and amortization-other is due to certain capitalized software assets becoming fully depreciated and no longer subject to depreciation expense, partially offset by additional depreciation expense recorded as a result of an extra week during fiscal year in 2010 and an increase in the number of containers.
Amortization of Vessel Dry-docking. Amortization of vessel dry-docking was $15.0 million during the year ended December 26, 2010 compared to $13.7 million for the year ended December 20, 2009. Amortization of vessel dry-docking fluctuates based on the timing of dry-dockings, the number of dry-dockings that occur during a given period, and the amount of expenditures incurred during the dry-dockings. Dry-dockings generally occur every two and a half years and historically we have dry-docked approximately six vessels per year.
Selling, General and Administrative. Selling, general and administrative costs decreased to $79.9 million for the year ended December 26, 2010 compared to $95.8 million for the year ended December 20, 2009, a decline of $15.8 million or 16.5%. This decrease is primarily comprised of a $6.9 million decline in legal and professional expenses associated with the Department of Justice antitrust investigation and related legal proceedings, a $5.4 million decrease in the accrual related to our performance incentive plan, a $1.0 million reduction in stock-based compensation, and $1.7 million in savings related to our cost control efforts, including a reduction in professional fees, travel and entertainment, meetings and seminars, charitable contributions, advertising, and the elimination of certain perquisites for our executive officers.
Legal Settlements.We entered into a plea agreement, dated February 23, 2011, with the United States of America, and we agreed to plead guilty to a charge of violating federal antitrust laws solely with respect to the Puerto Rico tradelane. We agreed to pay a fine of $45.0 million over five years without interest. In 2010, we recorded a charge of $30.0 million, which represented the present value of the expected installment payments. On April 28, 2011, the U.S. District Court for the District of Puerto Rico amended the fine imposed on us by reducing the amount from $45.0 million to $15.0 million. As a result, we reversed $19.2 million of the $30.0 million charge recorded during the year ended December 26, 2010, related to the reduction in this legal settlement.
On March 31, 2011, we entered into a settlement agreement with the Commonwealth of Puerto Rico and the named plaintiffs, individually and representing the indirect purchasers, to resolve antitrust claims relating to the Puerto Rico trade. Pursuant to the Settlement Agreement, each of the defendants will pay a one-third share of the total settlement amount of $5.3 million. Accordingly, we recorded a charge of $1.8 million as our share of the settlement amount during the year ended December 26, 2010, and paid this liability during the year ended December 25, 20111.
In January 2012, we entered into an agreement with the U.S. Department of Justice and pled guilty to two counts of providing federal authorities with false vessel oil record-keeping entries. Pursuant to the agreement and judgment entered by the United States District Court for the Northern District of California, we agreed to pay a
56
Table of Contents
fine of $1.0 million and donate an additional $0.5 million to the National Fish & Wildlife Foundation for environmental community service programs. Based on our best estimate at the time, we recorded a charge of $0.5 million related to this investigation during the year ended December 26, 2010. We recorded an additional $1.0 million during the year ended December 25, 2011.
On June 11, 2009, we entered into a settlement agreement with the plaintiffs in the Puerto Rico MDL. As a result of the settlement agreement, we recorded a charge of $20.0 million during the year ended December 20, 2009. Under the settlement agreement, we agreed to pay $20.0 million and to certain base-rate freezes, to resolve claims for alleged antitrust violations in the Puerto Rico tradelane.
Impairment Charge.Impairment of assets of $2.7 million during the year ended December 26, 2010 related to certain owned and leased equipment. Impairment of assets of $1.9 million during the year ended December 20, 2009 related to a write-down of the carrying value of our spare vessels.
Restructuring Charge.Restructuring costs during the year ended December 26, 2010 included $1.8 million related to severance costs and other costs associated with our 2010 workforce reduction initiative. Restructuring costs of $0.7 million during the year ended December 20, 2009 included $0.6 million and $0.1 million related to severance costs and other costs associated with our 2008 workforce reduction initiative, respectively.
Miscellaneous (Income) Expense, Net. Miscellaneous (income) expense, net during 2010 includes a $0.7 million gain on the sale of our interest in a joint venture. In addition, bad debt expense decreased $1.2 million during the year ended December 26, 2010 as compared to the year ended December 20, 2009.
Interest Expense, Net. Interest expense, net of $40.1 million for the year ended December 26, 2010 was higher compared to $38.0 million during the year ended December 20, 2009. The increase in interest expense was due to higher interest rates payable on the outstanding debt as a result of the June 2009 amendment to our Senior Credit Facility.
Income Tax Expense.The effective tax rate for the years ended December 26, 2010 and December 20, 2009 was (1.0)% and (77.3)%, respectively. During the second quarter of 2009, we determined that it was unclear as to the timing of when we will generate sufficient taxable income to realize our deferred tax assets. Accordingly, we recorded a valuation allowance against our deferred tax assets. Although we have recorded a valuation allowance against our deferred tax assets, it does not affect our ability to utilize our deferred tax assets to offset future taxable income. Until such time that we determine it is more likely than not that we will generate sufficient taxable income to realize our deferred tax assets, income tax benefits associated with future period losses will be fully reserved. As a result, we do not expect to record a current or deferred tax benefit or expense and only minimal state tax provisions during those periods.
Liquidity and Capital Resources
Our principal sources of funds have been (i) earnings before non-cash charges and (ii) borrowings under debt arrangements. Our principal uses of funds have been (i) capital expenditures on our container fleet, our terminal operating equipment, improvements to our owned and leased vessel fleet, and our information technology systems, (ii) vessel dry-docking expenditures, (iii) working capital consumption, (iv) principal and interest payments on our existing indebtedness, and (v) dividend payments to our common stockholders during 2010 and 2009. Cash totaled $21.1 million at December 25, 2011. As of December 25, 2011, there were no outstanding borrowings under the ABL Facility and total unused borrowing capacity was $52.9 million.
57
Table of Contents
Operating Activities
Net cash used in operating activities was $11.5 million for the year ended December 25, 2011 compared to cash provided by operating activities of $53.4 million for the year ended December 26, 2010. During 2011, liquidity contracted significantly due to reduced credit limits and shortened payment terms established by certain suppliers. The decrease in cash provided by operating activities is primarily due to the following (in thousands):
Decrease in earnings adjusted for non-cash charges | $ | (40,775 | ) | |
Increase in accounts receivable | (12,653 | ) | ||
Increase in payments related to Department of Justice antitrust investigation and related legal proceedings | (13,567 | ) | ||
Decrease in accounts payable | (9,364 | ) | ||
Increase in payments related to restructuring and early termination of leased assets | (2,898 | ) | ||
Decrease in payments related to dry-dockings | 6,563 | |||
Decrease in vessel rent payment in excess of accrual | 10,681 | |||
Other decrease in working capital, net | (2,880 | ) | ||
|
| |||
| $ | (64,893 | ) | ||
|
|
Net cash provided by operating activities decreased by $9.6 million to $53.4 million for the year ended December 26, 2010 from $63.0 million for the year ended December 20, 2009. Net earnings adjusted for depreciation, amortization, deferred income taxes, accretion and other non-cash operating activities, which includes non-cash stock-based compensation expense, resulted in cash flow generation of $45.2 million for the year ended December 26, 2010 compared to $64.1 million for the year ended December 20, 2009, a decrease of $18.9 million. The decrease in cash provided by operating activities during 2010 resulting from an increase in dry-docking payments and our accounts receivable balance was offset by increases in accounts payable, materials and supplies and other accrued liabilities.
Investing Activities
Net cash used in investing activities was $12.8 million for the year ended December 25, 2011 compared to $14.4 million for the year ended December 26, 2010. The decrease is primarily related to a $0.9 million decline in capital spending and a $1.8 increase in proceeds from the sale of equipment, partially offset by proceeds of $1.1 million received during 2010 as a result of the sale of our interest in a joint venture.
Net cash used in investing activities was $14.4 million for the year ended December 26, 2010 compared to $8.5 million for the year ended December 20, 2009. The increase is primarily related to a $6.2 million increase in capital spending and a $0.8 decrease in proceeds from the sale of equipment, partially offset by proceeds of $1.1 million received as a result of the sale of our interest in a joint venture.
Financing Activities
Net cash provided by financing activities during the year ended December 25, 2011 was $94.0 million compared to cash used in financing activities of $25.1 million for the year ended December 26, 2010. The net cash provided by financing activities during the year ended December 25, 2011 included the issuance of the First and Second Lien Notes and the repayment of the Senior Credit Facility. In addition, during the year ended December 25, 2011, we paid $35.6 million in financing costs related to fees associated with our comprehensive refinancing and $1.6 million related to a capital lease.
Net cash used in financing activities during the year ended December 26, 2010 was $25.1 million compared to $44.8 million for the year ended December 20, 2009. The net cash used in financing activities during the year ended December 26, 2010 included $18.8 million of net debt repayments and $6.3 million of dividends to stockholders. In addition, during the year ended December 20, 2009, we paid $3.5 million in financing costs related to fees associated with the amendment to the Senior Credit Facility.
58
Table of Contents
Capital Requirements and Liquidity
Based upon our current level of operations, as well as the recent restructuring of our debt and resolution of the lease obligations related to the vessels that served our FSX service, we believe cash flow from operations and available cash, together with borrowings available under the ABL Facility, will be adequate to meet our liquidity needs throughout 2012.
During 2012, we expect to spend approximately $24.0 million and $18.0 million on capital expenditures and dry-docking expenditures, respectively. Such capital expenditures will include vessel modifications, rolling stock, and terminal infrastructure and equipment. We expect to dry-dock three of the vessels utilized in our Puerto Rico tradelane in China during 2012. Despite the significantly higher transit costs to get to Asia, we expect these dry-dockings will enable us to make high quality cargo modifications and other enhancements to our core Puerto Rico fleet that will be instrumental in ensuring service integrity for our customers. In addition, we plan to utilize the cranes previously intended for Anchorage in our Hawaii terminal, and approximately $4.0 million of the expected capital expenditures relates to these cranes.
We also expect to spend approximately $7.5 million during 2012 for legal settlements and legal expenses associated with the DOJ investigation and related antitrust legal matters, as well as approximately $17.0 million specifically related to the shutdown of our FSX service. The $17.0 million of FSX shutdown costs includes equipment per diem and termination charges, crew severance, other employee severance, and certain other overhead related expenses. We incurred approximately $12.0 million of shut down costs in 2011. Slightly offsetting these shut down costs is approximately $7.5 million of expected inflows for the sale of terminal related equipment previously utilized in our Guam market. In addition, during the first quarter of 2012, we paid a total of approximately $9.0 million related to lease expense and lay-up costs for the vessels no longer in use. Further, we expect to reimburse SFL approximately $1.5 million during 2012 for their reasonable costs and expenses incurred in connection with the resolution of these vessel lease obligations.
We also expect to utilize cash flows to make interest payments and to pay financing fees associated with the restructuring transactions. Due to the seasonality within our business and the above mentioned payments and expenses, we will utilize borrowings under the ABL Facility throughout 2012.
59
Table of Contents
Contractual Obligations and Off-Balance Sheet Arrangements
Contractual obligations as of December 25, 2011 are as follows (in thousands):
| Total Obligations | 2012 | 2013-2014 | 2015-2016 | Thereafter | ||||||||||||||||
Principal and operating lease obligations: | ||||||||||||||||||||
6.00% convertible senior notes(1) | $ | 278,096 | $ | — | $ | — | $ | — | $ | 278,096 | ||||||||||
First lien notes | 225,000 | 2,250 | 4,500 | 218,250 | — | |||||||||||||||
Second lien notes | 100,000 | — | — | 100,000 | — | |||||||||||||||
4.25% convertible senior notes | 2,244 | 2,244 | — | — | — | |||||||||||||||
Operating leases(2) | 558,825 | 121,036 | 216,910 | 125,806 | 95,073 | |||||||||||||||
Capital lease | 7,530 | 1,646 | 2,045 | 2,507 | 1,332 | |||||||||||||||
|
|
|
|
|
|
|
|
|
| |||||||||||
Subtotal | 1,171,695 | 127,176 | 223,455 | 446,563 | 374,501 | |||||||||||||||
|
|
|
|
|
|
|
|
|
| |||||||||||
Interest obligations: | ||||||||||||||||||||
6.00% convertible senior notes(1) | 92,236 | 17,149 | 33,372 | 33,372 | 8,343 | |||||||||||||||
First lien notes(3) | 121,964 | 25,438 | 48,758 | 47,768 | — | |||||||||||||||
Second lien notes(3)(4) | 65,361 | 13,361 | 26,000 | 26,000 | — | |||||||||||||||
4.25% convertible senior notes | 95 | 95 | — | — | — | |||||||||||||||
Capital lease | 2,305 | 685 | 1,007 | 545 | 68 | |||||||||||||||
|
|
|
|
|
|
|
|
|
| |||||||||||
Subtotal | 281,961 | 56,728 | 109,137 | 107,685 | 8,411 | |||||||||||||||
|
|
|
|
|
|
|
|
|
| |||||||||||
Legal settlements | 23,500 | 5,500 | 10,000 | 8,000 | — | |||||||||||||||
Other commitments(5) | 15,665 | 9,848 | 1,532 | 4,285 | — | |||||||||||||||
|
|
|
|
|
|
|
|
|
| |||||||||||
Total obligations | $ | 1,492,821 | $ | 199,252 | $ | 344,124 | $ | 566,533 | $ | 382,912 | ||||||||||
|
|
|
|
|
|
|
|
|
| |||||||||||
Standby letters of credit | $ | 19,626 | $ | 19,626 | $ | — | $ | — | $ | — | ||||||||||
|
|
|
|
|
|
|
|
|
| |||||||||||
| (1) | On January 4, 2012, we completed the mandatory debt-to-equity conversion of approximately $49.7 million of the Series B Notes. Under the terms of the recapitalization plan, we mandatorily converted approximately $49.7 million of the Series B Notes at a conversion rate of 54.7196 shares of common stock (reflecting the 1-for-25 reverse stock split of our common stock effective December 7, 2011) per $1,000 principal amount of Series B Notes. Approximately $18.5 million of the Series B Notes were converted into 1.0 million shares of common stock with the remainder being converted into warrants exercisable into 1.7 million shares of common stock. See “Recent Developments” for additional details related to the conversion of the remaining outstanding Series A Notes and Series B Notes. |
| (2) | Includes obligations related to the five vessels leased from Ship Finance Limited. As a result of the shutdown of the Guam/FSX service, these vessels are currently not being utilized. We have entered into an agreement with SFL to terminate the leases associated with these vessels. See “Recent Developments” for more details. |
| (3) | Does not reflect additional interest expense should we fail to file an effective registration statement for first and second lien notes by July 31, 2012. Such additional interest expense would equal 0.25% per annum every 90 days provided that such increases would not, in total, exceed 1.0% in annum. |
| (4) | The second lien notes bear interest at a rate of either: (i) 13% per annum, payable semi-annually in cash in arrears; (ii) 14% per annum, 50% of which payable semi-annually in cash in arrears and 50% payable in kind; or (iii) 15% per annum payable in kind, payable semiannually. The table above reflects interest obligations under the second lien notes at 13% per annum. |
| (5) | Other commitments includes the purchase commitment related to the three new cranes and restructuring liabilities. |
We are not a party to any off-balance sheet arrangements that have, or are reasonably likely to have, a current or future effect on our financial condition, revenues or expenses, results of operations, liquidity, capital expenditures or capital resources that are material to investors.
60
Table of Contents
Long-Term Debt
On October 5, 2011, we completed an offer to exchange $327.8 million in aggregate principal amount of our 4.25% Convertible Senior Notes due 2012 (the “4.25% Notes”), representing 99.3% of the aggregate principal amount of the 4.25% Notes outstanding, for (i) 1.0 million shares of our common stock, (ii) warrants to purchase 1.0 million shares of our common stock (the “Warrants”) and (iii) $178.8 million in aggregate principal amount of new 6.00% Series A Convertible Senior Secured Notes due 2017 (the “Series A Notes”) and $99.3 million in aggregate principal amount of new 6.00% Series B Mandatorily Convertible Senior Secured Notes (the “Series B Notes” and, together with the Series A Notes, the “6.00% Convertible Notes”).
Concurrently with the exchange offer, we obtained consents from the participating holders and entered into a supplemental indenture to the indenture governing the 4.25% Notes in connection with certain amendments to eliminate or amend substantially all of the restrictive covenants, and modify certain of the events of default and various other provisions.
Concurrently with the consummation of the exchange offer, Horizon Lines, LLC issued (i) $225.0 million aggregate principal amount of new 11.00% First Lien Senior Secured Notes due 2016 (the “First Lien Notes”) and (ii) $100.0 million of new 13.00%-15.00% Second Lien Senior Secured Notes due 2016 (the “Second Lien Notes”). Horizon Lines, LLC also entered into a new $100.0 million asset-based revolving credit facility (the “ABL Facility”) at the consummation of the exchange offer.
We used proceeds of $266.5 million to repay existing borrowings and accrued interest under the Senior Credit Facility, $1.9 million of accrued interest under the 4.25% Notes, and $15.4 million for fees and refinancing related expenses. We received the remaining proceeds of $16.2 million.
See Recent Developments for additional details related to the mandatory conversion of Series B Notes in January 2012 and the conversion of the remaining Series A Notes & Series B Notes in April 2012.
6.00% Convertible Notes
On October 5, 2011, we issued $278.1 million aggregate principal amount of 6.00% Convertible Notes due 2017. The Series A Notes and the Series B Notes are each fully and unconditionally guaranteed by all of our domestic subsidiaries (collectively, the “Notes Guarantors”). The New Notes were issued pursuant to an indenture, which we and the Guarantors entered into with U.S. Bank National Association, as trustee and collateral agent, on October 5, 2011 (the “New Notes Indenture”).
The 6.00% Convertible Notes will bear interest at a rate of 6.00% per annum, payable semi-annually. The Series A Notes will mature on April 15, 2017 and are convertible, at the option of the holders, and at our option under certain circumstances, including listing of our shares on either the NYSE or NASDAQ stock markets, beginning on the one-year anniversary of the issuance of the Series A Notes, into shares of our common stock or Warrants, as the case may be.
The Series A Notes are convertible into shares of our common stock at a conversion rate equal to 88.9855 shares of common stock per $1,000 principal amount of Series A Notes, Beginning on October 5, 2012, we will have the option to convert all or any portion of the outstanding Series A Notes, upon not more than 60 days and not less than 20 days prior notice to noteholders; provided that (i) our common stock is listed on either the New York Stock Exchange or the NASDAQ Stock Market and (ii) the 30 trading day volume weighted average price for our common stock for the 30-day period ending on the trading day preceding the date of such notice is equal to or greater than $15.75 per share. Upon conversion, foreign holders may, under certain conditions, receive Warrants in lieu of shares of common stock.
The Series B Notes are mandatorily convertible into shares of our common stock at a conversion rate equal to 54.7196 shares of common stock per $1,000 principal amount of Series B Notes, subject to the conditions that our common stock is then listed on the New York Stock Exchange or the NASDAQ Stock Market and that we are not in default under our debt obligations. The Series B Notes are mandatorily convertible into shares of our
61
Table of Contents
common stock or Warrants, as the case may be, in two equal installments of $49.7 million each on the three-month and nine-month anniversaries of the consummation of the exchange offer. As such, on January 4, 2012, approximately $49.7 million of the Series B Notes were mandatorily converted into shares of common stock or warrants. Approximately $18.5 million of the Series B Notes were converted into 1.0 million shares of common stock with the remainder being converted into warrants exercisable into 1.7 million shares of common stock. The distribution of common stock and warrants was based upon the U.S. citizenship verifications of the holders of the Series B Notes. The remaining outstanding Series B Notes will be automatically converted into Series A Notes on the one-year anniversary of the issuance of the new notes if we are unable to effect one or both of the mandatory conversions prior to such date.
The conversion rate of the Series A Notes and Series B Notes may be increased in certain circumstances to compensate the holders thereof for the loss of the time value of the conversion right (i) if at any time our common stock or the common stock into which the new notes may be converted is greater than or equal to $11.25 per share and is not listed on the New York Stock Exchange or the NASDAQ Stock Market or (ii) if a change of control occurs, unless at least 90% of the consideration received or to be received by holders of common stock, excluding cash payments for fractional shares, in connection with the transaction or transactions constituting the change of control, consists of shares of common stock, American Depositary Receipts or American Depositary Shares traded on a national securities exchange in the United States or which will be so traded or quoted when issued or exchanged in connection with such change of control. Upon a change of control, holders will have the right to require us to repurchase for cash the outstanding Series A Notes and Series B Notes at 101% of the aggregate principal amount, plus accrued and unpaid interest.
The long-term debt and embedded conversion options associated with the Series A Notes and Series B Notes were recorded on our balance sheet at their fair value on October 5, 2011. Fair value of the Series A Notes was calculated using a trinomial lattice convertible bond valuation model which incorporated the terms and conditions of the Series A Notes. One of the inputs to the trinomial lattice model is the bond yield of a hypothetical note identical to the Series A Notes, excluding the conversion feature and its related make-whole provision. The trinomial lattice model produces an estimated fair value based on the assumed changes in prices of the underlying equity over successive periods of time. The Series B Notes were valued using a Monte-Carlo simulation to estimate the probability of conversion. The probability of equity conversion is multiplied by the common stock price as of the valuation date. The estimation of the probability was performed by using a Monte-Carlo simulation in order to estimate a range of simulated future market capitalization over the conversion term. For each equity path, our daily stock price is considered to follow a Geometric Brownian Motion with a drift equal to the cost of equity. On October 5, 2011, the fair value of the long-term debt portion of the Series A Notes and Series B Notes was $105.6 million and $58.6 million, respectively. The original issue discounts are being amortized through interest expense through the maturity of the Series A and Series B Notes.
On October 5, 2011, the fair value of the embedded conversion option within the Series A and the Series B Notes totaled $98.5 million. To calculate the fair value of the embedded derivatives, a “with” and “without” scenario comparison was used. The methodology used to value the Series A Notes and Series B Notes constitute the “with” scenarios. The “without” scenario was estimated as a bond paying the same coupon payments as the securities without any conversion features. The fair value of the embedded conversion option was estimated as the difference between the two scenarios. At each fiscal quarter end, we are required to mark-to-market these embedded conversion options. On December 25, 2011, the fair value of the embedded conversion options was $14.0 million. The $84.5 million decrease from the fair value on October 5, 2011 was recorded within other expense (income) on the Consolidated Statements of Operations.
Warrants
The Warrants were issued pursuant to a warrant agreement, which we entered into with The Bank of New York Mellon Trust Company, N.A, as warrant agent, on October 5, 2011, as amended by Amendment No. 1 as of December 7, 2011 (the “Warrant Agreement”). Pursuant to the Warrant Agreement, each Warrant entitles the holder to purchase common stock at a price of $0.01 per share, subject to adjustment in certain circumstances.
62
Table of Contents
Upon issuance, in lieu of payment of the exercise price, a Warrant holder will have the right (but not the obligation) to require us to convert its Warrants, in whole or in part, into shares of our common stock, without any required payment or request that we withhold, from the shares of common stock that would otherwise be delivered to such Warrant holder, shares issuable upon exercise of the Warrants equal in value to the aggregate exercise price.
Warrant holders will not be permitted to exercise or convert their Warrants if and to the extent the shares of common stock issuable upon exercise or conversion would constitute “excess shares” (as defined in our certificate of incorporation) if they were issued. In addition, a Warrant holder who cannot establish to our reasonable satisfaction that it (or, if not the holder, the person that the holder has designated to receive the common stock upon exercise or conversion) is a United States citizen, will not be permitted to exercise or convert its Warrants to the extent the receipt of the common stock upon exercise or conversion would cause such person or any person whose ownership position would be aggregated with that of such person to exceed 4.9% of our outstanding common stock.
The Warrants contain no provisions allowing us to force redemption and we have no conditional obligation to redeem or convert the warrants. Each Warrant is convertible into an equal number of shares of our common stock at an exercise price of $0.01 per share, which we have the option to waive. In addition, we have sufficient authorized and unissued shares available to settle the Warrants during the maximum period the Warrants could remain outstanding. As a result, the Warrants do not meet the definition of an asset or liability and were classified as equity on the date of issuance. The warrants will be evaluated on a continuous basis to determine if equity classification continues to be appropriate.
First Lien Secured Notes
The First Lien Notes were issued pursuant to an indenture on October 5, 2011. The First Lien Notes bear interest at a rate of 11.0% per annum, payable semiannually, beginning on April 15, 2012 and mature on October 15, 2016. The First Lien Notes are callable at 101.5% of their aggregate principal amount, plus accrued and unpaid interest in the first year after their issuance and at par plus accrued and unpaid interest thereafter. We are obligated to make mandatory prepayments on an annual basis of 1%.
The First Lien Notes are secured by a first priority lien on all Secured Notes Priority Collateral and a second priority lien on all ABL Priority Collateral (each as defined below). The First Lien Secured Notes contain affirmative and negative covenants which are typical for senior secured high-yield notes with no maintenance based covenants. The First Lien Secured Notes contain other covenants, including: change of control put at 101% (subject to a permitted holder exception); limitation on asset sales; limitation on incurrence of indebtedness and preferred stock; limitation on restricted payments; limitation on restricted investments; limitation on liens; limitation on dividend blockers; limitation on affiliate transactions; limitation on sale/leaseback transactions; limitation on guarantees by restricted subsidiaries; and limitation on mergers, consolidations and sales of all/substantially all of our assets. These covenants are subject to certain exceptions and qualifications.
On October 5, 2011, the fair value of the First Lien Notes was $228.4 million, which reflects our ability to call the First Lien Notes at 101.5% during the first year and at par thereafter. The original issue premium is being amortized through interest expense through the maturity of the First Lien Notes.
We entered into a registration rights agreement with the purchasers of the First Lien Notes, which was amended on April 3, 2012. We are obligated to complete an A/B Exchange Offer as soon as practicable but in no event later than 300 days after the issuance of the First Lien Notes. If we do not complete the A/B Exchange Offer within the 300 day period, this will result in a registration default and 0.25% of additional interest per 90 days of registration default will be added to the interest payable on the First Lien Notes, up to a maximum of 1.00% of additional interest.
63
Table of Contents
Second Lien Secured Notes
On October 5, 2011, we completed the sale of $100.0 million aggregate principal amount of our Second Lien Notes. The Second Lien Notes are fully and unconditionally guaranteed by the notes guarantors. The proceeds from the First Lien Notes and the Second Lien Notes were used, among other things, to satisfy in full our obligations outstanding under our previous first-lien revolving credit facility and term loan, which totaled $265.0 million on October 5, 2011.
The Second Lien Notes bear interest at a rate of either: (i) 13% per annum, payable semi-annually in cash in arrears; (ii) 14% per annum, 50% of which payable semi-annually in cash in arrears and 50% payable in kind; or (iii) 15% per annum payable in kind, payable semiannually, beginning on April 15, 2012, and mature on October 15, 2016. The Second Lien Notes are non-callable for 2 years from the date of their issuance, and thereafter the Second Lien Notes will be callable at (i) 106% of their aggregate principal amount, plus accrued and unpaid interest thereon in the third year, (ii) 103% of their aggregate principal amount, plus accrued and unpaid interest thereon in the fourth year, and (iii) at par plus accrued and unpaid interest thereafter.
The Second Lien Notes contain affirmative and negative covenants which are typical for senior secured high-yield notes with no maintenance based covenants. The Second Lien Notes contain other covenants, including: change of control put at 101% (subject to a permitted holder exception); limitation on asset sales; limitation on incurrence of indebtedness and preferred stock; limitation on restricted payments; limitation on restricted investments; limitation on liens; limitation on dividend blockers; limitation on affiliate transactions; limitation on sale/leaseback transactions; limitation on guarantees by restricted subsidiaries; and limitation on mergers, consolidations and sales of all/substantially all of our assets. These covenants are subject to certain exceptions and qualifications.
On October 5, 2011, the fair value of the Second Lien Notes was $96.6 million. The original issue discount is being amortized through interest expense through the maturity of the Second Lien Notes.
We entered into a registration rights agreement with the purchasers of the Second Lien Notes, which was amended April 3, 2012. We are obligated to complete an A/B Exchange Offer as soon as practicable but in no event later than 300 days after the issuance of the Second Lien Notes. If we do not complete the A/B Exchange Offer within the 300 day period, this will result in a registration default and 0.25% of additional interest per 90 days of registration default will be added to the interest payable on the Second Lien Notes, up to a maximum of 1.00% of additional interest.
ABL Facility
On October 5, 2011, we entered into a $100.0 million asset-based revolving credit facility (the “ABL Facility”) with Wells Fargo Capital Finance, LLC (“Wells Fargo”). Use of the ABL Facility is subject to compliance with a customary borrowing base limitation. The ABL Facility includes an up to $30.0 million letter of credit sub-facility and a swingline sub-facility up to $15.0 million, with Wells Fargo serving as administrative agent and collateral agent. We have the option to request increases in the maximum commitment under the ABL Facility by up to $25 million in the aggregate; however, such incremental facility increases have not been committed to in advance. The ABL Facility was used on the closing date for the rollover of certain issued and outstanding letters of credit and thereafter will be used by us for working capital and other general corporate purposes.
The ABL Facility matures October 5, 2016 (but 90 days earlier if the First Lien Notes and the Second Lien Notes are not repaid or refinanced as of such date). The interest rate on the ABL Facility is LIBOR or a base rate plus an applicable margin based on leverage and excess availability ranging from (i) 1.25% to 2.75%, in the case of base rate loans and (ii) 2.25% to 3.75%, in the case of LIBOR loans. A fee ranging from .375% to .50% per annum will accrue on unutilized commitments under the ABL Facility. As of December 25, 2011, there were no outstanding borrowings under the ABL Facility and total unused borrowing capacity was $52.9 million.
64
Table of Contents
The ABL Facility is secured by (i) a first priority lien on our interest in accounts receivable, deposit accounts, securities accounts, investment property (other than equity interests of the subsidiaries and joint ventures) and cash, in each case with certain exceptions and (ii) a fourth priority lien on all or substantially all other of our assets securing the First Lien Notes, the Second Lien Notes and the 6.00% Convertible Notes.
The ABL Facility requires compliance with a minimum fixed charge coverage ratio test if excess availability is less than the greater of (i) $12.5 million and (ii) 12.5% of the maximum commitment under the ABL Facility. In addition, the ABL Facility includes certain customary negative covenants that, subject to certain materiality thresholds, baskets and other agreed upon exceptions and qualifications, will limit, among other things, indebtedness, liens, asset sales and other dispositions, mergers, liquidations, dissolutions and other fundamental changes, investments and acquisitions, dividends, distributions on equity or redemptions and repurchases of capital stock, transactions with affiliates, repayments of certain debt, conduct of business and change of control. The ABL Facility also contains certain customary representations and warranties, affirmative covenants and events of default, as well as provisions requiring compliance with applicable citizenship requirements of the Jones Act.
4.25% Convertible Senior Notes
On August 8, 2007, we issued the 4.25% Convertible Notes. As mentioned above, on October 5, 2011, we completed an offer to exchange $327.8 million in aggregate principal amount of our 4.25% Convertible Notes, representing 99.3% of the aggregate principal amount, for shares of its common stock, warrants to purchase shares of its common stock, and the 6.00% Convertible Notes.
The remaining 4.25% Convertible Notes are our general unsecured obligations and rank equally in right of payment with all of our other existing and future obligations that are unsecured and unsubordinated. The 4.25% Convertible Notes bear interest at the rate of 4.25% per annum, which is payable in cash semi-annually on February 15 and August 15 of each year. The Notes mature on August 15, 2012.
Senior Credit Facility
On August 8, 2007, we entered into a credit agreement (the “Senior Credit Facility”) secured by substantially all of our owned assets. On October 5, 2011, in connection with our comprehensive recapitalization plan, the Senior Credit Facility was terminated. We utilized a portion of the proceeds received as part of the refinancing transaction to pay $75.0 million on the term loan and $190.0 million on the revolving credit facility.
Goodwill
We review our goodwill, intangible assets and long-lived assets for impairment whenever events or changes in circumstances indicate that the carrying amounts of these assets may not be recoverable, and also review goodwill annually. During the third quarter of 2011, due to qualitative and quantitative indicators including the expected shutdown of the FSX service and a deterioration in earnings, we reviewed goodwill for impairment. A discounted cash flow model was used to derive the fair value of the reporting unit. The step one analysis indicating that the carrying value of the reporting unit exceeds the fair value of the reporting unit resulted in the need to perform step two. We recorded an estimated goodwill impairment charge of $117.5 million in the fiscal third quarter ended September 25, 2011. The impairment charge represented our best estimate of the interim goodwill impairment. We recorded an estimated charge, because we had not yet completed our interim goodwill impairment analysis due to complexities involved in determining the implied fair value of its goodwill. We completed the interim goodwill impairment analysis during the fourth quarter of 2011 and recorded an adjustment to decrease the estimated goodwill impairment charge by $2.2 million. As of December 25, 2011, the carrying value of goodwill was $198.8 million. Earnings estimated to be generated are expected to support the carrying value of goodwill.
65
Table of Contents
Performance Metrics
In addition to EBITDA and Adjusted EBITDA, we use various other non-GAAP measures such as adjusted net income, and adjusted net income per share. We believe that in addition to GAAP based financial information, the non-GAAP amounts presented below are meaningful disclosures for the following reasons: (i) each are components of the measure used by our board of directors and management team to evaluate our operating performance, (ii) each are components of the measure used by our management team to make day-to-day operating decisions, (iii) each are components of the measures used by our management to facilitate internal comparisons to competitors’ results and the marine container shipping and logistics industry in general, (iv) results excluding certain costs and expenses provide useful information for the understanding of the ongoing operations with the impact of significant special items, and (v) the payment of discretionary bonuses to certain members of our management is contingent upon, among other things, the satisfaction by Horizon Lines of certain targets, which contain the non-GAAP measures as components. We acknowledge that there are limitations when using non-GAAP measures. The measures below are not recognized terms under GAAP and do not purport to be an alternative to net income as a measure of operating performance or to cash flows from operating activities as a measure of liquidity. Similar to the amounts presented for EBITDA and Adjusted EBITDA, because all companies do not use identical calculations, the amounts below may not be comparable to other similarly titled measures of other companies.
The tables below present a reconciliation of net loss to adjusted net (loss) income and net loss per share to adjusted net (loss) income per share (in thousands, except per share amounts):
| Fiscal Years Ended | ||||||||||||
| December 25, 2011 | December 26, 2010 | December 20, 2009 | ||||||||||
Net loss | $ | (229,417 | ) | $ | (57,969 | ) | $ | (31,272 | ) | |||
Net loss from discontinued operations | (176,223 | ) | (22,395 | ) | (7,021 | ) | ||||||
|
|
|
|
|
| |||||||
Net loss from continuing operations | (53,194 | ) | (35,574 | ) | (24,251 | ) | ||||||
Adjustments: | ||||||||||||
Goodwill impairment | 115,356 | — | — | |||||||||
Anti-trust legal expenses | 4,480 | 5,243 | 12,192 | |||||||||
Union/other severance charge | 3,470 | 542 | 306 | |||||||||
Impairment charge | 2,997 | 2,655 | 1,867 | |||||||||
Accretion of legal settlement | 810 | — | — | |||||||||
Legal settlements and contingencies | (5,483 | ) | 32,270 | 20,000 | ||||||||
Restructuring charge | — | 1,843 | 747 | |||||||||
(Gain) loss on extinguishment /modification of debt and other refinancing costs | (15,112 | ) | — | 50 | ||||||||
Gain on change in value of debt conversion features | �� | (84,480 | ) | — | — | |||||||
Tax valuation allowance | — | — | 10,561 | |||||||||
Tax impact of adjustments | (717 | ) | (369 | ) | (246 | ) | ||||||
|
|
|
|
|
| |||||||
Total adjustments | 21,321 | 42,184 | 45,477 | |||||||||
|
|
|
|
|
| |||||||
Adjusted net (loss) income | $ | (31,873 | ) | $ | 6,610 | $ | 21,226 | |||||
|
|
|
|
|
| |||||||
66
Table of Contents
| Fiscal Years Ended | ||||||||||||
| December 25, 2011 | December 26, 2010 | December 20, 2009 | ||||||||||
Net loss per share | $ | (156.70 | ) | $ | (47.28 | ) | $ | (25.87 | ) | |||
Net loss per share from discontinued operations | (120.37 | ) | (18.27 | ) | (5.81 | ) | ||||||
|
|
|
|
|
| |||||||
Net loss per share from continuing operations | (36.33 | ) | (29.01 | ) | (20.06 | ) | ||||||
Adjustments: | ||||||||||||
Goodwill impairment | 78.80 | — | — | |||||||||
Anti-trust legal expenses | 3.06 | 4.28 | 10.08 | |||||||||
Union/other severance charge | 2.37 | 0.44 | 0.25 | |||||||||
Impairment charge | 2.05 | 2.17 | 1.54 | |||||||||
Accretion of legal settlement | 0.55 | — | — | |||||||||
Legal settlements and contingencies | (3.75 | ) | 26.32 | 16.54 | ||||||||
Restructuring charge | — | 1.50 | 0.62 | |||||||||
(Gain) loss on extinguishment /modification of debt and other refinancing costs | (10.32 | ) | — | 0.04 | ||||||||
Gain on change in value of debt conversion features | (57.70 | ) | — | — | ||||||||
Tax valuation allowance | — | — | 8.74 | |||||||||
Tax impact of adjustments | (0.49 | ) | (0.30 | ) | (0.20 | ) | ||||||
|
|
|
|
|
| |||||||
Total adjustments: | 14.57 | 34.41 | 37.61 | |||||||||
|
|
|
|
|
| |||||||
Adjusted net (loss) income per share | $ | (21.76 | ) | $ | 5.40 | $ | 17.55 | |||||
|
|
|
|
|
| |||||||
Outlook
We expect 2012 volumes to be consistent with or slightly above 2011 levels due to slow recoveries in our markets. During 2011, we implemented many cost savings initiatives including a reduction in non-union workforce, and through our relationships with our vessel and other union partners, we received union labor savings. In addition, many of our other transportation service providers either provided rate reductions or maintained rate levels. During 2012, we expect to incur increases from our vessel union partners, transportation service providers, and other contractual increases for marine services including wharfage. We believe we will be able to recover most of these expense increases through rate increases to our customers. Fuel prices have risen significantly in recent months and remain volatile. Our ability to implement and maintain fuel surcharge adjustments will have an impact on our earnings.
While we are extremely focused on liquidity preservation, we are also committed to ensuring quality service to our customers. As such, during 2012 we are making a significant investment in our Jones Act fleet by dry-docking three of our Puerto Rico vessels in Asia. Although this adds a considerable amount of transit expense in 2012, dry-docking the vessels in Asia enables us to make high quality modifications to the vessels in the most efficient manner.
| Item 7A. | Quantitative and Qualitative Disclosures about Market Risk |
Our primary interest rate exposure relates to the ABL Facility, which bears interest at a variable rate. As of December 25, 2011, we had no borrowings outstanding under the ABL Facility.
We maintain policies for managing risk related to exposure to variability in interest rates, fuel prices and other relevant market rates and prices which includes potentially entering into derivative instruments in order to mitigate our risks. We do not currently have any derivative instruments outstanding.
Our exposure to market risk for changes in interest rates is limited to our ABL Facility and one of our operating leases. The interest rate for our ABL Facility is currently indexed to LIBOR of one, two, three, or six months as selected by us (or nine or twelve months, if available, and consented to by the Lenders), or the Alternate Base Rate as defined in the ABL Facility. One of our operating leases is currently indexed to LIBOR of one month.
67
Table of Contents
In addition, at times we utilize derivative instruments tied to various indexes to hedge a portion of our quarterly exposure to bunker fuel price increases. These instruments consist of fixed price swap agreements. We do not use derivative instruments for trading purposes. Credit risk related to the derivative financial instruments is considered minimal and is managed by requiring high credit standards for its counterparties. We currently do not have any bunker fuel price hedges in place.
Changes in fair value of derivative financial instruments are recorded as adjustments to the assets or liabilities being hedged in the statement of operations or in accumulated other comprehensive income (loss), depending on whether the derivative is designated and qualifies for hedge accounting, the type of hedge transaction represented and the effectiveness of the hedge.
| Item 8. | Financial Statements and Supplementary Data |
See index in Item 15 of this annual report on Form 10-K. Quarterly information (unaudited) is presented in a Note to the consolidated financial statements.
| Item 9. | Changes in and Disagreements with Accountants on Accounting and Financial Disclosure |
None.
| Item 9A. | Controls and Procedures |
Disclosure Controls and Procedures
We maintain disclosure controls and procedures designed to ensure information required to be disclosed in Company reports filed under the Securities Exchange Act of 1934, as amended (“the Exchange Act”), is recorded, processed, summarized, and reported within the time periods specified in the Securities and Exchange Commission’s rules and forms. Disclosure controls and procedures are designed to provide reasonable assurance that information required to be disclosed in Company reports filed under the Exchange Act is accumulated and communicated to management, including our Chief Executive Officer and Chief Financial Officer, as appropriate, to allow timely decisions regarding required disclosure.
Our management, with the participation of our Chief Executive Officer and Chief Financial Officer, has evaluated the effectiveness of our disclosure controls and procedures pursuant to Rule 13a-15(b) of the Exchange Act as of December 25, 2011. Based on that evaluation, our Chief Executive Officer and Chief Financial Officer have concluded that our disclosure controls and procedures are effective as of December 25, 2011.
Management’s Report on Internal Control over Financial Reporting
Our management is responsible for establishing and maintaining adequate internal control over financial reporting as defined in Rules 13a-15(f) under the Securities Exchange Act of 1934. Pursuant to the rules and regulations of the Securities and Exchange Commission, internal control over financial reporting is a process designed by, or under the supervision of, our principal executive and principal financial officers, and effected by our board of directors, management and other personnel, to provide reasonable assurance regarding the reliability of financial reporting and the preparation of financial statements for external purposes in accordance with accounting principles generally accepted in the United States. Due to inherent limitations, internal control over financial reporting may not prevent or detect misstatements. Further, because of changes in conditions, effectiveness of internal control over financial reporting may vary over time.
Our management, with the participation of our Chief Executive Officer and Chief Financial Officer, has evaluated the effectiveness of our internal control over financial reporting as of December 25, 2011 based on the control criteria established in a report entitled Internal Control — Integrated Framework, issued by the Committee of Sponsoring Organizations of the Treadway Commission (COSO). Based on such evaluation management has concluded that our internal control over financial reporting is effective as of December 25, 2011.
68
Table of Contents
Changes in Internal Control over Financial Reporting
There were no changes in our internal control over financial reporting during our fiscal quarter ending December 25, 2011, that have materially affected, or are reasonably likely to materially affect, our internal control over financial reporting.
| Item 9B. | Other Information |
None.
69
Table of Contents
Part III
| Item 10. | Directors and Executive Officers of the Registrant |
The information required by this item as to the Company’s executive officers, directors, director nominees, audit committee financial expert, audit committee, and procedures for stockholders to recommend director nominees will be included in the Company’s proxy statement to be filed for the Annual Meeting of Stockholders to be held on June 7, 2012, and is incorporated by reference herein. The information required by this item as to compliance by the Company’s directors, executive officers and certain beneficial owners of the Company’s Common Stock with Section 16(a) of the Securities Exchange Act of 1934 also will be included in said proxy statement and also is incorporated herein by reference.
The Company has adopted a Code of Business Conduct and Ethics that governs the actions of all Company employees, including officers and directors. The Code of Business Conduct and Ethics is posted within the Investor Relations section of the Company’s internet website at www.horizonlines.com. The Company will provide a copy of the Code of Business Conduct and Ethics to any stockholder upon request. Any amendments to and/or any waiver from a provision of any of the Code of Business Conduct and Ethics granted to any director, executive officer or any senior financial officer, must be approved by the Board of Directors and will be disclosed on the Company’s internet website as soon as reasonably practical following the amendment or waiver. The information contained on or connected to the Company’s internet website is not incorporated by reference into this Form 10-K and should not be considered part of this or any other report that the Company files with or furnishes to the Securities and Exchange Commission.
| Item 11. | Executive Compensation |
The information required by this item will be included in the Company’s proxy statement to be filed for the Annual Meeting of Stockholders to be held on June 7, 2012, and is incorporated herein by reference.
| Item 12. | Security Ownership of Certain Beneficial Owners and Management and Related Stockholder Matters |
The information required by this item will be included in the Company’s proxy statement to be filed for the Annual Meeting of Stockholders to be held on June 7, 2012, and is incorporated herein by reference.
| Item 13. | Certain Relationships and Related Transactions |
The information required by this item will be included in the Company’s proxy statement to be filed for the Annual Meeting of Stockholders to be held on June 7, 2012, and is incorporated herein by reference.
| Item 14. | Principal Accountant Fees and Services |
The information required by this item will be included in the Company’s proxy statement to be filed for the Annual Meeting of Stockholders to be held on June 7, 2012, and is incorporated herein by reference.
70
Table of Contents
Part IV
| Item 15. | Exhibits and Financial Statement Schedules |
(a)(1)Financial Statements:
Horizon Lines, Inc.
Index to Consolidated Financial Statements
| Page | ||||
| F-1 | ||||
Consolidated Financial Statements for the fiscal year ended December 26, 2010: | ||||
| F-2 | ||||
| F-3 | ||||
| F-4 | ||||
| F-5 | ||||
Consolidated Statements of Changes In Stockholders’ Equity (Deficiency) | F-6 | |||
| F-7 | ||||
| F-44 | ||||
(a)(2)Exhibits:
| Incorporated by Reference | ||||||||||||
Exhibit | Description | Form | File No. | Date of First Filing | Exhibit Number | Filed Herewith | ||||||
| 3.1 | Restated Certificate of Incorporation | 8-K | 001-32627 | 12/13/11 | 3.1 | |||||||
| 4.1 | Supplemental Indenture | S-1 | 333-123073 | 9/19/05 | 4.8 | |||||||
| 4.2 | Warrant Agreement | 8-K | 001-32627 | 10/6/11 | 4.1 | |||||||
| 4.3 | Redemption Warrant Agreement | 8-K | 001-32627 | 12/13/11 | 4.1 | |||||||
| 4.4 | Indenture, Redemption Notes | 8-K | 001-32627 | 12/13/11 | 4.2 | �� | ||||||
| 4.5 | Amendment No. 1 to Redemption Warrant Agreement | 8-K | 001-32627 | 12/13/11 | 4.3 | |||||||
| 10.1 | Preferential Usage Agreement dated December 1, 1985, between the Municipality of Anchorage, Alaska and Horizon Lines of Alaska, LLC (formerly known as CSX Lines of Alaska, LLC, as successor in interest to SL Service, Inc. (formerly known as Sea-Land Service, Inc.), pursuant to a consent to general assignment and assumption, dated September 5, 2002), as amended by the Amendment to Preferential Usage Agreement dated January 31, 1991, Second Amendment to December 1, 1985 Preferential Usage Agreement dated June 20, 1996, and Third Amendment to December 1, 1985 Preferential Usage Agreement dated January 7, 2003. | S-1 | 333-123073 | 3/2/05 | 10.10 | |||||||
71
Table of Contents
| Incorporated by Reference | ||||||||||||
Exhibit | Description | Form | File No. | Date of First Filing | Exhibit Number | Filed Herewith | ||||||
| 10.2 | Amended and Restated Guarantee and Indemnity Agreement dated as of February 27, 2003, by and among HLH, LLC, Horizon Lines, LLC, CSX Corporation, CSX Alaska Vessel Company, LLC and SL Service, Inc., as supplemented by the joinder agreements, dated as of July 7, 2004, of Horizon Lines Holding Corp., Horizon Lines of Puerto Rico, Inc., Falconhurst, LLC, Horizon Lines Ventures, LLC, Horizon Lines of Alaska, LLC, Horizon Lines of Guam, LLC, Horizon Lines Vessels, LLC, Horizon Services Group, LLC, Sea Readiness, LLC, Sea-Logix, LLC, S-L Distribution Services, LLC and SL Payroll Services, LLC. | S-1 | 333-123073 | 3/2/05 | 10.26 | |||||||
| *10.3 | Amended and Restated Put/Call Agreement, dated as of September 20, 2005, by and among Horizon Lines, Inc. and other parties thereto. | 8-K | 001-32627 | 10/24/05 | 99.4 | |||||||
| *10.4 | Form of Restricted Stock Award Agreement. | 8-K | 001-32627 | 4/30/08 | 10.1 | |||||||
| 10.5† | International Intermodal Agreement 5124-5024, dated as of March 1, 2002, between Horizon Lines, LLC, Horizon Lines of Puerto Rico, Inc., Horizon Lines of Alaska, LLC and CSX Intermodal, Inc. | S-4 | 333-123681 | 6/23/05 | 10.14 | |||||||
| 10.6† | Sub-Bareboat Charter Party Respecting 3 Vessels, dated as of February 27, 2003, in relation to U.S.-flag vessels Horizon Anchorage, Horizon Tacoma and Horizon Kodiak, between CSX Alaska Vessel Company, LLC, as charterer, and Horizon Lines, LLC, as sub-charterer. | S-4 | 333-123681 | 3/30/05 | 10.15 | |||||||
| 10.6.1† | Amendment No. 1 to Sub-Bareboat Charter Party Respecting 3 Vessels | 8-K | 001-32627 | 5/4/11 | 10.1 | |||||||
| 10.6† | Stevedoring and Terminal Services Agreement, dated May 9, 2004, between APM Terminals, North America, Inc., Horizon Lines, LLC and Horizon Lines of Alaska, LLC. | S-4 | 333-123681 | 3/30/05 | 10.18 | |||||||
| 10.6.1†† | Amendment No. 2 to Stevedoring and Terminal Services Agreement, dated November 30, 2006, among APM Terminals, North America, Inc., Horizon Lines, LLC and Horizon Lines of Alaska, LLC. | 10-K | 001-32627 | 3/2/07 | 10.14.1 | |||||||
72
Table of Contents
| Incorporated by Reference | ||||||||||||
Exhibit | Description | Form | File No. | Date of First Filing | Exhibit Number | Filed Herewith | ||||||
| 10.6.2†† | Amendment No. 3 to Stevedoring and Terminal Services Agreement, dated June 8, 2010, among APM Terminals, North America, Inc., Horizon Lines, LLC and Horizon Lines of Alaska, LLC. | 10-Q | 001-32627 | 7/23/10 | 10.1 | |||||||
| 10.7 | Assignment and Assumption Agreement dated as of September 2, 1999, by and between Sea-Land Service, Inc. and Sea-Land Domestic Shipping, LLC. | S-4 | 333-123681 | 3/30/05 | 10.21 | |||||||
| 10.8 | Capital Construction Fund Agreement, dated March 29, 2004, between Horizon Lines, LLC and the United States of America, represented by the Secretary of Transportation, acting by and through the Maritime Administrator. | S-1 | 333-123073 | 3/2/05 | 10.36 | |||||||
| 10.9 | Harbor Lease dated January 12, 1996, between Horizon Lines, LLC (formerly known as CSX Lines, LLC, as successor in interest to SL Services, Inc. (formerly known as Sea-Land Service, Inc.), pursuant to Consent to Two Assignments of Harbor Lease No. H-92-22, dated February 14, 2003) and the State of Hawaii, Department of Transportation, Harbors Division. | S-1 | 333-123073 | 3/2/05 | 10.37 | |||||||
| 10.10 | Agreement dated May 16, 2002, between Horizon Lines of Puerto Rico, Inc. (formerly known as CSX Lines of Puerto Rico, Inc.) and The Puerto Rico Ports Authority. | S-1 | 333-123073 | 3/2/05 | 10.38 | |||||||
| 10.11 | Agreement dated March 29, 2001, between Horizon Lines of Puerto Rico, Inc. (formerly known as CSX Lines of Puerto Rico, Inc.) and The Puerto Rico Ports Authority. | S-1 | 333-123073 | 3/2/05 | 10.39 | |||||||
| 10.12 | Port of Kodiak Preferential Use Agreement dated April 12, 2002, between the City of Kodiak, Alaska and Horizon Lines of Alaska, LLC (formerly known as CSX Lines of Alaska, LLC, as successor in interest to CSX Lines, LLC, pursuant to Amendment No. 1 to the Preferential Use Agreement, dated April 12, 2002). | S-1 | 333-123073 | 3/2/05 | 10.40 | �� | ||||||
| 10.12.1 | Port of Kodiak Preferential Use Agreement dated January 1, 2005, between the City of Kodiak, Alaska and Horizon Lines of Alaska, LLC. | S-1 | 333-123073 | 7/29/05 | 10.40.1 | |||||||
73
Table of Contents
| Incorporated by Reference | ||||||||||||
Exhibit | Description | Form | File No. | Date of First Filing | Exhibit Number | Filed Herewith | ||||||
| 10.13 | Terminal Operation Contract dated May 2, 2002, between the City of Kodiak, Alaska and Horizon Lines of Alaska, LLC (formerly known as CSX Lines of Alaska, LLC). | S-1 | 333-123073 | 3/2/05 | 10.41 | |||||||
| 10.13.1 | Terminal Operation Contract dated January 1, 2005, between the City of Kodiak, Alaska and Horizon Lines of Alaska, LLC. | S-1 | 333-123073 | 7/29/05 | 10.41.1 | |||||||
| 10.14 | Sublease, Easement and Preferential Use Agreement dated October 2, 1990, between the City of Unalaska and Horizon Lines, LLC (formerly known as CSX Lines LLC), as successor in interest to Sea-Land Service, Inc., together with the addendum thereto dated October 2, 1990, as amended by the Amendment to Sublease, Easement and Preferential Use Agreement dated May 31, 2000, and Amendment #1 dated May 1, 2002. | S-1 | 333-123073 | 3/2/05 | 10.42 | |||||||
| 10.14.1 | Amendment #2 dated February 27, 2003 to Preferential Use Agreement dated October 2, 1990 between the City of Unalaska and Horizon Lines of Alaska, LLC (formerly known as CSX Lines of Alaska, LLC). | S-1 | 333-123073 | 7/29/05 | 10.42.1 | |||||||
| *10.15 | Form of Indemnification Agreement for Officers. | 8-K | 001-32627 | 2/24/12 | 10.1 | |||||||
| 10.15.1 | Form of Non-management Directors’ Indemnification Agreement. | 8-K | 001-32627 | 7/18/08 | 10.1 | |||||||
| *10.16 | Employment Agreement dated as of September 16, 2005, between Horizon Lines, LLC and John V. Keenan. | S-1 | 333-123073 | 9/19/05 | 10.44 | |||||||
| *10.16.1 | First Amendment to Employment Agreement dated as of December 20, 2003, between Horizon Lines and John V. Keenan. | 8-K | 001-32627 | 12/21/05 | 10.44.1 | |||||||
| *10.17 | Amended and Restated Equity Incentive Plan. | 8-K | 001-32627 | 12/19/08 | 10.1 | |||||||
| *10.18 | Horizon Lines, Inc., Employee Stock Purchase Plan. | S-1 | 333-123073 | 9/19/05 | 10.46 | |||||||
| *10.19 | Stock Option Award Agreement. | 8-K | 001-32627 | 4/11/06 | 10.1 | |||||||
| *10.20 | Form of Restricted Stock Unit | 8-K | 001-32627 | 6/8/11 | 10.1 | |||||||
| *10.21 | Horizon Lines Executive Severance Plan | 8-K | 001-32627 | 7/29/11 | 10.1 | |||||||
| 10.21 | Bareboat Charter Agreement dated as of April 7, 2006, by and among Horizon Lines Eagle and Horizon Lines, LLC. | S-1 | 333-134270 | 5/19/06 | 10.52 | |||||||
74
Table of Contents
| Incorporated by Reference | ||||||||||||
Exhibit | Description | Form | File No. | Date of First Filing | Exhibit Number | Filed Herewith | ||||||
| 10.22 | Bareboat Charter Agreement dated as of April 7, 2006, by and among Horizon Lines Falcon and Horizon Lines, LLC. | S-1 | 333-134270 | 5/19/06 | 10.53 | |||||||
| 10.23 | Bareboat Charter Agreement dated as of April 7, 2006, by and among Horizon Lines Hunter and Horizon Lines, LLC. | S-1 | 333-134270 | 5/16/06 | 10.54 | |||||||
| 10.24 | Bareboat Charter Agreement dated as of April 7, 2006, by and among Horizon Lines Tiger and Horizon Lines, LLC. | S-1 | 333-134270 | 5/19/06 | 10.55 | |||||||
| 10.25 | Bareboat Charter Agreement dated as of April 7, 2006, by and among Horizon Lines Hawk and Horizon Lines, LLC. | S-1 | 333-134270 | 5/19/06 | 10.56 | |||||||
| 10.26 | Credit Agreement, dated August 8, 2007, by and among Horizon Lines, Inc., as Borrower; certain subsidiaries of the Borrower for time to time parties thereto, as Guarantors; the Lenders parties thereto; Wachovia Bank, National Association, as Administrative Agent; Bank of America, N.A., as Syndication Agent; and Goldman Sachs Credit Partners, L.P., LaSalle Bank, National Association and JP Morgan Chase Bank, N.A., as Joint Documentation Agents. | 8-K | 001-32627 | 8/13/07 | 10.12 | |||||||
| 10.27 | First Amendment to Credit Agreement, dated June 11, 2009 | 8-K | 001-32627 | 6/12/09 | 10.2 | |||||||
| 10.28 | Second Amendment to Credit Agreement, dated March 9, 2011 | 8-K | 001-32627 | 3/11/11 | 10.1 | |||||||
| 10.29 | Third Amendment to Credit Agreement | 8-K | 001-32627 | 6/24/11 | 10.1 | |||||||
| 10.30 | Fourth Amendment to Credit Agreement | 8-K | 001-32627 | 8/28/11 | 10.4 | |||||||
| 10.31 | Settlement Agreement, dated June 11, 2009 | 8-K | 001-32627 | 6/12/09 | 10.1 | |||||||
| 10.32 | Settlement Agreement with the Commonwealth of Puerto Rico | 8-K | 001-32627 | 4/6/11 | 10.1 | |||||||
| 10.33.1 | Form of Restructuring Support Agreements | 8-K | 001-32627 | 6/2/11 | 10.1 | |||||||
| 10.33.2 | Form of Amended Restructuring Support Agreements | 8-K | 001-32627 | 6/10/11 | 10.1 | |||||||
| 10.33.3 | Form of Second Amendment to Restructuring Support Agreements | 8-K | 001-32627 | 6/17/11 | 10.1 | |||||||
| 10.33.4 | Form of Third Amendment to Restructuring Support Agreements | 8-K | 001-32627 | 6/27/11 | 10.1 | |||||||
| 10.33.5 | Form of Fourth Amendment to Restructuring Support Agreements | 8-K | 001-32627 | 7/5/21 | 10.1 | |||||||
75
Table of Contents
| Incorporated by Reference | ||||||||||||
Exhibit | Description | Form | File No. | Date of First Filing | Exhibit Number | Filed Herewith | ||||||
| 10.33.6 | Form of Fifth Amendment to Restructuring Support Agreements | 8-K | 001-32627 | 7/8/11 | 10.1 | |||||||
| 10.33.7 | Form of Six Amendment to Restructuring Support Agreements | 8-K | 001-32627 | 7/22/11 | 10.1 | |||||||
| 10.33.8 | Form of Seventh Amendment to Restructuring Support Agreements | 8-K | 001-32627 | 8/9/11 | 10.1 | |||||||
| 10.33.9 | Form of Eighth Amendment to Restructuring Support Agreements | 8-K | 001-32627 | 8/12/11 | 10.1 | |||||||
| 10.33.10 | Form of Ninth Amendment to Restructuring Support Agreements | 8-K | 001-32627 | 8/22/11 | 10.1 | |||||||
| 10.34 | Form of Commitment Letter | 8-K | 001-32627 | 8/29/11 | 10.1 | |||||||
| 10.35 | Commitment Letter between Horizon Lines, Inc. and Wells Fargo Capital Finance | 8-K | 001-32627 | 8/29/11 | 10.2 | |||||||
| 10.36 | Form of Restructuring Support Agreement | 8-K | 001-32627 | 8/29/11 | 10.3 | |||||||
| 10.37 | Form of $25 million Bridge Term Loan Facility | 8-K | 001-32627 | 9/16/11 | 10.1 | |||||||
| 10.38 | Form of Restructuring Support Agreement | 8-K | 001-32627 | 8/29/11 | 10.3 | |||||||
| 10.39 | Form of First Amendment to Restructuring Support Agreement | 8-K | 001-32627 | 9/29/11 | 10.1 | |||||||
| 10.40 | Purchase Agreement, 11% First Lien Senior Secured Notes | 8-K | 001-32627 | 10/6/11 | 10.1 | |||||||
| 10.41 | Purchase Agreement, Second Lien Secured Notes | 8-K | 001-32627 | 10/6/11 | 10.2 | |||||||
| 10.42 | Registration Rights Agreement | 8-K | 001-32627 | 10/6/11 | 10.3 | |||||||
| 10.43 | Credit Agreement | 8-K | 001-32627 | 10/6/11 | 10.4 | |||||||
| 10.44 | Intercreditor Agreement | 8-K | 001-32627 | 10/6/11 | 10.5 | |||||||
| 10.45 | Form of Second Amendment to Restructuring Support Agreement | 8-K | 001-32627 | 10/6/11 | 10.6 | |||||||
| *10.46† | Form of Performance Grant Agreement for Charles G. Raymond. | 8-K | 001-32627 | 5/20/09 | 10.1 | |||||||
| *10.47† | Form of 2010 Performance-Based Restricted Stock Award. | 10-Q | 001-32627 | 4/23/10 | 10.2 | |||||||
| *10.48 | Form of 2010 Time-Based Restricted Stock Award. | 10-Q | 001-32627 | 4/23/10 | 10.3 | |||||||
| 10.49 | Separation Agreement between the Registrant and Charles G. Raymond, dated February 23, 2011 | 10-K | 001-32627 | 3/28/11 | 10.50 | |||||||
76
Table of Contents
| Incorporated by Reference | ||||||||||||
Exhibit | Description | Form | File No. | Date of First Filing | Exhibit Number | Filed Herewith | ||||||
| *10.50 | Employment Agreement between the Registrant and Stephen H. Fraser, executed March 27, 2011 | 10-K | 001-32627 | 3/28/11 | 10.51 | |||||||
| 10.51 | Plea Agreement with the United States of America | X | ||||||||||
| 10.52 | Plea Agreement with the United States Attorney’s Office | X | ||||||||||
| 10.53 | Settlement Agreement | X | ||||||||||
| 10.54 | Form of Indemnification Agreement for Officers | 8-K | 001-32627 | 2/24/12 | 10.1 | |||||||
| 10.55 | Form of Restructuring Support Agreements | 8-K | 001-32627 | 2/28/12 | 10.1 | |||||||
| 12 | Ratio of Earnings to Fixed Charges. | X | ||||||||||
| 14 | Code of Ethics. | 10-K | 001-32627 | 2/5/09 | ||||||||
| 21 | List of Subsidiaries of Horizon Lines, Inc. | X | ||||||||||
| 23.1 | Consent of Independent Registered Public Accounting Firm. | X | ||||||||||
| 31.1 | Certification of Chief Executive Officer pursuant to Rules 13a-14 and 15d-14, as adopted pursuant to Section 302 of Sarbanes-Oxley Act of 2002. | X | ||||||||||
| 31.2 | Certification of Chief Financial Officer pursuant to Rules 13a-14 and 15d-14, as adopted pursuant to Section 302 of Sarbanes-Oxley Act of 2002. | X | ||||||||||
| 32.1 | Certification of Chief Executive Officer pursuant to 18 U.S.C. Section 1350, as adopted pursuant to Section 906 of Sarbanes-Oxley Act of 2002. | X | ||||||||||
| 32.2 | Certification of Chief Financial Officer pursuant to 18 U.S.C. Section 1350, as adopted pursuant to Section 906 of Sarbanes-Oxley Act of 2002. | X | ||||||||||
| (101.INS) | XBRL Instance Document. | X | ||||||||||
| (101.SCH) | XBRL Taxonomy Extension Schema Document. | X | ||||||||||
| (101.CAL) | XBRL Taxonomy Extension Calculation Linkbase Document. | X | ||||||||||
77
Table of Contents
| Incorporated by Reference | ||||||||||||||
Exhibit | Description | Form | File No. | Date of First Filing | Exhibit Number | Filed Herewith | ||||||||
| (101.LAB) | XBRL Taxonomy Extension Label Linkbase Document. | X | ||||||||||||
| (101.PRE) | XBRL Taxonomy Extension Presentation Linkbase Document. | X | ||||||||||||
| * | Exhibit represents a management contract or compensatory plan. |
| † | Portions of this document were omitted and filed separately pursuant to a request for confidential treatment in accordance with Rule 406 of the Securities Act. |
| †† | Portions of this document were omitted and filed separately pursuant to a request for confidential treatment in accordance with Rule 24b-2 of the Exchange Act. |
78
Table of Contents
SIGNATURES
Pursuant to the requirements of Section 13 or 15(d) of the Securities Exchange Act of 1934, the Registrants have duly caused this report to be signed on its behalf by the undersigned thereunto duly authorized, on the 10th day of April 2012.
| HORIZON LINES, INC. | ||
| By: | /s/ STEPHEN H. FRASER | |
| Stephen H. Fraser | ||
| President and Chief Executive Officer | ||
Pursuant to the requirements of the Securities and Exchange Act of 1934, this report has been signed below by the following persons on behalf of the Registrants and in the capacities and on the 10th day of April 2012.
Signature | Title | |
/S/ STEPHEN H. FRASER Stephen H. Fraser | President and Chief Executive Officer (Principal Executive Officer) | |
/S/ MICHAEL T. AVARA Michael T. Avara | Executive Vice President and Chief Financial Officer (Principal Financial Officer and Principal Accounting Officer) | |
/S/ JEFFREY A. BRODSKY Jeffrey A. Brodsky | Chairman of the Board and Director | |
/S/ KURT M. CELLAR Kurt M. Cellar | Director | |
/S/ JAMES LACHANCE James LaChance | Director | |
/S/ STEVEN L. RUBIN Steven L. Rubin | Director | |
/S/ MARTIN TUCHMAN Martin Tuchman | Director | |
/S/ DAVID N. WEINSTEIN David N. Weinstein | Director | |
79
Table of Contents
Report of Independent Registered Public Accounting Firm
The Board of Directors and Stockholders of
Horizon Lines, Inc.
We have audited the accompanying consolidated balance sheets of Horizon Lines, Inc. as of December 25, 2011 and December 26, 2010, and the related consolidated statements of operations, comprehensive loss, cash flows, and stockholders’ equity (deficiency) for each of the three years in the period ended December 25, 2011. Our audits also included the financial statement schedule listed in the Index at Item 15(a). These financial statements and schedule are the responsibility of the Company’s management. Our responsibility is to express an opinion on these financial statements and schedule based on our audits.
We conducted our audits in accordance with the standards of the Public Company Accounting Oversight Board (United States). Those standards require that we plan and perform the audit to obtain reasonable assurance about whether the financial statements are free of material misstatement. We were not engaged to perform an audit of the Company’s internal control over financial reporting. Our audits included consideration of internal control over financial reporting as a basis for designing audit procedures that are appropriate in the circumstances, but not for the purpose of expressing an opinion on the effectiveness of the Company’s internal control over financial reporting. Accordingly, we express no such opinion. An audit also includes examining, on a test basis, evidence supporting the amounts and disclosures in the financial statements, assessing the accounting principles used and significant estimates made by management, and evaluating the overall financial statement presentation. We believe that our audits provide a reasonable basis for our opinion.
In our opinion, the financial statements referred to above present fairly, in all material respects, the consolidated financial position of Horizon Lines, Inc. at December 25, 2011 and December 26, 2010, and the consolidated results of its operations and its cash flows for each of the three years in the period ended December 25, 2011, in conformity with U.S. generally accepted accounting principles. Also, in our opinion, the related financial statement schedule, when considered in relation to the basic financial statements taken as a whole, presents fairly in all material respects the information set forth therein.
/s/ Ernst & Young LLP
Charlotte, North Carolina
April 10, 2012
F-1
Table of Contents
Horizon Lines, Inc.
| December 25, 2011 | December 26, 2010 | |||||||
| (In thousands, except per share data) | ||||||||
| ASSETS | ||||||||
Current assets: | ||||||||
Cash | $ | 21,147 | $ | 2,751 | ||||
Accounts receivable, net of allowance | 105,949 | 94,181 | ||||||
Materials and supplies | 28,091 | 24,332 | ||||||
Deferred tax asset | 10,608 | 2,757 | ||||||
Assets of discontinued operations | 12,975 | 56,773 | ||||||
Other current assets | 7,196 | 6,435 | ||||||
|
|
|
| |||||
Total current assets | 185,966 | 187,229 | ||||||
Property and equipment, net | 167,145 | 179,997 | ||||||
Goodwill | 198,793 | 314,149 | ||||||
Intangible assets, net | 69,942 | 80,824 | ||||||
Other long-term assets | 17,963 | 23,577 | ||||||
|
|
|
| |||||
Total assets | $ | 639,809 | $ | 785,776 | ||||
|
|
|
| |||||
| LIABILITIES AND STOCKHOLDERS’ EQUITY | ||||||||
Current liabilities: | ||||||||
Accounts payable | $ | 31,683 | $ | 39,509 | ||||
Current portion of long-term debt, including capital lease | 6,107 | 508,793 | ||||||
Accrued vessel rent | 13,652 | 3,697 | ||||||
Liabilities of discontinued operations | 45,313 | 15,381 | ||||||
Other accrued liabilities | 97,097 | 100,721 | ||||||
|
|
|
| |||||
Total current liabilities | 193,852 | 668,101 | ||||||
Long-term debt, including capital lease, net of current portion | 509,741 | 7,530 | ||||||
Deferred rent | 13,553 | 18,026 | ||||||
Deferred tax liability | 10,702 | 4,457 | ||||||
Liabilities of discontinued operations | 51,293 | 338 | ||||||
Other long-term liabilities | 26,654 | 47,532 | ||||||
|
|
|
| |||||
Total liabilities | 805,795 | 745,984 | ||||||
|
|
|
| |||||
Commitments and contingencies | ||||||||
Stockholders’ equity: | ||||||||
Preferred stock, $.01 par value, 30,500 authorized; no shares issued or outstanding | — | — | ||||||
Common stock, $.01 par value, 100,000 shares authorized, 2,421 shares issued and 2,269 shares outstanding at December 25, 2011 and 1,382 shares issued and 1,230 shares outstanding at December 26, 2010 | 605 | 345 | ||||||
Treasury stock, 152 shares at cost | (78,538 | ) | (78,538 | ) | ||||
Additional paid in capital | 213,135 | 193,266 | ||||||
Accumulated deficit | (303,260 | ) | (73,843 | ) | ||||
Accumulated other comprehensive income (loss) | 2,072 | (1,438 | ) | |||||
|
|
|
| |||||
Total stockholders’ (deficiency) equity | (165,986 | ) | 39,792 | |||||
|
|
|
| |||||
Total liabilities and stockholders’ (deficiency) equity | $ | 639,809 | $ | 785,776 | ||||
|
|
|
| |||||
The accompanying notes are an integral part of these consolidated financial statements.
F-2
Table of Contents
Horizon Lines, Inc.
Consolidated Statements of Operations
| Fiscal Years Ended | ||||||||||||
| December 25, 2011 | December 26, 2010 | December 20 2009 | ||||||||||
| (In thousands, except per share amounts) | ||||||||||||
Operating revenue | $ | 1,026,164 | $ | 1,000,055 | $ | 979,352 | ||||||
Operating expense: | ||||||||||||
Cost of services (excluding depreciation expense) | 870,029 | 820,460 | 778,482 | |||||||||
Depreciation and amortization | 42,883 | 43,563 | 43,502 | |||||||||
Amortization of vessel dry-docking | 15,376 | 15,014 | 13,686 | |||||||||
Selling, general and administrative | 82,125 | 79,930 | 95,766 | |||||||||
Goodwill impairment | 115,356 | — | — | |||||||||
Legal settlements | (5,483 | ) | 32,270 | 20,000 | ||||||||
Impairment charge | 2,997 | 2,655 | 1,867 | |||||||||
Restructuring charge | — | 1,843 | 747 | |||||||||
Miscellaneous expense (income) | 737 | (574 | ) | 876 | ||||||||
|
|
|
|
|
| |||||||
Total operating expense | 1,124,020 | 995,161 | 954,926 | |||||||||
|
|
|
|
|
| |||||||
Operating (loss) income | (97,856 | ) | 4,894 | 24,426 | ||||||||
Other expense (income): | ||||||||||||
Interest expense, net | 55,677 | 40,117 | 38,036 | |||||||||
(Gain) loss on modification of debt | (16,017 | ) | — | 50 | ||||||||
Gain on change in value of debt conversion features | (84,480 | ) | — | — | ||||||||
Other expense, net | 32 | 27 | 18 | |||||||||
|
|
|
|
|
| |||||||
Loss from continuing operations before income taxes | (53,068 | ) | (35,250 | ) | (13,678 | ) | ||||||
Income tax expense (benefit) | 126 | 324 | 10,573 | |||||||||
|
|
|
|
|
| |||||||
Net loss from continuing operations | (53,194 | ) | (35,574 | ) | (24,251 | ) | ||||||
Loss from discontinued operations | (176,223 | ) | (22,395 | ) | (7,021 | ) | ||||||
|
|
|
|
|
| |||||||
Net loss | $ | (229,417 | ) | $ | (57,969 | ) | $ | (31,272 | ) | |||
|
|
|
|
|
| |||||||
Basic and diluted net loss per share: | ||||||||||||
Continuing operations | $ | (36.33 | ) | $ | (29.01 | ) | $ | (20.06 | ) | |||
Discontinued operations | (120.37 | ) | (18.27 | ) | (5.81 | ) | ||||||
|
|
|
|
|
| |||||||
Basic and diluted net loss per share | $ | (156.70 | ) | $ | (47.28 | ) | $ | (25.87 | ) | |||
|
|
|
|
|
| |||||||
Number of shares used in calculations: | ||||||||||||
Basic | 1,464 | 1,226 | 1,209 | |||||||||
Diluted | 1,464 | 1,226 | 1,209 | |||||||||
Cash dividends declared per share | $ | — | $ | 5.00 | $ | 11.00 | ||||||
|
|
|
|
|
| |||||||
The accompanying notes are an integral part of these consolidated financial statements.
F-3
Table of Contents
Horizon Lines, Inc.
Consolidated Statements of Comprehensive Loss
| Fiscal Years Ended | ||||||||||||
| December 25, 2011 | December 26, 2010 | December 20 2009 | ||||||||||
| (In thousands) | ||||||||||||
Net loss | $ | (229,417 | ) | $ | (57,969 | ) | $ | (31,272 | ) | |||
Other comprehensive income (loss) | ||||||||||||
Unrecognized actuarial gains (losses), net of tax | 1,241 | (1,442 | ) | 4,475 | ||||||||
Change in fair value of interest rate swap, net of tax | 1,458 | 1,141 | 229 | |||||||||
Unwind of interest rate swap | 339 | — | — | |||||||||
Amortization of pension and post-retirement benefit transition obligation, net of tax | 472 | 414 | 447 | |||||||||
|
|
|
|
|
| |||||||
Other comprehensive income | 3,510 | 113 | 5,151 | |||||||||
|
|
|
|
|
| |||||||
Comprehensive loss | $ | (225,907 | ) | $ | (57,856 | ) | $ | (26,121 | ) | |||
|
|
|
|
|
| |||||||
The accompanying notes are an integral part of these consolidated financial statements.
F-4
Table of Contents
Horizon Lines, Inc.
Consolidated Statements of Cash Flows
| Fiscal Years Ended | ||||||||||||
| December 25, 2011 | December 26, 2010 | December 20, 2009 | ||||||||||
| (In thousands) | ||||||||||||
Cash flows from operating activities: | ||||||||||||
Net loss from continuing operations | $ | (53,194 | ) | $ | (35,574 | ) | $ | (24,251 | ) | |||
Adjustments to reconcile net loss to net cash (used in) provided by operating activities: | ||||||||||||
Depreciation | 22,566 | 22,865 | 23,196 | |||||||||
Amortization of intangibles | 20,317 | 20,698 | 20,306 | |||||||||
Amortization of vessel dry-docking | 15,376 | 15,014 | 13,686 | |||||||||
Goodwill impairment | 115,356 | — | — | |||||||||
Impairment charge | 2,997 | 2,655 | 1,867 | |||||||||
Restructuring charge | — | 1,843 | 747 | |||||||||
Legal settlements | (5,483 | ) | 32,270 | 20,000 | ||||||||
Gain on change in value of conversion features | (84,480 | ) | — | — | ||||||||
Amortization of deferred financing costs | 3,955 | 3,412 | 2,947 | |||||||||
Deferred income taxes | 162 | 148 | 10,617 | |||||||||
Gain on equipment disposals | (935 | ) | (47 | ) | (225 | ) | ||||||
Gain on sale of interest in joint venture | — | (724 | ) | — | ||||||||
(Gain) loss on modification/extinguishment of debt | (16,017 | ) | — | 50 | ||||||||
Accretion of interest on convertible notes | 11,972 | 11,060 | 10,011 | |||||||||
Accretion of interest on legal settlements | 810 | — | — | |||||||||
Stock-based compensation | 677 | 2,122 | 3,096 | |||||||||
Changes in operating assets and liabilities: | ||||||||||||
Accounts receivable, net | (11,417 | ) | 1,236 | 15,556 | ||||||||
Materials and supplies | (4,084 | ) | (44 | ) | (4,487 | ) | ||||||
Other current assets | 3,148 | (1,164 | ) | 1,279 | ||||||||
Accounts payable | (7,826 | ) | 1,538 | (1,885 | ) | |||||||
Accrued liabilities | (6,274 | ) | 6,210 | (1,461 | ) | |||||||
Vessel rent | 5,482 | (5,199 | ) | (4,874 | ) | |||||||
Vessel dry-docking payments | (12,547 | ) | (19,110 | ) | (14,696 | ) | ||||||
Legal settlement payments | (8,518 | ) | (5,000 | ) | (5,000 | ) | ||||||
Other assets/liabilities | (3,495 | ) | (768 | ) | (3,488 | ) | ||||||
|
|
|
|
|
| |||||||
Net cash (used in) provided by operating activities from continuing operations | (11,452 | ) | 53,441 | 62,991 | ||||||||
Net cash used in operating activities from discontinued operations | (50,588 | ) | (17,008 | ) | (5,493 | ) | ||||||
|
|
|
|
|
| |||||||
Cash flows from investing activities: | ||||||||||||
Purchases of equipment | (15,111 | ) | (15,991 | ) | (9,750 | ) | ||||||
Proceeds from sale of equipment | 2,274 | 454 | 1,215 | |||||||||
Proceeds from the sale of interest in joint venture | — | 1,100 | — | |||||||||
|
|
|
|
|
| |||||||
Net cash used in investing activities from continuing operations | (12,837 | ) | (14,437 | ) | (8,535 | ) | ||||||
Net cash used in investing activities from discontinued operations | (705 | ) | (545 | ) | (3,278 | ) | ||||||
|
|
|
|
|
| |||||||
Cash flows from financing activities: | ||||||||||||
Borrowing under revolving credit facility | 104,500 | 108,800 | 64,000 | |||||||||
Payments on revolving credit facility | (204,500 | ) | (108,800 | ) | (84,000 | ) | ||||||
Proceeds from issuance of First Lien Notes | 225,000 | — | — | |||||||||
Proceeds from issuance of Second Lien Notes | 100,000 | — | — | |||||||||
Payments of long-term debt | (93,750 | ) | (18,750 | ) | (7,968 | ) | ||||||
Payment of financing costs | (35,644 | ) | (75 | ) | (3,492 | ) | ||||||
Payments on capital lease obligation | (1,628 | ) | (124 | ) | — | |||||||
Common stock issued under ESPP | — | 111 | 104 | |||||||||
Dividend to stockholders | — | (6,281 | ) | (13,397 | ) | |||||||
|
|
|
|
|
| |||||||
Net cash provided by (used in) financing activities | 93,978 | (25,119 | ) | (44,753 | ) | |||||||
|
|
|
|
|
| |||||||
Net change in cash from continuing operations | 69,689 | 13,885 | 9,703 | |||||||||
Net change in cash from discontinued operations | (51,293 | ) | (17,553 | ) | (8,771 | ) | ||||||
|
|
|
|
|
| |||||||
Net change in cash | 18,396 | (3,668 | ) | 932 | ||||||||
Cash at beginning of year | 2,751 | 6,419 | 5,487 | |||||||||
|
|
|
|
|
| |||||||
Cash at end of year | $ | 21,147 | $ | 2,751 | $ | 6,419 | ||||||
|
|
|
|
|
| |||||||
The accompanying notes are an integral part of these consolidated financial statements.
F-5
Table of Contents
Horizon Lines, Inc.
Consolidated Statements of Changes in Stockholders’ Equity (Deficiency)
| Common Shares | Common Stock | Treasury Stock | Additional Paid in Capital | Retained Earnings (Accumulated Deficit) | Accumulated Other Comprehensive Loss | Stockholders’ Equity | ||||||||||||||||||||||
| (In thousands) | ||||||||||||||||||||||||||||
Stockholders’ equity at December 21, 2008 | 1,200 | $ | 338 | $ | (78,538 | ) | $ | 199,644 | $ | 22,094 | $ | (6,702 | ) | $ | 136,836 | |||||||||||||
Vesting of restricted stock | 5 | 1 | — | (178 | ) | — | — | (177 | ) | |||||||||||||||||||
Dividend to shareholders | — | — | — | (6,701 | ) | (6,696 | ) | — | (13,397 | ) | ||||||||||||||||||
Stock-based compensation | — | — | — | 3,582 | — | — | 3,582 | |||||||||||||||||||||
Stock issued under Employee Stock Purchase Plan | 7 | 2 | — | 553 | — | — | 555 | |||||||||||||||||||||
Net loss | — | — | — | — | (31,272 | ) | — | (31,272 | ) | |||||||||||||||||||
Unrecognized actuarial gains, net of tax | — | — | — | — | — | 4,475 | 4,475 | |||||||||||||||||||||
Fair value of interest rate swap, net of tax | — | — | — | — | — | 229 | 229 | |||||||||||||||||||||
Amortization of pension and post-retirement benefit transition obligation, net of tax | — | — | — | — | — | 447 | 447 | |||||||||||||||||||||
|
|
|
|
|
|
|
|
|
|
|
|
|
| |||||||||||||||
Stockholders’ equity at December 20, 2009 | 1,212 | $ | 341 | $ | (78,538 | ) | $ | 196,900 | $ | (15,874 | ) | $ | (1,551 | ) | $ | 101,278 | ||||||||||||
|
|
|
|
|
|
|
|
|
|
|
|
|
| |||||||||||||||
Vesting of restricted stock | 8 | 2 | — | (3 | ) | — | — | (1 | ) | |||||||||||||||||||
Dividend to shareholders | — | — | — | (6,448 | ) | — | — | (6,448 | ) | |||||||||||||||||||
Stock-based compensation | — | — | — | 2,122 | — | — | 2,122 | |||||||||||||||||||||
Stock issued under Employee Stock Purchase Plan | 10 | 2 | — | 695 | — | — | 697 | |||||||||||||||||||||
Net loss | — | — | — | — | (57,969 | ) | — | (57,969 | ) | |||||||||||||||||||
Unrecognized actuarial gains, net of tax | — | — | — | — | — | (1,442 | ) | (1,442 | ) | |||||||||||||||||||
Fair value of interest rate swap, net of tax | — | — | — | — | — | 1,141 | 1,141 | |||||||||||||||||||||
Amortization of pension and post-retirement benefit transition obligation, net of tax | — | — | — | — | — | 414 | 414 | |||||||||||||||||||||
|
|
|
|
|
|
|
|
|
|
|
|
|
| |||||||||||||||
Stockholders’ equity at December 26, 2010 | 1,230 | $ | 345 | $ | (78,538 | ) | $ | 193,266 | $ | (73,843 | ) | $ | (1,438 | ) | $ | 39,792 | ||||||||||||
|
|
|
|
|
|
|
|
|
|
|
|
|
| |||||||||||||||
Vesting of restricted stock | 1 | — | — | (26 | ) | — | — | (26 | ) | |||||||||||||||||||
Stock-based compensation | — | — | — | 677 | — | — | 677 | |||||||||||||||||||||
Stock issued under Employee Stock Purchase Plan | 6 | 1 | — | 181 | — | — | 182 | |||||||||||||||||||||
Stock issued as part of recapitalization plan | 1,003 | 252 | — | 19,044 | — | — | 19,296 | |||||||||||||||||||||
Conversion of warrants to stock | 29 | 7 | — | (7 | ) | — | — | — | ||||||||||||||||||||
Net loss | — | — | — | — | (229,417 | ) | — | (229,417 | ) | |||||||||||||||||||
Unrecognized actuarial gains, net of tax | — | — | — | — | — | 1,241 | 1,241 | |||||||||||||||||||||
Fair value of interest rate swap, net of tax | — | — | — | — | — | 1,458 | 1,458 | |||||||||||||||||||||
Unwind of interest rate swap | — | — | — | — | — | 339 | 339 | |||||||||||||||||||||
Amortization of pension and post-retirement benefit transition obligation, net of tax | — | — | — | — | — | 472 | 472 | |||||||||||||||||||||
|
|
|
|
|
|
|
|
|
|
|
|
|
| |||||||||||||||
Stockholders’ deficiency at December 25, 2011 | 2,269 | $ | 605 | $ | (78,538 | ) | $ | 213,135 | $ | (303,260 | ) | $ | 2,072 | $ | (165,986 | ) | ||||||||||||
|
|
|
|
|
|
|
|
|
|
|
|
|
| |||||||||||||||
The accompanying notes are an integral part of these consolidated financial statements.
F-6
Table of Contents
Horizon Lines, Inc.
Notes to Consolidated Financial Statements
1. Basis of Presentation and Operations
Horizon Lines, Inc. (the “Company”) operates as a holding company for Horizon Lines, LLC (“Horizon Lines”), a Delaware limited liability company and wholly-owned subsidiary, Horizon Logistics, LLC (“Horizon Logistics”), a Delaware limited liability company and wholly-owned subsidiary, Horizon Lines of Puerto Rico, Inc. (“HLPR”), a Delaware corporation and wholly-owned subsidiary, and Hawaii Stevedores, Inc. (“HSI”), a Hawaii corporation. Horizon Lines operates as a Jones Act container shipping business with primary service to ports within the continental United States, Puerto Rico, Alaska, and Hawaii. Under the Jones Act, all vessels transporting cargo between covered locations must, subject to limited exceptions, be built in the U.S., registered under the U.S. flag, manned by predominantly U.S. crews, and owned and operated by U.S.-organized companies that are controlled and 75% owned by U.S. citizens. Horizon Lines also offers terminal services. HLPR operates as an agent for Horizon Lines in Puerto Rico and also provides terminal services in Puerto Rico.
The accompanying consolidated financial statements include the consolidated accounts of the Company and its majority owned subsidiaries and the related consolidated statements of operations, comprehensive loss, changes in stockholders’ equity (deficiency) and cash flows. All significant intercompany accounts and transactions have been eliminated. Certain prior period balances have been reclassified to conform to current period presentation.
At a special meeting of the Company’s stockholders held on December 2, 2011, the Company’s stockholders approved an amendment to the Company’s certificate of incorporation effecting a reverse stock split. On December 7, 2011, the Company filed its restated certificate of incorporation to, among other things, effect the 1-for-25 reverse stock split. In connection with the reverse stock split, stockholders received one share of common stock for every 25 shares of common stock held at the effective time. The reverse stock split reduced the number of shares of outstanding common stock from 56.7 million to 2.3 million. Unless otherwise noted, all share-related amounts herein reflect the reverse stock split. In addition, proportional adjustments were made to the number of shares issuable upon the vesting of restricted shares and the exercise of outstanding options to purchase shares of common stock and the per share exercise price of those options.
During the third quarter of 2011, the Company began a review of strategic alternatives for its FSX service. As a result of several factors, including: 1) the projected continuation of volatile trans-Pacific freight rates, 2) high fuel prices, and 3) operating losses, the Company decided to discontinue its FSX service. On October 21, 2011, the Company finalized a decision to terminate the FSX service, and ceased all operations related to the FSX service during the fourth quarter of 2011. The entire component comprising the FSX service has been discontinued. As such, there will not be any significant future cash flows related to these operations. As a result, the FSX service has been classified as discontinued operations in all periods presented.
During 2011, the entire component comprising the third-party logistics operations was discontinued and former logistics customers are no longer customers of the Company. As part of the divestiture, the Company transitioned some of the operations and personnel to other logistics providers. There will not be any significant future cash flows related to these operations. In addition, the Company does not have any significant continuing involvement in the divested logistics operations. As a result, the logistics operations have been classified as discontinued operations in all periods presented.
2. Significant Accounting Policies
Cash
Cash of the Company consists principally of cash held in banks and temporary investments having a maturity of three months or less at the date of acquisition.
F-7
Table of Contents
Allowance for Doubtful Accounts and Revenue Adjustments
The Company maintains an allowance for doubtful accounts based upon the expected collectability of accounts receivable reflective of its historical collection experience. In circumstances in which management is aware of a specific customer’s inability to meet its financial obligation to the Company (for example, bankruptcy filings, accounts turned over for collection or litigation), the Company records a specific reserve for the bad debts against amounts due. For all other customers, the Company recognizes reserves for these bad debts based on the length of time the receivables are past due and other customer specific factors including, type of service provided, geographic location and industry. The Company monitors its collection risk on an ongoing basis through the use of credit reporting agencies. Accounts are written off after all means of collection, including legal action, have been exhausted. The Company does not require collateral from its trade customers.
In addition, the Company maintains an allowance for revenue adjustments consisting of amounts reserved for billing rate changes that are not captured upon load initiation. These adjustments generally arise: (1) when the sales department contemporaneously grants small rate changes (“spot quotes”) to customers that differ from the standard rates in the system; (2) when freight requires dimensionalization or is reweighed resulting in a different required rate; (3) when billing errors occur; and (4) when data entry errors occur. When appropriate, permanent rate changes are initiated and reflected in the system. These revenue adjustments are recorded as a reduction to revenue. During 2011, average revenue adjustments per month were approximately $0.4 million, on average total revenue per month of approximately $85.5 million (less than 0.4% of monthly revenue). In order to estimate the allowance for revenue adjustments related to ending accounts receivable, the Company prepares an analysis that considers average total monthly revenue adjustments and the average lag for identifying and processing these revenue adjustments. Based on this analysis, the Company establishes an allowance for approximately 55-65 days (dependent upon experience in the last twelve months) of average revenue adjustments, adjusted for billing errors. The lag is periodically adjusted based on actual historical experience. Additionally, the average amount of revenue adjustments per month can vary in relation to the level of sales or based on other factors (such as personnel issues that could result in excessive manual errors or in excessive spot quotes being granted). Both of these significant assumptions are continually evaluated for validity.
The allowance for doubtful accounts and revenue adjustments approximated $6.4 million and $6.8 million at December 25, 2011 and December 26, 2010, respectively.
Materials and Supplies
Materials and supplies consist primarily of fuel inventory aboard vessels and inventory for maintenance of property and equipment. Fuel is carried at cost on the first in, first out (FIFO) basis, while all other materials and supplies are carried at average cost.
Property and Equipment
Property and equipment are stated at cost. Certain costs incurred in the development of internal-use software are capitalized. Routine maintenance, repairs, and removals other than vessel dry-dockings are charged to expense. Expenditures that materially increase values, change capacities or extend useful lives of the assets are capitalized. Depreciation and amortization is computed by the straight-line method over the estimated useful lives of the assets. The estimated useful lives of the Company’s assets are as follows:
Buildings, chassis and cranes | 25 years | |||
Containers | 15 years | |||
Vessels | 20-40 years | |||
Software | 3 years | |||
Other | 3-10 years |
The Company evaluates long-lived assets for impairment whenever events or changes in circumstances indicate that the carrying amount of an asset may not be recoverable. If impairment indicators are present or if
F-8
Table of Contents
other circumstances indicate that an impairment may exist, the Company must then determine whether an impairment loss should be recognized. An impairment loss can be recognized for a long-lived asset (or asset group) that is held and used only if the sum of its estimated future undiscounted cash flows used to test for recoverability is less than its carrying value. Estimates of future cash flows used to test a long-lived asset (or asset group) for recoverability shall include only the future cash flows (cash inflows and associated cash outflows) that are directly associated with and that are expected to arise as a direct result of the use and eventual disposition of the long-lived asset (or asset group). Estimates of future cash flows should be based on an entity’s own assumptions about its use of a long-lived asset (or asset group). The cash flow estimation period should be based on the long-lived asset’s (or asset group’s) remaining useful life to the entity. When long-lived assets are grouped for purposes of performing the recoverability test, the remaining useful life of the asset group should be based on the useful life of the primary asset. The primary asset of the asset group is the principal long-lived tangible asset being depreciated that is the most significant component asset from which the group derives its cash-flow-generating capacity. Estimates of future cash flows used to test the recoverability of a long-lived asset (or asset group) that is in use shall be based on the existing service potential of the asset (or asset group) at the date tested. Existing service potential encompasses the long-lived asset’s estimated useful life, cash flow generating capacity, and, the physical output capacity. The estimated cash flows should include cash flows associated with future expenditures necessary to maintain the existing service potential, including those that replace the service potential of component parts, but they should not include cash flows associated with future capital expenditures that would increase the service potential. When undiscounted future cash flows will not be sufficient to recover the carrying amount of an asset, the asset is written down to its fair value.
Vessel Dry-docking
Vessels must undergo regular inspection, monitoring and maintenance, referred to as dry-docking, to maintain the required operating certificates. United States Coast Guard regulations generally require that vessels be dry-docked twice every five years. The costs of these scheduled dry-dockings are customarily capitalized and are then amortized over a 30-month period beginning with the accounting period following the vessel’s release from dry-dock, because dry-dockings enable the vessel to continue operating in compliance with U.S. Coast Guard requirements,.
The Company takes advantage of vessel dry-dockings to also perform normal repair and maintenance procedures on the vessels. These routine vessel maintenance and repair procedures are charged to expense as incurred. In addition, the Company will occasionally during a vessel dry-docking, replace vessel machinery or equipment and perform procedures that materially enhance capabilities of a vessel. In these circumstances, the expenditures are capitalized and depreciated over the estimated useful lives.
Leases
The Company leases certain vessels, facilities, equipment and vehicles under capital and operating leases. The commencement date of all leases is the earlier of the date the Company becomes legally obligated to make rent payments or the date the Company may exercise control over the use of the property. Rent expense is recorded as incurred. Certain of the Company’s leases contain fluctuating or escalating payments and rent holiday periods. The related rent expense is recorded on a straight-line basis over the lease term. Leasehold improvements associated with assets utilized under capital or operating leases are amortized over the shorter of the asset’s useful life or the lease term.
Intangible Assets
Intangible assets consist of goodwill, customer contracts/relationships, trademarks, and deferred financing costs. The Company amortizes customer contracts/relationships using the straight line method over the expected useful lives of 4 to 10 years. The Company also amortizes trademarks using the straight line method over the expected life of the related trademarks of 15 years. The Company amortizes debt issue cost using the effective interest method over the term of the related debt.
F-9
Table of Contents
Goodwill and other intangible assets with indefinite useful lives are not amortized, but are subject to annual impairment tests as of the first day of the fourth quarter. At least annually, or sooner if there is an indicator of impairment, the fair value of the reporting unit is calculated. If the calculated fair value is less than the carrying amount, an impairment loss might be recognized. In these instances, a discounted cash flow model is used to determine the current estimated fair value of the reporting unit. A number of significant assumptions and estimates are involved in the application of the discounted cash flow model to forecast operating cash flows, including market growth and market share, sales volumes and prices, costs of service, discount rate and estimated capital needs. Management considers historical experience and all available information at the time the fair values of its reporting unit is estimated. Assumptions in estimating future cash flows are subject to a high degree of judgment and complexity. Changes in assumptions and estimates may affect the carrying value of goodwill and could result in additional impairment charges in future periods.
The Company assesses goodwill for impairment at the reporting unit level, which is defined as an operating segment or one level below an operating segment, referred to as a component. The Company identified its reporting units by first determining its operating segments, and then assessed whether any components of the operating segments constituted a business for which discrete financial information is available and where segment management regularly reviews the operating results of the component. With the discontinuance of the logistics services segment in 2010, the Company concluded it had one operating segment and one reporting unit consisting of the container shipping business.
The Company uses the two-step method prescribed by ASC 350, Intangibles-Goodwill and Other, to determine goodwill impairment. If the carrying amount of the Company’s single reporting unit exceeds its fair value (step one), the Company measures the possible goodwill impairment based on a hypothetical allocation of the estimated fair value of the reporting unit to all of the underlying assets and liabilities, including previously unrecognized intangible assets (step two). The excess of the reporting unit’s fair value over the amounts assigned to its assets and liabilities is the implied fair value of goodwill. An impairment loss is recognized to the extent the reporting unit’s recorded goodwill exceeds the implied fair value of goodwill.
Revenue Recognition
The Company records transportation revenue and an accrual for the corresponding costs to complete delivery when the cargo first sails from its point of origin. The Company believes this method of revenue recognition does not result in a material difference in reported net income on an annual or quarterly basis, as compared to recording transportation revenue between accounting periods based upon the relative transit time within each respective period with expenses recognized as incurred. The Company recognizes revenue and related costs of sales for terminal and other services upon completion of services.
Insurance Reserves
The Company maintains insurance for casualty, property and health claims. Most of the Company’s insurance arrangements include a level of self-insurance. Reserves are established based on the nature of the claim or the value of cargo damaged and the use of current trends and historical data for other claims. These estimates are based on historical information along with certain assumptions about future events and also include reserves for claims incurred but not reported, where applicable.
Derivative Instruments
The Company recognizes all derivative instruments in the financial statements at fair value. The Company occasionally utilizes derivative instruments tied to various indexes to hedge a portion of its exposure to bunker fuel price increases. These instruments consist of fixed price swap agreements. The Company does not use derivative instruments for trading purposes. Credit risk related to the derivative financial instruments is considered minimal and is managed by requiring high credit standards for its counterparties.
F-10
Table of Contents
Changes in fair value of derivative financial instruments are recorded as adjustments to the assets or liabilities being hedged in the statement of operations or in accumulated other comprehensive income (loss), depending on whether the derivative is designated and qualifies for hedge accounting, the type of hedge transaction represented and the effectiveness of the hedge.
Income Taxes
The Company accounts for income taxes under the liability method whereby deferred tax assets and liabilities are measured using enacted tax laws and rates expected to apply to taxable income in the years in which the assets and liabilities are expected to be recovered or settled. The effects on deferred tax assets and liabilities of subsequent changes in the tax laws and rates are recognized in income during the year the changes are enacted. Deferred tax assets are reduced by a valuation allowance when, in the judgment of management, it is more likely than not that some portion or all of the deferred tax assets will not be realizable.
Stock-based Compensation
The value of each equity-based award is estimated on the date of grant using the Black-Scholes option-pricing model. The Black-Scholes model takes into account volatility in the price of our stock, the risk-free interest rate, the estimated life of the equity-based award, the closing market price of our stock and the exercise price. Due to the lack of trading activity since our stock became publicly traded at the time of our most recent stock option grant in 2008, we based our estimates of stock price volatility on the average of (i) our historical stock price over the period in which it had been publicly traded and (ii) historical volatility of similar entities commensurate with the expected term of the equity-based award; however, this estimate is neither predictive nor indicative of the future performance of our stock. The estimates utilized in the Black-Scholes calculation involve inherent uncertainties and the application of management judgment. In addition, we are required to estimate the expected forfeiture rate and only recognize expense for those options expected to vest.
Pension and Post-retirement Benefits
The Company has noncontributory pension plans and post-retirement benefit plans covering certain union employees. Costs of these plans are charged to current operations and consist of several components that are based on various actuarial assumptions regarding future experience of the plans. In addition, certain other union employees are covered by plans provided by their respective union organizations. The Company expenses amounts as paid in accordance with union agreements.
Amounts recorded for the pension plan and the post-retirement benefit plan reflect estimates related to future interest rates, investment returns, and employee turnover. The Company reviews all assumptions and estimates on an ongoing basis.
The Company is required to recognize the overfunded or underfunded status of its defined benefit and post-retirement benefit plans as an asset or liability, with changes in the funded status recognized as an adjustment to the ending balance of other accumulated comprehensive income (loss) in the year they occur. The pension plan and the post-retirement benefit plans are in an underfunded status.
Computation of Net Income (Loss) per Share
Basic net income (loss) per share is computed by dividing net income (loss) by the weighted daily average number of shares of common stock outstanding during the period. Certain of the Company’s unvested stock-based awards contain non-forfeitable rights to dividends. As a result, these participating securities are included in the denominator for basic net income (loss) per share. Diluted net income per share is computed using the weighted daily average number of shares of common stock outstanding for the period plus dilutive potential common shares, including stock options and warrants using the treasury-stock method and from convertible preferred stock using the “if converted” method.
F-11
Table of Contents
Fiscal Period
The fiscal period of the Company typically ends on the Sunday before the last Friday in December. For fiscal year 2011, the fiscal period began on December 27, 2010 and ended on December 25, 2011. For fiscal year 2010, the fiscal period began on December 21, 2009 and ended on December 26, 2010. For fiscal year 2009, the fiscal period began on December 22, 2008 and ended on December 20, 2009. The fiscal years ended December 25, 2011 and December 20, 2009 each consisted of 52 weeks and the fiscal year ended December 26, 2010 consisted of 53 weeks.
Use of Estimates
The preparation of financial statements in conformity with accounting principles generally accepted in the United States of America requires management to make estimates and assumptions that affect the reported amounts of assets and liabilities and disclosure of contingent assets and liabilities at the date of the financial statements and the reported amounts of revenue and expenses during the reporting period. Actual results may differ from those estimates. Significant estimates include the assessment of the realization of accounts receivable, deferred tax assets and long-lived assets, fair value estimates, recognition of reserves, and the useful lives of intangible assets and property and equipment.
Recent Accounting Pronouncements
In September 2011, the Financial Accounting Standards Board (“FASB”) issued ASU No. 2011-09, “Compensation-Retirement Benefits-Multiemployer Plans (Subtopic 715-80): Disclosures about an Employer’s Participation in a Multiemployer Plan”. This subtopic addresses concerns from users of financial statements on the lack of transparency about an employer’s participation in a multiemployer pension plan. The disclosures also will indicate the financial health of all of the significant plans in which the employer participates and assist a financial statement user to access additional information that is available outside of the financial statements. The subtopic is effective for annual reporting periods ending after December 15, 2011. The Company adopted this topic as of December 25, 2011 and has included the required disclosures in Note 13. The adoption did not have a material effect on the Company’s consolidated financial statements.
In June 2011, the FASB issued changes to the manner in which entities present comprehensive income in their financial statements. The new guidance requires entities to report components of comprehensive income in either (1) a continuous statement of comprehensive income or (2) two separate but consecutive statements. The new guidance does not change the items that must be reported in other comprehensive income. In December 2011, the FASB deferred the requirement that companies present reclassification adjustments for each component of accumulated other comprehensive income in both net income and other comprehensive income on the face of the financial statements. The new reporting requirement is effective for fiscal years and interim reporting periods within those years beginning after December 15, 2011, with early adoption permitted. The Company has elected to early adopt the accounting pronouncement, and the effect on the Company’s consolidated financial statements was to present activity impacting net income and other comprehensive loss in two consecutive statements.
In January 2010, the FASB issued an amendment to the accounting for fair value measurements and disclosures. This amendment details additional disclosures on fair value measurements, requires a gross presentation of activities within a Level 3 roll-forward, and adds a new requirement to disclose transfers in and out of Level 1 and Level 2 measurements. The new disclosures are required of all entities that are required to provide disclosures about recurring and nonrecurring fair value measurements. This amendment is effective in the first interim or reporting period beginning after December 15, 2009, with an exception for the gross presentation of Level 3 roll-forward information, which is required for annual reporting periods beginning after December 15, 2010, and for interim reporting periods within those years. The adoption of the provisions of this amendment required in the first interim period after December 15, 2009 did not have a material impact on the Company’s financial statement disclosures. In addition, the adoption of the provisions of this amendment during the quarter ended March 27, 2011 did not have a material impact on the Company’s financial statement disclosures.
F-12
Table of Contents
Supplemental Cash Flow Information
The Company’s employee stock purchase plan contains a dividend reinvestment provision. As such, during each 2010 and 2009, the Company retained $0.1 million, related to quarterly dividends paid on outstanding shares purchased through the employee stock purchase plan and issued 18 thousand and 26 thousand shares, respectively, of its common stock.
Cash payments (refunds) for interest and income taxes were as follows (in thousands):
| Fiscal Years Ended | ||||||||||||
| December 25, 2011 | December 26, 2010 | December 20, 2009 | ||||||||||
Interest | $ | 34,609 | $ | 26,199 | $ | 24,479 | ||||||
Income taxes | (102 | ) | (14 | ) | (678 | ) | ||||||
3. Long-Term Debt
Long-term debt, net of original issue discount or premium, consists of the following (in thousands):
| December 25, 2011 | December 26, 2010 | |||||||
First lien notes | $ | 228,228 | $ | — | ||||
6.00% convertible notes | 181,098 | — | ||||||
Second lien notes | 96,781 | — | ||||||
Capital lease obligations | 7,530 | 9,159 | ||||||
4.25% convertible senior notes | 2,211 | 313,414 | ||||||
Term loan | — | 93,750 | ||||||
Revolving credit facility | — | 100,000 | ||||||
|
|
|
| |||||
Total long-term debt | 515,848 | 516,323 | ||||||
Current portion | (6,107 | ) | (508,793 | ) | ||||
|
|
|
| |||||
Long-term debt, net of current portion | $ | 509,741 | $ | 7,530 | ||||
|
|
|
| |||||
On October 5, 2011, the Company completed its offer to exchange $327.8 million in aggregate principal amount of its 4.25% Convertible Senior Notes due 2012 (the “4.25% Notes”), representing 99.3% of the aggregate principal amount of the 4.25% Notes outstanding, for (i) 1.0 million shares of its common stock, (ii) warrants to purchase 1.0 million shares of its common stock at a conversion price of $0.01 per common share (the “Warrants”) and (iii) $178.8 million in aggregate principal amount of new 6.00% Series A Convertible Senior Secured Notes due 2017 (the “Series A Notes”) and $99.3 million in aggregate principal amount of new 6.00% Series B Mandatorily Convertible Senior Secured Notes (the “Series B Notes” and, together with the Series A Notes, the “6.00% Convertible Notes”).
Concurrently with the exchange offer, the Company obtained consents from the participating holders and entered into a supplemental indenture to the indenture governing the 4.25% Notes in connection with certain amendments to eliminate or amend substantially all of the restrictive covenants, and modify certain of the events of default and various other provisions.
Concurrently with the consummation of the exchange offer, Horizon Lines, LLC issued (i) $225.0 million aggregate principal amount of new 11.00% First Lien Senior Secured Notes due 2016 (the “First Lien Notes”) and (ii) $100.0 million of new 13.00%-15.00% Second Lien Senior Secured Notes due 2016 (the “Second Lien Notes”). Horizon Lines, LLC also entered into a new $100.0 million asset-based revolving credit facility (the “ABL Facility”) at the consummation of the exchange offer.
F-13
Table of Contents
The Company used proceeds of $266.5 million to repay existing borrowings and accrued interest under the Senior Credit Facility, $1.9 million of accrued interest under the 4.25% Notes, and $15.6 million for fees and refinancing related expenses. The Company received the remaining proceeds of $15.9 million. As a result of the Company’s efforts to refinance its debt and the 2011 amendments of the Senior Credit Facility, the Company paid a total of $35.6 million in financing costs throughout 2011, of which $15.5 million was capitalized as deferred financing costs and will be amortized through interest expense over the term of the related instrument. In addition, the Company recorded a net gain of $16.0 million as a result of the comprehensive refinancing.
6.00% Convertible Notes
On October 5, 2011, the Company issued $278.1 million aggregate principal amount of 6.00% Convertible Notes due 2017. The Series A Notes and the Series B Notes are each fully and unconditionally guaranteed by all of the Company’s domestic subsidiaries (collectively, the “Notes Guarantors”). The 6.00% Convertible Notes were issued pursuant to an indenture, which the Company and the Notes Guarantors entered into with U.S. Bank National Association, as trustee and collateral agent, on October 5, 2011 (the “6.00% Convertible Notes Indenture”).
The 6.00% Convertible Notes will bear interest at a rate of 6.00% per annum, payable semi-annually. The Series A Notes will mature on April 15, 2017 and are convertible, at the option of the holders, and at the Company’s option under certain circumstances, including listing of the Company’s shares of common stock on either the NYSE or NASDAQ markets, beginning on the one-year anniversary of the issuance of the Series A Notes, into shares of the Company’s common stock or warrants, as the case may be.
The Series A Notes are convertible into shares of the Company’s common stock at a conversion rate equal to 88.9855 shares of common stock per $1,000 principal amount of Series A Notes. Beginning on October 5, 2012, the Company will have the option to convert all or any portion of the outstanding Series A Notes, upon not more than 60 days and not less than 20 days prior notice to noteholders; provided that (i) the Company’s common stock is listed on either the NYSE or NASDAQ markets and (ii) the 30 trading day volume weighted average price for our common stock for the 30-day period ending on the trading day preceding the date of such notice is equal to or greater than $15.75 per share. Upon conversion, foreign holders may, under certain conditions, receive warrants in lieu of shares of common stock.
The Series B Notes are mandatorily convertible into shares of the Company’s common stock at a conversion rate equal to 54.7196 shares of common stock per $1,000 principal amount of Series B Notes, subject to the conditions that our common stock is then listed on the NYSE or NASDAQ markets and that we are not in default under our debt obligations. The Series B Notes are mandatorily convertible at the Company’s option into shares of the Company’s common stock or warrants, as the case may be, in two equal installments of $49.7 million each on the three-month and nine-month anniversaries of the consummation of the exchange offer. The Series B Notes will be automatically converted into Series A Notes on the one-year anniversary of the issuance of the 6.00% Convertible Notes if the Company is unable to effect the second mandatory conversion prior to such date.
The conversion rate of the Series A Notes and Series B Notes may be increased in certain circumstances to compensate the holders thereof for the loss of the time value of the conversion right (i) if at any time the Company’s common stock or the common stock into which the new notes may be converted is greater than or equal to $11.25 per share and is not listed on the NYSE or NASDAQ markets or (ii) if a change of control occurs, unless at least 90% of the consideration received or to be received by holders of common stock, excluding cash payments for fractional shares, in connection with the transaction or transactions constituting the change of control, consists of shares of common stock, American Depositary Receipts or American Depositary Shares traded on a national securities exchange in the United States or which will be so traded or quoted when issued or exchanged in connection with such change of control. Upon a change of control, holders will have the right to require the Company to repurchase for cash the outstanding Series A Notes and Series B Notes at 101% of the aggregate principal amount, plus accrued and unpaid interest.
F-14
Table of Contents
The long-term debt and embedded conversion options associated with the Series A Notes and Series B Notes were recorded on the Company’s balance sheet at their fair value on October 5, 2011. Fair value of the Series A Notes was calculated using a trinomial lattice convertible bond valuation model, which incorporated the terms and conditions of the Series A Notes. One of the inputs to the trinomial lattice model is the bond yield of a hypothetical note identical to the Series A Notes, excluding the conversion features and its related make-whole provisions. The trinomial lattice model produces an estimated fair value based on the assumed changes in prices of the underlying equity over successive periods of time. The Series B Notes were valued using a Monte-Carlo simulation to estimate the probability of conversion. The probability of equity conversion is multiplied by the common stock price as of the valuation date. The estimation of the probability was performed by using a Monte-Carlo simulation in order to estimate a range of simulated future market capitalization over the conversion term. For each equity path, the daily stock price of the Company is considered to follow a Geometric Brownian Motion with a drift equal to the cost of equity. On October 5, 2011, the fair value of the long-term debt portion of the Series A Notes and Series B Notes was $105.6 million and $58.6 million, respectively. The original issue discounts are being amortized through interest expense through the maturity of the Series A and Series B Notes.
On October 5, 2011, the fair value of the embedded conversion options within the Series A and the Series B Notes totaled $98.5 million. To calculate the fair value of the embedded derivatives, a “with” and “without” scenario comparison was used. The methodology used to value the Series A Notes and Series B Notes constitute the “with” scenarios. The “without” scenario was estimated as a bond paying the same coupon payments as the securities without any conversion features. The fair value of the embedded conversion options was estimated as the difference between the two scenarios. At each fiscal quarter end, the Company is required to mark-to-market these embedded conversion options. As of December 25, 2011, the fair value of the embedded conversion options was $14.0 million. The $84.5 million decrease from the fair value on October 5, 2011 was recorded as a non-cash gain within other expense (income) on the Consolidated Statements of Operations.
See Note 18 for current information related to the conversion of the remaining Series A and Series B Notes.
Warrants
The warrants were issued pursuant to a warrant agreement, which the Company entered into with The Bank of New York Mellon Trust Company, N.A, as warrant agent, on October 5, 2011, as amended by Amendment No. 1 as of December 7, 2011 (the “Warrant Agreement”). Pursuant to the Warrant Agreement, each warrant entitles the holder to purchase common stock at a price of $0.01 per share, subject to adjustment in certain circumstances. In connection with the reverse stock split, warrant holders will receive 1/25th of a share of the Company’s common stock upon conversion. Upon issuance, in lieu of payment of the exercise price, a warrant holder will have the right (but not the obligation) to require the Company to convert its warrants, in whole or in part, into shares of its common stock without any required payment or request that the Company withhold, from the shares of common stock that would otherwise be delivered to such warrant holder, shares issuable upon exercise of the Warrants equal in value to the aggregate exercise price.
Warrant holders will not be permitted to exercise or convert their warrants if and to the extent the shares of common stock issuable upon exercise or conversion would constitute “excess shares” (as defined in the Company’s certificate of incorporation) if they were issued in order to abide by the foreign ownership limitations imposed by the Company’s certificate of incorporation. In addition, a warrant holder who cannot establish to the Company’s reasonable satisfaction that it (or, if not the holder, the person that the holder has designated to receive the common stock upon exercise or conversion) is a United States citizen, will not be permitted to exercise or convert its warrants to the extent the receipt of the common stock upon exercise or conversion would cause such person or any person whose ownership position would be aggregated with that of such person to exceed 4.9% of the Company’s outstanding common stock.
The warrants contain no provisions allowing the Company to force redemption and there is no conditional obligation of the Company to redeem or convert the warrants. Each warrant is convertible into an equal number of shares of the Company’s common stock at an exercise price of $0.01 per share, which the Company has the
F-15
Table of Contents
option to waive. In addition, the Company has sufficient authorized and unissued shares available to settle the warrants during the maximum period the warrants could remain outstanding. As a result, the warrants do not meet the definition of an asset or liability and were classified as equity on the date of issuance. The warrants will be evaluated on a continuous basis to determine if equity classification continues to be appropriate.
First Lien Notes
The First Lien Notes were issued pursuant to an indenture on October 5, 2011. The First Lien Notes bear interest at a rate of 11.0% per annum, payable semiannually, beginning on April 15, 2012 and mature on October 15, 2016. The First Lien Notes are callable by the Company at 101.5% of their aggregate principal amount, plus accrued and unpaid interest in the first year after their issuance and at par plus accrued and unpaid interest thereafter. The Company is obligated to make mandatory prepayments on an annual basis of 1%.
The First Lien Notes are secured by a first priority lien on all Secured Notes Priority Collateral and a second priority lien on all ABL Priority Collateral (each as defined below). The First Lien Notes contain affirmative and negative covenants which are typical for senior secured high-yield notes with no maintenance based covenants. The First Lien Notes contain other covenants, including: change of control put at 101% (subject to a permitted holder exception); limitation on asset sales; limitation on incurrence of indebtedness and preferred stock; limitation on restricted payments; limitation on restricted investments; limitation on liens; limitation on dividend blockers; limitation on affiliate transactions; limitation on sale/leaseback transactions; limitation on guarantees by restricted subsidiaries; and limitation on mergers, consolidations and sales of all/substantially all of the assets of the Company. These covenants are subject to certain exceptions and qualifications.
On October 5, 2011, the fair value of the First Lien Notes was $228.4 million, which reflects the Company’s ability to call the First Lien Notes at 101.5% during the first year and at par thereafter. The original issue premium of $3.4 million is being amortized through interest expense through the maturity of the First Lien Notes.
The Company entered into a registration rights agreement with the purchasers of the First Lien Notes, which was amended on April 3, 2012. The Company is obligated to complete an A/B Exchange Offer as soon as practicable but in no event later than 300 days after the issuance of the First Lien Notes. If the Company does not complete the A/B Exchange Offer within the 300 day period, this will result in a registration default and 0.25% of additional interest per 90 days of registration default will be added to the interest payable on the First Lien Notes, up to a maximum of 1.00% of additional interest.
Second Lien Notes
On October 5, 2011, the Company completed the sale of $100.0 million aggregate principal amount of its Second Lien Notes. The Second Lien Notes are fully and unconditionally guaranteed by the Notes Guarantors. The proceeds from the First Lien Notes and the Second Lien Notes were used, among other things, to satisfy in full the Company’s obligations outstanding under its previous first-lien revolving credit facility and term loan, which totaled $265.0 million on October 5, 2011.
The Second Lien Notes bear interest at a rate of either: (i) 13% per annum, payable semi-annually in cash in arrears; (ii) 14% per annum, 50% of which is payable semi-annually in cash in arrears and 50% is payable in kind; or (iii) 15% per annum payable in kind, payable semiannually, beginning on April 15, 2012, and maturing on October 15, 2016. The Second Lien Notes are non-callable for 2 years from the date of their issuance, and thereafter the Second Lien Notes will be callable by the Company at (i) 106% of their aggregate principal amount, plus accrued and unpaid interest thereon in the third year, (ii) 103% of their aggregate principal amount, plus accrued and unpaid interest thereon in the fourth year, and (iii) at par plus accrued and unpaid interest thereafter.
F-16
Table of Contents
The Second Lien Notes contain affirmative and negative covenants which are typical for senior secured high-yield notes with no maintenance based covenants. The Second Lien Notes contain other covenants, including: change of control put at 101% (subject to a permitted holder exception); limitation on asset sales; limitation on incurrence of indebtedness and preferred stock; limitation on restricted payments; limitation on restricted investments; limitation on liens; limitation on dividend blockers; limitation on affiliate transactions; limitation on sale/leaseback transactions; limitation on guarantees by restricted subsidiaries; and limitation on mergers, consolidations and sales of all/substantially all of the assets of the Company. These covenants are subject to certain exceptions and qualifications.
On October 5, 2011, the fair value of the Second Lien Notes was $96.6 million. The original issue discount of $3.4 million is being amortized through interest expense through the maturity of the Second Lien Notes.
The Company entered into a registration rights agreement with the purchasers of the Second Lien Notes, which was amended on April 3, 2012. The Company is obligated to complete an A/B Exchange Offer as soon as practicable but in no event later than 300 days after the issuance of the Second Lien Notes. If the Company does not complete the A/B Exchange Offer within the 300 day period, this will result in a registration default and 0.25% of additional interest per 90 days of registration default will be added to the interest payable on the Second Lien Notes, up to a maximum of 1.00% of additional interest.
ABL Facility
On October 5, 2011, the Company entered into a $100.0 million asset-based revolving credit facility (the “ABL Facility”) with Wells Fargo Capital Finance, LLC (“Wells Fargo”). Use of the ABL Facility is subject to compliance with a customary borrowing base limitation. The ABL Facility includes an up to $30.0 million letter of credit sub-facility and a swingline sub-facility up to $15.0 million, with Wells Fargo serving as administrative agent and collateral agent. The Company has the option to request increases in the maximum commitment under the ABL Facility by up to $25.0 million in the aggregate; however, such incremental facility increases have not been committed to in advance. The ABL Facility was used on the closing date for the rollover of certain issued and outstanding letters of credit and thereafter will be used by the Company for working capital and other general corporate purposes.
The ABL Facility matures October 5, 2016 (but 90 days earlier if the First Lien Notes and the Second Lien Notes are not repaid or refinanced as of such date). The interest rate on the ABL Facility is LIBOR or a base rate plus an applicable margin based on leverage and excess availability ranging from (i) 1.25% to 2.75%, in the case of base rate loans and (ii) 2.25% to 3.75%, in the case of LIBOR loans. A fee ranging from 0.375% to 0.50% per annum will accrue on unutilized commitments under the ABL Facility. As of December 25, 2011, there were no outstanding borrowings under the ABL Facility and total unused borrowing capacity was $52.9 million. The Company had $19.6 million of letters of credit outstanding as of December 25, 2011.
The ABL Facility is secured by (i) a first priority lien on the Company’s interest in accounts receivable, deposit accounts, securities accounts, investment property (other than equity interests of the subsidiaries and joint ventures of the Company) and cash, in each case with certain exceptions and (ii) a fourth priority lien on all or substantially all other assets of the Company securing the First Lien Notes, the Second Lien Notes and the 6.00% Convertible Notes.
The ABL Facility requires compliance with a minimum fixed charge coverage ratio test if excess availability is less than the greater of (i) $12.5 million and (ii) 12.5% of the maximum commitment under the ABL Facility. In addition, the ABL Facility includes certain customary negative covenants that, subject to certain materiality thresholds, baskets and other agreed upon exceptions and qualifications, will limit, among other things, indebtedness, liens, asset sales and other dispositions, mergers, liquidations, dissolutions and other fundamental changes, investments and acquisitions, dividends, distributions on equity or redemptions and
F-17
Table of Contents
repurchases of capital stock, transactions with affiliates, repayments of certain debt, conduct of business and change of control. The ABL Facility also contains certain customary representations and warranties, affirmative covenants and events of default, as well as provisions requiring compliance with applicable citizenship requirements of the Jones Act. The Company was in compliance with all such applicable covenants as of December 25, 2011.
4.25% Convertible Senior Notes
On August 8, 2007, the Company issued the 4.25% Convertible Notes. As mentioned above, on October 5, 2011, the Company completed its offer to exchange $327.8 million in aggregate principal amount of its 4.25% Convertible Notes, representing 99.3% of the aggregate principal amount, for shares of its common stock, warrants to purchase shares of its common stock, and the 6.00% Convertible Notes.
The remaining 4.25% Convertible Notes are general unsecured obligations of the Company and rank equally in right of payment with all of the Company’s other existing and future obligations that are unsecured and unsubordinated. The 4.25% Convertible Notes bear interest at the rate of 4.25% per annum, which is payable in cash semi-annually on February 15 and August 15 of each year. The Notes mature on August 15, 2012.
Senior Credit Facility
On August 8, 2007, the Company entered into a credit agreement (the “Senior Credit Facility”) secured by substantially all of the owned assets of the Company. On October 5, 2011, in connection with the Company’s comprehensive recapitalization plan, the Senior Credit Facility was terminated. The Company utilized a portion of the proceeds received as part of the refinancing transaction to pay $75.0 million on the term loan and $190.0 million on the revolving credit facility.
Derivative Instruments
On March 31, 2008, the Company entered into an Interest Rate Swap Agreement (the “swap”) with Wachovia Bank, National Association, a current subsidiary of Wells Fargo & Co., (“Wachovia”) in the notional amount of $121.9 million. The swap was scheduled to expire on August 8, 2012. Under the swap, the Company and Wachovia agreed to exchange interest payments on the notional amount on the last business day of each calendar quarter. The Company agreed to pay a 3.02% fixed interest rate, and Wachovia agreed to pay a floating interest rate equal to the three-month LIBOR rate. The critical terms of the swap agreement and the term loan were the same, including the notional amounts, interest rate reset dates, maturity dates and underlying market indices. The purpose of entering into this swap was to protect the Company against the risk of rising interest rates by effectively fixing the base interest rate payable related to its term loan. Interest rate differentials paid or received under the swap were recognized as adjustments to interest expense. The Company does not hold or issue interest rate swap agreements for trading purposes. In the event that the counter-party failed to meet the terms of the interest rate swap agreement, the Company’s exposure was limited to the interest rate differential.
In conjunction with the refinancing, the Company paid $1.2 million to terminate the swap. The fair value balance of the swap at termination remains in accumulated other comprehensive loss and is amortized to interest expense over the remaining life of the original swap (through August 8, 2012). As of December 25, 2011, accumulated other comprehensive loss included $0.8 million of unamortized loss relating to the terminated swap. Prior to its termination, the swap was designated as a cash flow hedge of the variability of the cash flows due to changes in LIBOR and was deemed to be highly effective. Accordingly, the Company recorded the fair value of the swap as an asset or liability on its consolidated balance sheet, and any unrealized gain or loss was included in accumulated other comprehensive loss. The Company recorded $1.5 million, $1.1 million, and $0.2 million in other comprehensive loss for the years ended December 25, 2011, December 26, 2010, and December 20, 2009, respectively. No hedge ineffectiveness was recorded during the years ended December 25, 2011, December 26, 2010, and December 20, 2009.
F-18
Table of Contents
Prior Year Classification of Long-Term Debt
At the time of the filing of its Form 10-K for the year ended December 26, 2010, the Company expected that it would experience a covenant default under the indenture related to the $330.0 million aggregate principal amount of 4.25% Convertible Notes. On March 22, 2011, the Court entered a judgment against the Company whereby the Company was required to pay a fine of $45.0 million to resolve the investigation by the U.S. Department of Justice into its domestic ocean shipping business. In March 2011, the Company solicited consents from the holders of the 4.25% Convertible Notes to waive the default that could have arose in connection with that judgment. The Company had until May 21, 2011 to satisfy the judgment or otherwise cure the default under the indenture relating to the 4.25% Convertible Notes. As of March 28, 2011, the Company was not able to obtain a waiver from the holders of the 4.25% Convertible Notes. Acceleration of all principal and interest could have been pursued by the indenture trustee in the event of default. If the indenture trustee pursued an acceleration, such an action would have created a default under the Senior Credit Facility and other loans and financing arrangements due to cross default provisions contained in those agreements.
The Senior Credit Facility contained cross default provisions and certain acceleration clauses whereby if the maturity of the 4.25% Convertible Notes was accelerated, maturity of the Senior Credit Facility could also be accelerated. In addition, the Company expected to experience a covenant default in connection with the amended financial covenants beginning in the third fiscal quarter of 2011. Noncompliance with the financial covenants in the Senior Credit Facility constituted an event of default, which, if not waived, would have prevented the Company from making borrowings under the Senior Credit Facility.
As a result of these factors, the Company classified its obligations under the 4.25% Convertible Notes and the Senior Credit Facility as current liabilities in the accompanying Consolidated Balance Sheet as of December 26, 2010.
Fair Value of Financial Instruments
The estimated fair value of the Company’s debt as of December 25, 2011 and December 26, 2010 totaled $489.0 million and $498.0 million, respectively. The fair value of the 6.00% Convertible Notes is based on the same methodology used to calculate fair value on the date of the closing of the refinancing. The fair value of the 4.25% Convertible Notes is based on quoted market prices. The fair value of the other long-term debt approximates carrying value.
Contractual maturities of long-term debt obligations as of December 25, 2011 are as follows (in thousands):
2012 | $ | 4,494 | ||
2013 | 2,250 | |||
2014 | 2,250 | |||
2015 | 2,250 | |||
2016 | 316,000 | |||
Thereafter | 278,096 | |||
|
| |||
| $ | 605,340 | |||
|
|
Subsequent to December 25, 2011, $49.7 million of the Series B Notes were mandatorily converted into shares of common stock or warrants, which resulted in a gain on conversion of debt of approximately $11.3 million. As a result, contractual maturities of long-term debt obligations during 2017 were reduced from $278.1 million to $228.4 million
F-19
Table of Contents
4. Impairment Charges
The following table presents the components of the impairment charges (in thousands):
| Fiscal Years Ended | ||||||||||||
| December 25, 2011 | December 26, 2010 | December 20, 2009 | ||||||||||
Equipment | $ | 2,997 | $ | 2,655 | $ | — | ||||||
Vessels | — | — | 1,867 | |||||||||
|
|
|
|
|
| |||||||
Total | $ | 2,997 | $ | 2,655 | $ | 1,867 | ||||||
|
|
|
|
|
| |||||||
Equipment
The Company is constructing cranes that were initially expected to be utilized in the Company’s Anchorage, Alaska terminal and were expected to be installed and become fully operational in December 2010. However, the Port of Anchorage Intermodal Expansion Project is encountering delays that could continue until 2014 or beyond. During the second quarter of 2011, the Company initiated a plan to sell these cranes and they were classified as assets held for sale at that time. As a result of the reclassification to assets held for sale, the Company recorded an impairment charge of $2.8 million to write down the carrying value of the cranes to their estimated fair value less costs to sell of $15.4 million. During the fourth quarter of 2011, due to the decline in the estimated proceeds to be received from the sale, the Company reevaluated the plan to sell the cranes. As a result, the Company terminated the plan to sell the cranes and is now expected to deploy the cranes in one of the Company’s other terminal locations. The Company reclassified the cranes to assets held for use and included the cranes as part of construction in progress as of December 25, 2011.
During 2010, the Company reviewed its inventory of owned and leased equipment. The company identified certain of its owned and leased equipment that were not expected to be employed during the foreseeable future or that would be returned to the lessor. As such, the Company recorded a charge of $2.7 million related to the impaired equipment.
Vessels
During 2006, the Company completed a series of agreements to charter five new non-Jones Act qualified container vessels (the “new vessels”). These new vessels were deployed in the Company’s trade routes between the U.S. west coast and Asia and Guam. As a result of the deployment of the new vessels, five of the Company’s Jones Act qualified vessels became spare vessels available for seasonal and dry-dock needs. The Company maintains one vessel for seasonal deployment in the Alaska trade, and one dry-dock relief vessel on both the U.S east coast and U.S. west coast. The remaining two spare vessels were tested for potential impairment. The fair value of each of the spare vessels was determined using the scrap value less certain costs to sell the assets. The carrying value of the spare vessels was in excess of the fair value, and as such, during the year ended December 20, 2009 the Company recorded a write-down of $1.9 million related to its spare vessels.
5. Restructuring
In an effort to continue to effectively manage costs, during the fourth quarter of 2010 the Company initiated a plan to reduce its non-union workforce by at least 10%, or approximately 65 positions. The Company substantially completed the workforce reduction initiative on January 31, 2011 by eliminating a total of 64 positions, including 35 existing and 29 open positions. A restructuring charge of $2.1 million related to this reduction in workforce was recorded during the year ended December 26, 2010.
F-20
Table of Contents
The following table presents the restructuring reserves at December 25, 2011, as well as activity during the year (in thousands):
| Balance at December 26, 2010 | Payments | Adjustments | Balance at December 25, 2011 | |||||||||||||
Personnel related costs | $ | 2,032 | $ | (1,799 | ) | $ | — | $ | 233 | |||||||
Other associated costs | 10 | (10 | ) | — | — | |||||||||||
|
|
|
|
|
|
|
| |||||||||
Total | $ | 2,042 | $ | (1,809 | ) | $ | — | $ | 233 | |||||||
|
|
|
|
|
|
|
| |||||||||
In the consolidated balance sheet as of December 25, 2011, the reserve for restructuring costs is recorded in other accrued liabilities.
6. Discontinued Operations
FSX Service
During the third quarter of 2011, the Company began a review of strategic alternatives for its FSX service. As a result of several factors, including: 1) the projected continuation of volatile trans-Pacific freight rates, 2) high fuel prices, and 3) operating losses, the Company decided to discontinue its FSX service. On October 21, 2011, the Company finalized a decision to terminate the FSX service, and ceased all operations related to the FSX service during the fourth quarter of 2011. The entire component comprising the FSX service has been discontinued. As such, there will not be any significant future cash flows related to these operations.
As a result of the shutdown of the FSX service, the Company recorded a pretax restructuring charge of $119.3 million during the fourth quarter of 2011. The following table presents the details of the $119.3 million restructuring charge recorded the year ended December 25, 2011 (in thousands):
Vessel leases, net of estimated sublease | $ | 81,865 | ||
Rolling stock per-diem and lease termination costs | 11,666 | |||
Non-cash write-off of FSX related assets | 20,100 | |||
Personnel related costs | 5,496 | |||
Facility leases | 187 | |||
|
| |||
Total restructuring charge | $ | 119,314 | ||
|
|
The following table presents the restructuring reserves at December 25, 2011, as well as activity during the year (in thousands):
| Balance at December 26, 2010 | Provision | Payments | Balance at December 25, 2011 | |||||||||||||
Vessel leases, net of estimated sublease(1) | $ | — | $ | 81,865 | $ | (4,805 | ) | $ | 77,060 | |||||||
Rolling stock per-diem and lease termination costs | — | 11,666 | (1,745 | ) | 9,921 | |||||||||||
Personnel related costs | — | 5,496 | (166 | ) | 5,330 | |||||||||||
Facility leases | — | 187 | (52 | ) | 135 | |||||||||||
|
|
|
|
|
|
|
| |||||||||
Total | $ | — | $ | 99,214 | $ | (6,768 | ) | $ | 92,446 | |||||||
|
|
|
|
|
|
|
| |||||||||
| (1) | On April 5, 2012, the Company entered into an agreement to terminate these vessel leases. See Note 18 for additional details. |
Logistics Operations
During 2011, the entire component comprising the third-party logistics operations was discontinued and former logistics customers are no longer customers of the Company. As part of the divestiture, the Company transitioned some of the operations and personnel to other logistics providers. There will not be any significant future cash flows related to these operations. In addition, the Company does not have any significant continuing involvement in the divested logistics operations.
F-21
Table of Contents
During the year ended December 26, 2010, the Company recorded a $5.0 million valuation allowance to adjust the carrying value of the net assets of its discontinued operations to the estimated fair value less costs to sell. As a result of better than expected cash collections of the accounts receivable, the Company reduced the valuation allowance against the net assets of its discontinued operations by $3.2 million during 2011, and decreased the 2011 loss from discontinued operations by the same amount.
The following table includes the major classes of assets that have been presented as assets and liabilities of discontinued operations in the Consolidated Balance Sheets (in thousands):
| December 25, 2011 | December 26, 2010 | |||||||||||||||||||||||
| FSX Service | Logistics | Total | FSX Service | Logistics | Total | |||||||||||||||||||
Accounts receivable, net of allowance | $ | 4,414 | $ | 924 | $ | 5,338 | $ | 18,014 | $ | 10,628 | $ | 28,642 | ||||||||||||
Property and equipment, net | 6,031 | — | 6,031 | 14,660 | 721 | 15,381 | ||||||||||||||||||
Deferred tax asset | 620 | — | 620 | 226 | 648 | 874 | ||||||||||||||||||
Other assets | 1,595 | 22 | 1,617 | 16,681 | 178 | 16,859 | ||||||||||||||||||
|
|
|
|
|
|
|
|
|
|
|
| |||||||||||||
Subtotal | 12,660 | 946 | 13,606 | 49,581 | 12,175 | 61,756 | ||||||||||||||||||
Valuation allowance | — | (631 | ) | (631 | ) | — | (4,983 | ) | (4,983 | ) | ||||||||||||||
|
|
|
|
|
|
|
|
|
|
|
| |||||||||||||
Total current assets of discontinued operations | $ | 12,660 | $ | 315 | $ | 12,975 | $ | 49,581 | $ | 7,192 | $ | 56,773 | ||||||||||||
|
|
|
|
|
|
|
|
|
|
|
| |||||||||||||
| December 25, 2011 | December 26, 2010 | |||||||||||||||||||||||
| FSX Service | Logistics | Total | FSX Service | Logistics | Total | |||||||||||||||||||
Accounts payable | $ | 1,312 | $ | 15 | $ | 1,327 | $ | 3,904 | $ | 890 | $ | 4,794 | ||||||||||||
Current restructuring liabilities | 41,337 | — | 41,337 | — | — | — | ||||||||||||||||||
Other current liabilities | 2,649 | — | 2,649 | 7,778 | 2,809 | 10,587 | ||||||||||||||||||
|
|
|
|
|
|
|
|
|
|
|
| |||||||||||||
Total current liabilities of discontinued operations | 45,298 | 15 | 45,313 | 11,682 | 3,699 | 15,381 | ||||||||||||||||||
Long-term portion of vessel lease obligation | 51,109 | — | 51,109 | — | — | — | ||||||||||||||||||
Deferred tax liability | 184 | — | 184 | 338 | — | 338 | ||||||||||||||||||
|
|
|
|
|
|
|
|
|
|
|
| |||||||||||||
Total long-term liabilities of discontinued operations | 51,293 | — | 51,293 | 338 | — | 338 | ||||||||||||||||||
|
|
|
|
|
|
|
|
|
|
|
| |||||||||||||
Total liabilities of discontinued operations | $ | 96,591 | $ | 15 | $ | 96,606 | $ | 12,020 | $ | 3,699 | $ | 15,719 | ||||||||||||
|
|
|
|
|
|
|
|
|
|
|
| |||||||||||||
The following table presents summarized financial information for the discontinued operations included in the Consolidated Statements of Operations (in thousands):
| December 25, 2011 | December 26, 2010 | December 20, 2009 | ||||||||||||||||||||||||||||||||||
| FSX Service | Logistics | Total | FSX Service | Logistics | Total | FSX Service | Logistics | Total | ||||||||||||||||||||||||||||
Operating revenue | $ | 177,958 | $ | 13,762 | $ | 191,720 | $ | 162,450 | $ | 52,157 | $ | 214,607 | $ | 144,863 | $ | 34,266 | $ | 179,129 | ||||||||||||||||||
Restructuring charge | 119,314 | — | 119,314 | — | — | — | — | — | — | |||||||||||||||||||||||||||
Operating (loss) income | (180,002 | ) | 2,114 | (177,888 | ) | (10,742 | ) | (11,974 | ) | (22,716 | ) | (2,136 | ) | (5,087 | ) | (7,223 | ) | |||||||||||||||||||
Net (loss) income | (177,793 | ) | 1,570 | (176,223 | ) | (10,725 | ) | (11,670 | ) | (22,395 | ) | (2,156 | ) | (4,865 | ) | (7,021 | ) | |||||||||||||||||||
The following table presents summarized cash flow information for the discontinued operations included in the Consolidated Statements of Cash Flows (in thousands):
| December 25, 2011 | ||||||||||||
| FSX Service | Logistics | Total | ||||||||||
Net cash (used in) provided by operating activities | $ | (54,527 | ) | $ | 3,939 | $ | (50,588 | ) | ||||
Net cash used in investing activities | (647 | ) | (58 | ) | (705 | ) | ||||||
|
|
|
|
|
| |||||||
Net change in cash from discontinued operations | $ | (55,174 | ) | $ | 3,881 | $ | (51,293 | ) | ||||
|
|
|
|
|
| |||||||
F-22
Table of Contents
| December 26, 2010 | ||||||||||||
| FSX Service | Logistics | Total | ||||||||||
Net cash used in operating activities | $ | (8,599 | ) | $ | (8,409 | ) | $ | (17,008 | ) | |||
Net cash used in investing activities | (307 | ) | (238 | ) | (545 | ) | ||||||
|
|
|
|
|
| |||||||
Net change in cash from discontinued operations | $ | (8,906 | ) | $ | (8,647 | ) | $ | (17,553 | ) | |||
|
|
|
|
|
| |||||||
| December 20, 2009 | ||||||||||||
| FSX Service | Logistics | Total | ||||||||||
Net cash used in operating activities | $ | (1,910 | ) | $ | (3,583 | ) | $ | (5,493 | ) | |||
Net cash used in investing activities | (3,159 | ) | (119 | ) | (3,278 | ) | ||||||
|
|
|
|
|
| |||||||
Net change in cash from discontinued operations | $ | (5,069 | ) | $ | (3,702 | ) | $ | (8,771 | ) | |||
|
|
|
|
|
| |||||||
7. Property and Equipment
Property and equipment consist of the following (in thousands):
| December 25, 2011 | December 26, 2010 | |||||||||||||||
| Historical Cost | Net Book Value | Historical Cost | Net Book Value | |||||||||||||
Vessels and vessel improvements | $ | 150,658 | $ | 67,379 | $ | 147,032 | $ | 74,057 | ||||||||
Containers | 37,831 | 23,114 | 37,212 | 24,089 | ||||||||||||
Chassis | 12,713 | 5,429 | 12,449 | 5,938 | ||||||||||||
Cranes | 27,641 | 15,144 | 26,744 | 16,253 | ||||||||||||
Machinery & equipment | 31,015 | 11,661 | 28,962 | 11,206 | ||||||||||||
Facilities & land improvement | 27,257 | 21,293 | 26,355 | 21,176 | ||||||||||||
Software | 25,169 | 1,268 | 23,837 | 1,605 | ||||||||||||
Construction in progress | 21,857 | 21,857 | 25,673 | 25,673 | ||||||||||||
|
|
|
|
|
|
|
| |||||||||
Total | $ | 334,141 | $ | 167,145 | $ | 328,264 | $ | 179,997 | ||||||||
|
|
|
|
|
|
|
| |||||||||
The majority of depreciation expense is related to vessels. Depreciation expense related to vessels was $10.4 million, $11.1million and $10.8 million for the years ended December 25, 2011, December 26, 2010 and December 20, 2009, respectively. Depreciation expense related to capitalized software was $1.7 million, $1.7 million and $2.1 million for the years ended December 25, 2011, December 26, 2010 and December 20, 2009, respectively. Depreciation expense related to assets recorded under capital lease was $0.6 million and $0.1 million during the years ended December 25, 2011 and December 26, 2010, respectively. During the years ended December 26, 2010 and December 20, 2009, the Company capitalized interest totaling $0.6 million and $0.4 million, respectively.
8. Intangible Assets
Intangible assets other than goodwill consist of the following (in thousands):
| December 25, 2011 | December 26, 2010 | |||||||
Customer contracts/relationships | $ | 141,430 | $ | 141,430 | ||||
Trademarks | 63,800 | 63,800 | ||||||
Deferred financing costs | 15,450 | 14,906 | ||||||
|
|
|
| |||||
Total intangibles with definite lives | 220,680 | 220,136 | ||||||
Less: accumulated amortization | (150,738 | ) | (139,312 | ) | ||||
|
|
|
| |||||
Total intangible assets, net | $ | 69,942 | $ | 80,824 | ||||
|
|
|
| |||||
F-23
Table of Contents
Estimated annual amortization expense associated with the Company’s definite lived intangible assets for each of the succeeding five fiscal years is as follows (in thousands):
Fiscal Year Ending | ||||
2012 | $ | 20,488 | ||
2013 | 15,058 | |||
2014 | 9,469 | |||
2015 | 7,245 | |||
2016 | 6,850 |
A rollforward of the Company’s goodwill balance and accumulated impairment charges are as follows (in thousands):
Goodwill balance as of December 26, 2010 | $ | 314,149 | ||
Estimated third quarter 2011 impairment charge | (117,506 | ) | ||
|
| |||
Goodwill balance as of September 25, 2011 | 196,643 | |||
Fourth quarter 2011 adjustment to estimated third quarter 2011 impairment charge | 2,150 | |||
|
| |||
Goodwill balance as of December 25, 2011 | $ | 198,793 | ||
|
|
Accumulated goodwill impairment charge as of December 20, 2009 | $ | 17,603 | ||
Impairment charge in 2010 | 2,919 | |||
|
| |||
Accumulated goodwill impairment charges as of December 26, 2010 | 20,522 | |||
Impairment charge in 2011, net of adjustment | 115,356 | |||
|
| |||
Accumulated goodwill impairment charges as of December 25, 2011 | $ | 135,878 | ||
|
|
Due to the announced shutdown of the Company’s FSX service and deterioration in earnings during 2011, the Company recorded an estimated goodwill impairment charge of $117.5 million in the fiscal third quarter ended September 25, 2011. The impairment charge represented the Company’s best estimate of the interim goodwill impairment. The Company recorded an estimated charge, because it had not yet completed its interim goodwill impairment analysis due to complexities involved in determining the implied fair value of its goodwill. The Company completed its interim goodwill impairment analysis during the fourth quarter of 2011 and recorded an adjustment to decrease the estimated goodwill impairment charge by $2.2 million.
During the annual impairment assessment during 2010, the Company determined the goodwill associated with its logistics services reporting unit was impaired and recorded an impairment charge of $2.9 million. The goodwill impairment was a result of the Company discontinuing its logistics services business.
The Company used the income approach, specifically a discounted cash flow method, to derive the fair value of the Company’s reporting unit for goodwill impairment assessment because there are not observable inputs available (Level 3 hierarchy as defined by ASC 820, Fair Value Measurement). This approach calculates fair value by estimating the after-tax cash flows attributable to the Company’s reporting unit and then discounts the after-tax cash flows to a present value using a risk-adjusted discount rate. The Company selected this method as the most meaningful in assessing goodwill for impairment, because it most reasonably measures the Company’s income producing assets. The Company considered using the market approach and the cost approach, but concluded they are not appropriate in valuing its reporting unit given the lack of relevant market comparisons available for application of the market approach and the inability to reasonably replicate the value of the specific assets within its reporting unit for application of the cost approach. However, market approach information was incorporated into the Company’s test to ensure the reasonableness of the Company’s conclusions on estimated value under the income approach.
F-24
Table of Contents
In applying the income approach to its accounting for goodwill, the Company made assumptions about the amount and timing of future expected cash flows, vessel replacement plans, terminal value growth rates and the discount rate. The amount and timing of future cash flows within the discounted cash flow analysis is based on the Company’s most recent operational budgets, long range strategic plans and other estimates. The terminal value growth rate is used to calculate the value of cash flows beyond the last projected period in the Company’s discounted cash flow analysis (the terminal period) and reflects the Company’s best estimate for perpetual growth of its reporting unit. The Company used a discount rate of 15% to apply to the reporting unit’s future expected cash flows in the terminal period as the discount rate represents the best estimate of the Company’s weighted-average costs of capital at the goodwill impairment assessment date. The discount rate used in the estimate of fair value considered the Company’s actual cost of capital on the October 5, 2011 comprehensive refinancing date (see Note 3 for further discussion).
The Company completed its interim goodwill impairment analysis in the fourth quarter of 2011 and determined the actual amount of goodwill impairment for 2011. The Company’s impairment analysis indicated the fair value of long term assets, including property, plant, and equipment, and customer contracts, exceeded book value. Thus, the goodwill impairment was a result of both the deterioration in earnings and the appreciation in value of certain of the Company’s underlying assets. The 2011 goodwill impairment charge is included in operating expenses in the accompanying consolidated statement of operations.
The Company performed its annual goodwill impairment test during the fourth quarter of 2011. Fair value, as calculated using the methodology above, exceeded book value and step two was not necessary.
9. Other Accrued Liabilities
Other accrued liabilities consist of the following (in thousands):
| December 25, 2011 | December 26, 2010 | |||||||
Vessel operations | $ | 13,783 | $ | 17,987 | ||||
Payroll and employee benefits | 13,594 | 13,996 | ||||||
Marine operations | 7,077 | 6,787 | ||||||
Terminal operations | 9,297 | 11,219 | ||||||
Fuel | 10,590 | 5,750 | ||||||
Interest | 12,368 | 7,344 | ||||||
Legal settlements | 8,066 | 12,767 | ||||||
Restructuring | 233 | 1,853 | ||||||
Other liabilities | 22,089 | 23,018 | ||||||
|
|
|
| |||||
Total other accrued liabilities | $ | 97,097 | $ | 100,721 | ||||
|
|
|
| |||||
10. Fair Value Measurement
U.S. accounting standards establish a fair value hierarchy that prioritizes the inputs used to measure fair value. The hierarchy gives the highest priority to unadjusted quoted prices in active markets for identical assets or liabilities (Level 1 measurement) and the lowest priority to unobservable inputs (Level 3 measurement). This hierarchy requires entities to maximize the use of observable inputs and minimize the use of unobservable inputs when determining fair value. The three levels of inputs used to measure fair value are as follows:
Level 1: | Observable inputs such as quoted prices in active markets | |
Level 2: | Inputs other than the quoted prices in active markets that are observable either directly or indirectly | |
Level 3: | Unobservable inputs in which there is little or no market data, which requires the Company to develop its own assumptions | |
F-25
Table of Contents
As of December 25, 2011, the Company’s liabilities measured at fair value on a recurring basis are as follows:
| Quoted Prices in Active Markets for Identical Assets (Level 1) | Significant Other Observable Inputs (Level 2) | Significant Unobservable Inputs (Level 3) | Total | |||||||||||||
Conversion feature within Series A Notes (Note 3) | $ | — | $ | — | $ | 28,560 | $ | 28,560 | ||||||||
Conversion feature within Series B Notes (Note 3) | — | — | (14,540 | ) | (14,540 | ) | ||||||||||
|
|
|
|
|
|
|
| |||||||||
Total liabilities | $ | — | $ | — | $ | 14,020 | $ | 14,020 | ||||||||
|
|
|
|
|
|
|
| |||||||||
As of December 25, 2011, the Company’s assets measured at fair value on a non-recurring basis are as follows:
| Quoted Prices in Active Markets for Identical Assets (Level 1) | Significant Other Observable Inputs (Level 2) | Significant Unobservable Inputs (Level 3) | Total | |||||||||||||
Goodwill (Note 8) | $ | — | $ | — | $ | 198,793 | $ | 198,793 | ||||||||
|
|
|
|
|
|
|
| |||||||||
Total assets | $ | — | $ | — | $ | 198,793 | $ | 198,793 | ||||||||
|
|
|
|
|
|
|
| |||||||||
F-26
Table of Contents
11. Net Loss Per Common Share
Basic net loss per share is computed by dividing net loss by the weighted daily average number of shares of common stock outstanding during the period. Diluted net loss per share is based upon the weighted daily average number of shares of common stock outstanding for the period plus dilutive potential common shares, including stock options using the treasury-stock method and from convertible stock using the “if converted” method (in thousands, except per share amounts):
| Fiscal Years Ended | ||||||||||||
| December 25, 2011 | December 26, 2010 | December 20, 2009 | ||||||||||
Numerator: | ||||||||||||
Loss from continuing operations | $ | (53,194 | ) | $ | (35,574 | ) | $ | (24,251 | ) | |||
Loss from discontinued operations | (176,223 | ) | (22,395 | ) | (7,021 | ) | ||||||
|
|
|
|
|
| |||||||
Net loss | $ | (229,417 | ) | $ | (57,969 | ) | $ | (31,272 | ) | |||
|
|
|
|
|
| |||||||
Denominator: | ||||||||||||
Denominator for basic loss per common share: | ||||||||||||
Weighted average shares outstanding | 1,464 | 1,226 | 1,209 | |||||||||
|
|
|
|
|
| |||||||
Effect of dilutive securities: | ||||||||||||
Stock-based compensation | — | — | — | |||||||||
Warrants | — | — | — | |||||||||
|
|
|
|
|
| |||||||
Denominator for diluted net loss per common share | 1,464 | 1,226 | 1,209 | |||||||||
|
|
|
|
|
| |||||||
Basic net loss per common share from continuing operations | $ | (36.33 | ) | $ | (29.01 | ) | $ | (20.06 | ) | |||
Basic net loss per common share from discontinued operations | (120.37 | ) | (18.27 | ) | (5.81 | ) | ||||||
|
|
|
|
|
| |||||||
Basic net loss per common share | $ | (156.70 | ) | $ | (47.28 | ) | $ | (25.87 | ) | |||
|
|
|
|
|
| |||||||
Diluted net loss per common share from continuing operations | $ | (36.33 | ) | $ | (29.01 | ) | $ | (20.06 | ) | |||
Diluted net loss per common share from discontinued operations | (120.37 | ) | (18.27 | ) | (5.81 | ) | ||||||
|
|
|
|
|
| |||||||
Diluted net loss per common share | $ | (156.70 | ) | $ | (47.28 | ) | $ | (25.87 | ) | |||
|
|
|
|
|
| |||||||
A total of 949 thousand, 13 thousand and 14 thousand shares have been excluded from the denominator during the years ended December 25, 2011, December 26, 2010, and December 20, 2009, respectively, as the impact would be anti-dilutive. Warrants outstanding to purchase 918 thousand common shares have been excluded from the denominator during the year ended December 25, 2011 as the impact would be anti-dilutive.
Certain of the Company’s unvested stock-based awards contain non-forfeitable rights to dividends. In periods when the Company generates net income, shares are included in the denominator for these participating securities. However, in periods when the Company generates a net loss, shares are excluded from the denominator for these participating securities as the impact would be anti-dilutive. A total of 5 thousand, 6 thousand, and 9 thousand shares have been excluded from the denominator for basic net loss per share during the years ended December 25, 2011, December 26, 2010, and December 20, 2009, respectively.
12. Leases
The Company leases certain equipment and facilities under operating lease agreements. Non-cancelable, long-term leases generally include provisions for maintenance, options to purchase at fair value and to extend the terms. Rent expense under operating lease agreements totaled $110.6 million, $107.3 million and $104.2 million for the years ended December 25, 2011, December 26, 2010 and December 20, 2009, respectively.
F-27
Table of Contents
Future minimum lease obligations at December 25, 2011 are as follows (in thousands):
Fiscal Year Ending December | Non-Cancelable Operating Leases | Capital Lease | ||||||
2012 | $ | 121,036 | $ | 2,331 | ||||
2013 | 116,571 | 1,526 | ||||||
2014 | 100,339 | 1,526 | ||||||
2015 | 80,184 | 1,526 | ||||||
2016 | 45,622 | 1,526 | ||||||
Thereafter | 95,073 | 1,400 | ||||||
|
|
|
| |||||
Total future minimum lease obligation | $ | 558,825 | 9,835 | |||||
|
| |||||||
Less: amounts representing interest | 2,305 | |||||||
|
| |||||||
Present value of future minimum lease obligation | 7,530 | |||||||
Current portion of capital lease obligation | 1,646 | |||||||
|
| |||||||
Long-term portion of capital lease obligation | $ | 5,884 | ||||||
|
| |||||||
13. Employee Benefit Plans
Savings Plans
The Company provides a 401(k) Savings Plan for substantially all of its employees who are not part of collective bargaining agreements. Under provisions of the savings plan, an employee is immediately vested with respect to Company contributions. Historically, the Company has matched 100% of employee contributions up to 6% of qualified compensation. However, during the fourth quarter of 2009, the Company reduced its match to 50% of employee contributions up to 6% of qualified compensation. The cost for this benefit totaled $1.0 million, $1.1 million and $2.1 million for the years ended December 25, 2011, December 26, 2010 and December 20, 2009, respectively. The Company also administers a 401(k) plan for certain union employees with no Company match.
Pension and Post-Retirement Benefit Plans
The Company provides pension and post-retirement benefit plans for certain of its union workers. Each of the plans is described in more detail below. A decline in the value of assets held by these plans, caused by negative performance of the investments in the financial markets, and lower discount rates due to falling interest rates, has resulted in higher contributions to these plans.
Pension Plans
The Company sponsors a defined benefit plan covering approximately 30 union employees as of December 25, 2011. The plan provides for retirement benefits based only upon years of service. Employees whose terms and conditions of employment are subject to or covered by the collective bargaining agreement between Horizon Lines and the International Longshore & Warehouse Union Local 142 are eligible to participate once they have completed one year of service. Contributions to the plan are based on the projected unit credit actuarial method and are limited to the amounts that are currently deductible for income tax purposes. The Company recorded net periodic benefit costs of $0.7 million during each of the years ended December 25, 2011 and December 26, 2010, and $0.8 million during the year December 20, 2009. The plan was underfunded by $0.9 million and $1.3 million at December 25, 2011 and December 26, 2010, respectively.
The HSI pension plan covering approximately 50 salaried employees was frozen to new entrants as of December 31, 2005. Contributions to the plan are based on the projected unit credit actuarial method and are
F-28
Table of Contents
limited to the amounts that are currently deductible for income tax purposes. The Company recorded net periodic benefit costs of $0.2 million during each of the years ended December 25, 2011 and December 26, 2010, and $0.3 million during the year ended December 20, 2009. The plan was underfunded by $2.8 million and $2.5 million at December 25, 2011 and December 25, 2010, respectively.
Post-retirement Benefit Plans
In addition to providing pension benefits, the Company provides certain healthcare (both medical and dental) and life insurance benefits for eligible retired members (“post-retirement benefits”). For eligible employees hired on or before July 1, 1996, the healthcare plan provides for post-retirement health coverage for an employee who, immediately preceding his/her retirement date, was an active participant in the retirement plan and has attained age 55 as of his/her retirement date. For eligible employees hired after July 1, 1996, the plan provides post-retirement health coverage for an employee who, immediately preceding his/her retirement date, was an active participant in the retirement plan and has attained a combination of age and service totaling 75 years or more as of his/her retirement date. The net periodic benefit costs related to the post-retirement benefits were $0.7 million, $0.5 million, and $0.8 million during the years ended December 25, 2011, December 26, 2010, and December 20, 2009, respectively. The post-retirement benefit plan was underfunded by $5.2 million and $5.1 million at December 25, 2011 and December 26, 2010, respectively.
Effective June 25, 2007, the HSI plan provides for post-retirement medical, dental and life insurance benefits for salaried employees who had attained age 55 and completed 20 years of service as of December 31, 2005. Any salaried employee already receiving post-retirement medical coverage as of June 25, 2007 will continue to be covered by the plan. For eligible union employees hired on or before July 1, 1996, the healthcare plan provides for post-retirement medical coverage for an employee who, immediately preceding his/her retirement date, was an active participant in the retirement plan and has attained age 55 as of his/her retirement date. For eligible union employees hired after July 1, 1996, the plan provides post-retirement health coverage for an employee who, immediately preceding his/her retirement date, was an active participant in the retirement plan and has attained age 55 and has a combination of age and service totaling 75 years or more as of his/her retirement date. The Company recorded net periodic benefit costs of $0.4 million during each of the years ended December 25, 2011, December 26, 2010, and December 20, 2009. The plan was underfunded by $4.9 million and $5.7 million at December 25, 2011 and December 26, 2010, respectively.
F-29
Table of Contents
Obligations and Funded Status
| Pension Plans | Post-retirement Benefit Plans | |||||||||||||||||
| 2011 | 2010 | 2011 | 2010 | |||||||||||||||
| (In thousands) | ||||||||||||||||||
Change in Benefit Obligation | ||||||||||||||||||
Beginning obligations | $ | (11,914 | ) | $ | (10,771 | ) | $ | (10,788 | ) | $ | (8,925 | ) | ||||||
Service cost | (415 | ) | (396 | ) | (383 | ) | (312 | ) | ||||||||||
Interest cost | (712 | ) | (675 | ) | (643 | ) | (557 | ) | ||||||||||
Amendments | — | — | — | — | ||||||||||||||
Actuarial gain (loss) | 449 | (464 | ) | 1,521 | (1,223 | ) | ||||||||||||
Benefits paid | 408 | 392 | 216 | 229 | ||||||||||||||
|
|
|
|
|
|
|
| |||||||||||
Ending obligations | (12,184 | ) | (11,914 | ) | (10,077 | ) | (10,788 | ) | ||||||||||
|
|
|
|
|
|
|
| |||||||||||
Change in Plans’ Assets | ||||||||||||||||||
Beginning fair value | 8,128 | 7,064 | — | — | ||||||||||||||
Actual return on plans’ assets | (79 | ) | 786 | — | — | |||||||||||||
Employer contributions | 917 | 670 | — | — | ||||||||||||||
Benefits paid | (408 | ) | (392 | ) | — | — | ||||||||||||
|
|
|
|
|
|
|
| |||||||||||
Ending fair value | 8,558 | 8,128 | — | — | ||||||||||||||
|
|
|
|
|
|
|
| |||||||||||
Funded status at end of year | $ | (3,626 | ) | $ | (3,786 | ) | $ | (10,077 | ) | $ | (10,788 | ) | ||||||
|
|
|
|
|
|
|
| |||||||||||
Net Periodic Benefit Cost
| Pension Plans | Post-retirement Benefit Plans | |||||||||||||||||
| 2011 | 2010 | 2011 | 2010 | |||||||||||||||
| (In thousands) | ||||||||||||||||||
Service cost | $ | 415 | $ | 396 | $ | 383 | $ | 312 | ||||||||||
Interest cost | 712 | 675 | 643 | 558 | ||||||||||||||
Expected return on plan assets | (624 | ) | (526 | ) | — | — | ||||||||||||
Amortization of prior service cost | 255 | 255 | 103 | 103 | ||||||||||||||
Amortization of transition obligation | 102 | 102 | — | — | ||||||||||||||
Amortization of (gain) loss | — | (23 | ) | (28 | ) | (26 | ) | |||||||||||
|
|
|
|
|
|
|
| |||||||||||
Net periodic benefit cost | $ | 860 | $ | 879 | $ | 1,101 | $ | 947 | ||||||||||
|
|
|
|
|
|
|
| |||||||||||
Rate Assumptions
| Pension Benefits | Post-retirement Benefits | |||||||||||||||||
| 2011 | 2010 | 2011 | 2010 | |||||||||||||||
Weighted-average discount rate used in determining net periodic cost | 6.1 | % | 6.4 | % | 6.1 | % | 6.4 | % | ||||||||||
Weighted-average expected long-term rate of return on plan assets in determination of net periodic costs | 7.5 | % | 7.5 | % | 0.0 | % | 0.0 | % | ||||||||||
Weighted-average rate of compensation increase(1) | 0.0 | % | 0.0 | % | 0.0 | % | 0.0 | % | ||||||||||
Weighted-average discount rate used in determination of projected benefit obligation | 5.3 | % | 6.1 | % | 5.3 | % | 6.1 | % | ||||||||||
Assumed health care cost trend: | ||||||||||||||||||
Initial trend | N/A | N/A | 9.0 | % | 9.0 | % | ||||||||||||
Ultimate trend rate | N/A | N/A | 5.0 | % | 5.0 | % | ||||||||||||
| (1) | The defined benefit plan benefit payments are not based on compensation, but rather on years of service. |
F-30
Table of Contents
For every 1% increase in the assumed health care cost trend rate, service and interest cost will increase $0.2 million and the Company’s benefit obligation will increase $1.7 million. For every 1% decrease in the assumed health care cost trend rate, service and interest cost will decrease $0.2 million and the Company’s benefit obligation will decrease $1.3 million. Expected Company contributions during 2012 total $0.8 million, all of which is related to the pension plan. The following benefit payments, which reflect expected future service, as appropriate, are expected to be paid (in thousands):
Fiscal Year Ending | Pension Benefits | Post-retirement Benefits | ||||||
2012 | $ | 482 | $ | 329 | ||||
2013 | 523 | 362 | ||||||
2014 | 554 | 354 | ||||||
2015 | 585 | 364 | ||||||
2016 | 602 | 380 | ||||||
2017-2021 | 3,790 | 2,228 | ||||||
|
|
|
| |||||
| $ | 6,536 | $ | 4,017 | |||||
|
|
|
| |||||
The Company’s pension plans’ investment policy and weighted average asset allocations at December 25, 2011 and December 26, 2010 by asset category are as follows:
Asset Category | Pension Assets at December 25, 2011 | Pension Assets at December 26, 2010 | ||||||
Cash | 4 | % | 2 | % | ||||
Equity securities | 62 | % | 58 | % | ||||
Debt securities | 34 | % | 40 | % | ||||
|
|
|
| |||||
| 100 | % | 100 | % | |||||
|
|
|
| |||||
The objective of the pension plan investment policy is to grow assets in relation to liabilities, while prudently managing the risk of a decrease in the pension plans’ assets. The pension plan management committee has established a target investment mix with upper and lower limits for investments in equities, fixed-income and other appropriate investments. Assets will be re-allocated among asset classes from time-to-time to maintain the target investment mix. The committee has established a target investment mix of 65% equities and 35% fixed-income for the plans. All pension plan assets are classified within Level 1 of the fair value hierarchy.
The expected return on plan assets is based on the asset allocation mix and historical return, taking into account current and expected market conditions.
Other Plans
Under collective bargaining agreements, the Company participates in a number of union-sponsored, multi-employer benefit plans. Payments to these plans are made as part of aggregate assessments generally based on hours worked, tonnage moved, or a combination thereof. Expense for these plans is recognized as contributions are funded.
F-31
Table of Contents
The Company participates in the following multi-employer health and benefit plans:
Health and Benefits Fund | EIN/Pension Plan | 5% Contributor | Multi-employer Contributions (in thousands) | Surcharge Imposed | Expiration Date of Collective Bargaining Agreement | |||||||||||||||||||||
| 2011 | 2010 | 2009 | ||||||||||||||||||||||||
ILA — PRSSA Welfare Fund | 66-0214500 - 501 | Yes | $ | 3,159 | $ | 3,571 | $ | 3,359 | No | September 30, 2012 | ||||||||||||||||
MEBA Medical and Benefits Plan | 13-5590515 - 501 | Yes | 2,876 | 2,981 | 3,837 | No | June 15, 2022 | |||||||||||||||||||
MM&P Health and Benefit Plan | 13-6696938 - 501 | Yes | 2,780 | 2,753 | 3,356 | No | June 15, 2017 | |||||||||||||||||||
Alaska Teamster-Employer Welfare Trust | 91-6034674 - 501 | Yes | 3,064 | 2,605 | 2,453 | No | June 30, 2011 | |||||||||||||||||||
All Alaska Longshore Health and Welfare Trust Fund | 91-6070467 - 501 | Yes | 2,112 | 1,752 | 1,510 | No | June 30, 2012 | |||||||||||||||||||
Seafarers Health and Benefits Plan(1) | 13-5557534 - 501 | Yes | 6,263 | 6,254 | 7,176 | No | June 30, 2012 | |||||||||||||||||||
Western Teamsters Welfare Trust | 91-6033601 - 501 | No | 2,731 | 2,996 | 2,865 | No | March 31, 2013 | |||||||||||||||||||
Office and Professional Employees Welfare Fund | 23-7120690 - 501 | No | 139 | 132 | 112 | No | November 9, 2012 | |||||||||||||||||||
Stevedore Industry Committee Welfare Benefit Plan | 99-0313967 - 501 | Yes | 3,265 | 3,448 | 3,044 | No | June 30, 2014 | |||||||||||||||||||
|
|
|
|
|
| |||||||||||||||||||||
| $ | 26,389 | $ | 26,492 | $ | 27,712 | |||||||||||||||||||||
| (1) | Contributions made to the Seafarers Health and Benefits Plan are re-allocated to the Seafarers Pension Fund at the discretion of the plan Trustee. |
The Company participates in the following multi-employer pension plans:
| Pension Protection Act Zone Status | Multi-employer Contributions (in thousands) | |||||||||||||||||||||||||
Pension Fund | EIN/Pension Plan Number | 2011 | 2010 | FIP/RP Status Pending / Implemented | 5% Contributor | 2011 | 2010 | 2009 | Surcharge Imposed | Expiration Date of Collective Bargaining Agreement | ||||||||||||||||
ILA — PRSSA Pension Fund | 51-0151862 - 001 | Green | Green | No | Yes | $ | 2,391 | $ | 2,015 | $ | 1,724 | No | September 30, 2012 | |||||||||||||
MEBA Pension Trust | 51-6029896 - 001 | Green | Green | No | No | — | — | — | No | June 15, 2022 | ||||||||||||||||
Masters, Mates and Pilots Pension Plan | 13-6372630 - 001 | Green | Red | No | Yes | 4,457 | 5,023 | 4,710 | No | June 15, 2017 | ||||||||||||||||
Local 153 Pension Fund | 13-2864289 - 001 | Red | Orange | Implemented | Yes | 330 | 341 | 301 | No | November 9, 2012 | ||||||||||||||||
Alaska Teamster-Employer Pension Plan | 92-6003463 - 024 | Red | Red | Implemented | Yes | 3,210 | 2,529 | 2,449 | Yes | June 30, 2011 | ||||||||||||||||
All Alaska Longshore Pension Plan | 91-6085352 - 001 | Green | Green | No | Yes | 846 | 693 | 598 | No | June 30, 2012 | ||||||||||||||||
Seafarers Pension Fund (1) | 13-6100329 - 001 | Green | Green | No | Yes | — | — | — | No | June 30, 2012 | ||||||||||||||||
Western Conference of Teamsters Pension Plan | 91-6145047 - 001 | Green | Green | No | No | 4,717 | 4,514 | 3,463 | No | March 31, 2013 | ||||||||||||||||
Western Conference of Teamsters Supplemental Benefit Trust | 95-3746907 - 001 | Green | Green | No | Yes | 203 | 200 | 207 | No | March 31, 2013 | ||||||||||||||||
Western States Office and Professional Employees Pension Fund | 94-6076144 - 001 | Red | Red | Implemented | No | 81 | 82 | 77 | No | November 9, 2012 | ||||||||||||||||
Hawaii Stevedoring Multiemployer Pension Plan | 99-0314293 - 001 | Yellow | Yellow | Implemented | Yes | 2,631 | 2,940 | 2,523 | No | June 30, 2014 | ||||||||||||||||
Hawaii Terminals Multiemployer Pension Plan | 20-0389370 - 001 | Yellow | Yellow | Implemented | No | 277 | 288 | 252 | No | June 30, 2014 | ||||||||||||||||
|
|
|
|
|
| |||||||||||||||||||||
| $ | 19,143 | $ | 18,625 | $ | 16,304 | |||||||||||||||||||||
| (1) | The Company does not make contributions directly to the Seafarers Pension Plan. Instead, contributions are made to the Seafarers Health and Benefits Plan and subsequently re-allocated to the Seafarers Pension Fund at the discretion of the plan Trustee. |
F-32
Table of Contents
14. Stock-Based Compensation
Stock-based compensation costs are measured at the grant date, based on the estimated fair value of the award, and are recognized as an expense in the income statement over the requisite service period. Compensation costs related to stock options and restricted shares granted under the Amended and Restated Equity Incentive Plan (the “Plan”), the 2009 Incentive Compensation Plan (the “2009 Plan”), and purchases under the Employee Stock Purchase Plan, as amended (“ESPP”) are recognized using the straight-line method, net of estimated forfeitures. Under the Plan, up to an aggregate of 123,546 shares of common stock may be issued, of which, no shares are available for future issuance as of December 25, 2011. Under the 2009 Plan, up to an aggregate of 40,000 shares of common stock may be issued, of which, 31,696 shares are available for future issuance as of December 25, 2011. Stock options and restricted shares granted to employees under the Plan and the 2009 Plan typically cliff vest and become fully exercisable on the third anniversary of the grant date, provided the employee who was granted such options/restricted shares is continuously employed by the Company or its subsidiaries through such date, and provided any performance based criteria, if any, are met. In addition, recipients who retire from the Company and meet certain age and length of service criteria are typically entitled to proportionate vesting.
The following compensation costs are included within selling, general, and administrative expenses on the condensed consolidated statements of income (in thousands):
| Fiscal Years Ended | ||||||||||||
| December 25, 2011 | December 26, 2010 | December 20, 2009 | ||||||||||
Stock options | $ | 60 | $ | 429 | $ | 1,223 | ||||||
Restricted stock | 586 | 1,550 | 1,743 | |||||||||
Restricted stock units | 81 | — | — | |||||||||
Employee stock purchase plan | 31 | 143 | 130 | |||||||||
|
|
|
|
|
| |||||||
Total | $ | 758 | $ | 2,122 | $ | 3,096 | ||||||
|
|
|
|
|
| |||||||
Stock Options
Stock options granted under the plan have been granted at an option price equal to the closing market value of the stock on the date of the grant. Options granted under this plan have 10-year contractual terms and typically become exercisable after one or three years after the grant date, subject to continuous service with the Company. The Compensation Committee of the Board of Directors of the Company (the “Board of Directors”) approves the grants of nonqualified stock options by the Company, pursuant to the Company’s Amended and Restated Equity Incentive Plan. These options are granted on such approval date. The Company has not granted any stock options since 2008. As of December 25, 2011, there was no unrecognized compensation costs related to stock options.
A summary of option activity for the fiscal year 2011 under the Company’s stock plan is presented below:
Options | Number of Shares | Weighted- Average Exercise Price | Weighted- Average Remaining Contractual Term (Years) | Aggregate Intrinsic Value (000’s) | ||||||||||||
Outstanding at December 26, 2010 | 57,509 | 394.50 | 5.68 | $ | — | |||||||||||
Granted | — | — | ||||||||||||||
Exercised | — | — | ||||||||||||||
Forfeited | (400 | ) | 450.68 | |||||||||||||
Expired | (5,759 | ) | 234.50 | |||||||||||||
|
| |||||||||||||||
Outstanding, vested and exercisable at December 25, 2011 | 51,350 | $ | 389.58 | 4.93 | $ | — | ||||||||||
|
|
|
|
|
|
|
| |||||||||
F-33
Table of Contents
Restricted Stock
On March 15, 2010, the Company granted a total of 19,280 shares of restricted stock to certain employees of the Company and its subsidiaries. The grant date fair value of the restricted shares was $123.00 per share. Of the 19,280 shares granted, 8,400 will vest in full on March 15, 2013. The remaining 10,880 restricted shares were performance based shares and would have vested in full on March 15, 2013 provided an earnings before interest and taxes (“EBIT”) performance target for the Company’s fiscal year 2010 was met. The EBIT performance target was not met and the performance based restricted shares were forfeited in 2010.
On June 1, 2010, the Company granted 1,224 shares of restricted stock to a newly appointed non-employee member on the Company’s Board of Directors. The grant date fair value of the restricted shares was $98.00 per share and the shares will vest in full on June 1, 2013. On June 9, 2010, the Company granted 1,206 shares of restricted stock to a newly appointed non-employee member on the Company’s Board of Directors. The grant date fair value of the restricted shares was $99.50 per share and the shares will vest in full on June 9, 2013.
A summary of the status of the Company’s restricted stock awards for the fiscal year 2011 is presented below:
Restricted Shares | Number of Shares | Weighted- Average Fair Value at Grant Date | ||||||
Nonvested at December 26, 2010 | 25,268 | $ | 141.00 | |||||
Granted | 3,343 | 89.75 | ||||||
Vested | (1,082 | ) | 323.28 | |||||
Forfeited | (3,810 | ) | 179.30 | |||||
|
| |||||||
Nonvested at December 25, 2011 | 23,719 | $ | 119.24 | |||||
|
|
|
| |||||
As of December 25, 2011, there was $0.8 million of unrecognized compensation expense related to all restricted stock awards, which is expected to be recognized over a weighted-average period of 0.9 years.
Restricted Stock Units
On June 2, 2011, the Company granted a total of 20,532 restricted stock units (“RSUs”) to all members of its Board of Directors including its interim President and Chief Executive Officer. The Company’s interim President and Chief Executive Officer received the grant of the RSUs in his capacity as a member of the Board of Directors. Based on the closing price of the Company’s common stock on the grant date, the total fair value of the RSUs granted was $0.6 million. Each RSU has an economic value equal to a share of the Company’s Common Stock (excluding the right to receive dividends). The RSUs will vest June 2, 2012, subject to continued service on the Board of Directors through that date. The RSUs will be settled in cash once the grantee ceases to serve on the Company’s Board of Directors. Effective November 25, 2011, four of the Company’s eight directors retired and were paid cash equal to the value of the RSUs on such date. In accordance with the award provisions, the compensation expense recorded in the Company’s Condensed Statement of Operations reflects the straight-line amortized fair value based on the period end closing price. Based on the value of the Company’s Common Stock on December 25, 2011, there was $26 thousand of unrecognized compensation expense related to the RSUs, which is expected to be recognized over a period of five months.
Employee Stock Purchase Plan
On April 19, 2006, the Board of Directors voted to implement an employee stock purchase plan (as amended, the “ESPP”) effective July 1, 2006. The Company had reserved 12,354 shares of its common stock for issuance under the ESPP. On June 2, 2009, the Company’s stockholders approved the 2009 Employee Stock
F-34
Table of Contents
Purchase Plan (“2009 ESPP”). The 2009 ESPP reserved an additional 24,000 shares of its common stock for future purchases. As of December 25, 2011, there were 11,185 shares of common stock reserved for issuance under the ESPP. Effective April 1, 2011, the Company temporarily suspended the ESPP. There will be no stock-based compensation expense recognized in connection with the ESPP until such time the ESPP is reinstated.
15. Income Taxes
The Company periodically assesses whether it is more likely than not that it will generate sufficient taxable income to realize its deferred income tax assets. The ultimate realization of deferred tax assets is dependent upon the generation of future taxable income (including the reversal of deferred tax liabilities) during the periods in which those temporary differences will become deductible. In making this determination, the Company considers all available positive and negative evidence and makes certain assumptions. The Company considers, among other things, its deferred tax liabilities, the overall business environment, its historical earnings and losses and its outlook for future years.
During the second quarter of 2009, the Company determined that it was unclear as to the timing of when it will generate sufficient taxable income to realize its deferred tax assets. Accordingly, the Company recorded a valuation allowance against our deferred tax assets. The valuation allowance is reviewed quarterly and will be maintained until sufficient positive evidence exists to support the reversal of the valuation allowance. In addition, until such time the Company determines it is more likely than not that it will generate sufficient taxable income to realize its deferred tax assets, income tax benefits associated with future period losses will be fully reserved.
During 2006, the Company elected the application of tonnage tax. Prior to the establishment of a full valuation allowance, the Company’s effective tax rate was impacted by the Company’s income from qualifying shipping activities as well as the income from the Company’s non-qualifying shipping activities and fluctuated based on the ratio of income from qualifying and non-qualifying activities. The Company’s effective tax rate for the years ended December 25, 2011, December 26, 2010 and December 20, 2009 was 0.2%, (1.0)% and (77.3)%, respectively.
Income tax expense is as follows (in thousands):
| Fiscal Years Ended | ||||||||||||
| December 25, 2011 | December 26, 2010 | December 20, 2009 | ||||||||||
Current: | ||||||||||||
Federal | $ | 35 | $ | 35 | $ | 322 | ||||||
State/territory | (235 | ) | 95 | 195 | ||||||||
|
|
|
|
|
| |||||||
Total current | (200 | ) | 130 | 517 | ||||||||
|
|
|
|
|
| |||||||
Deferred: | ||||||||||||
Federal | — | — | 10,359 | |||||||||
State/territory | 326 | 194 | (303 | ) | ||||||||
|
|
|
|
|
| |||||||
Total deferred | 326 | 194 | 10,056 | |||||||||
|
|
|
|
|
| |||||||
Income tax expense | $ | 126 | $ | 324 | $ | 10,573 | ||||||
|
|
|
|
|
| |||||||
F-35
Table of Contents
The difference between the income tax expense (benefit) and the amounts computed by applying the statutory federal income tax rates to earnings before income taxes are as follows (in thousands):
| Fiscal Years Ended | ||||||||||||
| December 25, 2011 | December 26, 2010 | December 20, 2009 | ||||||||||
Income tax benefit at statutory rates: | $ | (18,574 | ) | $ | (11,554 | ) | $ | (4,787 | ) | |||
State/territory, net of federal income tax benefit (excluding valuation allowance) | 716 | (3 | ) | 186 | ||||||||
Qualifying shipping income | 4,615 | (2,978 | ) | 658 | ||||||||
Fines and penalties | (1,908 | ) | 11,168 | 42 | ||||||||
Goodwill impairment | 38,197 | — | — | |||||||||
Cancellation of debt | 5,553 | — | — | |||||||||
Gain on change in value of debt conversion features | (14,413 | ) | — | — | ||||||||
Valuation allowance | (16,007 | ) | 2,338 | 13,871 | ||||||||
Other Items | 1,947 | 1,353 | 603 | |||||||||
|
|
|
|
|
| |||||||
Income tax expense | $ | 126 | $ | 324 | $ | 10,573 | ||||||
|
|
|
|
|
| |||||||
The components of deferred tax assets and liabilities are as follows (in thousands):
| December 25, 2011 | December 26, 2010 | |||||||
Deferred tax assets: | ||||||||
Leases | $ | 11,489 | $ | 8,407 | ||||
Convertible note hedge | — | 1,360 | ||||||
Allowance for doubtful accounts | 1,321 | 1,329 | ||||||
Net operating losses, AMT carryforwards, and state credit carryforwards | 32,735 | 35,735 | ||||||
Post-retirement benefits | 9,231 | 1,639 | ||||||
Other | 11,521 | 12,424 | ||||||
Valuation allowances | (8,392 | ) | (16,919 | ) | ||||
|
|
|
| |||||
Total deferred tax assets | 57,905 | 43,975 | ||||||
Deferred tax liabilities: | ||||||||
Depreciation | (24,784 | ) | (17,294 | ) | ||||
Capital construction fund | (7,334 | ) | (14,791 | ) | ||||
Intangibles | (9,575 | ) | (11,556 | ) | ||||
Debt conversion features | (13,816 | ) | — | |||||
Other | (2,490 | ) | (2,034 | ) | ||||
|
|
|
| |||||
Total deferred tax liabilities | (57,999 | ) | (45,675 | ) | ||||
|
|
|
| |||||
Net deferred tax liability | $ | (94 | ) | $ | (1,700 | ) | ||
|
|
|
| |||||
As of December 25, 2011 and December 26, 2010, the Company has total net deferred tax assets related to its discontinued operations, before taking into account its valuation allowance, of $39.8 million and $8.7 million, respectively. Such net deferred tax assets are offset by a valuation allowance, resulting in a net deferred tax asset of $0.4 million and $0.6 million as of December 25, 2011 and December 26, 2010, respectively.
The Company has net operating loss carryforwards for federal income tax purposes in the amount of $117.4 million and $134.5 million as of December 25, 2011 and December 26, 2010, respectively. In addition, the Company has net operating loss carryforwards for state income tax purposes in the amount of $33.8 million and $20.5 million as of December 25, 2011 and December 26, 2010, respectively. The Federal and state net operating loss carryforwards begin to expire in 2025 and 2019, respectively. Furthermore, the Company has an alternative minimum tax credit carryforward with no expiration period in the amount of $1.4 million as of December 25, 2011 and December 26, 2010. Net operating loss credits generated from tax losses in Guam begin
F-36
Table of Contents
to expire in 2029. The Company has recorded a valuation allowance against the majority of the deferred tax assets attributable to the net operating losses generated, but has not recorded a valuation allowance attributable to the net operating losses generated in certain states.
A reconciliation of the beginning and ending amount of unrecognized tax benefits is as follows (in thousands):
| 2011 | 2010 | 2009 | ||||||||||
Beginning balance | $ | 13,596 | $ | 12,531 | $ | 8,989 | ||||||
Additions based on tax positions related to the current year | 860 | 840 | 409 | |||||||||
Additions for tax positions of prior years | 924 | 225 | 5,793 | |||||||||
Reductions for tax positions of prior years | — | — | (2,660 | ) | ||||||||
|
|
|
|
|
| |||||||
Ending balance | $ | 15,380 | $ | 13,596 | $ | 12,531 | ||||||
|
|
|
|
|
| |||||||
As a result of the valuation allowance, none of the unrecognized tax benefits, if recognized, would affect the effective tax rate. The Company does not expect that there will be a significant increase or decrease of the total amount of unrecognized tax benefits within the next twelve months.
The Company recognizes interest accrued and penalties related to unrecognized tax benefits in its income tax expense. During its fiscal years for 2009 through 2011, the Company has not recognized any interest and penalties in its statement of operations and statement of financial position. Furthermore, there were no accruals for the payment of interest and penalties at either December 25, 2011 or December 26, 2010.
The Company or one of its subsidiaries files income tax returns in the U.S. federal jurisdiction, various U.S. state jurisdictions and foreign jurisdictions. With few exceptions, the Company is no longer subject to U.S. federal, state and local, or non-U.S. income tax examinations by tax authorities for years before 2005. The tax years which remain subject to examination by major tax jurisdictions as of December 25, 2011 include 2005-2010.
16. Commitments and Contingencies
Legal Proceedings
Antitrust Matters
On April 17, 2008, the Company received a grand jury subpoena and search warrant from the United States District Court for the Middle District of Florida seeking information regarding an investigation by the Antitrust Division of the Department of Justice (“DOJ”) into possible antitrust violations in the domestic ocean shipping business. On February 23, 2011, the Company entered into a plea agreement with the DOJ and on March 22, 2011, the Court entered judgment accepting the Company’s plea agreement and imposed a fine of $45.0 million payable over five years without interest. The Company recorded a charge of $30.0 million during the year ended December 26, 2010, which represented the present value of the $45.0 million in installment payments. On April 28, 2011, the Court reduced the fine from $45.0 million to $15.0 million payable over five years without interest. As a result, during the year ended December 25, 2011, the Company recorded a reversal of $19.2 million of the charge originally recorded during December 26, 2010. The first $1.0 million of the fine was paid in April 2011 and the second $1.0 million payment was made in March 2012. The Company must make payments of $2.0 million on or before March 24, 2013, $3.0 million on or before March 24, 2014, $4.0 million on or before March 24, 2015, and $4.0 million on or before March 21, 2016. The plea agreement provides that the Company will not face additional charges relating to the Puerto Rico tradelane. In addition, the plea agreement provides that the Company will not face any additional charges in connection with the Alaska trade, and the DOJ has indicated that the Company is not a target or subject of any Hawaii or Guam aspects of its investigation.
F-37
Table of Contents
Subsequent to the commencement of the DOJ investigation, thirty-two class action lawsuits on behalf of direct purchasers of ocean shipping services in the Puerto Rico tradelane were consolidated into a single multidistrict litigation (“MDL”) proceeding in the District of Puerto Rico. On June 11, 2009, the Company entered into a settlement agreement with the named plaintiff class representatives in the Puerto Rico MDL. Under the settlement agreement, the Company paid $20.0 million and agreed to provide a base-rate freeze to class members who elect such freeze in lieu of a cash payment.
Some class members elected to opt-out of the settlement. The Company and attorneys representing those shippers who (i) opted out of the Puerto Rico direct purchaser settlement and (ii) indicated an intention to pursue an antitrust claim against the Company relating to the Puerto Rico tradelane, entered into a settlement agreement, dated November 23, 2011. Pursuant to the terms of the settlement agreement, the Company paid $5.8 million and has agreed to make payments of $4.0 million on each of June 30, 2012 and December 24, 2012.
Twenty-five class action lawsuits relating to ocean shipping services in the Hawaii and Guam tradelanes were consolidated into a MDL proceeding in the Western District of Washington. The Company filed a motion to dismiss the claims in the Hawaii and Guam MDL, and the United States District Court for the Western District of Washington dismissed the plaintiffs’ complaint and amended complaint. Subsequently, the Court of Appeals affirmed the Court’s decision to dismiss the amended complaint.
One class action lawsuit relating to the Alaska tradelane is pending in the District of Alaska. The Company and the class plaintiffs have agreed to stay the Alaska litigation, and the Company intends to vigorously defend against the purported class action lawsuit in Alaska.
In addition, on July 9, 2008, a complaint was filed by Caribbean Shipping Services, Inc. in the Circuit Court, 4th Judicial Circuit in and for Duval County, Florida, against the Company and other domestic shipping carriers alleging price-fixing in violation of the Florida Antitrust Act and the Florida Deceptive and Unlawful Trade Practices Act. The complaint sought treble damages, injunctive relief, costs and attorneys’ fees. On October 31, 2011, the plaintiff dismissed its complaint against us.
Environmental Matters
The U.S. Coast Guard and the offices of the U.S. Attorney for the Northern and Central Districts of California investigated the use of one of the Company’s vessel’s oily water separator and related oil record book keeping on that vessel. The Company previously recorded provisions in its Consolidated Statement of Operations of $1.5 million relating to this contingency. On January 27, 2012, the Company entered into an agreement with the U.S. Department of Justice and the Court has entered judgment accepting the Company’s plea agreement. The Company pleded guilty to two counts of providing federal authorities with false vessel oil record book keeping entries, and agreed to pay a fine of $1.0 million and donate an additional $0.5 million to the National Fish & Wildlife Foundation for environmental community service programs. The donation of $0.5 million is required to be paid on or before April 13, 2012, and the $1.0 million fine will be paid in $0.5 million installments due on or before January 27, 2013 and January 27, 2014, respectively.
Other Matters
On February 21, 2012, HLPR received a notice of alleged violation from the United States Department of Agriculture (“USDA”) relating to the sale of meat that was transported by the Company and eventually sold to a third party in Puerto Rico in the spring of 2009. The Company is investigating this matter and intends to cooperate fully with the USDA.
The Company received an administrative subpoena from the Department of Defense (“DOD”) for documents relating to an investigation involving fuel surcharges that freight forwarders may have improperly charged to the DOD. The Company is cooperating with the government with respect to this matter.
F-38
Table of Contents
In the ordinary course of business, from time to time, the Company becomes involved in various legal proceedings. These relate primarily to claims for loss or damage to cargo, employees’ personal injury claims, and claims for loss or damage to the person or property of third parties. The Company generally maintains insurance, subject to customary deductibles or self-retention amounts, and/or reserves to cover these types of claims. The Company also, from time to time, becomes involved in routine employment-related disputes and disputes with parties with which it has contractual relations.
SFL Agreements
In April 2006, the Company completed a series of agreements with Ship Finance International Limited and certain of its subsidiaries (“SFL”) to charter five new non-Jones Act qualified container vessels. As a result of the shutdown of the Guam/FSX service, these vessels are currently not being utilized. On April 5, 2012, the Company entered into a Global Termination Agreement with SFL which enabled us to early terminate the bareboat charters. See Note 18 for additional details.
The bareboat charter for each new vessel was a “hell or high water” charter, and the obligation of the Company to pay charter hire thereunder for the vessel was absolute and unconditional. The aggregate annual charter hire for all of the five new vessels was approximately $32.0 million. Under the charters, the Company was responsible for crewing, insuring, maintaining, and repairing each vessel and for all other operating costs with respect to each vessel. The term of each of the bareboat charters was twelve years from the date of delivery of the related vessel, with a three year renewal option exercisable by the Company. In addition, the Company had the option to purchase all of the vessels following the five, eight, twelve, and, if applicable, fifteen year anniversaries of the date of delivery at pre-agreed purchase prices. If the Company elected to purchase all of the vessels after the five or eight year anniversary date, it would have the right to assume the outstanding debt related to each purchased vessel, and the amount of the debt so assumed would have been credited against the purchase price paid for the vessels. If the Company elected not to purchase the new vessels at the end of the initial twelve-year period and SFL sold the new vessels for less than a specified amount, the Company would have been responsible for paying the amount of such shortfall, which would not have exceeded $3.8 million per new vessel. If the new vessels were to be sold by SFL to an affiliated party for less than a different specified amount, the Company had the right to purchase the new vessels for that different specified amount.
Although the Company was not the primary beneficiary of the variable interest entities created in conjunction with the SFL transactions, the Company had an interest in the variable interest entities. Based on the Company’s analysis of the expected cash flows related to the variable interest entity, the Company believes only a remote likelihood exists that it would have become the primary beneficiary of the variable interest entity and would have been required to consolidate the variable interest entity. Certain contractual obligations and off-balance sheet obligations arising from this transaction included the annual operating lease obligations and the residual guarantee. The Company was accounting for the leases as operating leases. As of December 25, 2011, the residual guarantee was recorded at its fair value of approximately $0.3 million as a liability on the Company’s balance sheet.
Standby Letters of Credit
The Company has standby letters of credit, primarily related to its property and casualty insurance programs. On December 25, 2011 and December 26, 2010, these letters of credit totaled $19.6 million and $11.3 million, respectively.
Labor Relations
Approximately 70% of the Company’s total work force is covered by collective bargaining agreements. Two collective bargaining agreements, covering approximately 10% of the workforce have expired. The employees covered under these agreements are continuing to work under old agreements while we negotiate new agreements. Our collective bargaining agreements are scheduled to expire as follows: five in 2012, one in 2013, one in 2014, one in 2017, and one in 2022. The five agreements scheduled to expire in 2012 represent approximately 30% of the Company’s union work force.
F-39
Table of Contents
17. Quarterly Financial Data (Unaudited)
Set forth below are unaudited quarterly financial data (in thousands, except per share amounts):
| Fiscal Year 2011 | ||||||||||||||||
| First Quarter | Second Quarter | Third Quarter | Fourth Quarter | |||||||||||||
Operating revenue | $ | 240,720 | $ | 253,731 | $ | 267,629 | $ | 264,084 | ||||||||
Operating (loss) income(1)(2) | (9,356 | ) | 18,096 | (99,669 | ) | (6,927 | ) | |||||||||
(Loss) income from continuing operations | $ | (20,221 | ) | $ | 4,506 | $ | (111,685 | ) | $ | 74,206 | ||||||
Loss from discontinued operations(3) | (13,851 | ) | (9,921 | ) | (14,682 | ) | (137,769 | ) | ||||||||
|
|
|
|
|
|
|
| |||||||||
Net loss(1)(2) | $ | (34,072 | ) | $ | (5,415 | ) | $ | (126,367 | ) | $ | (63,563 | ) | ||||
|
|
|
|
|
|
|
| |||||||||
Basic net (loss) income per share from continuing operations | $ | (16.43 | ) | $ | 3.63 | $ | (90.36 | ) | $ | 34.43 | ||||||
Basic net loss per share from discontinued operations(3) | (11.25 | ) | (7.99 | ) | (11.88 | ) | (63.93 | ) | ||||||||
|
|
|
|
|
|
|
| |||||||||
Basic net loss per share | $ | (27.68 | ) | $ | (4.36 | ) | $ | (102.24 | ) | $ | (29.50 | ) | ||||
|
|
|
|
|
|
|
| |||||||||
Diluted net (loss) income per share from continuing operations | $ | (16.43 | ) | $ | 3.63 | $ | (90.36 | ) | $ | 24.14 | ||||||
Diluted net loss per share from discontinued operations | (11.25 | ) | (7.99 | ) | (11.88 | ) | (44.82 | ) | ||||||||
|
|
|
|
|
|
|
| |||||||||
Diluted net loss per share | $ | (27.68 | ) | $ | (4.36 | ) | $ | (102.24 | ) | $ | (20.68 | ) | ||||
|
|
|
|
|
|
|
| |||||||||
| Fiscal Year 2010 | ||||||||||||||||
| First Quarter | Second Quarter | Third Quarter | Fourth Quarter | |||||||||||||
Operating revenue | $ | 236,155 | $ | 250,607 | $ | 257,162 | $ | 256,131 | ||||||||
Operating income (loss)(1)(2) | 2,892 | 16,249 | 18,748 | (32,995 | ) | |||||||||||
(Loss) income from continuing operations | $ | (6,771 | ) | $ | 6,176 | $ | 8,668 | $ | (43,647 | ) | ||||||
Loss from discontinued operations | (6,473 | ) | (2,526 | ) | (921 | ) | (12,475 | ) | ||||||||
|
|
|
|
|
|
|
| |||||||||
Net (loss) income(1)(2) | $ | (13,244 | ) | $ | 3,650 | $ | 7,747 | $ | (56,122 | ) | ||||||
|
|
|
|
|
|
|
| |||||||||
Basic net (loss) income per share from continuing operations | $ | (5.57 | ) | $ | 5.05 | $ | 7.02 | $ | (35.49 | ) | ||||||
Basic net loss per share from discontinued operations | (5.32 | ) | (2.06 | ) | (0.75 | ) | (10.14 | ) | ||||||||
|
|
|
|
|
|
|
| |||||||||
Basic net (loss) income per share | $ | (10.89 | ) | $ | 2.99 | $ | 6.27 | $ | (45.63 | ) | ||||||
|
|
|
|
|
|
|
| |||||||||
Diluted net (loss) income per share from continuing operations | $ | (5.57 | ) | $ | 4.99 | $ | 6.95 | $ | (35.60 | ) | ||||||
Diluted net loss per share from discontinued operations | (5.32 | ) | (2.04 | ) | (0.74 | ) | (10.18 | ) | ||||||||
|
|
|
|
|
|
|
| |||||||||
Diluted net (loss) income per share | $ | (10.89 | ) | $ | 2.95 | $ | 6.21 | $ | (45.78 | ) | ||||||
|
|
|
|
|
|
|
| |||||||||
| (1) | The first, second, third, and fourth quarter of 2011 include expenses of $2.2 million, $0.9 million, $0.7 million, and $0.7 million, respectively, related to legal and professional fees associated with the DOJ investigation and the antitrust related litigation. The first, second, third, and fourth quarter of 2010 include expenses of $1.0 million, $1.0 million, $1.5 million, and $1.7 million, respectively, related to legal and professional fees associated with the DOJ investigation and the antitrust related litigation. The fourth quarter of 2010 includes expenses of $1.8 million related to the Company’s restructuring plan. |
| (2) | The second quarter of 2011 includes an impairment charge of $2.8 million. The third and fourth quarter of 2010 include $1.8 million and $0.8 million, respectively, related to an impairment charge. The third quarter of 2011 includes an estimated goodwill impairment charge of $117.5 million. During the fourth quarter of 2011, the Company completed the goodwill analysis and recorded a reduction of $2.2 million to the estimate recorded during the third quarter. The fourth quarter of 2011 includes a charge for $12.7 million related to the settlement with all of the remaining significant shippers who opted out of the Puerto Rico direct purchaser antitrust class action settlement. The fourth quarter of 2010 includes a $30.0 million charge for the settlement with the DOJ (which was reduced by $19.2 million during the second of 2011) and a $1.8 million charge for the settlement of the Puerto Rico indirect purchaser lawsuit. |
| (3) | The fourth quarter of 2011 includes a restructuring charge of $119.3 million related to the shutdown of the FSX service. |
F-40
Table of Contents
18. Subsequent Events
Mandatory Conversion of Series B Notes
On January 11, 2012, the Company announced that it completed the mandatory debt-to-equity conversion of approximately $49.7 million of the Series B Notes. Under the terms of the recapitalization plan, the Company mandatorily converted at its option approximately $49.7 million of the Series B Notes at a conversion rate of 54.7196 shares of common stock (reflecting the 1-for-25 reverse stock split of the Company’s common stock effective December 7, 2011) per $1,000 principal amount of Series B Notes. Approximately $18.5 million of the Series B Notes were converted into 1.0 million shares of common stock with the remainder being converted into warrants exercisable into 1.7 million shares of common stock.
Conversion of Remaining Series A and Series B Notes
On March 27, 2012, the Company announced that it had signed restructuring support agreements with more than 96% of its noteholders to further deleverage its balance sheet in connection with and contingent upon a restructuring of the vessel charter obligations related to the Company’s discontinued trans-Pacific service. The restructuring support agreements provide, among other things, that substantially all of the remaining $228.4 million of the Company’s Series A and Series B Notes will be converted into 90% of the Company’s stock, or warrants for non-U.S. citizens (subject to limited equity retention to existing equity holders on terms to be agreed, and to dilution for a management incentive plan), as described below. The remaining 10% of the Company’s common stock would be available in connection with the restructuring of its obligations related to the vessels formerly used in the FSX service pursuant to the Global Termination Agreement, as described above. To that end, the conversion of the Series A and Series B Notes was contingent upon a number of conditions, including the restructuring of our charter obligations with respect to the vessels formerly used in the FSX service.
On April 9, 2012, pursuant to the restructuring support agreements and following the completion of the consent solicitations described below, essentially all of the holders of the Company’s Series A Notes and Series B Notes submitted irrevocable conversion notices to us. Upon completion of the conversion process, the Company expects, on an as-converted basis, holders of Series A Notes to hold approximately 81% of its outstanding shares and holders of Series B Notes to hold approximately 3% of its outstanding shares. In addition, on an as-converted basis, the Company expects SFL will hold approximately 10% of its outstanding shares (pursuant to the Global Termination Agreement described below). The remaining 6% of the Company’s outstanding shares will be held by existing share and warrant holders. The remaining 8% of the Company’s authorized share capital will be reserved for management incentive plans.
The conversion of the Series A Notes and the Series B Notes could have a material impact on the Company’s 2012 financial statements. Until such time the Company is able to obtain a definitive allocation between shares of its common stock and warrants to purchase shares of its common stock, the Company is unable to determine the potential impact on earnings per share.
Consent Solicitations
As part of the overall agreement under the restructuring support agreements described above, on March 29, 2012, the Company launched consent solicitations to make certain amendments to the indentures which govern the First Lien Notes, Second Lien Notes, and the Series A Notes and Series B Notes. These amendments provided (i) for the issuance of $40.0 million in aggregate principal amount of Second Lien Notes to SFL pursuant to the Global Termination Agreement, subordinated to the existing Second Lien Notes under certain circumstances, as described above, (ii) for the Company to pay-in-kind (PIK) interest payments on the Second Lien Notes, the Series A Notes and the Series B Notes, (iii) that SFL may purchase all other outstanding Second Lien Notes from the holders (at a purchase price equal to the principal amount of the Second Lien Notes, plus accrued and unpaid interest) under circumstances where, among other things, the Company commences liquidation, administration, or receivership or other similar proceedings and (iv) for Series B Note holders to convert their notes at their option.
F-41
Table of Contents
On April 9, 2012, the Company obtained the requisite consents under each of the consent solicitations and entered into supplemental indentures with the U.S. Bank National Association, the trustee for the Notes, to amend the indentures pursuant to the consent solicitations. The Company concurrently obtained an amendment and acknowledgment from the lenders under its ABL credit agreement, among other things, to clarify that the amendments to the indentures which govern the First Lien Notes, Second Lien Notes, and the Series A Notes and Series B Notes and the issuance of the additional $40.0 million of Second Lien Notes are permitted under the ABL credit agreement.
NYSE Delisting
On October 14, 2011, the NYSE notified the Company trading in its common stock would be suspended on October 20, 2011. On October 20, 2011, the Company’s common stock began trading on the over-the-counter (“OTC”) market under a new stock symbol, HRZL. The Company requested a review of the NYSE’s determination by a committee of the Board of Directors of the NYSE Regulation. Upon the conclusion of the appeal process, the NYSE confirmed, on February 29, 2012, its determination to delist the Company’s common stock. The Company’s common stock was removed from listing on the NYSE and a Form 25 was filed on March 1, 2012.
Termination of Vessel Leases
On April 5, 2012, the Company entered into a Global Termination Agreement with SFL which enabled the Company to early terminate the bareboat charters of the five foreign-built, U.S.-flag vessels that formerly operated in the FSX service.
Pursuant to the Global Termination Agreement, in consideration for the early termination of the vessel leases, and related agreements and the mutual release of all claims thereunder, the Company agreed to: (i) issue to SFL $40.0 million in aggregate principal amount of Second Lien Senior Secured Notes due 2016; (ii) issue to SFL the number of warrants to purchase 9,250,000 shares of the Company’s common stock at a conversion price of $0.01 per common share, which in the aggregate represents 10% of the fully diluted shares of such common stock after giving effect to such issuance but subject to approximately 8% dilution for a management incentive plan; (iii) transfer to SFL certain property on board the vessels (such as bunker fuel, spare parts and equipment, and consumable stores) at the time of redelivery to SFL without any additional payment; (iv) reimburse reasonable costs incurred by SFL to (a) return the vessels from their current laid up status to operating status, which reimbursement shall not exceed $0.6 million, (b) reposition the vessels from the Philippines to either Hong Kong or Singapore, which reimbursement shall not exceed $0.1 million, (c) remove the Company’s stack insignia and name from the vessels, which reimbursement shall not exceed $0.1 million, and (d) complete the reflagging of the vessels to the Marshall Islands registry, which reimbursement is currently expected to approximate $0.1 million, which the company expects to pay during the first half of 2012; and (v) reimburse SFL for their reasonable costs and expenses incurred in connection with the transaction, which we estimate represents an aggregate reimbursement obligation to the SFL Parties of $0.6 million, which the company expects to pay during the first half of 2012.
Tonnage Tax Election
During the first quarter of 2012, after evaluating the merits and requirements of the tonnage tax regime, the Company revoked its election under subchapter R of the tonnage tax regime effective for the tax years beginning January 1, 2012. As a result, the activities attributable to the Company’s operation of the vessels in the Puerto Rico tradelane are no longer eligible as qualifying shipping activities under the tonnage tax regime, and therefore, the income (loss) derived from the Puerto Rico vessels will no longer be excluded from corporate income tax for U.S. federal income tax purposes. The Company’s decision was made based on several factors, including the profitability of the otherwise eligible trade routes in the foreseeable future and the discontinuance of the FSX service in the fourth quarter of 2011. Under the eligibility requirements of the tonnage tax regime, the
F-42
Table of Contents
Company may not elect back into the tonnage tax regime until five years following its revocation. The Company will reevaluate the merits of the tonnage tax regime at such time in the future.
The Company expects to account for the revocation of the tonnage tax as a change in tax status of its qualifying shipping activities. Accordingly, the Company will recognize the impact of the revocation of its tonnage tax election in the first quarter of 2012, the period for which the Company filed its revocation statement with the Internal Revenue Service. The Company anticipates the impact of its revocation will have a minimal impact on its Statement of Operations in the first quarter of 2012. Furthermore, the Company anticipates that a change in tax status will result in the revaluation of its deferred taxes. The Company anticipates an overall decrease in its net deferred tax assets of approximately $3.1 million, before the impact of the valuation allowance. After offsetting the decrease in net deferred tax assets with the anticipated valuation allowance, the impact on the Company’s net deferred taxes should be minimal.
F-43
Table of Contents
Schedule Valuation and Qualifying AccountsHorizon Lines, Inc.
Valuation and Qualifying Accounts
Years Ended December 2011, 2010 and 2009
(in thousands)
| Beginning Balance | Charged to Cost and Expenses | Deductions | Charged to other Accounts | Ending Balance | ||||||||||||||||
Accounts receivable reserve: | ||||||||||||||||||||
Year ended December 25, 2011: | ||||||||||||||||||||
Allowance for doubtful accounts | $ | 6,128 | $ | 2,613 | $ | (2,975 | ) | $ | — | $ | 5,766 | |||||||||
Allowance for revenue adjustments | 632 | — | (4,229 | ) | 4,247 | (1) | 650 | |||||||||||||
|
|
|
|
|
|
|
|
|
| |||||||||||
| $ | 6,760 | $ | 2,613 | $ | (7,204 | ) | $ | 4,247 | $ | 6,416 | ||||||||||
Year ended December 26, 2010: | ||||||||||||||||||||
Allowance for doubtful accounts | $ | 5,835 | $ | 1,478 | $ | (1,185 | ) | $ | — | $ | 6,128 | |||||||||
Allowance for revenue adjustments | 757 | — | (3,203 | ) | 3,078 | (1) | 632 | |||||||||||||
|
|
|
|
|
|
|
|
|
| |||||||||||
| $ | 6,592 | $ | 1,478 | $ | (4,388 | ) | $ | 3,078 | $ | 6,760 | ||||||||||
|
|
|
|
|
|
|
|
|
| |||||||||||
Year ended December 20, 2009: | ||||||||||||||||||||
Allowance for doubtful accounts | $ | 6,652 | $ | 1,845 | $ | (2,662 | ) | $ | — | $ | 5,835 | |||||||||
Allowance for revenue adjustments | 801 | — | (5,303 | ) | 5,259 | (1) | 757 | |||||||||||||
|
|
|
|
|
|
|
|
|
| |||||||||||
| $ | 7,453 | $ | 1,845 | $ | (7,965 | ) | $ | 5,259 | $ | 6,592 | ||||||||||
Restructuring costs: | ||||||||||||||||||||
Year ended December 25, 2011 | $ | 2,042 | $ | — | $ | (1,809 | ) | $ | — | $ | 233 | |||||||||
Year ended December 26, 2010 | $ | 150 | $ | 2,057 | $ | (165 | ) | $ | — | $ | 2,042 | |||||||||
Year ended December 20, 2009 | $ | 3,197 | $ | 1,001 | $ | (3,563 | ) | $ | (485 | )(2) | $ | 150 | ||||||||
Deferred tax assets valuation allowance: | ||||||||||||||||||||
Year ended December 25, 2011 | $ | 16,919 | $ | (7,207 | ) | $ | — | $ | (1,320 | )(3) | $ | 8,392 | ||||||||
Year ended December 26, 2010 | $ | 8,974 | $ | 7,671 | $ | — | $ | 274 | (3) | $ | 16,919 | |||||||||
Year ended December 20, 2009 | $ | 1,262 | $ | 9,727 | $ | — | $ | (2,015 | )(3) | $ | 8,974 | |||||||||
| (1) | These revenue adjustments are recorded as a reduction to revenue. |
| (2) | Includes $0.5 million of stock-based compensation recorded in additional paid in capital. |
| (3) | Includes $1.3 million, $0.2 million, and $2.0 million recorded in other comprehensive income (loss). |
F-44