EXHIBIT 99.2
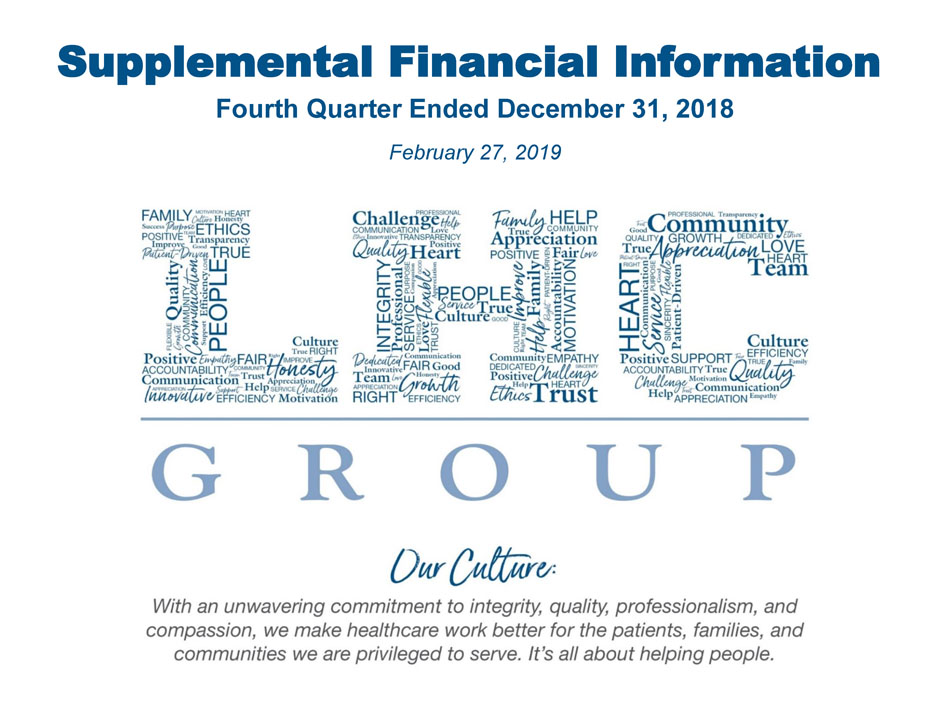
Supplemental Financial Information Fourth Quarter Ended December 31, 2018 February 27, 2019
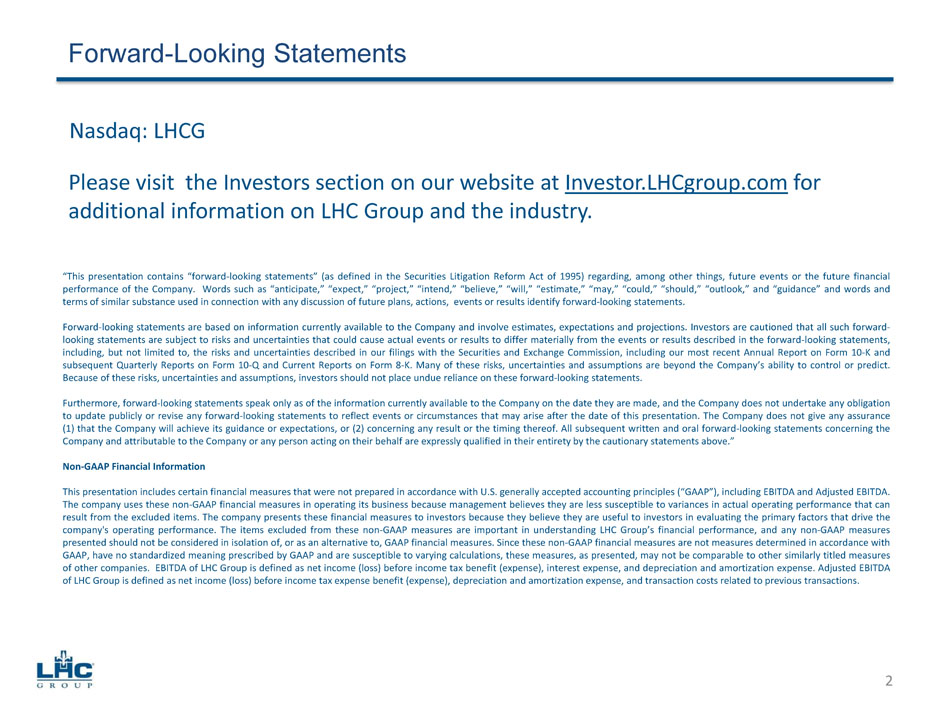
Forward - Looking Statements “This presentation contains “forward - looking statements” (as defined in the Securities Litigation Reform Act of 1995 ) regarding, among other things, future events or the future financial performance of the Company . Words such as “anticipate,” “expect,” “project,” “intend,” “believe,” “will,” “estimate,” “may,” “could,” “should,” “outlook,” and “guidance” and words and terms of similar substance used in connection with any discussion of future plans, actions, events or results identify forward - looking statements . Forward - looking statements are based on information currently available to the Company and involve estimates, expectations and projections . Investors are cautioned that all such forward - looking statements are subject to risks and uncertainties that could cause actual events or results to differ materially from the events or results described in the forward - looking statements, including, but not limited to, the risks and uncertainties described in our filings with the Securities and Exchange Commission, including our most recent Annual Report on Form 10 - K and subsequent Quarterly Reports on Form 10 - Q and Current Reports on Form 8 - K . Many of these risks, uncertainties and assumptions are beyond the Company’s ability to control or predict . Because of these risks, uncertainties and assumptions, investors should not place undue reliance on these forward - looking statements . Furthermore, forward - looking statements speak only as of the information currently available to the Company on the date they are made, and the Company does not undertake any obligation to update publicly or revise any forward - looking statements to reflect events or circumstances that may arise after the date of this presentation . The Company does not give any assurance ( 1 ) that the Company will achieve its guidance or expectations, or ( 2 ) concerning any result or the timing thereof . All subsequent written and oral forward - looking statements concerning the Company and attributable to the Company or any person acting on their behalf are expressly qualified in their entirety by the cautionary statements above . ” Non - GAAP Financial Information This presentation includes certain financial measures that were not prepared in accordance with U . S . generally accepted accounting principles (“GAAP”), including EBITDA and Adjusted EBITDA . The company uses these non - GAAP financial measures in operating its business because management believes they are less susceptible to variances in actual operating performance that can result from the excluded items . The company presents these financial measures to investors because they believe they are useful to investors in evaluating the primary factors that drive the company's operating performance . The items excluded from these non - GAAP measures are important in understanding LHC Group’s financial performance, and any non - GAAP measures presented should not be considered in isolation of, or as an alternative to, GAAP financial measures . Since these non - GAAP financial measures are not measures determined in accordance with GAAP, have no standardized meaning prescribed by GAAP and are susceptible to varying calculations, these measures, as presented, may not be comparable to other similarly titled measures of other companies . EBITDA of LHC Group is defined as net income (loss) before income tax benefit (expense), interest expense, and depreciation and amortization expense . Adjusted EBITDA of LHC Group is defined as net income (loss) before income tax expense benefit (expense), depreciation and amortization expense, and transaction costs related to previous transactions . 2 Please visit the Investors section on our website at Investor.LHCgroup.com for additional information on LHC Group and the industry. Nasdaq: LHCG
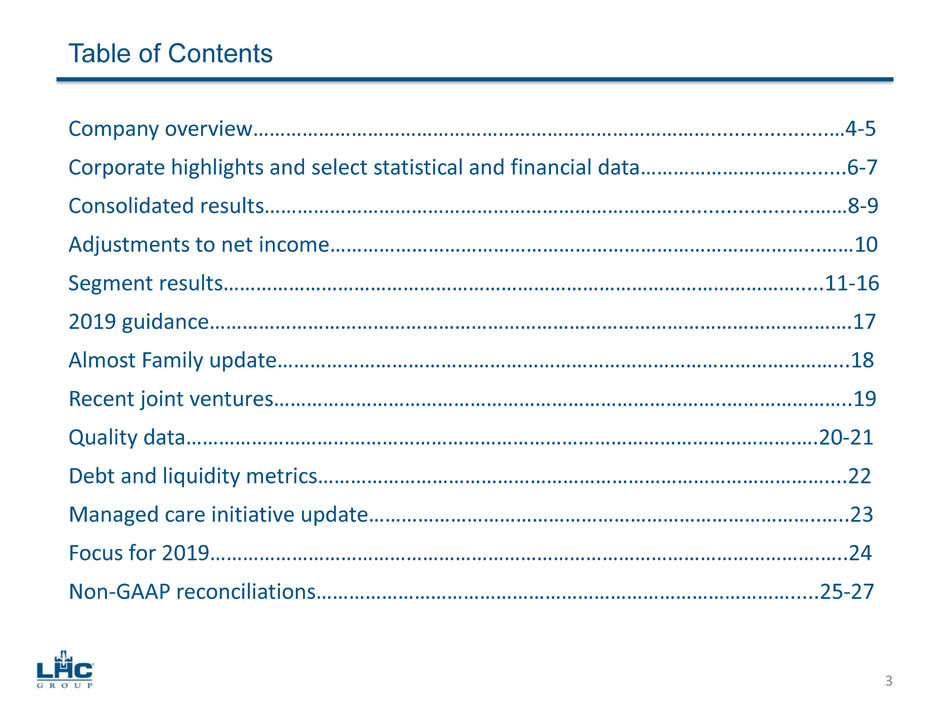
Table of Contents 3 Company overview ………………………………………………………………………… .................... … 4 - 5 Corporate highlights and select statistical and financial data ……………………… .......... 6 - 7 Consolidated results ………………………………………………………………… ........................ …… 8 - 9 Adjustments to net income …………………………………………………………………………… ... …… 10 Segment results …………………………………………………………………………………………… ..... 11 - 16 2019 guidance ……………………………………………………………………………………………………… . 17 Almost Family update ………………………………………………………………………………………… ... 18 Recent joint ventures………………………………………………………………………..…………………..19 Quality data………………………………………………………………………………………………….….20 - 21 Debt and liquidity metrics…………………………………………………………………………………....22 Managed care initiative update………………………………………………………………………..…..23 Focus for 2019………………………………………………………………………………………………….…..24 Non - GAAP reconciliations…………………………………………………………………………….....25 - 27
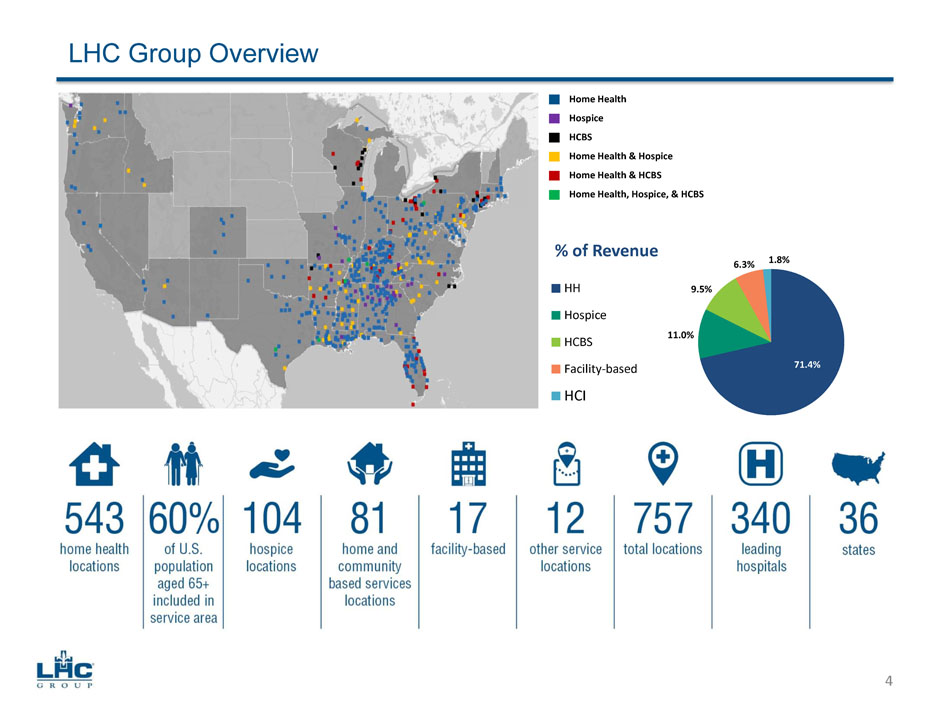
Home Health Hospice HCBS Home Health & Hospice Home Health & HCBS Home Health, Hospice, & HCBS LHC Group Overview 71.4% 11.0% 9.5% 6.3% 1.8% % of Revenue HH Hospice HCBS Facility-based HCI 4
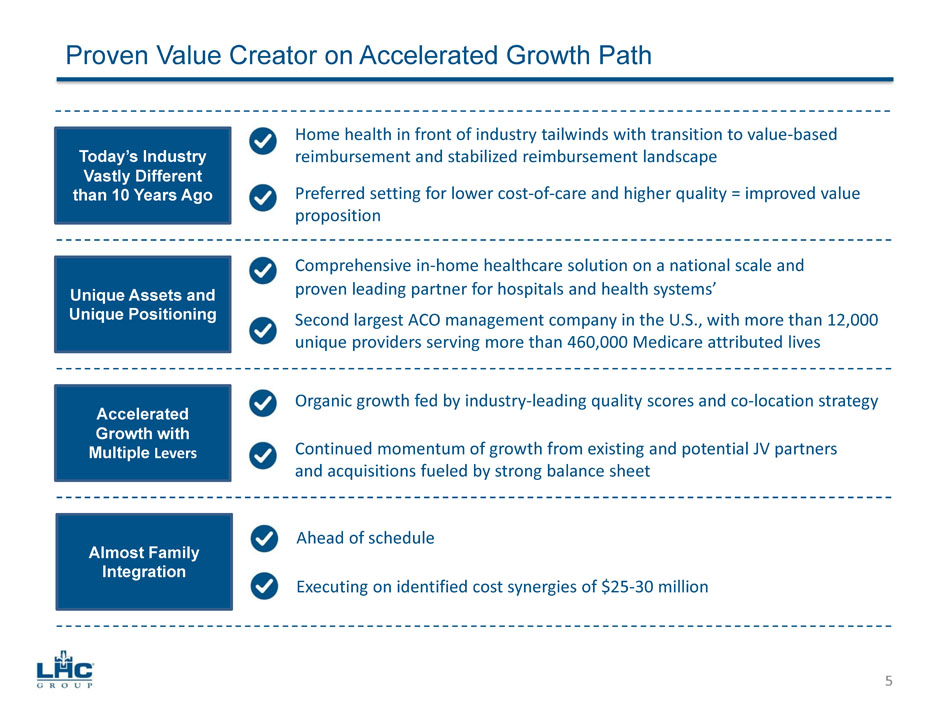
Proven Value Creator on Accelerated Growth Path Unique Assets and Unique Positioning Second largest ACO management company in the U.S ., with more than 12,000 unique providers serving more than 460,000 Medicare attributed lives Today’s Industry Vastly Different than 10 Years Ago Home health in front of industry tailwinds with transition to value - based reimbursement and stabilized reimbursement landscape Preferred setting for lower cost - of - care and higher quality = improved value proposition Accelerated Growth with Multiple Levers Organic growth fed by industry - leading quality scores and co - location strategy Continued momentum of growth from existing and potential JV partners and acquisitions fueled by strong balance sheet Comprehensive in - home healthcare solution on a national scale and the proven leading partner for hospitals and health systems ’ Almost Family Integration Ahead of schedule Executing on identified cost synergies of $ 25 - 30 million 5
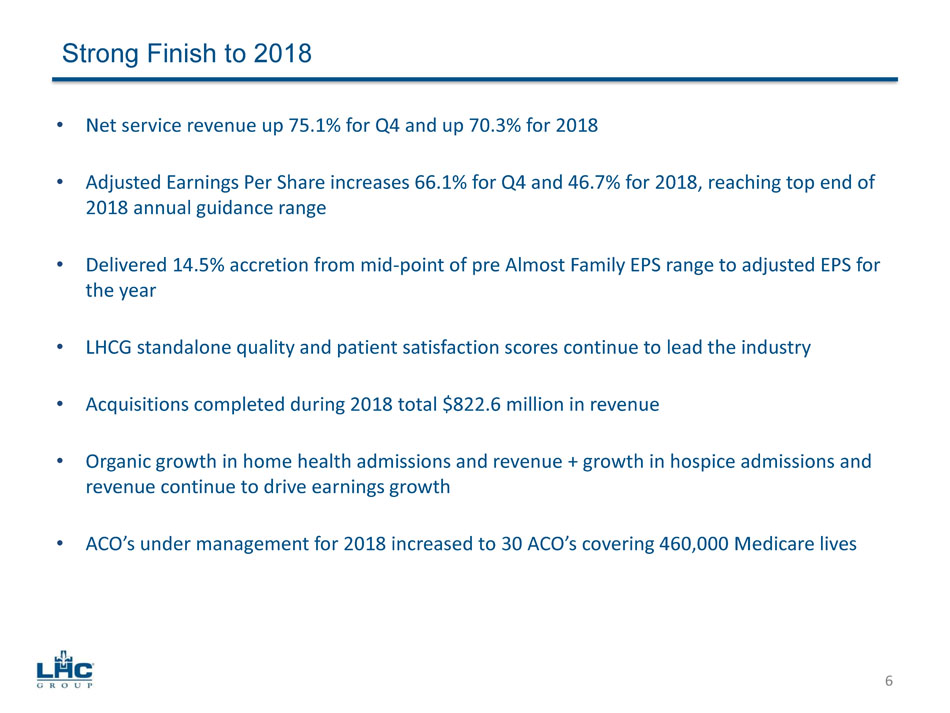
• Net service revenue up 75.1% for Q4 and up 70.3% for 2018 • Adjusted Earnings Per Share increases 66.1% for Q4 and 46.7% for 2018, reaching top end of 2018 annual guidance range • Delivered 14.5% accretion from mid - point of pre Almost Family EPS range to adjusted EPS for the year • LHCG standalone quality and patient satisfaction scores continue to lead the industry • Acquisitions completed during 2018 total $822.6 million in revenue • Organic growth in home health admissions and revenue + growth in hospice admissions and revenue continue to drive earnings growth • ACO’s under management for 2018 increased to 30 ACO’s covering 460,000 Medicare lives Strong Finish to 2018 6
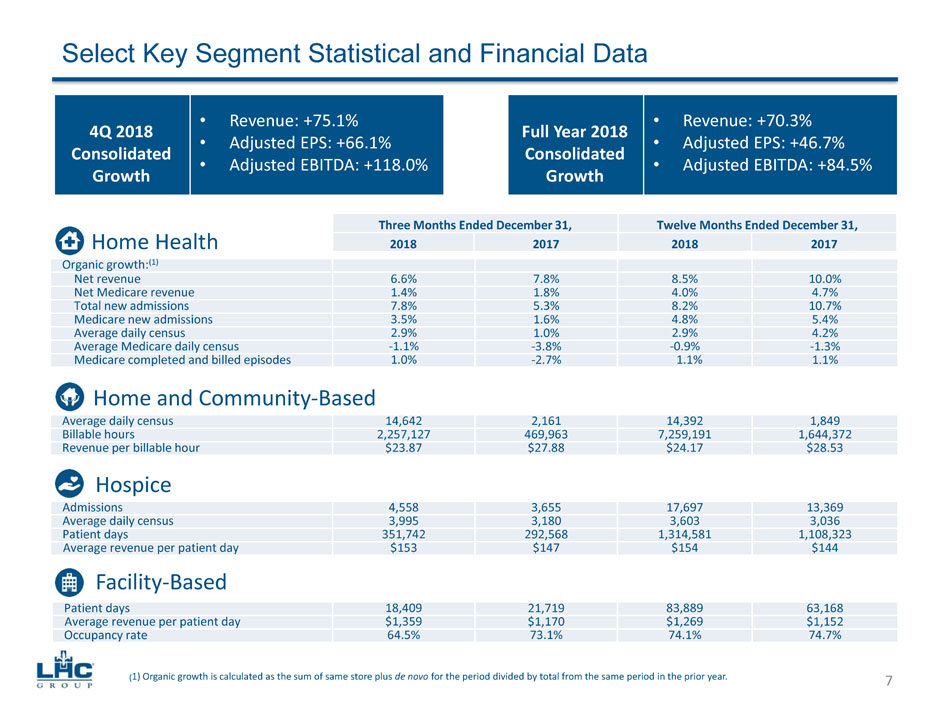
Select Key Segment Statistical and Financial Data Organic growth : (1) Net revenue 6.6% 7.8% 8.5% 10.0% Net Medicare revenue 1.4% 1.8% 4.0% 4.7% Total new admissions 7.8% 5.3% 8.2% 10.7% Medicare new admissions 3.5% 1.6% 4.8% 5.4% Average daily census 2.9% 1.0% 2.9% 4.2% Average Medicare daily census - 1.1% - 3.8% - 0.9% - 1.3% Medicare completed and billed episodes 1.0% - 2.7% 1.1% 1.1% Three Months Ended December 31, Twelve Months Ended December 31, 2018 2017 2018 2017 Home Health Average daily census 14,642 2,161 14,392 1,849 Billable hours 2,257,127 469,963 7,259,191 1,644,372 Revenue per billable hour $23.87 $27.88 $24.17 $28.53 Home and Community - Based Admissions 4,558 3,655 17,697 13,369 Average daily census 3,995 3,180 3,603 3,036 Patient days 351,742 292,568 1,314,581 1,108,323 Average revenue per patient day $153 $147 $154 $144 Hospice Patient days 18,409 21,719 83,889 63,168 Average revenue per patient day $1,359 $1,170 $1,269 $1,152 Occupancy rate 64.5% 73.1% 74.1% 74.7% Facility - Based ( 1) Organic growth is calculated as the sum of same store plus de novo for the period divided by total from the same period in the prior year. 4Q 2018 Consolidated Growth 7 • Revenue: +75.1% • Adjusted EPS: +66.1% • Adjusted EBITDA: +118.0% Full Year 2018 Consolidated Growth • Revenue: +70.3% • Adjusted EPS: +46.7% • Adjusted EBITDA: +84.5%
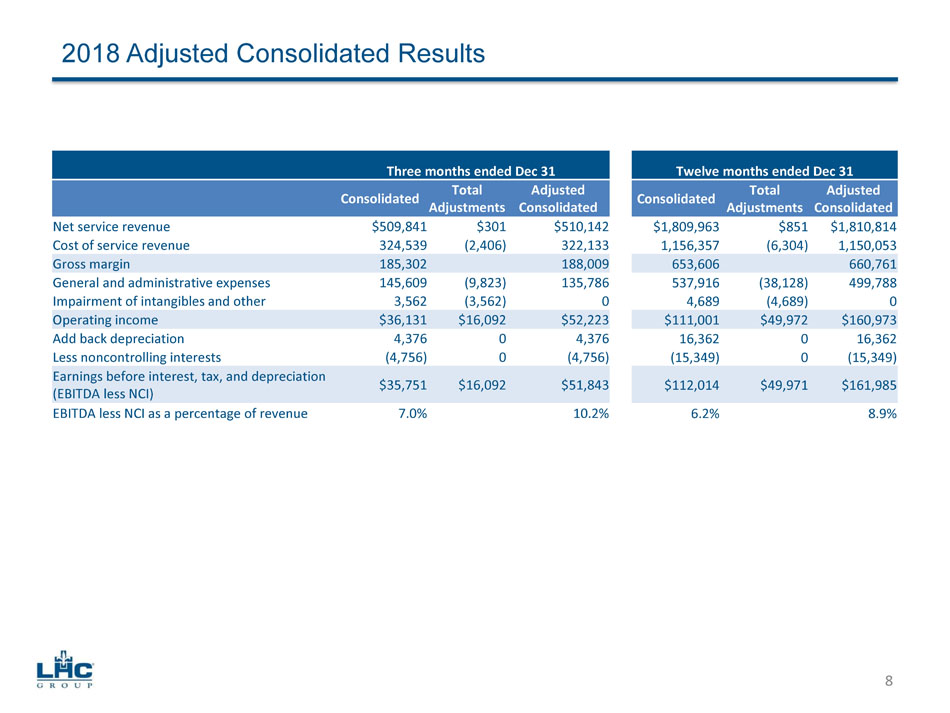
2018 Adjusted Consolidated Results Three months ended Dec 31 Twelve months ended Dec 31 Consolidated Total Adjustments Adjusted Consolidated Consolidated Total Adjustments Adjusted Consolidated Net service revenue $509,841 $301 $510,142 $1,809,963 $851 $1,810,814 Cost of service revenue 324,539 (2,406) 322,133 1,156,357 (6,304) 1,150,053 Gross margin 185,302 188,009 653,606 660,761 General and administrative expenses 145,609 (9,823) 135,786 537,916 (38,128) 499,788 Impairment of intangibles and other 3,562 (3,562) 0 4,689 (4,689) 0 Operating income $36,131 $16,092 $52,223 $111,001 $49,972 $160,973 Add back depreciation 4,376 0 4,376 16,362 0 16,362 Less n oncontrolling interests (4,756) 0 (4,756) (15,349) 0 (15,349) Earnings before interest, tax, and depreciation (EBITDA less NCI) $35,751 $16,092 $51,843 $112,014 $ 49,971 $ 161,985 EBITDA less NCI as a percentage of revenue 7.0% 10.2% 6.2% 8.9% 8
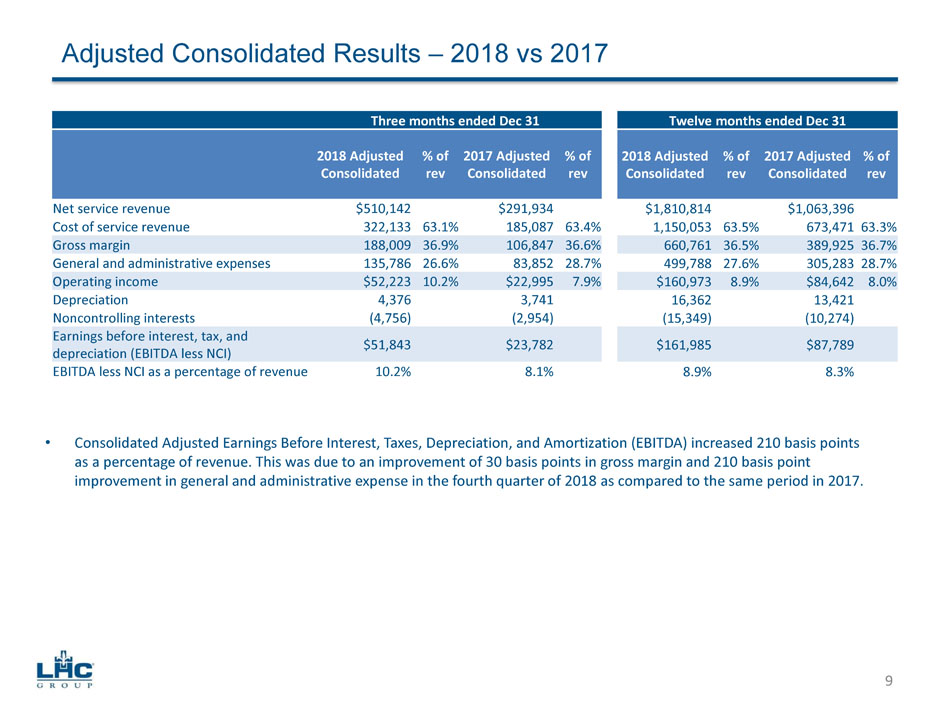
Adjusted Consolidated Results – 2018 vs 2017 Three months ended Dec 31 Twelve months ended Dec 31 2018 Adjusted Consolidated % of rev 2017 Adjusted Consolidated % of rev 2018 Adjusted Consolidated % of rev 2017 Adjusted Consolidated % of rev Net service revenue $510,142 $291,934 $1,810,814 $1,063,396 Cost of service revenue 322,133 63.1% 185,087 63.4% 1,150,053 63.5% 673,471 63.3% Gross margin 188,009 36.9% 106,847 36.6% 660,761 36.5% 389,925 36.7% General and administrative expenses 135,786 26.6% 83,852 28.7% 499,788 27.6% 305,283 28.7% Operating income $52,223 10.2% $22,995 7.9% $160,973 8.9% $84,642 8.0% Depreciation 4,376 3,741 16,362 13,421 Noncontrolling interests (4,756) (2,954) (15,349) (10,274) Earnings before interest, tax, and depreciation (EBITDA less NCI) $51,843 $23,782 $ 161,985 $87,789 EBITDA less NCI as a percentage of revenue 10.2% 8.1% 8.9% 8.3% • Consolidated Adjusted Earnings Before Interest, Taxes, Depreciation, and Amortization (EBITDA) increased 210 basis points as a percentage of revenue. This was due to an improvement of 30 basis points in gross margin and 210 basis point improvement in general and administrative expense in the fourth quarter of 2018 as compared to the same period in 2017. 9
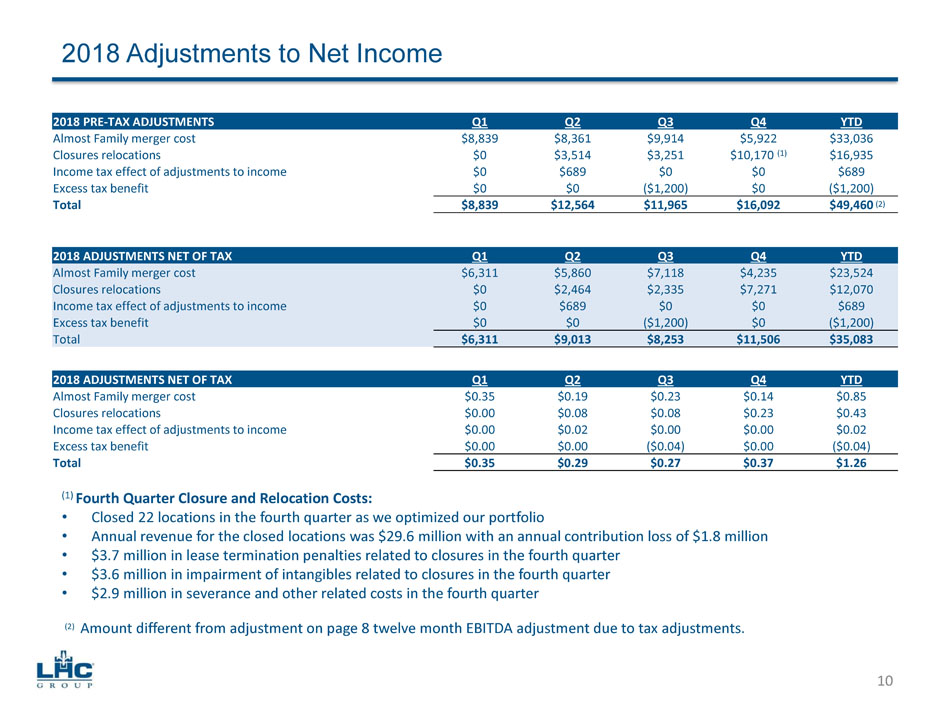
2018 Adjustments to Net Income 2018 PRE - TAX ADJUSTMENTS Q1 Q2 Q3 Q4 YTD Almost Family merger cost $8,839 $8,361 $9,914 $ 5,922 $ 33,036 Closures relocations $0 $3,514 $3,251 $ 10,170 (1) $16,935 Income tax effect of adjustments to income $0 $689 $0 $0 $689 Excess tax benefit $0 $0 ($1,200) $0 ($1,200) Total $8,839 $12,564 $11,965 $16,092 $ 49,460 2018 ADJUSTMENTS NET OF TAX Q1 Q2 Q3 Q4 YTD Almost Family merger cost $6,311 $5,860 $7,118 $4,235 $23,524 Closures relocations $0 $2,464 $2,335 $7,271 $12,070 Income tax effect of adjustments to income $0 $689 $0 $0 $689 Excess tax benefit $0 $0 ($1,200) $0 ($1,200) Total $6,311 $9,013 $8,253 $11,506 $35,083 2018 ADJUSTMENTS NET OF TAX Q1 Q2 Q3 Q4 YTD Almost Family merger cost $0.35 $0.19 $0.23 $0.14 $0.85 Closures relocations $0.00 $0.08 $0.08 $0.23 $0.43 Income tax effect of adjustments to income $0.00 $0.02 $0.00 $0.00 $0.02 Excess tax benefit $0.00 $0.00 ($0.04) $0.00 ($0.04) Total $0.35 $0.29 $0.27 $0.37 $1.26 ( 1) Fourth Quarter Closure and Relocation Costs: • Closed 22 locations in the fourth quarter as we optimized our portfolio • Annual revenue for the closed locations was $29.6 million with an annual contribution loss of $1.8 million • $3.7 million in lease termination penalties related to closures in the fourth quarter • $3.6 million in impairment of intangibles related to closures in the fourth quarter • $2.9 million in severance and other related costs in the fourth quarter (2) Amount different from adjustment on page 8 twelve month EBITDA adjustment due to tax adjustments. 10 (2)
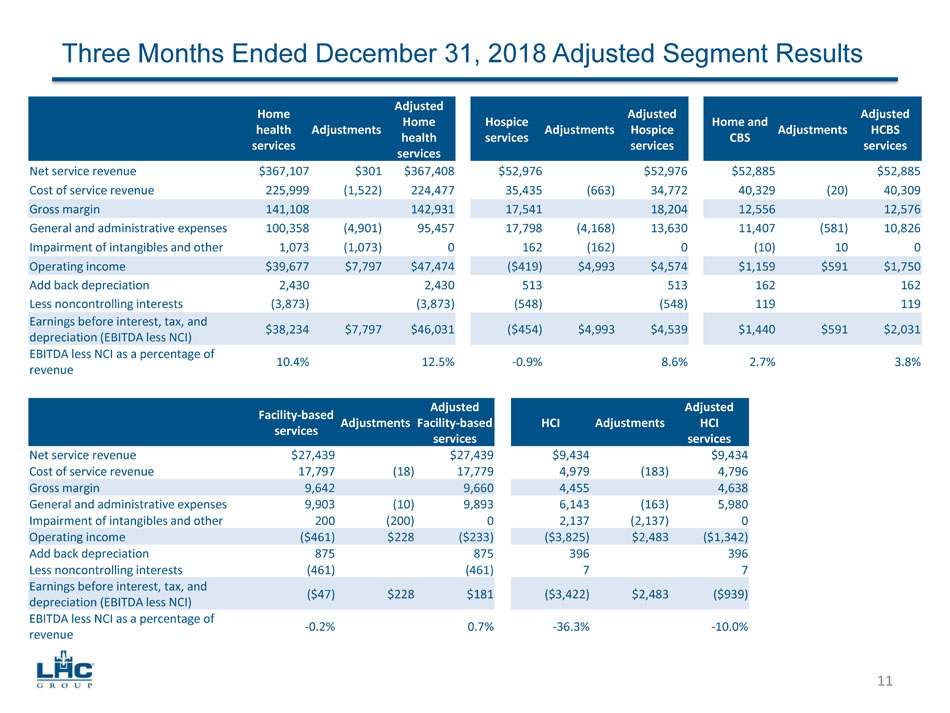
Three Months E nded December 31, 2018 Adjusted Segment Results Home health services Adjustments Adjusted Home health services Hospice services Adjustments Adjusted Hospice services Home and CBS Adjustments Adjusted HCBS services Net service revenue $367,107 $301 $367,408 $52,976 $52,976 $52,885 $52,885 Cost of service revenue 225,999 (1,522) 224,477 35,435 (663) 34,772 40,329 (20) 40,309 Gross margin 141,108 142,931 17,541 18,204 12,556 12,576 General and administrative expenses 100,358 (4,901) 95,457 17,798 (4,168) 13,630 11,407 (581) 10,826 Impairment of intangibles and other 1,073 (1,073) 0 162 (162) 0 (10) 10 0 Operating income $39,677 $7,797 $47,474 ($419) $4,993 $4,574 $1,159 $591 $1,750 Add back depreciation 2,430 2,430 513 513 162 162 Less n oncontrolling interests (3,873) (3,873) (548) (548) 119 119 Earnings before interest, tax, and depreciation (EBITDA less NCI) $38,234 $7,797 $46,031 ($454) $4,993 $4,539 $1,440 $591 $2,031 EBITDA less NCI as a percentage of revenue 10.4% 12.5% - 0.9% 8.6% 2.7% 3.8% Facility - based services Adjustments Adjusted Facility - based services HCI Adjustments Adjusted HCI services Net service revenue $27,439 $27,439 $9,434 $9,434 Cost of service revenue 17,797 (18) 17,779 4,979 (183) 4,796 Gross margin 9,642 9,660 4,455 4,638 General and administrative expenses 9,903 (10) 9,893 6,143 (163) 5,980 Impairment of intangibles and other 200 (200) 0 2,137 (2,137) 0 Operating income ($461) $228 ($233) ($3,825) $2,483 ($1,342) Add back depreciation 875 875 396 396 Less n oncontrolling interests (461) (461) 7 7 Earnings before interest, tax, and depreciation (EBITDA less NCI) ($47) $228 $181 ($3,422) $2,483 ($939) EBITDA less NCI as a percentage of revenue - 0.2% 0.7% - 36.3% - 10.0% 11
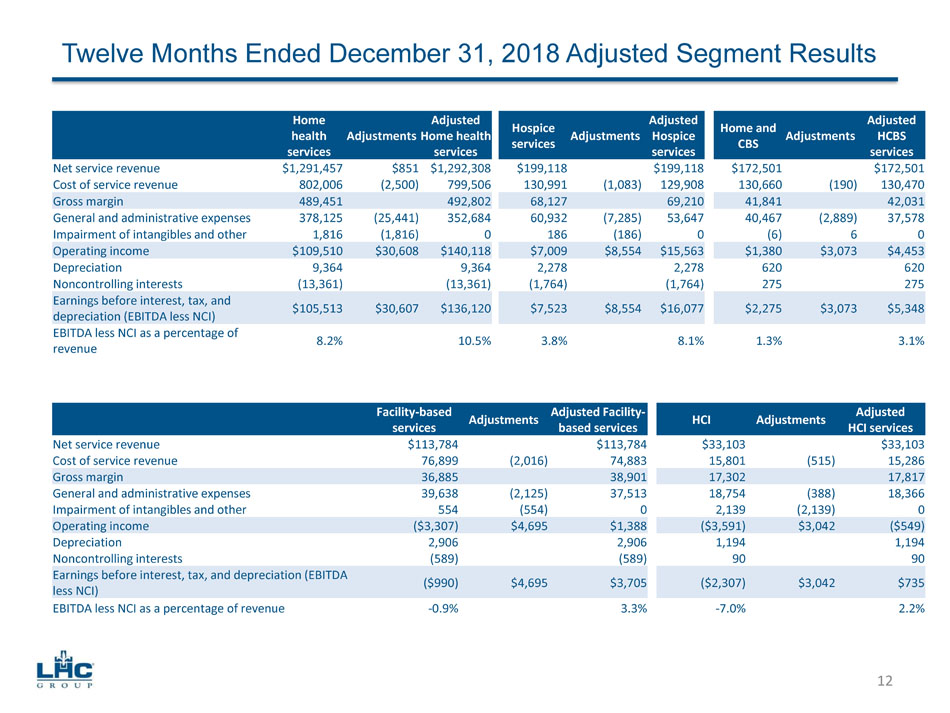
Twelve Months E nded December 31, 2018 Adjusted Segment Results Home health services Adjustments Adjusted Home health services Hospice services Adjustments Adjusted Hospice services Home and CBS Adjustments Adjusted HCBS services Net service revenue $1,291,457 $851 $1,292,308 $199,118 $199,118 $172,501 $172,501 Cost of service revenue 802,006 (2,500) 799,506 130,991 (1,083) 129,908 130,660 (190) 130,470 Gross margin 489,451 492,802 68,127 69,210 41,841 42,031 General and administrative expenses 378,125 (25,441) 352,684 60,932 (7,285) 53,647 40,467 (2,889) 37,578 Impairment of intangibles and other 1,816 (1,816) 0 186 (186) 0 (6) 6 0 Operating income $109,510 $30,608 $140,118 $7,009 $8,554 $15,563 $1,380 $3,073 $4,453 Depreciation 9,364 9,364 2,278 2,278 620 620 Noncontrolling interests (13,361) (13,361) (1,764) (1,764) 275 275 Earnings before interest, tax, and depreciation (EBITDA less NCI) $105,513 $ 30,607 $ 136,120 $7,523 $8,554 $16,077 $2,275 $3,073 $5,348 EBITDA less NCI as a percentage of revenue 8.2% 10.5% 3.8% 8.1% 1.3% 3.1% Facility - based services Adjustments Adjusted Facility - based services HCI Adjustments Adjusted HCI services Net service revenue $113,784 $113,784 $33,103 $33,103 Cost of service revenue 76,899 (2,016) 74,883 15,801 (515) 15,286 Gross margin 36,885 38,901 17,302 17,817 General and administrative expenses 39,638 (2,125) 37,513 18,754 (388) 18,366 Impairment of intangibles and other 554 (554) 0 2,139 (2,139) 0 Operating income ($3,307) $4,695 $1,388 ($3,591) $3,042 ($549) Depreciation 2,906 2,906 1,194 1,194 Noncontrolling interests (589) (589) 90 90 Earnings before interest, tax, and depreciation (EBITDA less NCI) ($990) $4,695 $3,705 ($2,307) $3,042 $735 EBITDA less NCI as a percentage of revenue - 0.9% 3.3% - 7.0% 2.2% 12
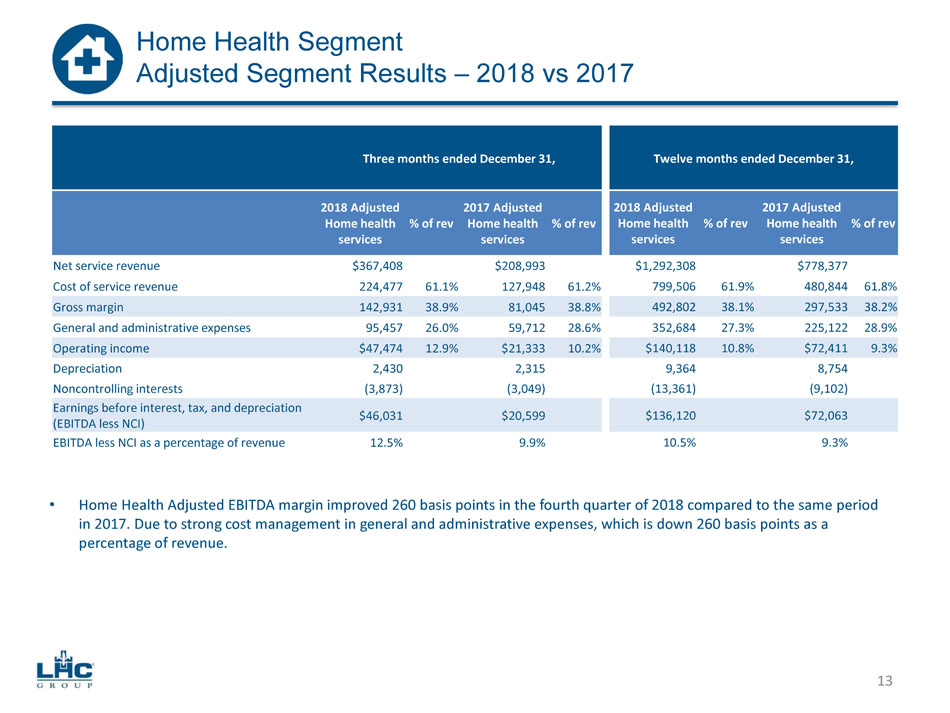
Three months ended December 31, Twelve months ended December 31, 2018 Adjusted Home health services % of rev 2017 Adjusted Home health services % of rev 2018 Adjusted Home health services % of rev 2017 Adjusted Home health services % of rev Net service revenue $367,408 $208,993 $1,292,308 $778,377 Cost of service revenue 224,477 61.1% 127,948 61.2% 799,506 61.9% 480,844 61.8% Gross margin 142,931 38.9% 81,045 38.8% 492,802 38.1% 297,533 38.2% General and administrative expenses 95,457 26.0% 59,712 28.6% 352,684 27.3% 225,122 28.9% Operating income $47,474 12.9% $21,333 10.2% $140,118 10.8% $72,411 9.3% Depreciation 2,430 2,315 9,364 8,754 Noncontrolling interests (3,873) (3,049) (13,361) (9,102) Earnings before interest, tax, and depreciation (EBITDA less NCI) $46,031 $20,599 $ 136,120 $72,063 EBITDA less NCI as a percentage of revenue 12.5% 9.9% 10.5% 9.3% • Home Health Adjusted EBITDA margin improved 260 basis points in the fourth quarter of 2018 compared to the same period in 2017. D ue to strong cost management in general and administrative expenses, which is down 260 basis points as a percentage of revenue. 13 Home Health Segment Adjusted Segment Results – 2018 vs 2017
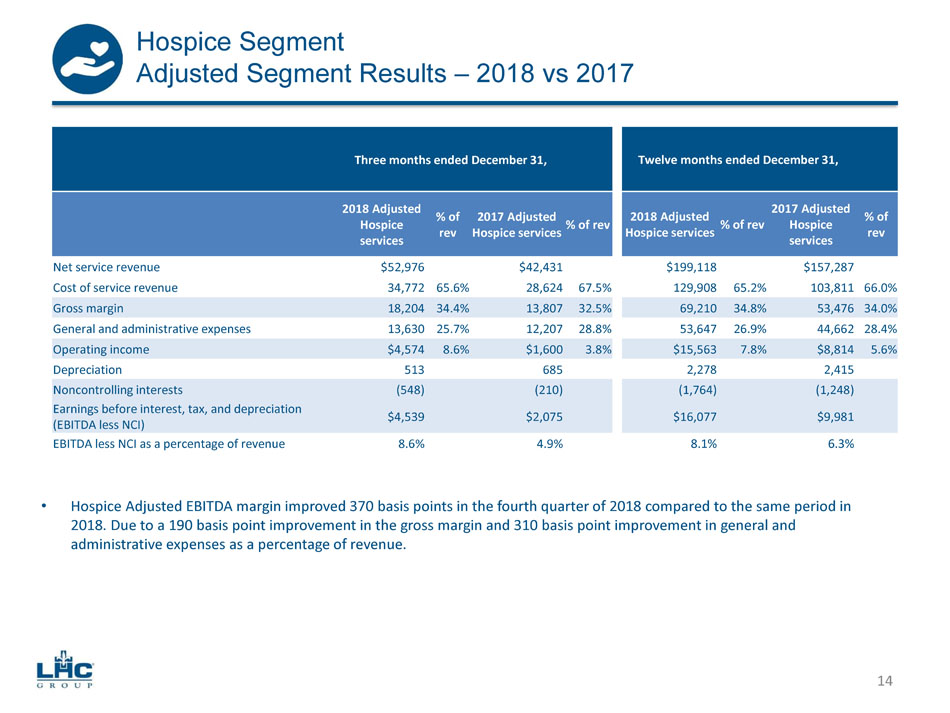
Three months ended December 31, Twelve months ended December 31, 2018 Adjusted Hospice services % of rev 2017 Adjusted Hospice services % of rev 2018 Adjusted Hospice services % of rev 2017 Adjusted Hospice services % of rev Net service revenue $52,976 $42,431 $199,118 $157,287 Cost of service revenue 34,772 65.6% 28,624 67.5% 129,908 65.2% 103,811 66.0% Gross margin 18,204 34.4% 13,807 32.5% 69,210 34.8% 53,476 34.0% General and administrative expenses 13,630 25.7% 12,207 28.8% 53,647 26.9% 44,662 28.4% Operating income $4,574 8.6% $1,600 3.8% $15,563 7.8% $8,814 5.6% Depreciation 513 685 2,278 2,415 Noncontrolling interests (548) (210) (1,764) (1,248) Earnings before interest, tax, and depreciation (EBITDA less NCI) $4,539 $2,075 $16,077 $9,981 EBITDA less NCI as a percentage of revenue 8.6% 4.9% 8.1% 6.3% • Hospice Adjusted EBITDA margin improved 370 basis points in the fourth quarter of 2018 compared to the same period in 2018. D ue to a 190 basis point improvement in the gross margin and 310 basis point improvement in general and administrative expenses as a percentage of revenue. 14 Hospice Segment Adjusted Segment Results – 2018 vs 2017
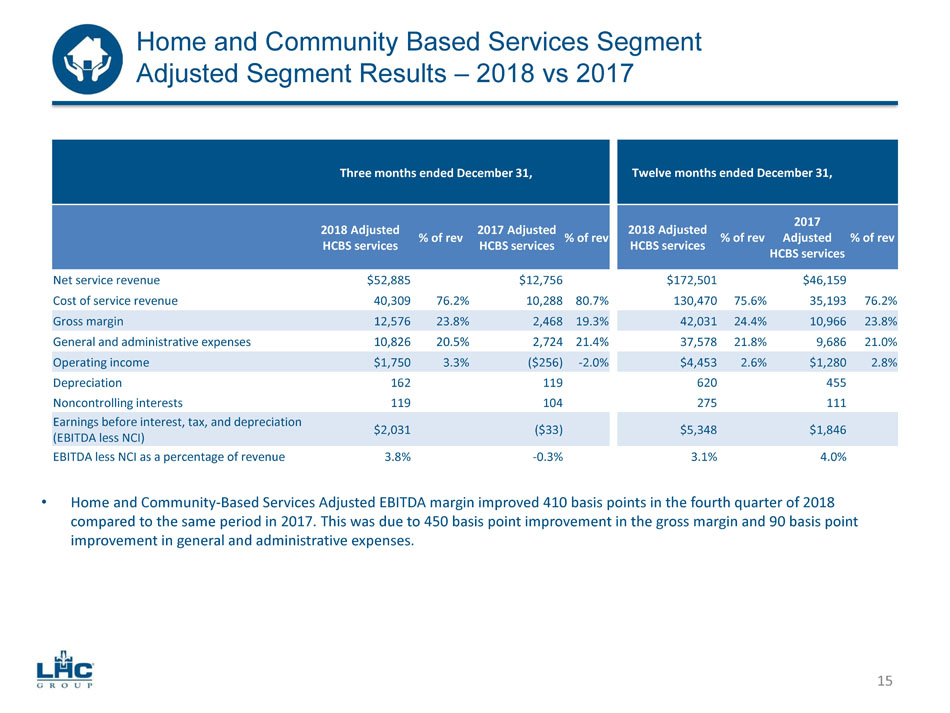
Three months ended December 31, Twelve months ended December 31, 2018 Adjusted HCBS services % of rev 2017 Adjusted HCBS services % of rev 2018 Adjusted HCBS services % of rev 2017 Adjusted HCBS services % of rev Net service revenue $52,885 $12,756 $172,501 $46,159 Cost of service revenue 40,309 76.2% 10,288 80.7% 130,470 75.6% 35,193 76.2% Gross margin 12,576 23.8% 2,468 19.3% 42,031 24.4% 10,966 23.8% General and administrative expenses 10,826 20.5% 2,724 21.4% 37,578 21.8% 9,686 21.0% Operating income $1,750 3.3% ($256) - 2.0% $4,453 2.6% $1,280 2.8% Depreciation 162 119 620 455 Noncontrolling interests 119 104 275 111 Earnings before interest, tax, and depreciation (EBITDA less NCI) $2,031 ($33) $5,348 $1,846 EBITDA less NCI as a percentage of revenue 3.8% - 0.3% 3.1% 4.0% • Home and Community - Based Services Adjusted EBITDA margin improved 410 basis points in the fourth quarter of 2018 compared to the same period in 2017. This was due to 450 basis point improvement in the gross margin and 90 basis point improvement in general and administrative expenses. 15 Home and Community Based Services Segment Adjusted Segment Results – 2018 vs 2017
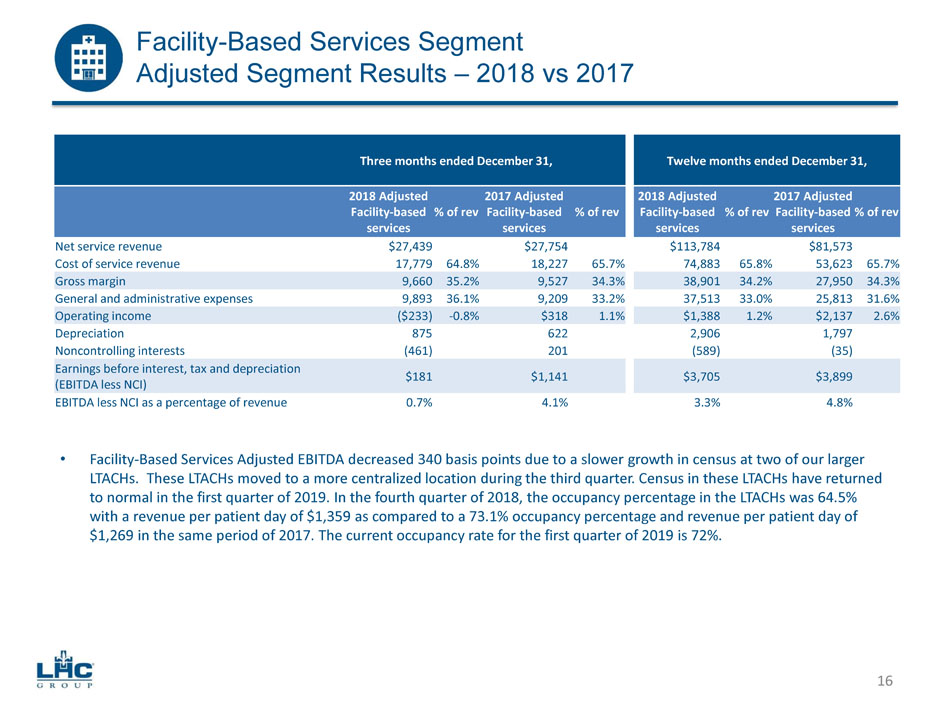
Facility - Based Services Segment Adjusted Segment Results – 2018 vs 2017 Three months ended December 31, Twelve months ended December 31, 2018 Adjusted Facility - based services % of rev 2017 Adjusted Facility - based services % of rev 2018 Adjusted Facility - based services % of rev 2017 Adjusted Facility - based services % of rev Net service revenue $27,439 $27,754 $113,784 $81,573 Cost of service revenue 17,779 64.8% 18,227 65.7% 74,883 65.8% 53,623 65.7% Gross margin 9,660 35.2% 9,527 34.3% 38,901 34.2% 27,950 34.3% General and administrative expenses 9,893 36.1% 9,209 33.2% 37,513 33.0% 25,813 31.6% Operating income ($233) - 0.8% $318 1.1% $1,388 1.2% $2,137 2.6% Depreciation 875 622 2,906 1,797 Noncontrolling interests (461) 201 (589) (35) Earnings before interest, tax and depreciation (EBITDA less NCI) $181 $1,141 $3,705 $3,899 EBITDA less NCI as a percentage of revenue 0.7% 4.1% 3.3% 4.8% • Facility - Based Services Adjusted EBITDA decreased 340 basis points due to a slower growth in census at two of our larger LTACHs. These LTACHs moved to a more centralized location during the third quarter. Census in these LTACHs have returned to normal in the first quarter of 2019 . In the fourth quarter of 2018, the occupancy percentage in the LTACHs was 64.5% with a revenue per patient day of $1,359 as compared to a 73.1% occupancy percentage and revenue per patient day of $1,269 in the same period of 2017. The current occupancy rate for the first quarter of 2019 is 72%. 16
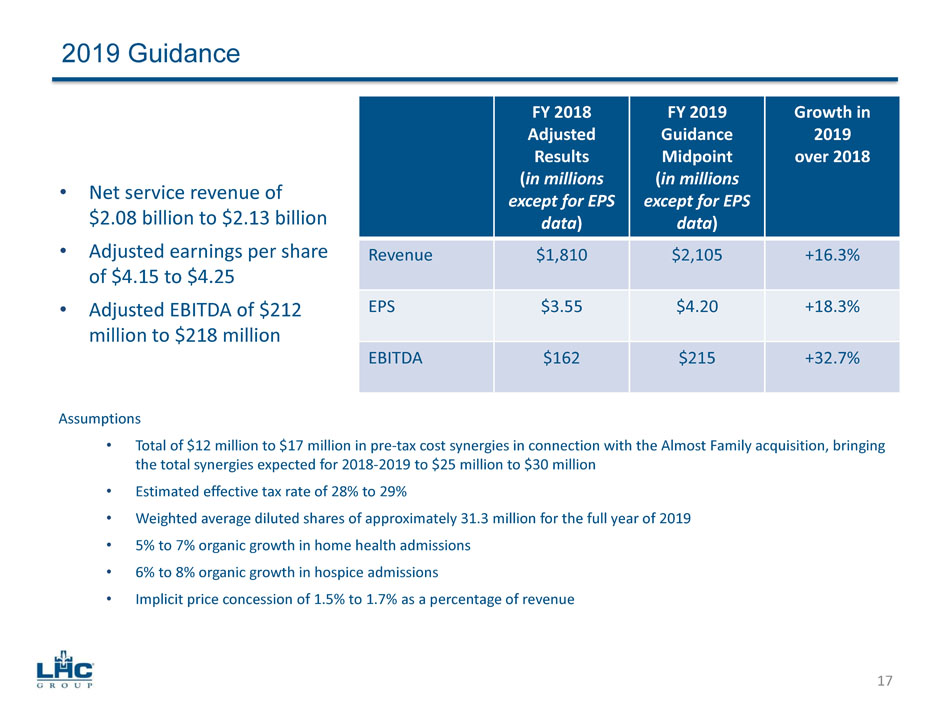
Assumptions • Total of $12 million to $ 17 million in pre - tax cost synergies in connection with the Almost Family acquisition, bringing the total synergies expected for 2018 - 2019 to $25 million to $30 million • Estimated effective tax rate of 28% to 29% • Weighted average diluted shares of approximately 31.3 million for the full year of 2019 • 5 % to 7% organic growth in home health admissions • 6% to 8% organic growth in hospice admissions • Implicit price concession of 1.5% to 1.7% as a percentage of revenue 2019 Guidance FY 2018 Adjusted Results ( in millions except for EPS data ) FY 2019 Guidance Midpoint ( in millions except for EPS data ) Growth in 2019 over 2018 Revenue $1,810 $2,105 +16.3% EPS $3.55 $4.20 +18.3% EBITDA $162 $215 +32.7% • Net service revenue of $2.08 billion to $2.13 billion • Adjusted earnings per share of $4.15 to $4.25 • Adjusted EBITDA of $212 million to $218 million 17
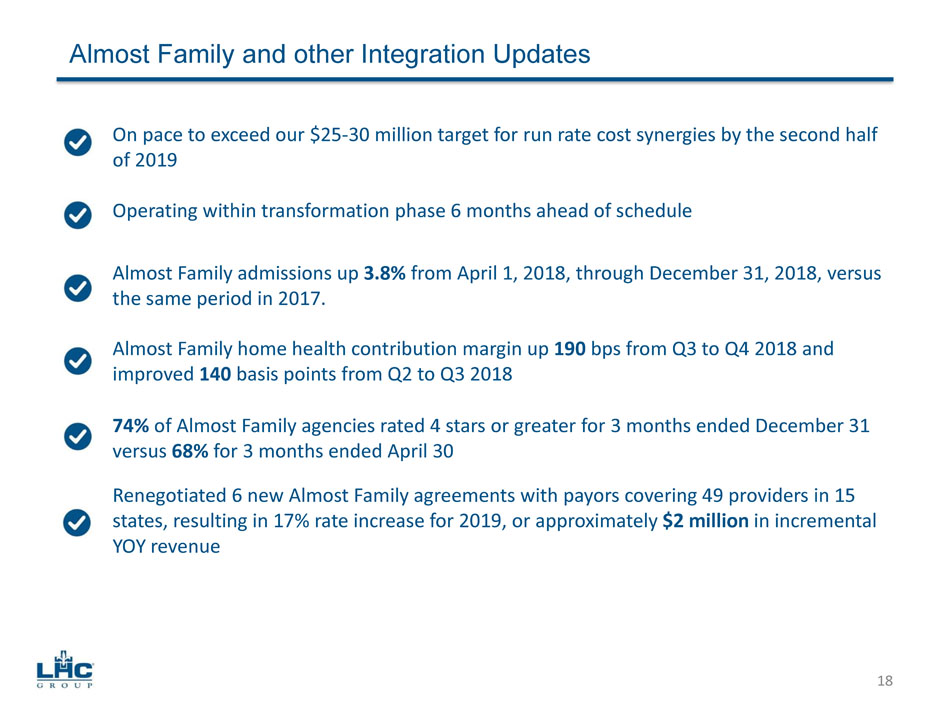
Almost Family and other Integration Updates On pace to exceed our $ 25 - 30 million target for run rate cost synergies by the second half of 2019 Almost Family home health contribution margin up 190 bps from Q3 to Q4 2018 and improved 140 basis points from Q2 to Q3 2018 74% of Almost Family agencies rated 4 stars or greater for 3 months ended December 31 versus 68% for 3 months ended April 30 Almost Family admissions up 3.8% from April 1, 2018, through December 31, 2018, versus the same period in 2017. Operating within transformation phase 6 months ahead of schedule Renegotiated 6 new Almost Family agreements with payors covering 49 providers in 15 states, resulting in 17% rate increase for 2019, or approximately $2 million in incremental YOY revenue 18
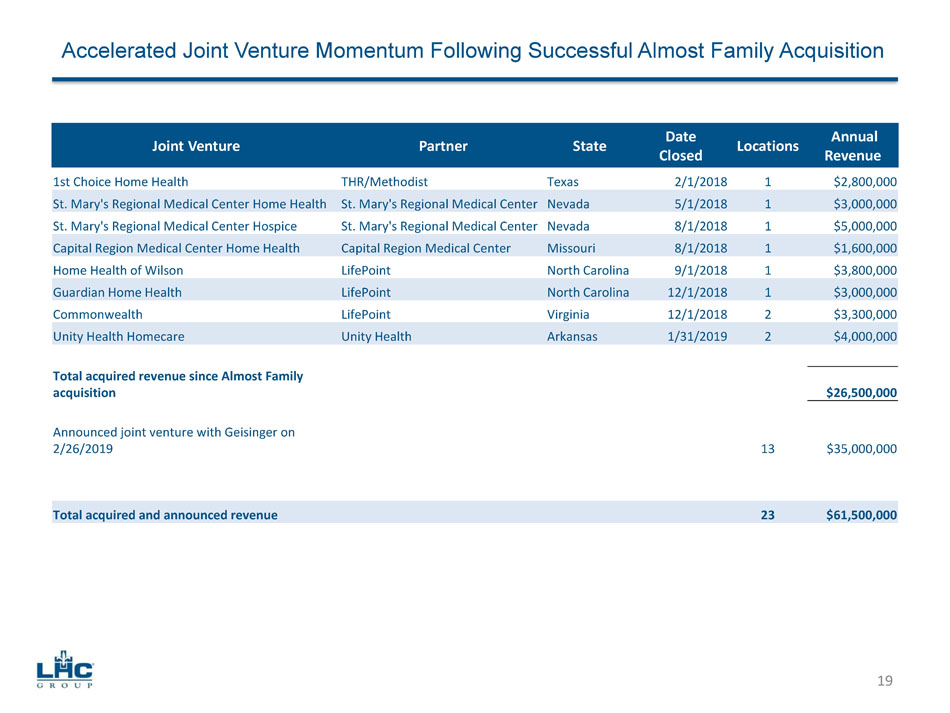
Accelerated Joint Venture Momentum Following Successful Almost Family Acquisition Joint Venture Partner State Date Closed Locations Annual Revenue 1st Choice Home Health THR/Methodist Texas 2/1/2018 1 $2,800,000 St. Mary's Regional Medical Center Home Health St. Mary's Regional Medical Center Nevada 5/1/2018 1 $3,000,000 St. Mary's Regional Medical Center Hospice St. Mary's Regional Medical Center Nevada 8/1/2018 1 $5,000,000 Capital Region Medical Center Home Health Capital Region Medical Center Missouri 8/1/2018 1 $1,600,000 Home Health of Wilson LifePoint North Carolina 9/1/2018 1 $3,800,000 Guardian Home Health LifePoint North Carolina 12/1/2018 1 $3,000,000 Commonwealth LifePoint Virginia 12/1/2018 2 $3,300,000 Unity Health Homecare Unity Health Arkansas 1/31/2019 2 $4,000,000 Total acquired revenue since Almost Family acquisition $26,500,000 Announced j oint venture with Geisinger on 2/26/2019 13 $ 35,000,000 Total acquired and announced revenue 23 $61,500,000 19
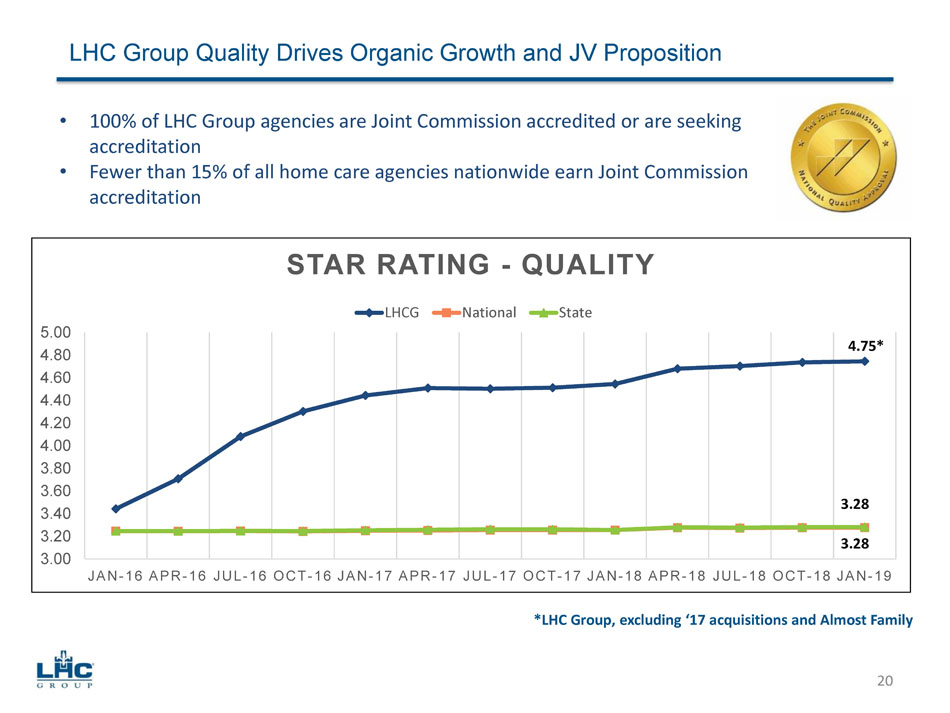
LHC Group Quality Drives Organic Growth and JV Proposition *LHC Group, excluding ‘17 acquisitions and Almost Family • 100% of LHC Group agencies are Joint Commission accredited or are seeking accreditation • Fewer than 15% of all home care agencies nationwide earn Joint Commission accreditation 3.00 3.20 3.40 3.60 3.80 4.00 4.20 4.40 4.60 4.80 5.00 JAN - 16 APR - 16 JUL - 16 OCT - 16 JAN - 17 APR - 17 JUL - 17 OCT - 17 JAN - 18 APR - 18 JUL - 18 OCT - 18 JAN - 19 STAR RATING - QUALITY LHCG National State 4.75* 3.28 3.28 20
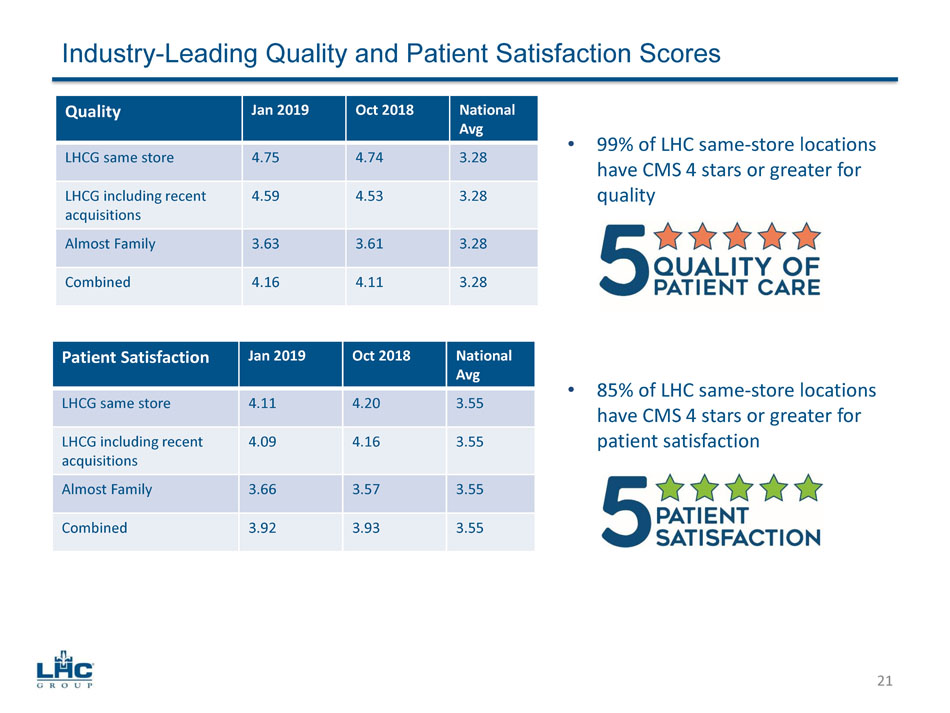
Industry - Leading Quality and Patient Satisfaction Scores Quality Jan 2019 Oct 2018 National Avg LHCG same store 4.75 4.74 3.28 LHCG including recent acquisitions 4.59 4.53 3.28 Almost Family 3.63 3.61 3.28 Combined 4.16 4.11 3.28 Patient Satisfaction Jan 2019 Oct 2018 National Avg LHCG same store 4.11 4.20 3.55 LHCG including recent acquisitions 4.09 4.16 3.55 Almost Family 3.66 3.57 3.55 Combined 3.92 3.93 3.55 • 99% of LHC same - store locations have CMS 4 stars or greater for quality • 85% of LHC same - store locations have CMS 4 stars or greater for patient satisfaction 21
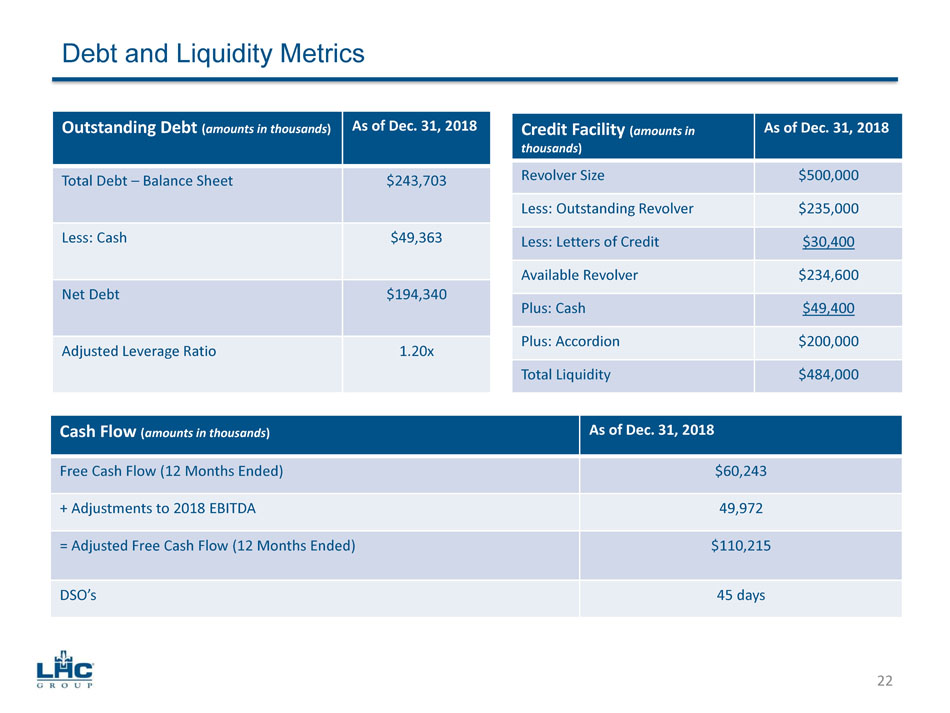
Debt and Liquidity Metrics Outstanding Debt ( amounts in thousands ) As of Dec. 31, 2018 Total Debt – Balance Sheet $243,703 Less: Cash $49,363 Net Debt $194,340 Adjusted Leverage Ratio 1.20x Credit Facility ( amounts in thousands ) As of Dec. 31, 2018 Revolver Size $500,000 Less: Outstanding Revolver $235,000 Less: Letters of Credit $30,400 Available Revolver $234,600 Plus: Cash $49,400 Plus: Accordion $200,000 Total Liquidity $484,000 Cash Flow ( amounts in thousands ) As of Dec. 31, 2018 Free Cash Flow (12 Months Ended) $60,243 + Adjustments to 2018 EBITDA 49,972 = Adjusted Free Cash Flow (12 Months Ended) $110,215 DSO’s 45 days 22
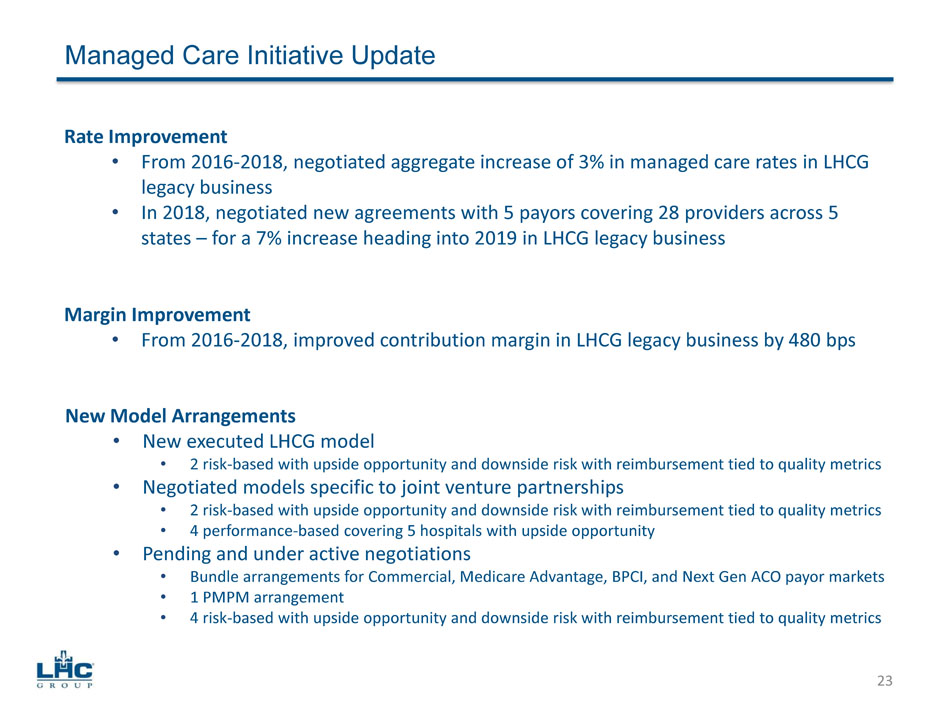
Managed Care Initiative Update Rate Improvement • From 2016 - 2018, negotiated aggregate increase of 3% in managed care rates in LHCG legacy business • In 2018, negotiated new agreements with 5 payors covering 28 providers across 5 states – for a 7% increase heading into 2019 in LHCG legacy business Margin Improvement • From 2016 - 2018, improved contribution margin in LHCG legacy business by 480 bps New Model Arrangements • New executed LHCG model • 2 risk - based with upside opportunity and downside risk with reimbursement tied to quality metrics • Negotiated models specific to joint venture partnerships • 2 risk - based with upside opportunity and downside risk with reimbursement tied to quality metrics • 4 performance - based covering 5 hospitals with upside opportunity • Pending and under active negotiations • Bundle arrangements for Commercial, Medicare Advantage, BPCI, and Next Gen ACO payor markets • 1 PMPM arrangement • 4 risk - based with upside opportunity and downside risk with reimbursement tied to quality metrics 23
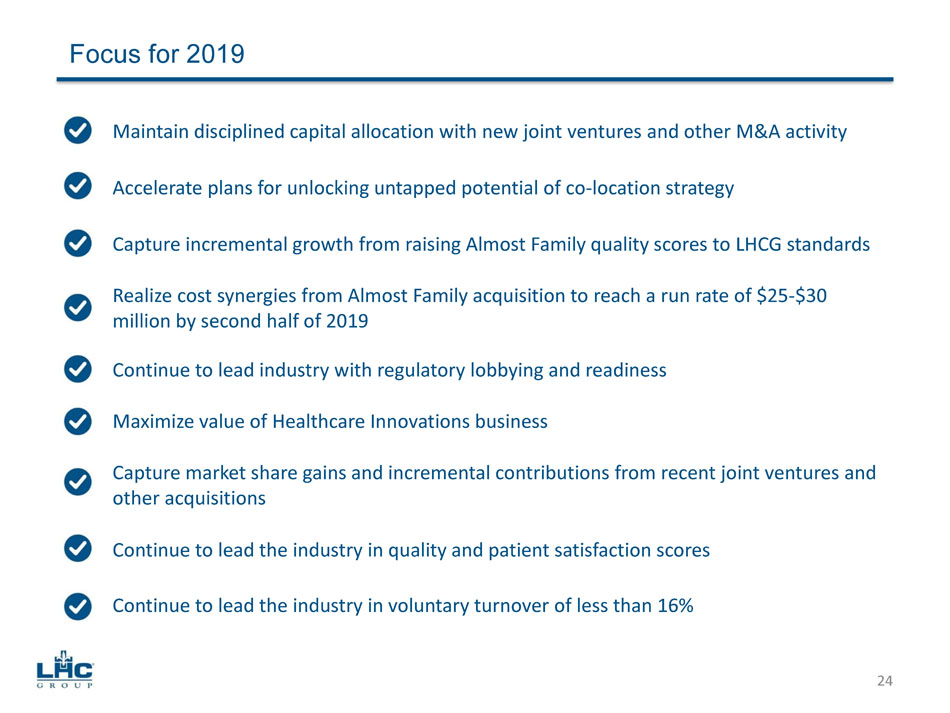
Focus for 2019 Maintain disciplined capital allocation with new joint ventures and other M&A activity Realize cost synergies from Almost Family acquisition to reach a run rate of $25 - $30 million by second half of 2019 Continue to lead industry with regulatory lobbying and readiness Maximize value of Healthcare Innovations business Capture incremental growth from raising Almost Family quality scores to LHCG standards Accelerate plans for unlocking untapped potential of co - location strategy Capture market share gains and incremental contributions from recent joint ventures and other acquisitions 24 Continue to lead the industry in quality and patient satisfaction scores Continue to lead the industry in voluntary turnover of less than 16%
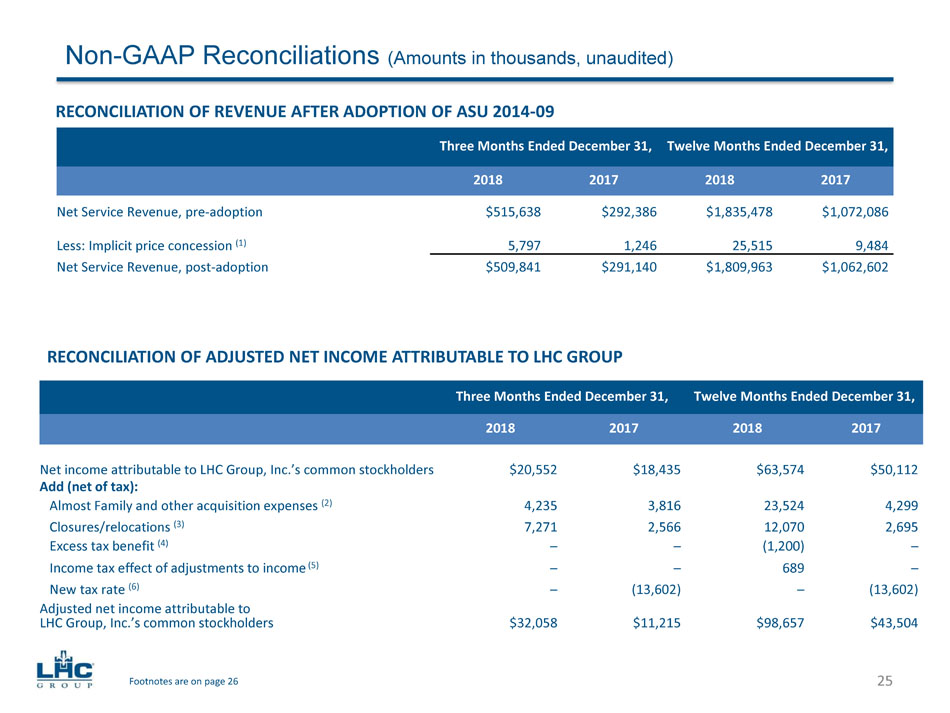
Non - GAAP Reconciliations (Amounts in thousands, unaudited) RECONCILIATION OF REVENUE AFTER ADOPTION OF ASU 2014 - 09 RECONCILIATION OF ADJUSTED NET INCOME ATTRIBUTABLE TO LHC GROUP Three Months Ended December 31, Twelve Months Ended December 31, 2018 2017 2018 2017 Net Service Revenue, pre - adoption $515,638 $292,386 $ 1,835,478 $ 1,072,086 Less: Implicit price concession (1) 5,797 1,246 25,515 9,484 Net Service Revenue, post - adoption $509,841 $291,140 $ 1,809,963 $ 1,062,602 Three Months Ended December 31, Twelve Months Ended December 31, 2018 2017 2018 2017 Net income attributable to LHC Group, Inc.’s common stockholders $20,552 $18,435 $63,574 $50,112 Add (net of tax): Almost Family and other acquisition expenses (2) 4,235 3,816 23,524 4,299 Closures/relocations (3) 7,271 2,566 12,070 2,695 Excess tax benefit (4) ─ ─ (1,200) ─ Income tax effect of adjustments to income (5) ─ ─ 689 ─ New tax rate (6) ─ (13,602) ─ (13,602) Adjusted net income attributable to LHC Group, Inc.’s common stockholders $32,058 $11,215 $98,657 $43,504 25 Footnotes are on page 26
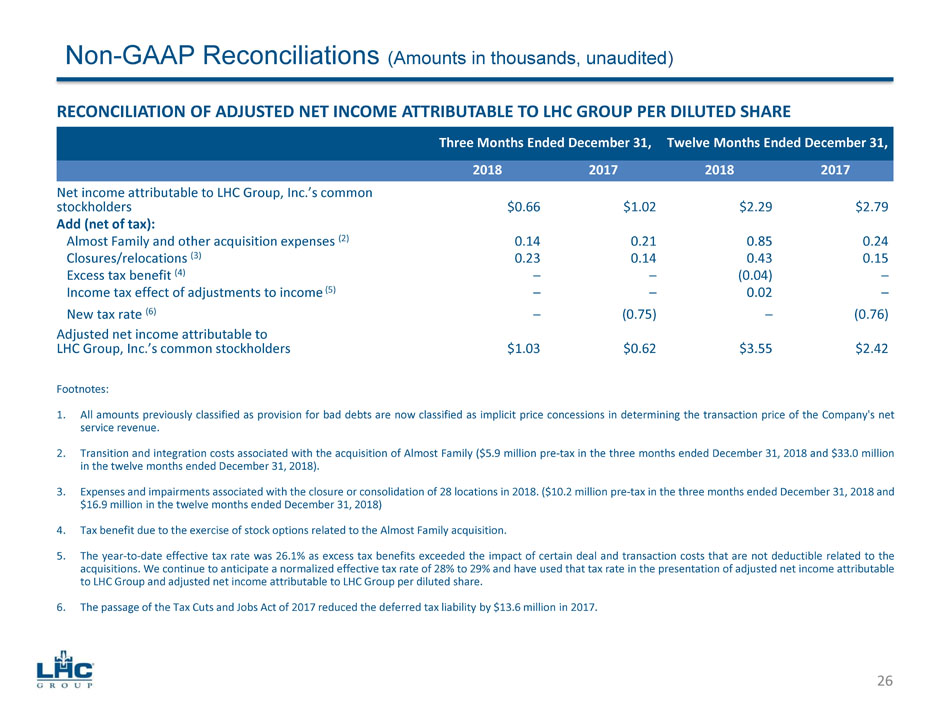
Non - GAAP Reconciliations (Amounts in thousands, unaudited ) RECONCILIATION OF ADJUSTED NET INCOME ATTRIBUTABLE TO LHC GROUP PER DILUTED SHARE Three Months Ended December 31, Twelve Months Ended December 31, 2018 2017 2018 2017 Net income attributable to LHC Group, Inc.’s common stockholders $0.66 $1.02 $2.29 $2.79 Add (net of tax): Almost Family and other acquisition expenses (2) 0.14 0.21 0.85 0.24 Closures/relocations (3) 0.23 0.14 0.43 0.15 Excess tax benefit (4) ─ ─ (0.04) ─ Income tax effect of adjustments to income (5) ─ ─ 0.02 ─ New tax rate (6) ─ (0.75) ─ (0.76) Adjusted net income attributable to LHC Group, Inc.’s common stockholders $1.03 $0.62 $3.55 $2.42 Footnotes : 1. All amounts previously classified as provision for bad debts are now classified as implicit price concessions in determining the transaction price of the Company's net service revenue . 2. Transition and integration costs associated with the acquisition of Almost Family ( $ 5 . 9 million pre - tax in the three months ended December 31 , 2018 and $ 33 . 0 million in the twelve months ended December 31 , 2018 ) . 3. Expenses and impairments associated with the closure or consolidation of 28 locations in 2018 . ( $ 10 . 2 million pre - tax in the three months ended December 31 , 2018 and $ 16 . 9 million in the twelve months ended December 31 , 2018 ) 4. Tax benefit due to the exercise of stock options related to the Almost Family acquisition . 5. The year - to - date effective tax rate was 26 . 1 % as excess tax benefits exceeded the impact of certain deal and transaction costs that are not deductible related to the acquisitions . We continue to anticipate a normalized effective tax rate of 28 % to 29 % and have used that tax rate in the presentation of adjusted net income attributable to LHC Group and adjusted net income attributable to LHC Group per diluted share . 6. The passage of the Tax Cuts and Jobs Act of 2017 reduced the deferred tax liability by $ 13 . 6 million in 2017 . 26
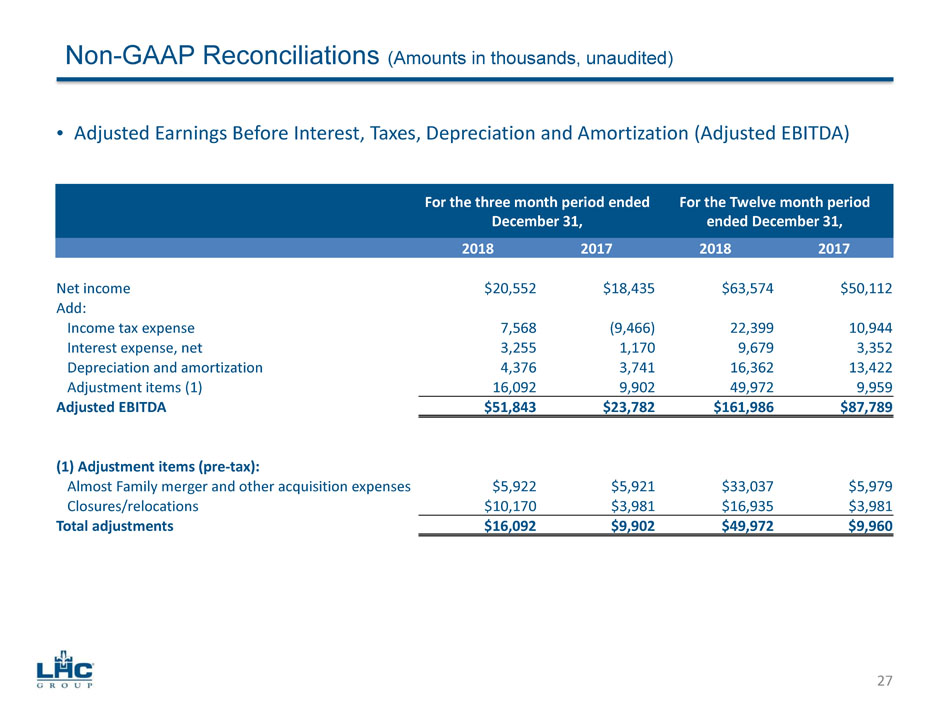
• Adjusted Earnings Before Interest, Taxes, Depreciation and Amortization (Adjusted EBITDA) For the three month period ended December 31, For the Twelve month period ended December 31, 2018 2017 2018 2017 Net income $20,552 $18,435 $63,574 $50,112 Add: Income tax expense 7,568 (9,466) 22,399 10,944 Interest expense, net 3,255 1,170 9,679 3,352 Depreciation and amortization 4,376 3,741 16,362 13,422 Adjustment items (1) 16,092 9,902 49,972 9,959 Adjusted EBITDA $ 51,843 $23,782 $161,986 $ 87,789 (1) Adjustment items (pre - tax): Almost Family merger and other acquisition expenses $ 5,922 $5,921 $33,037 $5,979 Closures/relocations $10,170 $3,981 $16,935 $3,981 Total adjustments $16,092 $9,902 $49,972 $9,960 Non - GAAP Reconciliations (Amounts in thousands, unaudited) 27