EXHIBIT 99.2
Supplemental Financial Information Second Quarter Ended June 30, 2020 August 5, 2020
Forward - Looking Statements This presentation contains “forward - looking statements” (as defined in the Securities Litigation Reform Act of 1995 ) regarding, among other things, future events or the future financial performance of the Company . Words such as “anticipate,” “expect,” “project,” “intend,” “believe,” “will,” “estimate,” “may,” “could,” “should,” “outlook,” and “guidance” and words and terms of similar substance used in connection with any discussion of future plans, actions, events or results identify forward - looking statements . Forward - looking statements are based on information currently available to the Company and involve estimates, expectations and p rojections. Investors are cautioned that all such forward - looking statements are subject to risks and uncertainties that could cause actual events or results to differ materially from th e events or results described in the forward - looking statements, including, but not limited to, the risks and uncertainties related to the COVID - 19 pandemic and those otherwise described in our filings with the Securities and Exchange Commission, including our most recent Annual Report on Form 10 - K and subsequent Quarterly Reports on Form 10 - Q and Current Reports on Form 8 - K. Many o f these risks, uncertainties and assumptions are beyond the Company’s ability to control or predict. Because of these risks, uncertainties and assumptions, investors should not plac e u ndue reliance on these forward - looking statements. Non - GAAP Financial Information This presentation includes certain financial measures that were not prepared in accordance with U . S . generally accepted accounting principles (“GAAP”), including EBITDA and Adjusted EBITDA . The company uses these non - GAAP financial measures in operating its business because management believes they are less susceptible to variances in actual operating performance that can result from the excluded items . The company presents these financial measures to investors because they believe they are useful to investors in evaluating the primary factors that drive the company's operating performance . The items excluded from these non - GAAP measures are important in understanding LHC Group’s financial performance, and any non - GAAP measures presented should not be considered in isolation of, or as an alternative to, GAAP financial measures . Since these non - GAAP financial measures are not measures determined in accordance with GAAP, have no standardized meaning prescribed by GAAP and are susceptible to varying calculations, these measures, as presented, may not be comparable to other similarly titled measures of other companies . EBITDA of LHC Group is defined as net income (loss) before income tax benefit (expense), interest expense, and depreciation and amortization expense . Adjusted EBITDA of LHC Group is defined as net income (loss) before income tax expense benefit (expense), depreciation and amortization expense, and transaction costs related to previous transactions . 2 Please visit the Investors section on our website at Investor.LHCgroup.com for additional information on LHC Group and the industry. Nasdaq: LHCG
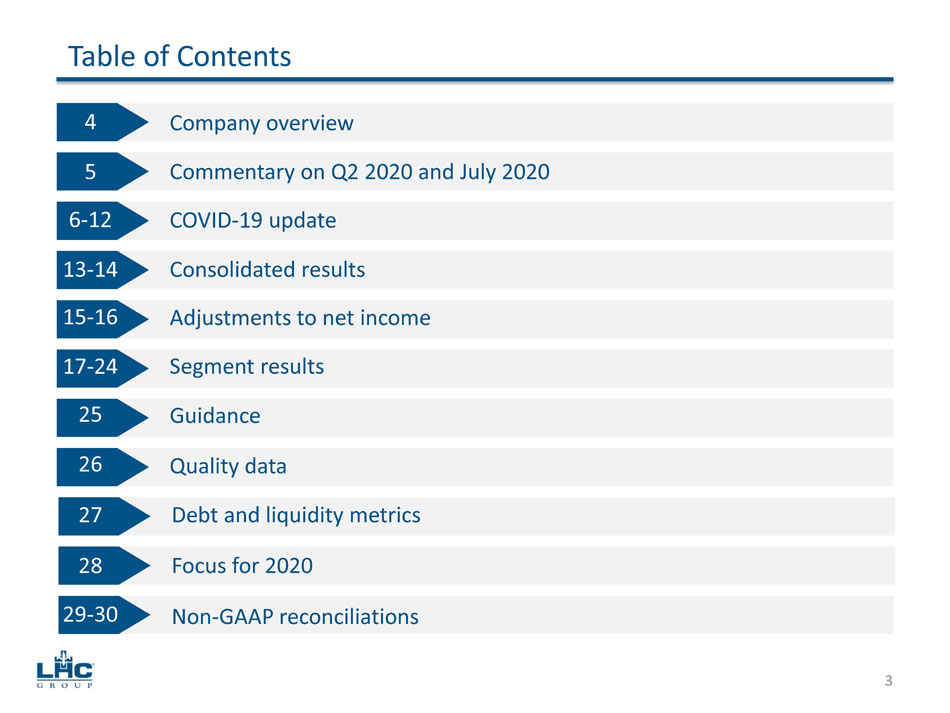
Table of Contents 3 4 Company overview 5 Commentary on Q2 2020 and July 2020 6 - 12 COVID - 19 update 13 - 14 Consolidated results 15 - 16 Adjustments to net income 17 - 24 Segment results 25 Guidance 26 Quality data 27 Debt and liquidity metrics 28 Focus for 2020 Non - GAAP reconciliations 29 - 30

Home Health Hospice HCBS Home Health & Hospice Home Health & HCBS Home Health, Hospice, & HCBS LHC Group Overview 4 553 home health locations 60% Of U.S. population aged 65+ included in service area 112 hospice locations 111 home & community based services locations 13 Long term acute care hospitals locations 27 other service locations 816 total locations 350 leading hospital JV partners 35 states and District of Columbia 69.3% 12.4% 10.1% 7.0% 1.2% % of Revenue HH Hospice HCBS Facility-based HCI
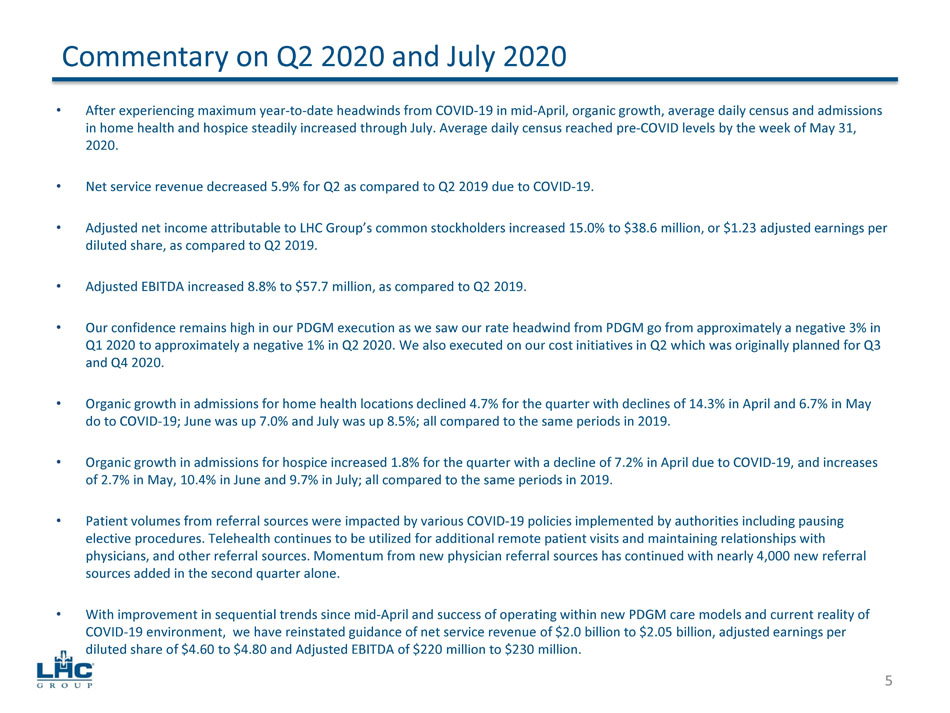
• After experiencing maximum year - to - date headwinds from COVID - 19 in mid - April, organic growth, average daily census and admission s in home health and hospice steadily increased through July. Average daily census reached pre - COVID levels by the week of May 31, 2020. • Net service revenue decreased 5.9% for Q2 as compared to Q2 2019 due to COVID - 19. • Adjusted net income attributable to LHC Group’s common stockholders increased 15.0% to $38.6 million, or $1.23 adjusted earni ngs per diluted share, as compared to Q2 2019. • Adjusted EBITDA increased 8.8% to $57.7 million, as compared to Q2 2019. • Our confidence remains high in our PDGM execution as we saw our rate headwind from PDGM go from approximately a negative 3% i n Q1 2020 to approximately a negative 1% in Q2 2020. We also executed on our cost initiatives in Q2 which was originally planne d f or Q3 and Q4 2020. • Organic growth in admissions for home health locations declined 4.7% for the quarter with declines of 14.3% in April and 6.7% in May do to COVID - 19; June was up 7.0% and July was up 8.5%; all compared to the same periods in 2019. • Organic growth in admissions for hospice increased 1.8% for the quarter with a decline of 7.2% in April due to COVID - 19, and inc reases of 2.7% in May, 10.4% in June and 9.7% in July; all compared to the same periods in 2019. • Patient volumes from referral sources were impacted by various COVID - 19 policies implemented by authorities including pausing elective procedures. Telehealth continues to be utilized for additional remote patient visits and maintaining relationships w ith physicians, and other referral sources. Momentum from new physician referral sources has continued with nearly 4,000 new refe rra l sources added in the second quarter alone. • With improvement in sequential trends since mid - April and success of operating within new PDGM care models and current reality o f COVID - 19 environment, we have reinstated guidance of net service revenue of $2.0 billion to $2.05 billion, adjusted earnings pe r diluted share of $4.60 to $4.80 and Adjusted EBITDA of $220 million to $230 million. Commentary on Q2 2020 and July 2020 5
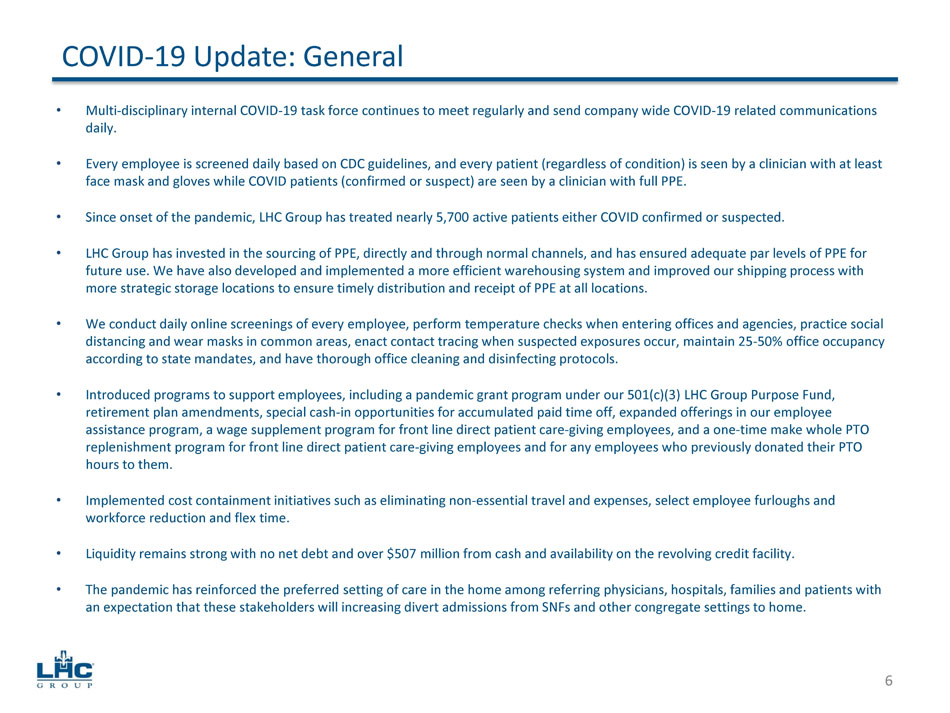
• Multi - disciplinary internal COVID - 19 task force continues to meet regularly and send company wide COVID - 19 related communication s daily. • Every employee is screened daily based on CDC guidelines, and every patient (regardless of condition) is seen by a clinician wit h at least face mask and gloves while COVID patients (confirmed or suspect) are seen by a clinician with full PPE. • Since onset of the pandemic, LHC Group has treated nearly 5,700 active patients either COVID confirmed or suspected. • LHC Group has invested in the sourcing of PPE, directly and through normal channels, and has ensured adequate par levels of P PE for future use. We have also developed and implemented a more efficient warehousing system and improved our shipping process with more strategic storage locations to ensure timely distribution and receipt of PPE at all locations. • We conduct daily online screenings of every employee, perform temperature checks when entering offices and agencies, practice so cial distancing and wear masks in common areas, enact contact tracing when suspected exposures occur, maintain 25 - 50% office occupanc y according to state mandates, and have thorough office cleaning and disinfecting protocols. • Introduced programs to support employees, including a pandemic grant program under our 501(c)(3) LHC Group Purpose Fund, retirement plan amendments, special cash - in opportunities for accumulated paid time off, expanded offerings in our employee assistance program, a wage supplement program for front line direct patient care - giving employees, and a one - time make whole PTO replenishment program for front line direct patient care - giving employees and for any employees who previously donated their PTO hours to them. • Implemented cost containment initiatives such as eliminating non - essential travel and expenses, select employee furloughs and workforce reduction and flex time. • Liquidity remains strong with no net debt and over $507 million from cash and availability on the revolving credit facility. • The pandemic has reinforced the preferred setting of care in the home among referring physicians, hospitals, families and pat ien ts with an expectation that these stakeholders will increasing divert admissions from SNFs and other congregate settings to home. COVID - 19 Update: General 6
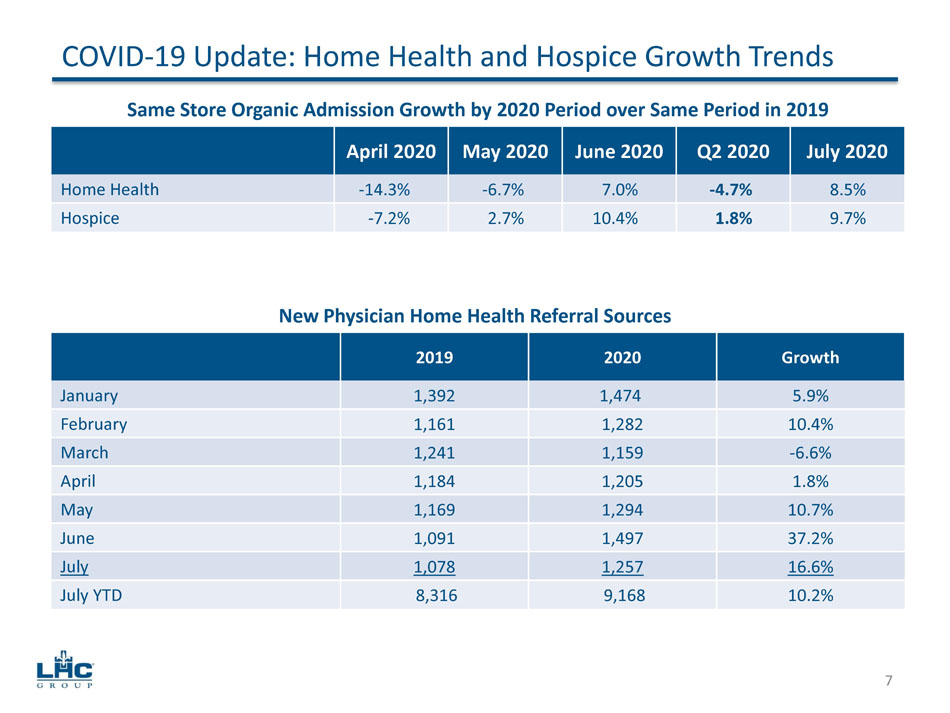
7 Same Store Organic Admission Growth by 2020 Period over Same Period in 2019 April 2020 May 2020 June 2020 Q2 2020 July 2020 Home Health - 14.3% - 6.7% 7.0% - 4.7% 8.5% Hospice - 7.2% 2.7% 10.4% 1.8% 9.7% 2019 2020 Growth January 1,392 1,474 5.9% February 1,161 1,282 10.4% March 1,241 1,159 - 6.6% April 1,184 1,205 1.8% May 1,169 1,294 10.7% June 1,091 1,497 37.2% July 1,078 1,257 16.6% July YTD 8,316 9,168 10.2% COVID - 19 Update: Home Health and Hospice Growth Trends New Physician Home Health Referral Sources
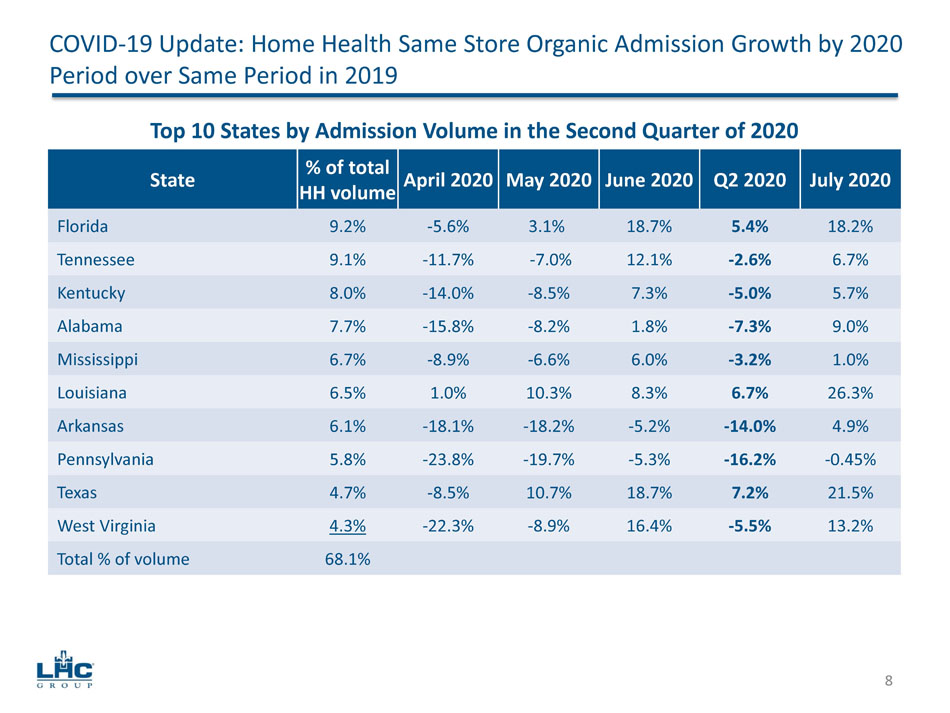
8 State % of total HH volume April 2020 May 2020 June 2020 Q2 2020 July 2020 Florida 9.2% - 5.6% 3.1% 18.7% 5.4% 18.2% Tennessee 9.1% - 11.7% - 7.0% 12.1% - 2.6% 6.7% Kentucky 8.0% - 14.0% - 8.5% 7.3% - 5.0% 5.7% Alabama 7.7% - 15.8% - 8.2% 1.8% - 7.3% 9.0% Mississippi 6.7% - 8.9% - 6.6% 6.0% - 3.2% 1.0% Louisiana 6.5% 1.0% 10.3% 8.3% 6.7% 26.3% Arkansas 6.1% - 18.1% - 18.2% - 5.2% - 14.0% 4.9% Pennsylvania 5.8% - 23.8% - 19.7% - 5.3% - 16.2% - 0.45% Texas 4.7% - 8.5% 10.7% 18.7% 7.2% 21.5% West Virginia 4.3% - 22.3% - 8.9% 16.4% - 5.5% 13.2% Total % of volume 68.1% COVID - 19 Update: Home Health Same Store Organic Admission Growth by 2020 Period over Same Period in 2019 Top 10 States by Admission Volume in the Second Quarter of 2020
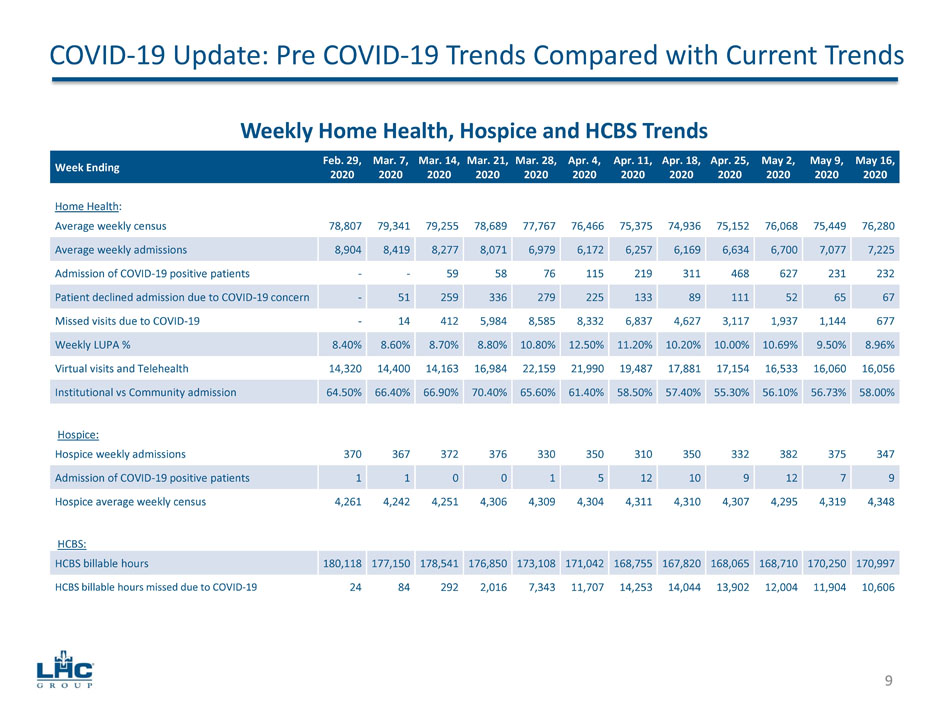
COVID - 19 Update: Pre COVID - 19 Trends Compared with Current Trends 9 Weekly Home Health, Hospice and HCBS Trends Week Ending Feb. 29, 2020 Mar. 7, 2020 Mar. 14, 2020 Mar. 21, 2020 Mar. 28, 2020 Apr. 4, 2020 Apr. 11, 2020 Apr. 18, 2020 Apr. 25, 2020 May 2, 2020 May 9, 2020 May 16, 2020 Home Health : Average weekly census 78,807 79,341 79,255 78,689 77,767 76,466 75,375 74,936 75,152 76,068 75,449 76,280 Average weekly admissions 8,904 8,419 8,277 8,071 6,979 6,172 6,257 6,169 6,634 6,700 7,077 7,225 Admission of COVID - 19 positive patients - - 59 58 76 115 219 311 468 627 231 232 Patient declined admission due to COVID - 19 concern - 51 259 336 279 225 133 89 111 52 65 67 Missed visits due to COVID - 19 - 14 412 5,984 8,585 8,332 6,837 4,627 3,117 1,937 1,144 677 Weekly LUPA % 8.40% 8.60% 8.70% 8.80% 10.80% 12.50% 11.20% 10.20% 10.00% 10.69% 9.50% 8.96% Virtual visits and Telehealth 14,320 14,400 14,163 16,984 22,159 21,990 19,487 17,881 17,154 16,533 16,060 16,056 Institutional vs Community admission 64.50% 66.40% 66.90% 70.40% 65.60% 61.40% 58.50% 57.40% 55.30% 56.10% 56.73% 58.00% Hospice: Hospice weekly admissions 370 367 372 376 330 350 310 350 332 382 375 347 Admission of COVID - 19 positive patients 1 1 0 0 1 5 12 10 9 12 7 9 Hospice average weekly census 4,261 4,242 4,251 4,306 4,309 4,304 4,311 4,310 4,307 4,295 4,319 4,348 HCBS: HCBS billable hours 180,118 177,150 178,541 176,850 173,108 171,042 168,755 167,820 168,065 168,710 170,250 170,997 HCBS billable hours missed due to COVID - 19 24 84 292 2,016 7,343 11,707 14,253 14,044 13,902 12,004 11,904 10,606
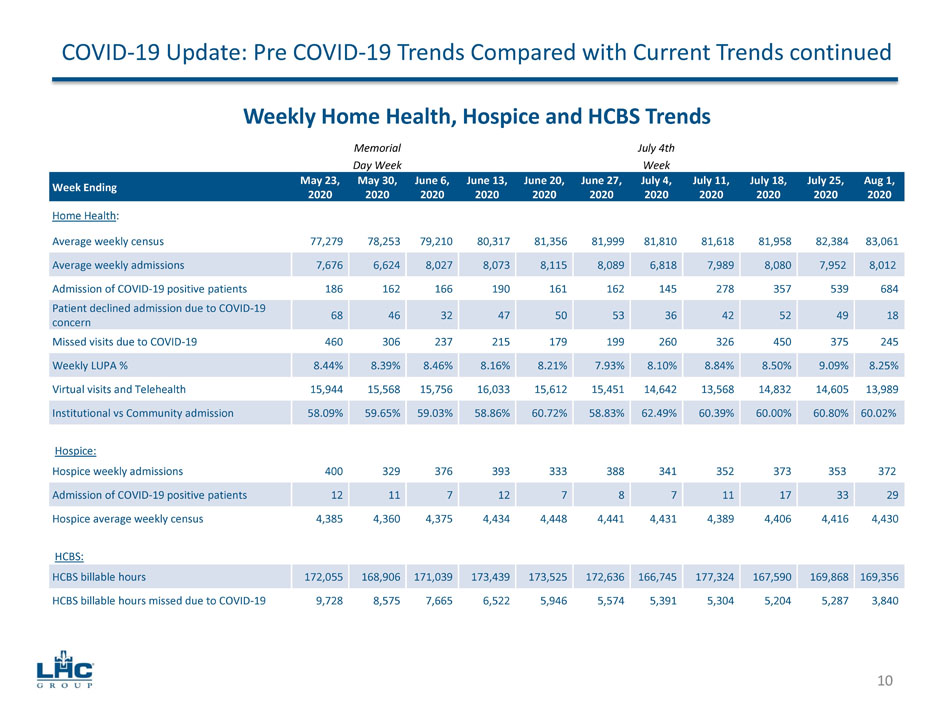
COVID - 19 Update: Pre COVID - 19 Trends Compared with Current Trends continued 10 Weekly Home Health, Hospice and HCBS Trends Memorial July 4th Day Week Week Week Ending May 23, 2020 May 30, 2020 June 6, 2020 June 13, 2020 June 20, 2020 June 27, 2020 July 4, 2020 July 11, 2020 July 18, 2020 July 25, 2020 Aug 1, 2020 Home Health : Average weekly census 77,279 78,253 79,210 80,317 81,356 81,999 81,810 81,618 81,958 82,384 83,061 Average weekly admissions 7,676 6,624 8,027 8,073 8,115 8,089 6,818 7,989 8,080 7,952 8,012 Admission of COVID - 19 positive patients 186 162 166 190 161 162 145 278 357 539 684 Patient declined admission due to COVID - 19 concern 68 46 32 47 50 53 36 42 52 49 18 Missed visits due to COVID - 19 460 306 237 215 179 199 260 326 450 375 245 Weekly LUPA % 8.44% 8.39% 8.46% 8.16% 8.21% 7.93% 8.10% 8.84% 8.50% 9.09% 8.25% Virtual visits and Telehealth 15,944 15,568 15,756 16,033 15,612 15,451 14,642 13,568 14,832 14,605 13,989 Institutional vs Community admission 58.09% 59.65% 59.03% 58.86% 60.72% 58.83% 62.49% 60.39% 60.00% 60.80% 60.02% Hospice: Hospice weekly admissions 400 329 376 393 333 388 341 352 373 353 372 Admission of COVID - 19 positive patients 12 11 7 12 7 8 7 11 17 33 29 Hospice average weekly census 4,385 4,360 4,375 4,434 4,448 4,441 4,431 4,389 4,406 4,416 4,430 HCBS: HCBS billable hours 172,055 168,906 171,039 173,439 173,525 172,636 166,745 177,324 167,590 169,868 169,356 HCBS billable hours missed due to COVID - 19 9,728 8,575 7,665 6,522 5,946 5,574 5,391 5,304 5,204 5,287 3,840
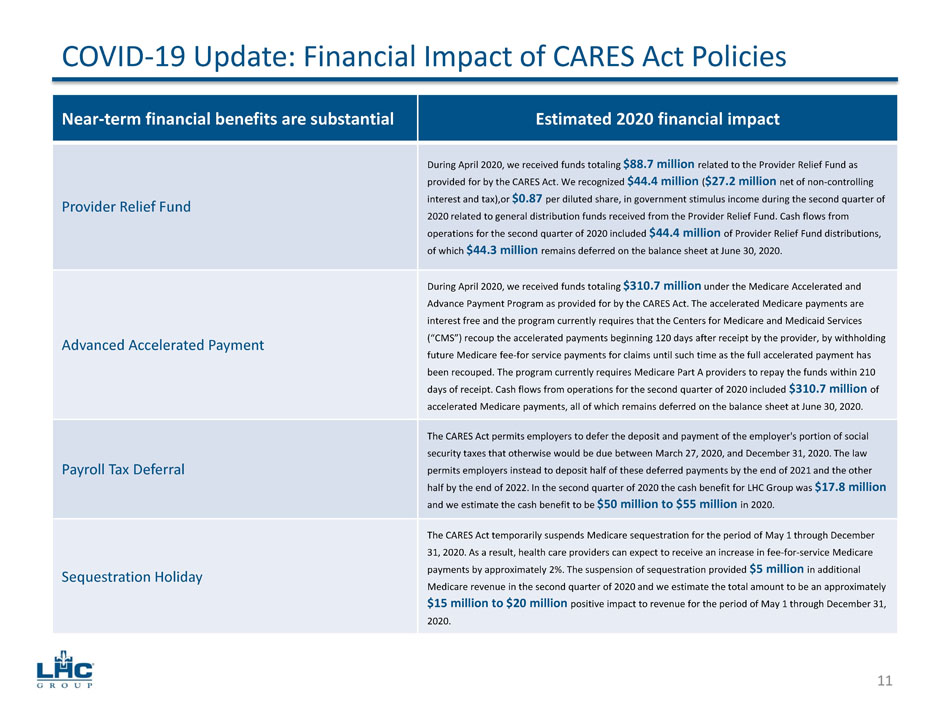
COVID - 19 Update: Financial Impact of CARES Act Policies 11 Near - term financial benefits are substantial Estimated 2020 financial impact Provider Relief Fund During April 2020, we received funds totaling $88.7 million related to the Provider Relief Fund as provided for by the CARES Act. We recognized $44.4 million ( $27.2 million net of non - controlling interest and tax),or $0.87 per diluted share, in government stimulus income during the second quarter of 2020 related to general distribution funds received from the Provider Relief Fund. Cash flows from operations for the second quarter of 2020 included $44.4 million of Provider Relief Fund distributions, of which $44.3 million remains deferred on the balance sheet at June 30, 2020. Advanced Accelerated Payment During April 2020, we received funds totaling $310.7 million under the Medicare Accelerated and Advance Payment Program as provided for by the CARES Act. The accelerated Medicare payments are interest free and the program currently requires that the Centers for Medicare and Medicaid Services (“CMS”) recoup the accelerated payments beginning 120 days after receipt by the provider, by withholding future Medicare fee - for service payments for claims until such time as the full accelerated payment has been recouped. The program currently requires Medicare Part A providers to repay the funds within 210 days of receipt. Cash flows from operations for the second quarter of 2020 included $310.7 million of accelerated Medicare payments, all of which remains deferred on the balance sheet at June 30, 2020. Payroll Tax Deferral The CARES Act permits employers to defer the deposit and payment of the employer's portion of social security taxes that otherwise would be due between March 27, 2020, and December 31, 2020. The law permits employers instead to deposit half of these deferred payments by the end of 2021 and the other half by the end of 2022. In the second quarter of 2020 the cash benefit for LHC Group was $17.8 million and w e estimate the cash benefit to be $50 million to $55 million in 2020. Sequestration Holiday The CARES Act temporarily suspends Medicare sequestration for the period of May 1 through December 31, 2020. As a result, health care providers can expect to receive an increase in fee - for - service Medicare payments by approximately 2%. The suspension of sequestration provided $5 million in additional Medicare revenue in the second quarter of 2020 and we estimate the total amount to be an approximately $15 million to $20 million positive impact to revenue for the period of May 1 through December 31, 2020 .
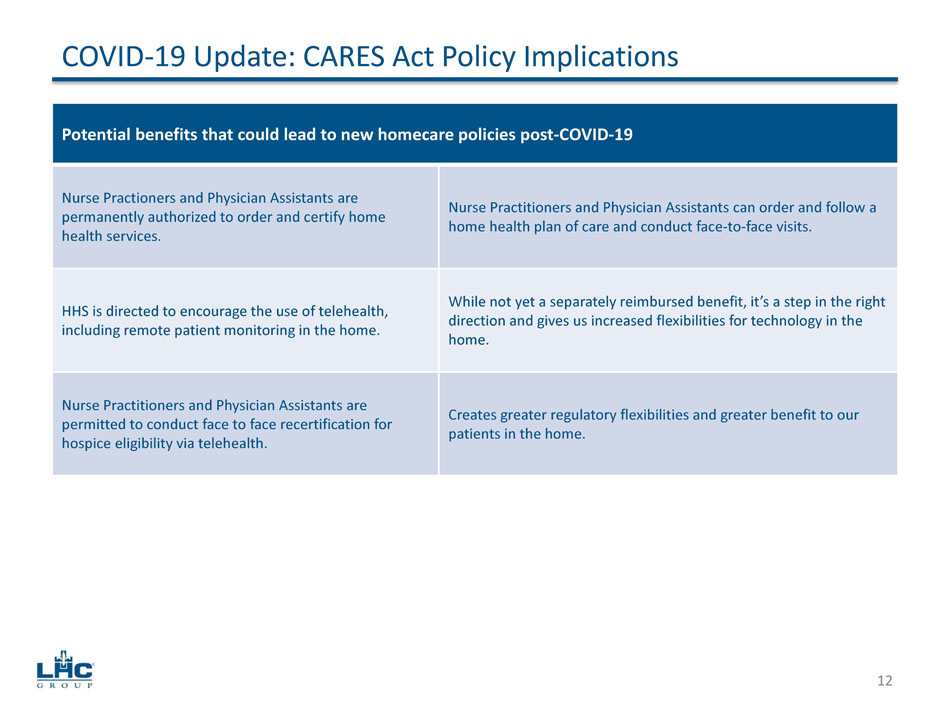
COVID - 19 Update: CARES Act Policy Implications 12 Potential benefits that could lead to new homecare policies post - COVID - 19 Nurse Practioners and Physician Assistants are permanently authorized to order and certify home health services. Nurse Practitioners and Physician Assistants can order and follow a home health plan of care and conduct face - to - face visits. HHS is directed to encourage the use of telehealth, including remote patient monitoring in the home. While not yet a separately reimbursed benefit, it’s a step in the right direction and gives us increased flexibilities for technology in the home. Nurse Practitioners and Physician Assistants are permitted to conduct face to face recertification for hospice eligibility via telehealth. Creates greater regulatory flexibilities and greater benefit to our patients in the home.

2020 Adjusted Consolidated Results Three months ended June 30 Six months ended June 30 Consolidated Total Adjustments Adjusted Consolidated Consolidated Total Adjustments Adjusted Consolidated Net service revenue $487,320 $0 $487,320 $1,000,191 $0 $1,000,191 Cost of service revenue 306,712 (21,245) 285,467 627,914 (21,555) 606,359 Gross margin 180,608 201,853 372,277 393,832 General and administrative expenses 150,574 (6,672) 143,902 308,440 (11,218) 297,222 Government stimulus income 44,435 (44,435) 0 44,435 (44,435) 0 Impairment of intangibles and other 600 (600) 0 600 (600) 0 Operating income (loss) $73,869 ($15,918) $57,951 $107,672 ($11,062) $96,610 Depreciation 5,252 0 5,252 10,385 0 10,385 Noncontrolling interests (13,109) 7,626 (5,483) (18,761) 7,626 (11,135) Earnings before interest, tax and depreciation (EBITDA less NCI) $66,012 ($8,292) $57,720 $99,296 ($3,436) $95,860 EBITDA less NCI as a percentage of revenue 13.5% 11.8% 9.9% 9.6% 13
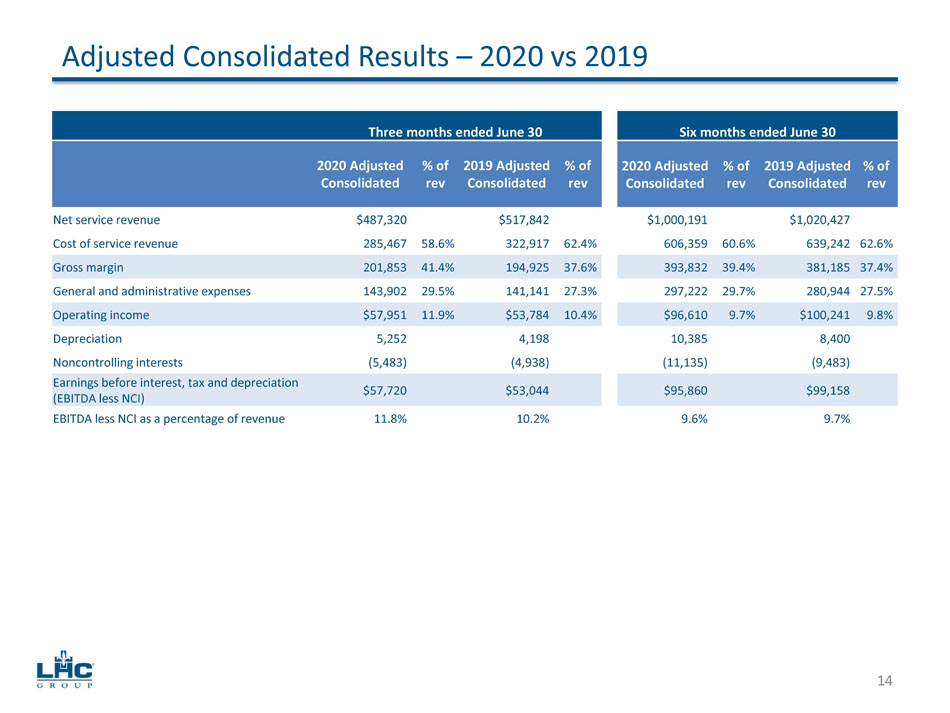
Adjusted Consolidated Results – 2020 vs 2019 Three months ended June 30 Six months ended June 30 2020 Adjusted Consolidated % of rev 2019 Adjusted Consolidated % of rev 2020 Adjusted Consolidated % of rev 2019 Adjusted Consolidated % of rev Net service revenue $487,320 $517,842 $1,000,191 $1,020,427 Cost of service revenue 285,467 58.6% 322,917 62.4% 606,359 60.6% 639,242 62.6% Gross margin 201,853 41.4% 194,925 37.6% 393,832 39.4% 381,185 37.4% General and administrative expenses 143,902 29.5% 141,141 27.3% 297,222 29.7% 280,944 27.5% Operating income $57,951 11.9% $53,784 10.4% $96,610 9.7% $100,241 9.8% Depreciation 5,252 4,198 10,385 8,400 Noncontrolling interests (5,483) (4,938) (11,135) (9,483) Earnings before interest, tax and depreciation (EBITDA less NCI) $57,720 $53,044 $95,860 $99,158 EBITDA less NCI as a percentage of revenue 11.8% 10.2% 9.6% 9.7% 14
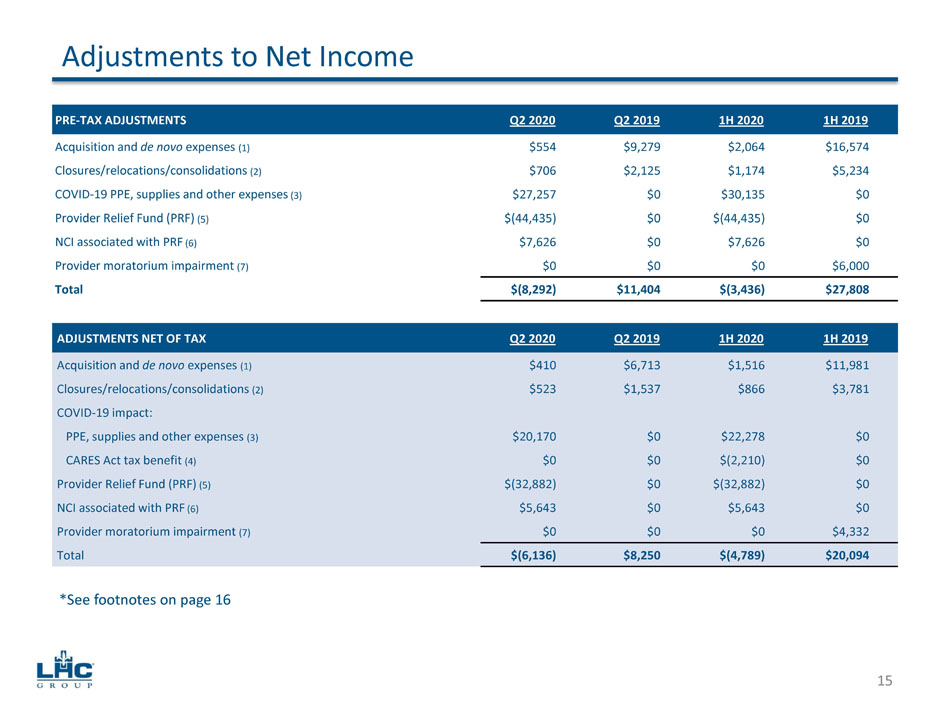
Adjustments to Net Income PRE - TAX ADJUSTMENTS Q2 2020 Q2 2019 1H 2020 1H 2019 Acquisition and de novo expenses (1) $554 $9,279 $2,064 $16,574 Closures/relocations/consolidations (2) $706 $2,125 $1,174 $5,234 COVID - 19 PPE, supplies and other expenses (3) $27,257 $0 $30,135 $0 Provider Relief Fund (PRF) (5) $(44,435) $0 $(44,435) $0 NCI associated with PRF (6) $7,626 $0 $7,626 $0 Provider moratorium impairment (7) $0 $0 $0 $6,000 Total $(8,292) $11,404 $(3,436) $27,808 ADJUSTMENTS NET OF TAX Q2 2020 Q2 2019 1H 2020 1H 2019 Acquisition and de novo expenses (1) $410 $6,713 $1,516 $11,981 Closures/relocations/consolidations (2) $523 $1,537 $866 $3,781 COVID - 19 impact: PPE, supplies and other expenses (3) $20,170 $0 $22,278 $0 CARES Act tax benefit (4) $0 $0 $(2,210) $0 Provider Relief Fund (PRF) (5) $(32,882) $0 $(32,882) $0 NCI associated with PRF (6) $5,643 $0 $5,643 $0 Provider moratorium impairment (7) $0 $0 $0 $4,332 Total $(6,136) $8,250 $(4,789) $20,094 15 *See footnotes on page 16
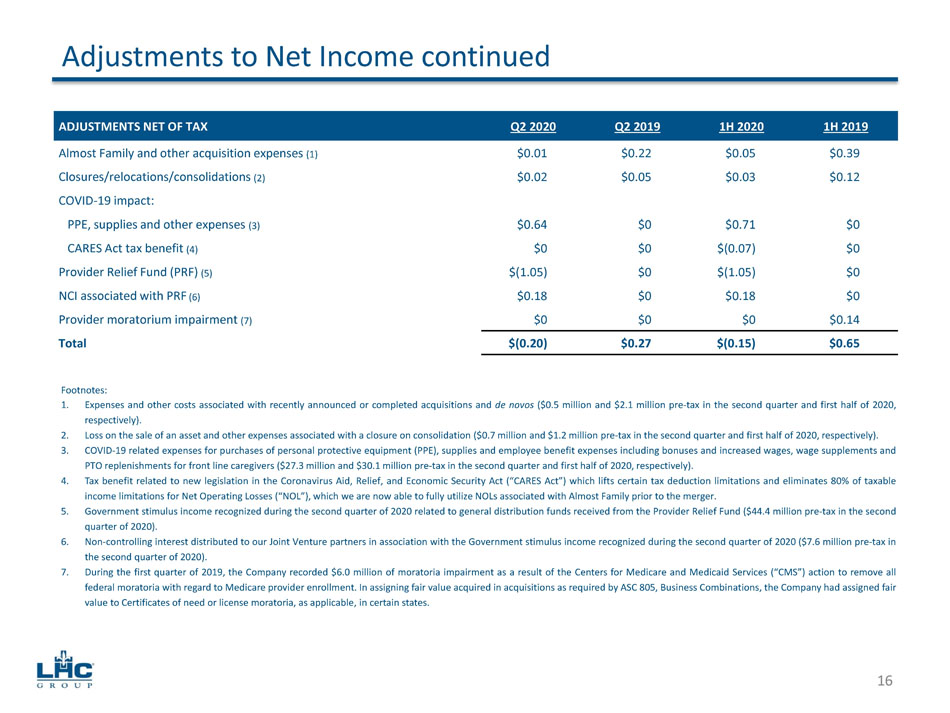
Footnotes: 1. Expenses and other costs associated with recently announced or completed acquisitions and de novos ( $ 0 . 5 million and $ 2 . 1 million pre - tax in the second quarter and first half of 2020 , respectively) . 2. Loss on the sale of an asset and other expenses associated with a closure on consolidation ( $ 0 . 7 million and $ 1 . 2 million pre - tax in the second quarter and first half of 2020 , respectively) . 3. COVID - 19 related expenses for purchases of personal protective equipment (PPE), supplies and employee benefit expenses including bonuses and increased wages, wage supplements and PTO replenishments for front line caregivers ( $ 27 . 3 million and $ 30 . 1 million pre - tax in the second quarter and first half of 2020 , respectively) . 4. Tax benefit related to new legislation in the Coronavirus Aid, Relief, and Economic Security Act (“CARES Act”) which lifts certain tax deduction limitations and eliminates 80 % of taxable income limitations for Net Operating Losses (“NOL”), which we are now able to fully utilize NOLs associated with Almost Family prior to the merger . 5. Government stimulus income recognized during the second quarter of 2020 related to general distribution funds received from the Provider Relief Fund ( $ 44 . 4 million pre - tax in the second quarter of 2020 ) . 6. Non - controlling interest distributed to our Joint Venture partners in association with the Government stimulus income recognized during the second quarter of 2020 ( $ 7 . 6 million pre - tax in the second quarter of 2020 ) . 7. During the first quarter of 2019 , the Company recorded $ 6 . 0 million of moratoria impairment as a result of the Centers for Medicare and Medicaid Services (“CMS”) action to remove all federal moratoria with regard to Medicare provider enrollment . In assigning fair value acquired in acquisitions as required by ASC 805 , Business Combinations, the Company had assigned fair value to Certificates of need or license moratoria, as applicable, in certain states . Adjustments to Net Income continued ADJUSTMENTS NET OF TAX Q2 2020 Q2 2019 1H 2020 1H 2019 Almost Family and other acquisition expenses (1) $0.01 $0.22 $0.05 $0.39 Closures/relocations/consolidations (2) $0.02 $0.05 $0.03 $0.12 COVID - 19 impact: PPE, supplies and other expenses (3) $0.64 $0 $0.71 $0 CARES Act tax benefit (4) $0 $0 $(0.07) $0 Provider Relief Fund (PRF) (5) $(1.05) $0 $(1.05) $0 NCI associated with PRF (6) $0.18 $0 $0.18 $0 Provider moratorium impairment (7) $0 $0 $0 $0.14 Total $(0.20) $0.27 $(0.15) $0.65 16
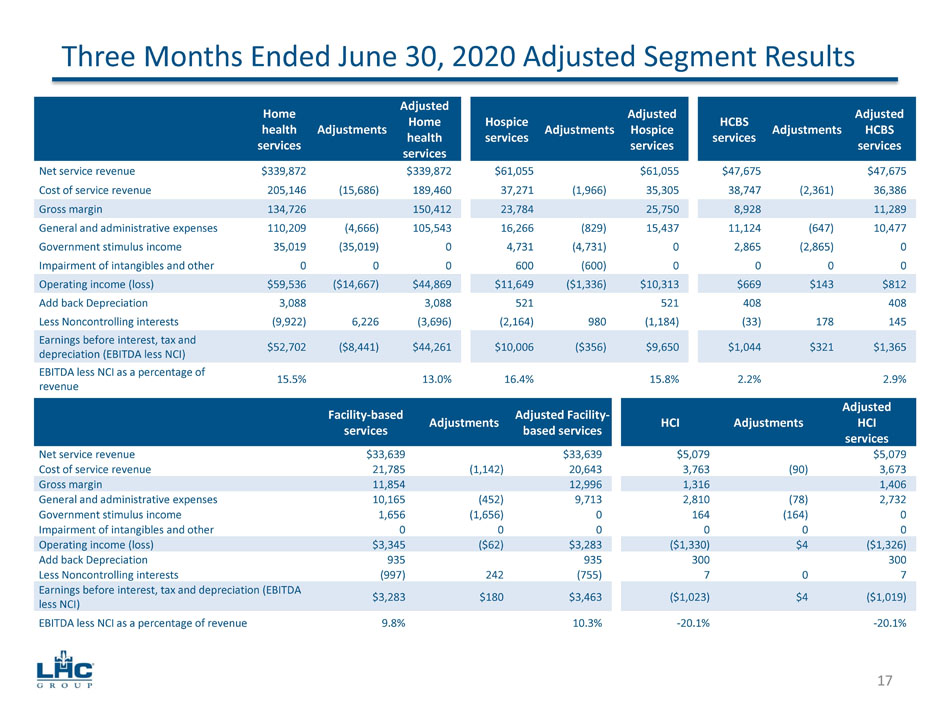
Three Months Ended June 30, 2020 Adjusted Segment Results Home health services Adjustments Adjusted Home health services Hospice services Adjustments Adjusted Hospice services HCBS services Adjustments Adjusted HCBS services Net service revenue $339,872 $339,872 $61,055 $61,055 $47,675 $47,675 Cost of service revenue 205,146 (15,686) 189,460 37,271 (1,966) 35,305 38,747 (2,361) 36,386 Gross margin 134,726 150,412 23,784 25,750 8,928 11,289 General and administrative expenses 110,209 (4,666) 105,543 16,266 (829) 15,437 11,124 (647) 10,477 Government stimulus income 35,019 (35,019) 0 4,731 (4,731) 0 2,865 (2,865) 0 Impairment of intangibles and other 0 0 0 600 (600) 0 0 0 0 Operating income (loss) $59,536 ($14,667) $44,869 $11,649 ($1,336) $10,313 $669 $143 $812 Add back Depreciation 3,088 3,088 521 521 408 408 Less Noncontrolling interests (9,922) 6,226 (3,696) (2,164) 980 (1,184) (33) 178 145 Earnings before interest, tax and depreciation (EBITDA less NCI) $52,702 ($8,441) $44,261 $10,006 ($356) $9,650 $1,044 $321 $1,365 EBITDA less NCI as a percentage of revenue 15.5% 13.0% 16.4% 15.8% 2.2% 2.9% Facility - based services Adjustments Adjusted Facility - based services HCI Adjustments Adjusted HCI services Net service revenue $33,639 $33,639 $5,079 $5,079 Cost of service revenue 21,785 (1,142) 20,643 3,763 (90) 3,673 Gross margin 11,854 12,996 1,316 1,406 General and administrative expenses 10,165 (452) 9,713 2,810 (78) 2,732 Government stimulus income 1,656 (1,656) 0 164 (164) 0 Impairment of intangibles and other 0 0 0 0 0 0 Operating income (loss) $3,345 ($62) $3,283 ($1,330) $4 ($1,326) Add back Depreciation 935 935 300 300 Less Noncontrolling interests (997) 242 (755) 7 0 7 Earnings before interest, tax and depreciation (EBITDA less NCI) $3,283 $180 $3,463 ($1,023) $4 ($1,019) EBITDA less NCI as a percentage of revenue 9.8% 10.3% - 20.1% - 20.1% 17
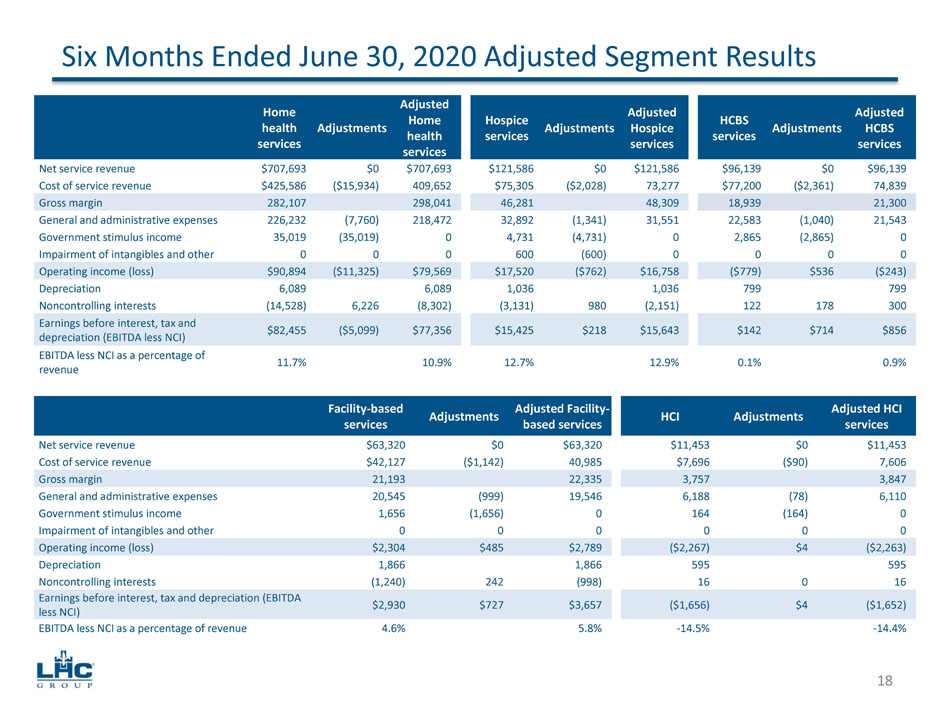
Six Months Ended June 30, 2020 Adjusted Segment Results Home health services Adjustments Adjusted Home health services Hospice services Adjustments Adjusted Hospice services HCBS services Adjustments Adjusted HCBS services Net service revenue $707,693 $0 $707,693 $121,586 $0 $121,586 $96,139 $0 $96,139 Cost of service revenue $425,586 ($15,934) 409,652 $75,305 ($2,028) 73,277 $77,200 ($2,361) 74,839 Gross margin 282,107 298,041 46,281 48,309 18,939 21,300 General and administrative expenses 226,232 (7,760) 218,472 32,892 (1,341) 31,551 22,583 (1,040) 21,543 Government stimulus income 35,019 (35,019) 0 4,731 (4,731) 0 2,865 (2,865) 0 Impairment of intangibles and other 0 0 0 600 (600) 0 0 0 0 Operating income (loss) $90,894 ($11,325) $79,569 $17,520 ($762) $16,758 ($779) $536 ($243) Depreciation 6,089 6,089 1,036 1,036 799 799 Noncontrolling interests (14,528) 6,226 (8,302) (3,131) 980 (2,151) 122 178 300 Earnings before interest, tax and depreciation (EBITDA less NCI) $82,455 ($5,099) $77,356 $15,425 $218 $15,643 $142 $714 $856 EBITDA less NCI as a percentage of revenue 11.7% 10.9% 12.7% 12.9% 0.1% 0.9% Facility - based services Adjustments Adjusted Facility - based services HCI Adjustments Adjusted HCI services Net service revenue $63,320 $0 $63,320 $11,453 $0 $11,453 Cost of service revenue $42,127 ($1,142) 40,985 $7,696 ($90) 7,606 Gross margin 21,193 22,335 3,757 3,847 General and administrative expenses 20,545 (999) 19,546 6,188 (78) 6,110 Government stimulus income 1,656 (1,656) 0 164 (164) 0 Impairment of intangibles and other 0 0 0 0 0 0 Operating income (loss) $2,304 $485 $2,789 ($2,267) $4 ($2,263) Depreciation 1,866 1,866 595 595 Noncontrolling interests (1,240) 242 (998) 16 0 16 Earnings before interest, tax and depreciation (EBITDA less NCI) $2,930 $727 $3,657 ($1,656) $4 ($1,652) EBITDA less NCI as a percentage of revenue 4.6% 5.8% - 14.5% - 14.4% 18
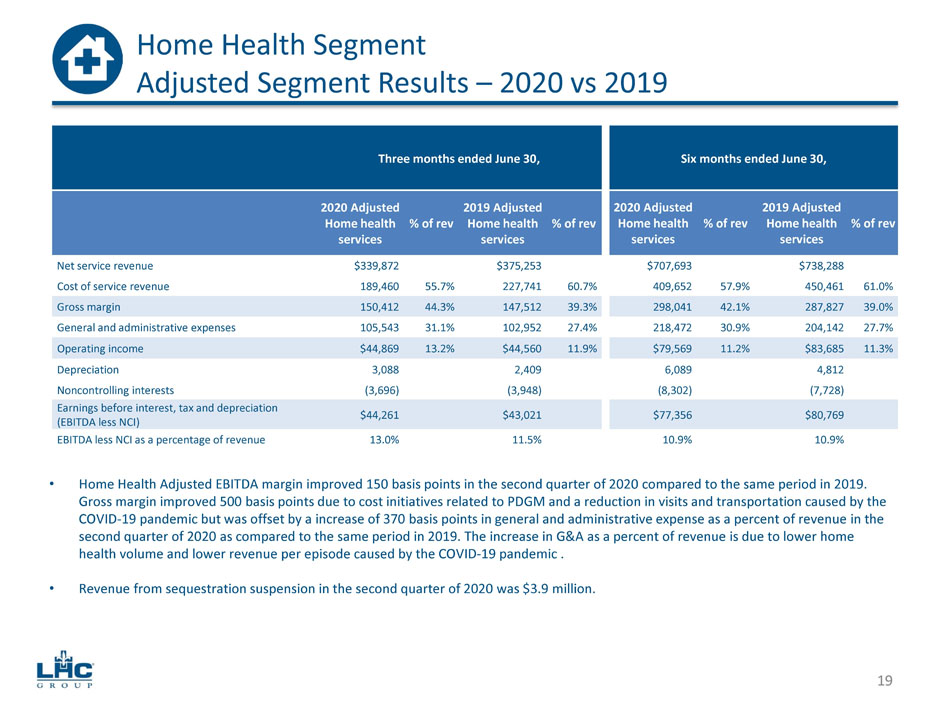
Three months ended June 30, Six months ended June 30, 2020 Adjusted Home health services % of rev 2019 Adjusted Home health services % of rev 2020 Adjusted Home health services % of rev 2019 Adjusted Home health services % of rev Net service revenue $339,872 $375,253 $707,693 $738,288 Cost of service revenue 189,460 55.7% 227,741 60.7% 409,652 57.9% 450,461 61.0% Gross margin 150,412 44.3% 147,512 39.3% 298,041 42.1% 287,827 39.0% General and administrative expenses 105,543 31.1% 102,952 27.4% 218,472 30.9% 204,142 27.7% Operating income $44,869 13.2% $44,560 11.9% $79,569 11.2% $83,685 11.3% Depreciation 3,088 2,409 6,089 4,812 Noncontrolling interests (3,696) (3,948) (8,302) (7,728) Earnings before interest, tax and depreciation (EBITDA less NCI) $44,261 $43,021 $77,356 $80,769 EBITDA less NCI as a percentage of revenue 13.0% 11.5% 10.9% 10.9% • Home Health Adjusted EBITDA margin improved 150 basis points in the second quarter of 2020 compared to the same period in 201 9. Gross margin improved 500 basis points due to cost initiatives related to PDGM and a reduction in visits and transportation c aus ed by the COVID - 19 pandemic but was offset by a increase of 370 basis points in general and administrative expense as a percent of revenue in the second quarter of 2020 as compared to the same period in 2019. The increase in G&A as a percent of revenue is due to lower ho me health volume and lower revenue per episode caused by the COVID - 19 pandemic . • Revenue from sequestration suspension in the second quarter of 2020 was $3.9 million. 19 Home Health Segment Adjusted Segment Results – 2020 vs 2019
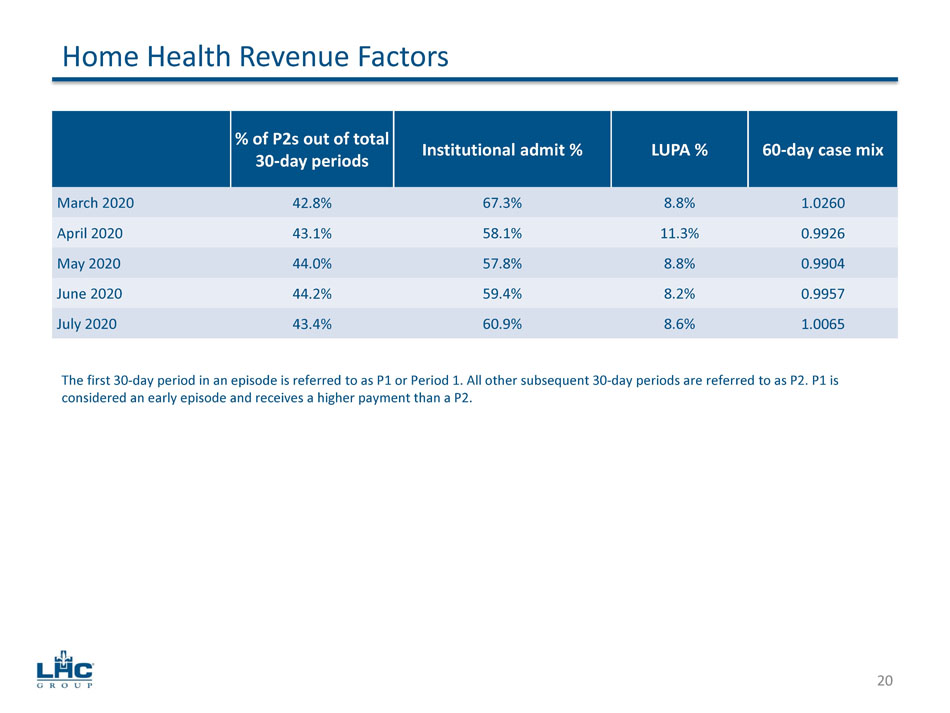
20 % of P2s out of total 30 - day periods Institutional admit % LUPA % 60 - day case mix March 2020 42.8% 67.3% 8.8% 1.0260 April 2020 43.1% 58.1% 11.3% 0.9926 May 2020 44.0% 57.8% 8.8% 0.9904 June 2020 44.2% 59.4% 8.2% 0.9957 July 2020 43.4% 60.9% 8.6% 1.0065 Home Health Revenue Factors The first 30 - day period in an episode is referred to as P1 or Period 1. All other subsequent 30 - day periods are referred to as P 2. P1 is considered an early episode and receives a higher payment than a P2.
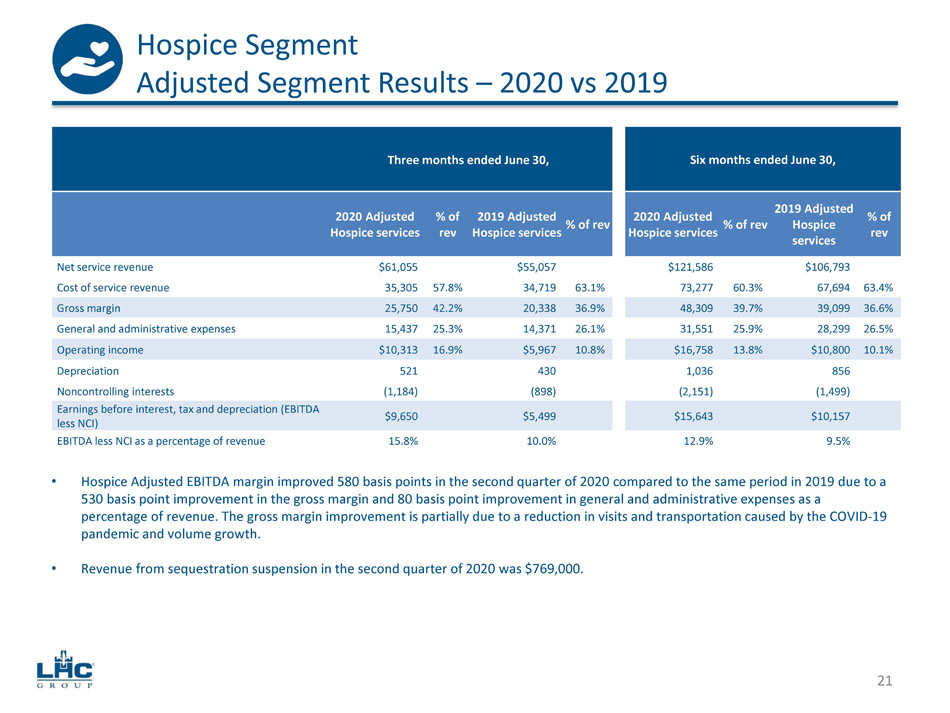
Three months ended June 30, Six months ended June 30, 2020 Adjusted Hospice services % of rev 2019 Adjusted Hospice services % of rev 2020 Adjusted Hospice services % of rev 2019 Adjusted Hospice services % of rev Net service revenue $61,055 $55,057 $121,586 $106,793 Cost of service revenue 35,305 57.8% 34,719 63.1% 73,277 60.3% 67,694 63.4% Gross margin 25,750 42.2% 20,338 36.9% 48,309 39.7% 39,099 36.6% General and administrative expenses 15,437 25.3% 14,371 26.1% 31,551 25.9% 28,299 26.5% Operating income $10,313 16.9% $5,967 10.8% $16,758 13.8% $10,800 10.1% Depreciation 521 430 1,036 856 Noncontrolling interests (1,184) (898) (2,151) (1,499) Earnings before interest, tax and depreciation (EBITDA less NCI) $9,650 $5,499 $15,643 $10,157 EBITDA less NCI as a percentage of revenue 15.8% 10.0% 12.9% 9.5% • Hospice Adjusted EBITDA margin improved 580 basis points in the second quarter of 2020 compared to the same period in 2019 du e t o a 530 basis point improvement in the gross margin and 80 basis point improvement in general and administrative expenses as a percentage of revenue. The gross margin improvement is partially due to a reduction in visits and transportation caused by th e C OVID - 19 pandemic and volume growth. • Revenue from sequestration suspension in the second quarter of 2020 was $769,000. 21 Hospice Segment Adjusted Segment Results – 2020 vs 2019
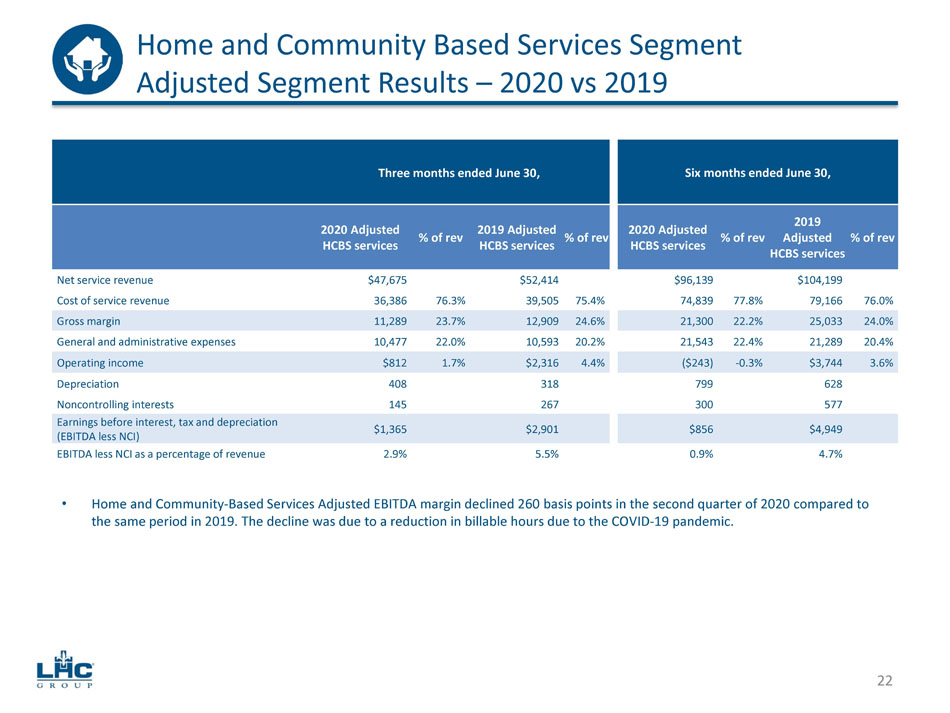
Three months ended June 30, Six months ended June 30, 2020 Adjusted HCBS services % of rev 2019 Adjusted HCBS services % of rev 2020 Adjusted HCBS services % of rev 2019 Adjusted HCBS services % of rev Net service revenue $47,675 $52,414 $96,139 $104,199 Cost of service revenue 36,386 76.3% 39,505 75.4% 74,839 77.8% 79,166 76.0% Gross margin 11,289 23.7% 12,909 24.6% 21,300 22.2% 25,033 24.0% General and administrative expenses 10,477 22.0% 10,593 20.2% 21,543 22.4% 21,289 20.4% Operating income $812 1.7% $2,316 4.4% ($243) - 0.3% $3,744 3.6% Depreciation 408 318 799 628 Noncontrolling interests 145 267 300 577 Earnings before interest, tax and depreciation (EBITDA less NCI) $1,365 $2,901 $856 $4,949 EBITDA less NCI as a percentage of revenue 2.9% 5.5% 0.9% 4.7% • Home and Community - Based Services Adjusted EBITDA margin declined 260 basis points in the second quarter of 2020 compared to the same period in 2019. The decline was due to a reduction in billable hours due to the COVID - 19 pandemic. 22 Home and Community Based Services Segment Adjusted Segment Results – 2020 vs 2019
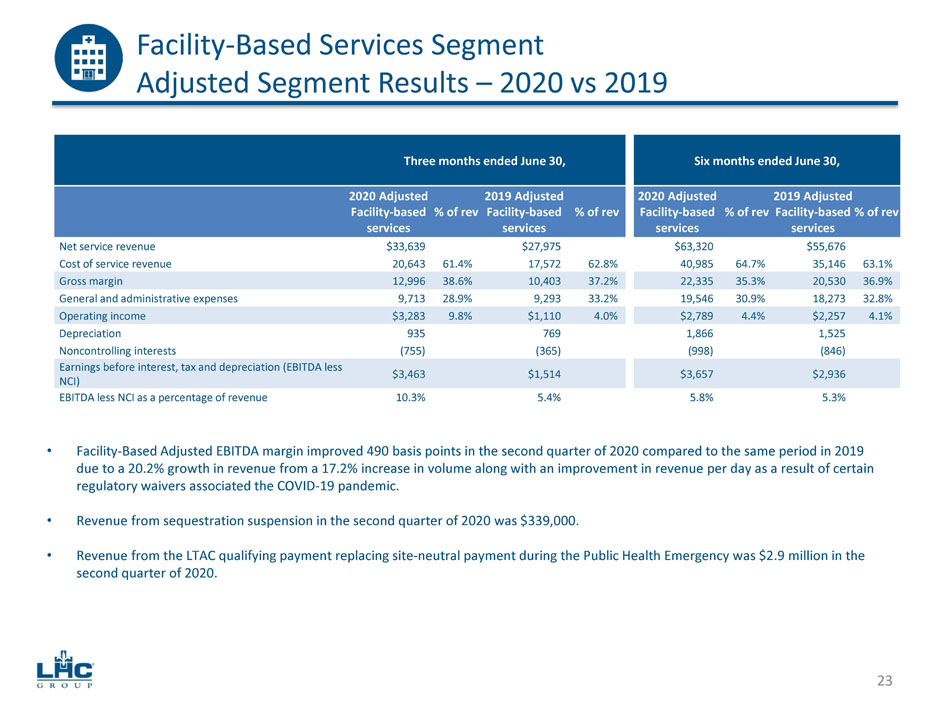
Facility - Based Services Segment Adjusted Segment Results – 2020 vs 2019 Three months ended June 30, Six months ended June 30, 2020 Adjusted Facility - based services % of rev 2019 Adjusted Facility - based services % of rev 2020 Adjusted Facility - based services % of rev 2019 Adjusted Facility - based services % of rev Net service revenue $33,639 $27,975 $63,320 $55,676 Cost of service revenue 20,643 61.4% 17,572 62.8% 40,985 64.7% 35,146 63.1% Gross margin 12,996 38.6% 10,403 37.2% 22,335 35.3% 20,530 36.9% General and administrative expenses 9,713 28.9% 9,293 33.2% 19,546 30.9% 18,273 32.8% Operating income $3,283 9.8% $1,110 4.0% $2,789 4.4% $2,257 4.1% Depreciation 935 769 1,866 1,525 Noncontrolling interests (755) (365) (998) (846) Earnings before interest, tax and depreciation (EBITDA less NCI) $3,463 $1,514 $3,657 $2,936 EBITDA less NCI as a percentage of revenue 10.3% 5.4% 5.8% 5.3% 23 • Facility - Based Adjusted EBITDA margin improved 490 basis points in the second quarter of 2020 compared to the same period in 201 9 due to a 20.2% growth in revenue from a 17.2% increase in volume along with an improvement in revenue per day as a result of cer tain regulatory waivers associated the COVID - 19 pandemic. • Revenue from sequestration suspension in the second quarter of 2020 was $339,000. • Revenue from the LTAC qualifying payment replacing site - neutral payment during the Public Health Emergency was $2.9 million in t he second quarter of 2020.
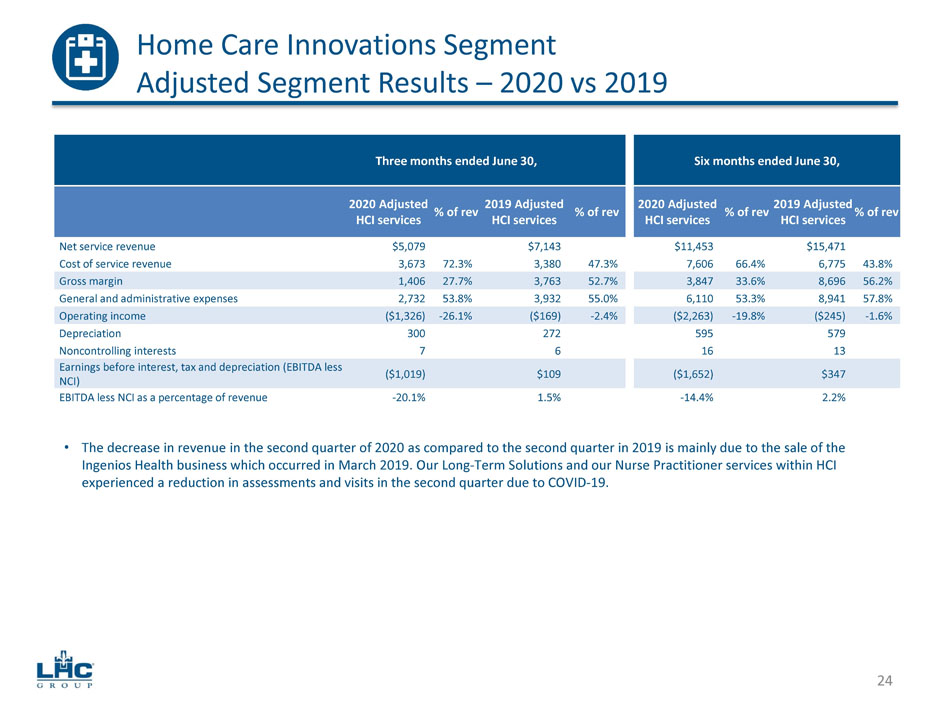
Home Care Innovations Segment Adjusted Segment Results – 2020 vs 2019 Three months ended June 30, Six months ended June 30, 2020 Adjusted HCI services % of rev 2019 Adjusted HCI services % of rev 2020 Adjusted HCI services % of rev 2019 Adjusted HCI services % of rev Net service revenue $5,079 $7,143 $11,453 $15,471 Cost of service revenue 3,673 72.3% 3,380 47.3% 7,606 66.4% 6,775 43.8% Gross margin 1,406 27.7% 3,763 52.7% 3,847 33.6% 8,696 56.2% General and administrative expenses 2,732 53.8% 3,932 55.0% 6,110 53.3% 8,941 57.8% Operating income ($1,326) - 26.1% ($169) - 2.4% ($2,263) - 19.8% ($245) - 1.6% Depreciation 300 272 595 579 Noncontrolling interests 7 6 16 13 Earnings before interest, tax and depreciation (EBITDA less NCI) ($1,019) $109 ($1,652) $347 EBITDA less NCI as a percentage of revenue - 20.1% 1.5% - 14.4% 2.2% 24 • The decrease in revenue in the second quarter of 2020 as compared to the second quarter in 2019 is mainly due to the sale of the Ingenios Health business which occurred in March 2019. Our Long - Term Solutions and our Nurse Practitioner services within HCI experienced a reduction in assessments and visits in the second quarter due to COVID - 19.
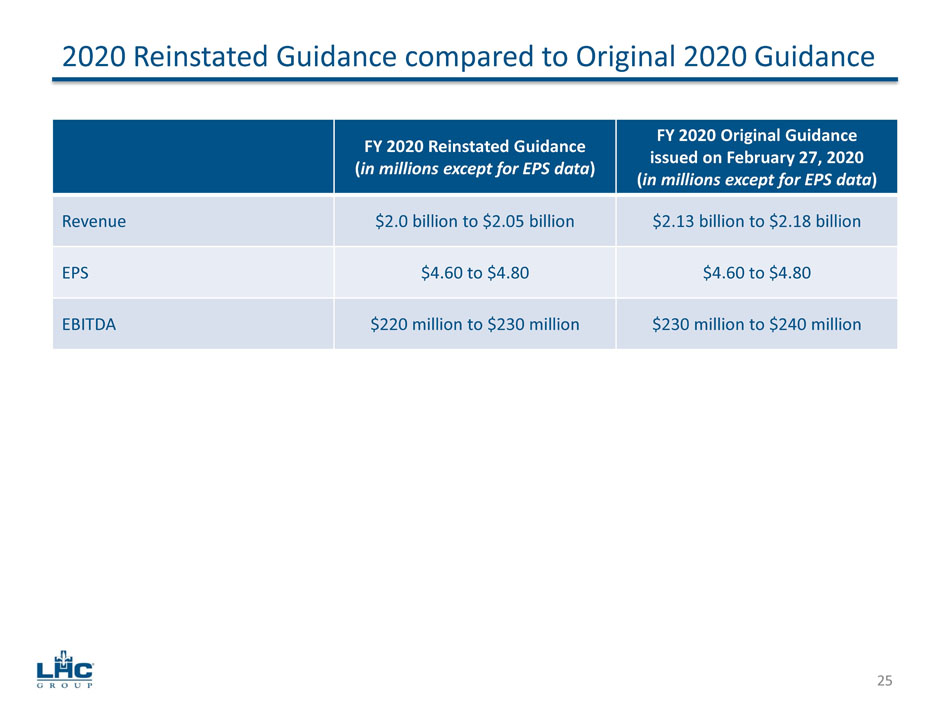
2020 Reinstated Guidance compared to Original 2020 Guidance FY 2020 Reinstated Guidance ( in millions except for EPS data ) FY 2020 Original Guidance issued on February 27, 2020 ( in millions except for EPS data ) Revenue $2.0 billion to $2.05 billion $2.13 billion to $2.18 billion EPS $4.60 to $4.80 $4.60 to $4.80 EBITDA $220 million to $230 million $230 million to $240 million 25
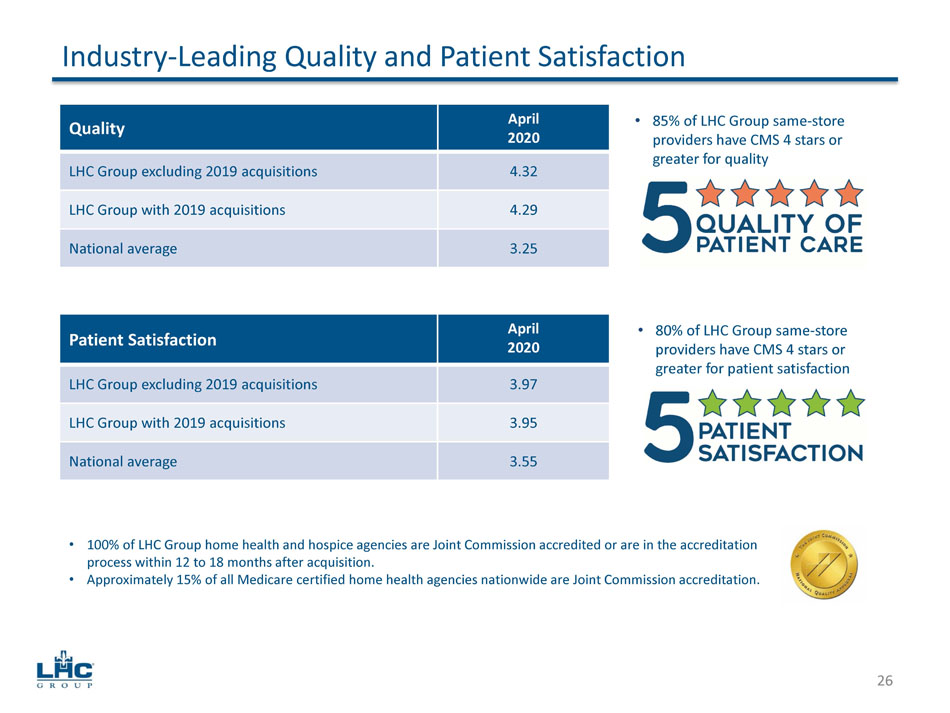
Industry - Leading Quality and Patient Satisfaction • 85% of LHC Group same - store providers have CMS 4 stars or greater for quality 26 Quality April 2020 LHC Group excluding 2019 acquisitions 4.32 LHC Group with 2019 acquisitions 4.29 National average 3.25 Patient Satisfaction April 2020 LHC Group excluding 2019 acquisitions 3.97 LHC Group with 2019 acquisitions 3.95 National average 3.55 • 100% of LHC Group home health and hospice agencies are Joint Commission accredited or are in the accreditation process within 12 to 18 months after acquisition. • Approximately 15% of all Medicare certified home health agencies nationwide are Joint Commission accreditation. • 80% of LHC Group same - store providers have CMS 4 stars or greater for patient satisfaction
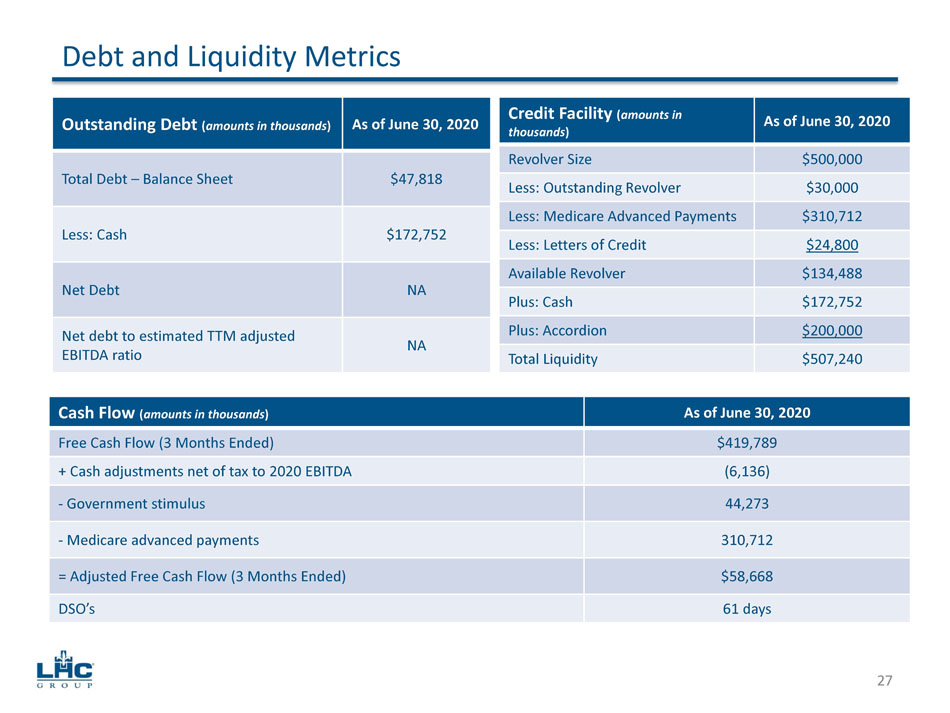
Debt and Liquidity Metrics Outstanding Debt ( amounts in thousands ) As of June 30, 2020 Total Debt – Balance Sheet $47,818 Less: Cash $172,752 Net Debt NA Net debt to estimated TTM adjusted EBITDA ratio NA Credit Facility ( amounts in thousands ) As of June 30, 2020 Revolver Size $500,000 Less: Outstanding Revolver $30,000 Less: Medicare Advanced Payments $310,712 Less: Letters of Credit $24,800 Available Revolver $134,488 Plus: Cash $172,752 Plus: Accordion $200,000 Total Liquidity $507,240 Cash Flow ( amounts in thousands ) As of June 30, 2020 Free Cash Flow (3 Months Ended) $419,789 + Cash adjustments net of tax to 2020 EBITDA (6,136) - Government stimulus 44,273 - Medicare advanced payments 310,712 = Adjusted Free Cash Flow (3 Months Ended) $58,668 DSO’s 61 days 27
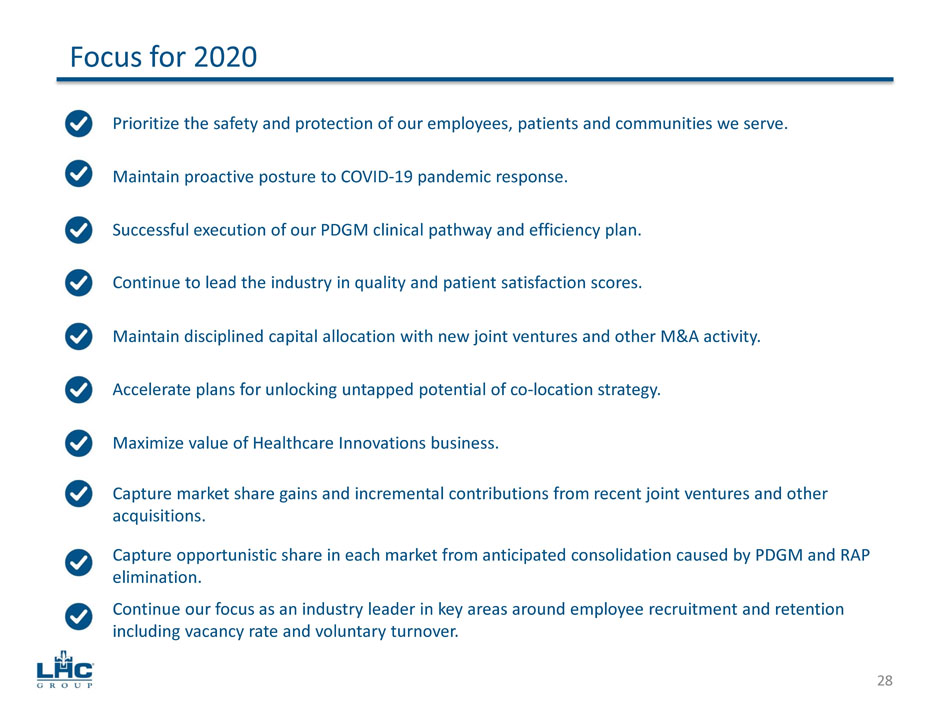
Focus for 2020 28 Successful execution of our PDGM clinical pathway and efficiency plan. Maintain disciplined capital allocation with new joint ventures and other M&A activity. Accelerate plans for unlocking untapped potential of co - location strategy. Maximize value of Healthcare Innovations business. Maintain proactive posture to COVID - 19 pandemic response. Continue to lead the industry in quality and patient satisfaction scores. Capture market share gains and incremental contributions from recent joint ventures and other acquisitions. Capture opportunistic share in each market from anticipated consolidation caused by PDGM and RAP elimination. Continue our focus as an industry leader in key areas around employee recruitment and retention including vacancy rate and voluntary turnover. Prioritize the safety and protection of our employees, patients and communities we serve.
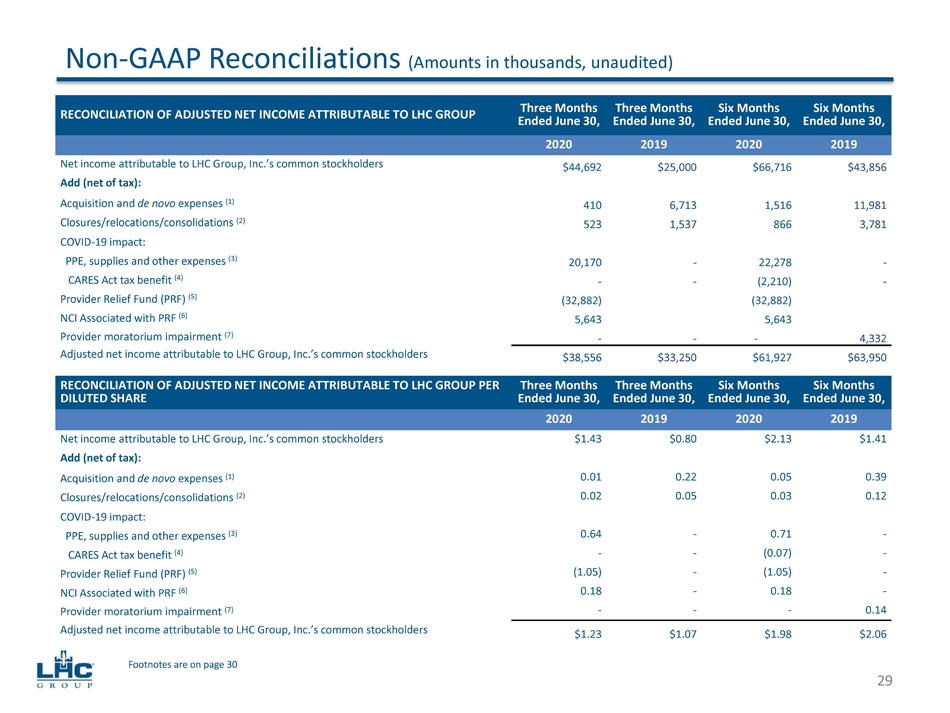
Non - GAAP Reconciliations (Amounts in thousands, unaudited) RECONCILIATION OF ADJUSTED NET INCOME ATTRIBUTABLE TO LHC GROUP Three Months Ended June 30, Three Months Ended June 30, Six Months Ended June 30, Six Months Ended June 30, 2020 2019 2020 2019 Net income attributable to LHC Group, Inc.’s common stockholders $44,692 $25,000 $66,716 $43,856 Add (net of tax): Acquisition and de novo expenses (1) 410 6,713 1,516 11,981 Closures/relocations/consolidations (2) 523 1,537 866 3,781 COVID - 19 impact: PPE, supplies and other expenses (3) 20,170 - 22,278 - CARES Act tax benefit (4) - - (2,210) - Provider Relief Fund (PRF) (5) (32,882) (32,882) NCI Associated with PRF (6) 5,643 5,643 Provider moratorium impairment (7) - - - 4,332 Adjusted net income attributable to LHC Group, Inc.’s common stockholders $38,556 $33,250 $61,927 $63,950 29 Footnotes are on page 30 RECONCILIATION OF ADJUSTED NET INCOME ATTRIBUTABLE TO LHC GROUP PER DILUTED SHARE Three Months Ended June 30, Three Months Ended June 30, Six Months Ended June 30, Six Months Ended June 30, 2020 2019 2020 2019 Net income attributable to LHC Group, Inc.’s common stockholders $1.43 $0.80 $2.13 $1.41 Add (net of tax): Acquisition and de novo expenses (1) 0.01 0.22 0.05 0.39 Closures/relocations/consolidations (2) 0.02 0.05 0.03 0.12 COVID - 19 impact: PPE, supplies and other expenses (3) 0.64 - 0.71 - CARES Act tax benefit (4) - - (0.07) - Provider Relief Fund (PRF) (5) (1.05) - (1.05) - NCI Associated with PRF (6) 0.18 - 0.18 - Provider moratorium impairment (7) - - - 0.14 Adjusted net income attributable to LHC Group, Inc.’s common stockholders $1.23 $1.07 $1.98 $2.06
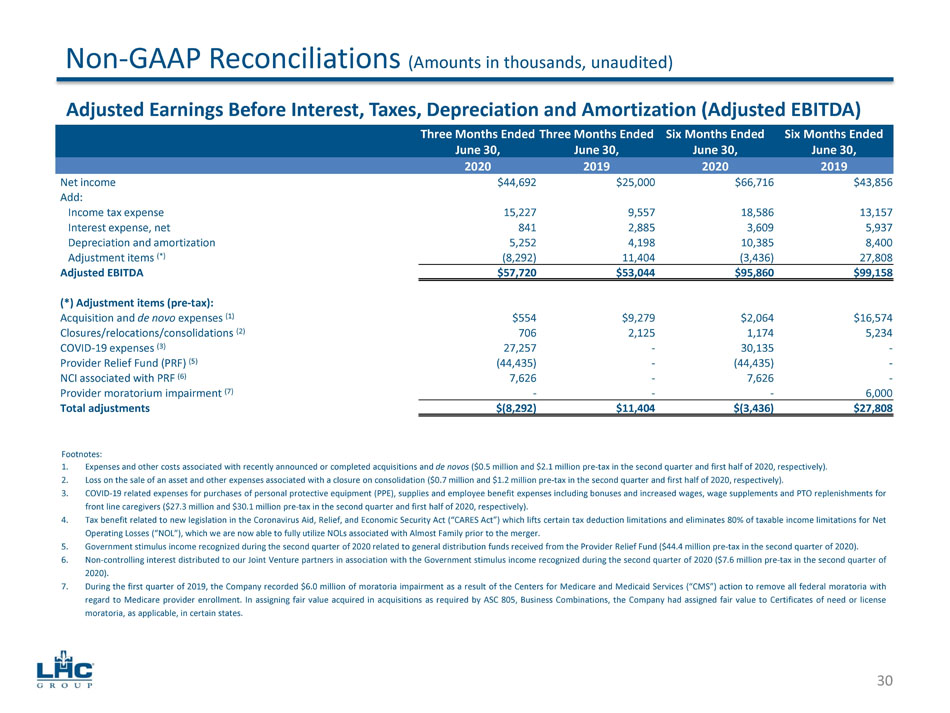
Three Months Ended June 30, Three Months Ended June 30, Six Months Ended June 30, Six Months Ended June 30, 2020 2019 2020 2019 Net income $44,692 $25,000 $66,716 $43,856 Add: Income tax expense 15,227 9,557 18,586 13,157 Interest expense, net 841 2,885 3,609 5,937 Depreciation and amortization 5,252 4,198 10,385 8,400 Adjustment items (*) (8,292) 11,404 (3,436) 27,808 Adjusted EBITDA $57,720 $53,044 $95,860 $99,158 (*) Adjustment items (pre - tax): Acquisition and de novo expenses (1) $554 $9,279 $2,064 $16,574 Closures/relocations/consolidations (2) 706 2,125 1,174 5,234 COVID - 19 expenses (3) 27,257 - 30,135 - Provider Relief Fund (PRF) (5) (44,435) - (44,435) - NCI associated with PRF (6) 7,626 - 7,626 - Provider moratorium impairment (7) - - - 6,000 Total adjustments $(8,292) $11,404 $(3,436) $27,808 Non - GAAP Reconciliations (Amounts in thousands, unaudited) 30 Adjusted Earnings Before Interest, Taxes, Depreciation and Amortization (Adjusted EBITDA) Footnotes: 1. Expenses and other costs associated with recently announced or completed acquisitions and de novos ( $ 0 . 5 million and $ 2 . 1 million pre - tax in the second quarter and first half of 2020 , respectively) . 2. Loss on the sale of an asset and other expenses associated with a closure on consolidation ( $ 0 . 7 million and $ 1 . 2 million pre - tax in the second quarter and first half of 2020 , respectively) . 3. COVID - 19 related expenses for purchases of personal protective equipment (PPE), supplies and employee benefit expenses including bonuses and increased wages, wage supplements and PTO replenishments for front line caregivers ( $ 27 . 3 million and $ 30 . 1 million pre - tax in the second quarter and first half of 2020 , respectively) . 4. Tax benefit related to new legislation in the Coronavirus Aid, Relief, and Economic Security Act (“CARES Act”) which lifts certain tax deduction limitations and eliminates 80 % of taxable income limitations for Net Operating Losses (“NOL”), which we are now able to fully utilize NOLs associated with Almost Family prior to the merger . 5. Government stimulus income recognized during the second quarter of 2020 related to general distribution funds received from the Provider Relief Fund ( $ 44 . 4 million pre - tax in the second quarter of 2020 ) . 6. Non - controlling interest distributed to our Joint Venture partners in association with the Government stimulus income recognized during the second quarter of 2020 ( $ 7 . 6 million pre - tax in the second quarter of 2020 ) . 7. During the first quarter of 2019 , the Company recorded $ 6 . 0 million of moratoria impairment as a result of the Centers for Medicare and Medicaid Services (“CMS”) action to remove all federal moratoria with regard to Medicare provider enrollment . In assigning fair value acquired in acquisitions as required by ASC 805 , Business Combinations, the Company had assigned fair value to Certificates of need or license moratoria, as applicable, in certain states .