Supplemental Financial Information Second Quarter Ended June 30, 2021 August 4, 2021 1 Exhibit 99.2

FORWARD-LOOKING STATEMENTS This presentation contains “forward-looking statements” (as defined in the Securities Litigation Reform Act of 1995) regarding, among other things, future events or the future financial performance of the Company. Words such as “anticipate,” “expect,” “project,” “intend,” “believe,” “will,” “estimate,” “may,” “could,” “should,” “outlook,” and “guidance” and words and terms of similar substance used in connection with any discussion of future plans, actions, events or results identify forward-looking statements. Forward-looking statements are based on information currently available to the Company and involve estimates, expectations and projections. Investors are cautioned that all such forward-looking statements are subject to risks and uncertainties that could cause actual events or results to differ materially from the events or results described in the forward-looking statements, including, but not limited to, the risks and uncertainties related to the COVID-19 pandemic and those otherwise described in our filings with the Securities and Exchange Commission, including our most recent Annual Report on Form 10-K and subsequent Quarterly Reports on Form 10-Q and Current Reports on Form 8-K. Many of these risks, uncertainties and assumptions are beyond the Company’s ability to control or predict. Because of these risks, uncertainties and assumptions, investors should not place undue reliance on these forward-looking statements. Non-GAAP Financial Information This presentation includes certain financial measures that were not prepared in accordance with U.S. generally accepted accounting principles (“GAAP”), including EBITDA and Adjusted EBITDA. The company uses these non-GAAP financial measures in operating its business because management believes they are less susceptible to variances in actual operating performance that can result from the excluded items. The company presents these financial measures to investors because they believe they are useful to investors in evaluating the primary factors that drive the company's operating performance. The items excluded from these non-GAAP measures are important in understanding LHC Group’s financial performance, and any non-GAAP measures presented should not be considered in isolation of, or as an alternative to, GAAP financial measures. Since these non-GAAP financial measures are not measures determined in accordance with GAAP, have no standardized meaning prescribed by GAAP and are susceptible to varying calculations, these measures, as presented, may not be comparable to other similarly titled measures of other companies. EBITDA of LHC Group is defined as net income (loss) before income tax benefit (expense), interest expense, and depreciation and amortization expense. Adjusted EBITDA of LHC Group is defined as net income (loss) before income tax expense benefit (expense), depreciation and amortization expense, and transaction costs related to previous transactions. Please visit the Investors section on our website at Investor.LHCgroup.com for additional information on LHC Group and the industry. Nasdaq: LHCG 2
TABLE OF CONTENTS Overview & Policy Tailwinds 4 - 11 Differentiated Strategies 12 - 22 2021 Consolidated Results Segment Results Guidance, Liquidity & Outlook Appendix LHC Group Overview Commentary on Q2 2021 Choose Home Care Act of 2021 Polling Data Supports At Home Care Third-Party Research Validates At Home Care Support At Home Care Policy Tailwinds Differentiated Strategy Leading to Quality Growth Multiple Organic and Inorganic Growth Levers Building Blocks of Long-Term Earnings Growth Recruiting and Retention Sequential Operational Trends Home Health and Hospice Growth Industry-Leading Quality and Patient Satisfaction Doubling of M&A Activity Drives Increased Revenue Target HCI Segment Supports Advanced Care@Home Programs Hospital Partnerships are at the Core of LHC Group and SCP Health 23 - 27 2021 Adjusted Consolidated Results Adjusted Consolidated Results – 2021 vs 2020 Adjustments to Net Income 28 - 35 Three and Six Months Ended June 30, 2021 Home Health Home Health Revenue Factors Hospice Home and Community Based Services Facility-Based Services Health Care Innovations 36 - 39 Full Year 2021 Guidance Debt and Liquidity Metrics Focus for 2021 40 - 55 Non-GAAP Reconciliations CHOOSE HOME CARE ACT OF 2021 – SECTION BY SECTION CHOOSE HOME CARE ACT OF 2021 SAVINGS – DOBSON DAVANZO ESTIMATE 3

OVERVIEW & POLICY TAILWINDS 4
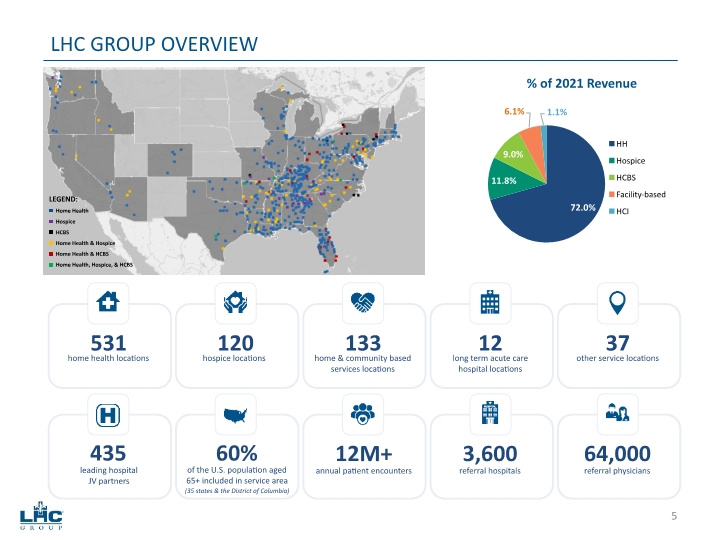
Home Health Hospice HCBS Home Health & Hospice Home Health & HCBS Home Health, Hospice, & HCBS LHC GROUP OVERVIEW LEGEND: 531 home health locations 120 hospice locations 133 home & community based services locations 12 long term acute care hospital locations 37 other service locations 435 leading hospital JV partners 60% (35 states & the District of Columbia) 12M+ annual patient encounters 3,600 referral hospitals 64,000 referral physicians of the U.S. population aged 65+ included in service area 5
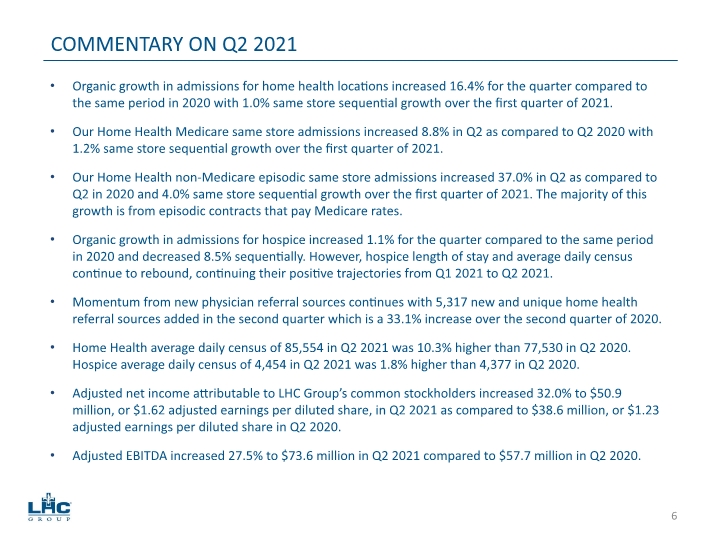
Organic growth in admissions for home health locations increased 16.4% for the quarter compared to the same period in 2020 with 1.0% same store sequential growth over the first quarter of 2021. Our Home Health Medicare same store admissions increased 8.8% in Q2 as compared to Q2 2020 with 1.2% same store sequential growth over the first quarter of 2021. Our Home Health non-Medicare episodic same store admissions increased 37.0% in Q2 as compared to Q2 in 2020 and 4.0% same store sequential growth over the first quarter of 2021. The majority of this growth is from episodic contracts that pay Medicare rates. Organic growth in admissions for hospice increased 1.1% for the quarter compared to the same period in 2020 and decreased 8.5% sequentially. However, hospice length of stay and average daily census continue to rebound, continuing their positive trajectories from Q1 2021 to Q2 2021. Momentum from new physician referral sources continues with 5,317 new and unique home health referral sources added in the second quarter which is a 33.1% increase over the second quarter of 2020. Home Health average daily census of 85,554 in Q2 2021 was 10.3% higher than 77,530 in Q2 2020. Hospice average daily census of 4,454 in Q2 2021 was 1.8% higher than 4,377 in Q2 2020. Adjusted net income attributable to LHC Group’s common stockholders increased 32.0% to $50.9 million, or $1.62 adjusted earnings per diluted share, in Q2 2021 as compared to $38.6 million, or $1.23 adjusted earnings per diluted share in Q2 2020. Adjusted EBITDA increased 27.5% to $73.6 million in Q2 2021 compared to $57.7 million in Q2 2020. COMMENTARY ON Q2 2021 6
For the first time, allows Medicare seniors to choose to recover at home as opposed to an in-patient healthcare facility after a hospitalization and who meet the eligibility for Skilled Nursing Facility (SNF). Introduced July 29, 2021 in the Senate with bipartisan sponsorship led by Sens. Stabenow (D-MI) and Young (R-IN). Sens. Cardin (D-MD), Casey (D-PA), Collins (R-ME), Hassan (D-NH), Lankford (R-OK), and Lummis (R-WY), are co-sponsors of S-2562 (1). Same legislation is expected to be filed in the House of Representatives in the coming weeks on a bipartisan basis What is the new benefit? Available for those eligible for both Skilled Nursing Facility (SNF) and home health agency care 30-day unit of service combining today’s Medicare Home Health Benefit with additional supportive care services (personal care, non-emergency medical transportation, nutritious meals, additional remote patient monitoring, adaptive equipment for the home) How will it work? As part of the hospital discharge planning process Qualified beneficiaries would be given the choice to recover at home with traditional home health services plus the additional new benefits How does Choose Home save money? Medicare spends less when patients recover at home Beneficiaries incur no out-of-pocket expenses and avoid costly SNF coinsurance Cost of the new benefit is hard wired (or limited) to not exceed 80% of the national median cost of a SNF stay What are the potential savings for the Medicare program? Dobson DaVanzo estimates Choose Home could generate Medicare savings of $144M-$247M per year with $1.6B-$2.8B in savings over 10 years in SNF care substitutions (2) Home health provider community estimates 30%-40% of patients destined for a SNF could be cared for in the home – resulting in savings as high as $925M annually CHOOSE HOME CARE ACT OF 2021 7 Section by section analysis of Choose Home Care Act of 2021 provided on pages 44-45. The full Dobson DaVanzo memorandum on savings estimate calculations can be found on pages 46-55.
Conducted by The Decision Co. through a multi-mode survey of 3,012 adults in the U.S. from July 21, 2021 to July 27, 2021. Key Finding: Americans, especially healthcare decision makers, desire the freedom and flexibility in-home care provides compared to traditional care mechanisms Americans clearly prefer to recover in-home rather than in an inpatient setting 64% choose to recover either in-home or in a friend of family member’s home 68% of seniors 65+ prefer to recover in-home options vs. an inpatient facility There is substantial trust for the quality of care in an in-home setting Healthcare decision makers (aged 35-49) assign a trust rating of 95% to in-home vs. 94% for hospitals and 87% for inpatient facility Age 65+ assign a trust rating of 80% to in-home vs. 84% for hospitals and 66% for inpatient facility An overwhelming majority of Americans support expanding Medicare for home health purposes 72% support Congress expanding Medicare vs. 9% in opposition Respondents want Medicare to cover the same service for in-home care that it does for inpatient stays 92% of healthcare decision makers, 82% of aged 65+, and 75% overall Doctor’s referral and scores demonstrating patient satisfaction are the most important factors when choosing in-home healthcare Among 35+, doctor’s referral (64%) patient satisfaction scores (45%) outweigh insurance recommendations (39%) and ratings from government bodies (30%) POLLING DATA SUPPORTS AT HOME CARE 8
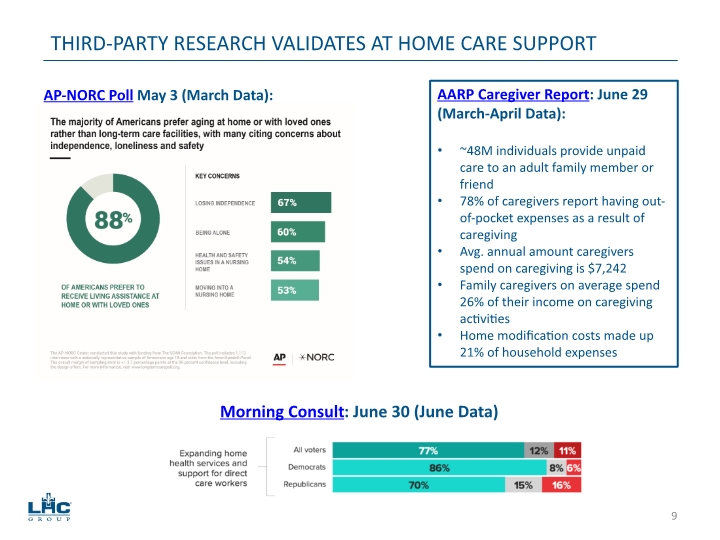
THIRD-PARTY RESEARCH VALIDATES AT HOME CARE SUPPORT AP-NORC Poll May 3 (March Data): Morning Consult: June 30 (June Data) AARP Caregiver Report: June 29 (March-April Data): ~48M individuals provide unpaid care to an adult family member or friend 78% of caregivers report having out-of-pocket expenses as a result of caregiving Avg. annual amount caregivers spend on caregiving is $7,242 Family caregivers on average spend 26% of their income on caregiving activities Home modification costs made up 21% of household expenses 9
The Biden administration continues to promote the expansion of home health services, including HCBS services, as a portion of its infrastructure proposal known currently as the American Jobs Plan. Discussion is now ongoing within Congress as to the possible inclusion of this expansion of HCBS services as part of the infrastructure package that could be considered this summer and fall under the two step budget reconciliation process. On July 19, Sec. of Health and Human Services Becerra signed an Administrative Order extending the declaration of the Public Health Emergency for an additional 90 days through October 18 thereby extending significant flexibilities for the provision of home health services previously afforded administratively. Flexibilities including telehealth and remote patient certifications. Extends the suspension of site neutral payment for LTCHs. HR 2455 – The Resetting the IMPACT Act of 2021 (TRIA) – Introduced by Representatives Sewell (D-AL) and Buchanan (R-FL). The TRIA Act of 2021 will adjust the IMPACT Act’s implementation timeline so that the development of a unified post-acute care payment system reflects the best and most recent available data and the important role post-acute care providers played during public health emergencies. S. 53 / HR 603- Raise the Wage Act –Representative Scott (VA-03) joined Sens. Sanders (I-VT) and Murray (D-WA) as well as Representatives Jayapal (WA-07) and Murphy (FL-07) to introduce legislation gradually raising the federal minimum wage to $15 by 2025. Thereafter, the federal minimum wage would be indexed to median wage growth. The legislation also guarantees that all workers are paid at least the full federal minimum wage by gradually phasing out the subminimum wages for tipped workers, youth workers, and workers with disabilities. AT HOME CARE POLICY TAILWINDS 10
Home Health Proposed Rule for FY22 released in July; final rule expected by November 1st: No cuts for 2022 and an aggregate increase of payment rates of 1.7% ($310 million) which includes a decrease in payments due to reduction in rural add-on payments mandated by BBA 2018. (The payment update is based on a 2.4% market basket, reduced by 0.6% productivity adjustment or a net of 1.8% this is further reduced by 0.1% for the reduction in rural add-on percentages for a net of 1.7%.) The 2022 national standardized 30-day payment will be $2,013.43 versus the $1,901.12 from 2021. The rule includes a proposal to expand nationally the Home Health Value Based Payment demonstration from 9 states to all 50 states and territories beginning Jan. 1, 2022, with a baseline year of 2019 and a performance year of 2022. The rule provides for a maximum payment adjustment of plus or minus 5% reflected in 2024 payments. Hospice survey and enforcement: Based on the Consolidated Appropriations Act of 2021 (passed late Dec. 2020) the rule proposes changes to hospice survey and enforcement actions to address oversight and consistency in survey process. The Better Care Better Jobs Act: Senators Casey (D-PA), Wyden (D-OR), Schumer (D-NY), Murray (D-WA), Duckworth (D-IL), Hassan (D-NH) and Brown (D-OH) are introducing the Better Care Better Jobs Act, a key element of President Biden’s American Jobs Plan. Representatives Dingell (D-MI-12), Pallone (D-NJ-6), Schakowsky (D-IL-9) and Matsui (D-CA-6) introduced the House companion. This legislation would make a historic investment in home and community-based services by strengthening and expanding access to quality home care services and lifting up the caregiving workforce that provides them. Specifically, the bill would: Enhance Medicaid funding for HCBS, strengthen and expand access to HCBS, strengthen and expand the HCBS workforce, show improvement over time, encourage innovative models that benefit direct care workers and care recipients, support quality and accountability, facilitate state planning, permanent spousal impoverishment protections and make permanent Make Money Follows the Person. AT HOME CARE POLICY TAILWINDS CONTINUED 11
DIFFERENTIATED STRATEGIES 12
Joint ventures drive organic growth and margin improvement Same store growth for JV locations averaged 200 basis points higher than non-JV locations for the years 2016-2019. Revenue growth rate for JVs average 10% to 15% in year 2 and 3. Margins for JV locations average 100 to 200 basis points higher than non-JV locations. Continued focus on growth in episodic admissions and rate improvement on non-Medicare admissions Non-Medicare episodic admissions grew by 37.4% in the second quarter of 2021 compared to 2020; and by 28.7% in the first half of 2021 as compared to 2020. Rate-per-visit improved by 6.3% in the second quarter of 2021 compared to 2020; and by 5.1% in the first half of 2021 as compared to 2020. Continued focus on quality and patient satisfaction to drive higher referrals Increased new home health physician referral sources by 22.0% in 2020 over 2019; by 34.0% in the first half of 2021 as compared to 2020 and by 33.1% in Q2 of 2021. Untapped growth in home health and hospice co-locations remains top priority 81 hospice locations co-located with home health out of 120 total hospice locations, or 68%. Up from 77 locations in 2020, 63 locations in 2019 and 58 locations in 2018. Currently averaging 15% to 16% of home health census that gets discharged to hospice. Continue with strategic rollout strategy for HCBS 55 HCBS locations co-located with home health out of 133 total HCBS locations, or 41%. Grow HCBS in markets with value-based arrangements with JV partners and payors. DIFFERENTIATED STRATEGY LEADING TO QUALITY GROWTH 13
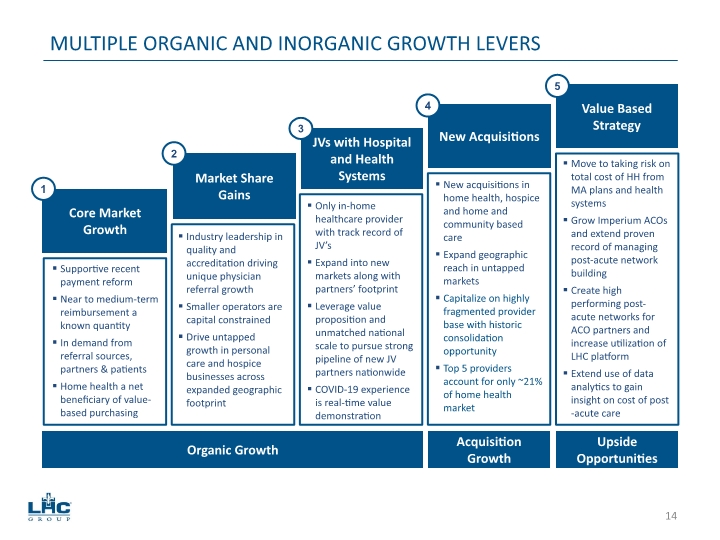
MULTIPLE ORGANIC AND INORGANIC GROWTH LEVERS Organic Growth Acquisition Growth Upside Opportunities Move to taking risk on total cost of HH from MA plans and health systems Grow Imperium ACOs and extend proven record of managing post-acute network building Create high performing post-acute networks for ACO partners and increase utilization of LHC platform Extend use of data analytics to gain insight on cost of post-acute care Core Market Growth Market Share Gains JVs with Hospital and Health Systems New Acquisitions Value Based Strategy New acquisitions in home health, hospice and home and community based care Expand geographic reach in untapped markets Capitalize on highly fragmented provider base with historic consolidation opportunity Top 5 providers account for only ~21% of home health market Only in-home healthcare provider with track record of JV’s Expand into new markets along with partners’ footprint Leverage value proposition and unmatched national scale to pursue strong pipeline of new JV partners nationwide COVID-19 experience is real-time value demonstration Industry leadership in quality and accreditation driving unique physician referral growth Smaller operators are capital constrained Drive untapped growth in personal care and hospice businesses across expanded geographic footprint Supportive recent payment reform Near to medium-term reimbursement a known quantity In demand from referral sources, partners & patients Home health a net beneficiary of value-based purchasing 1 2 3 4 5 14
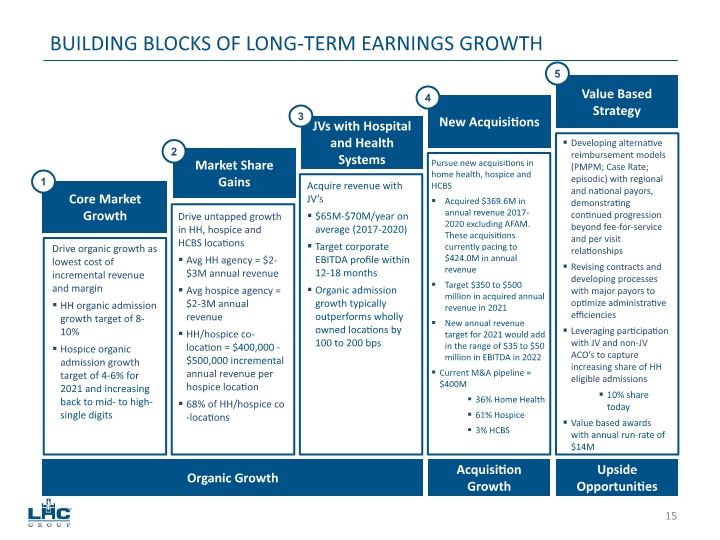
BUILDING BLOCKS OF LONG-TERM EARNINGS GROWTH Developing alternative reimbursement models (PMPM; Case Rate; episodic) with regional and national payors, demonstrating continued progression beyond fee-for-service and per visit relationships Revising contracts and developing processes with major payors to optimize administrative efficiencies Leveraging participation with JV and non-JV ACO’s to capture increasing share of HH eligible admissions 10% share today Value based awards with annual run-rate of $14M Core Market Growth Market Share Gains JVs with Hospital and Health Systems New Acquisitions Value Based Strategy Pursue new acquisitions in home health, hospice and HCBS Acquired $369.6M in annual revenue 2017-2020 excluding AFAM. These acquisitions currently pacing to $424.0M in annual revenue Target $350 to $500 million in acquired annual revenue in 2021 New annual revenue target for 2021 would add in the range of $35 to $50 million in EBITDA in 2022 Current M&A pipeline = $400M 36% Home Health 61% Hospice 3% HCBS Acquire revenue with JV’s $65M-$70M/year on average (2017-2020) Target corporate EBITDA profile within 12-18 months Organic admission growth typically outperforms wholly owned locations by 100 to 200 bps Drive untapped growth in HH, hospice and HCBS locations Avg HH agency = $2-$3M annual revenue Avg hospice agency = $2-3M annual revenue HH/hospice co-location = $400,000 - $500,000 incremental annual revenue per hospice location 68% of HH/hospice co-locations Drive organic growth as lowest cost of incremental revenue and margin HH organic admission growth target of 8-10% Hospice organic admission growth target of 4-6% for 2021 and increasing back to mid- to high- single digits 1 2 3 4 5 Organic Growth Acquisition Growth Upside Opportunities 15
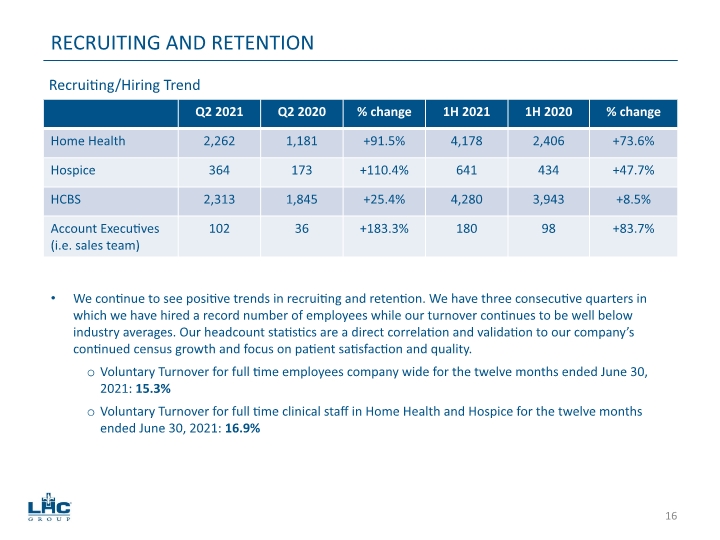
RECRUITING AND RETENTION We continue to see positive trends in recruiting and retention. We have three consecutive quarters in which we have hired a record number of employees while our turnover continues to be well below industry averages. Our headcount statistics are a direct correlation and validation to our company’s continued census growth and focus on patient satisfaction and quality. Voluntary Turnover for full time employees company wide for the twelve months ended June 30, 2021: 15.3% Voluntary Turnover for full time clinical staff in Home Health and Hospice for the twelve months ended June 30, 2021: 16.9% Recruiting/Hiring Trend 16
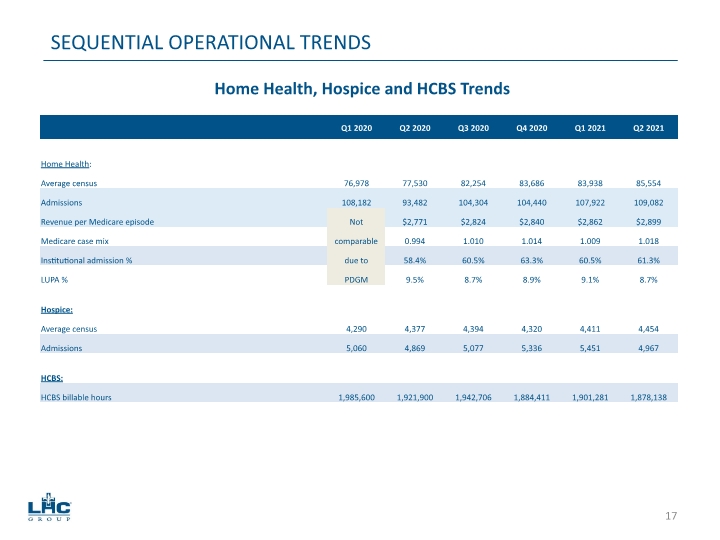
SEQUENTIAL OPERATIONAL TRENDS Home Health, Hospice and HCBS Trends 17
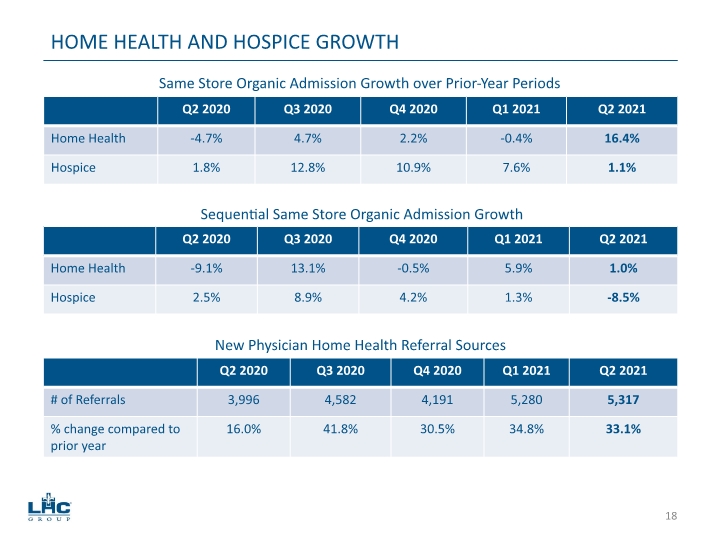
HOME HEALTH AND HOSPICE GROWTH Same Store Organic Admission Growth over Prior-Year Periods Sequential Same Store Organic Admission Growth New Physician Home Health Referral Sources 18
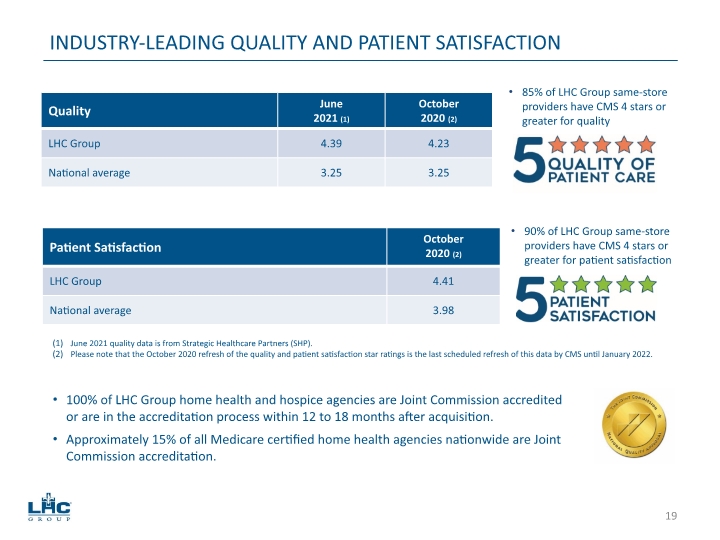
INDUSTRY-LEADING QUALITY AND PATIENT SATISFACTION 85% of LHC Group same-store providers have CMS 4 stars or greater for quality 100% of LHC Group home health and hospice agencies are Joint Commission accredited or are in the accreditation process within 12 to 18 months after acquisition. Approximately 15% of all Medicare certified home health agencies nationwide are Joint Commission accreditation. 90% of LHC Group same-store providers have CMS 4 stars or greater for patient satisfaction June 2021 quality data is from Strategic Healthcare Partners (SHP). Please note that the October 2020 refresh of the quality and patient satisfaction star ratings is the last scheduled refresh of this data by CMS until January 2022. 19
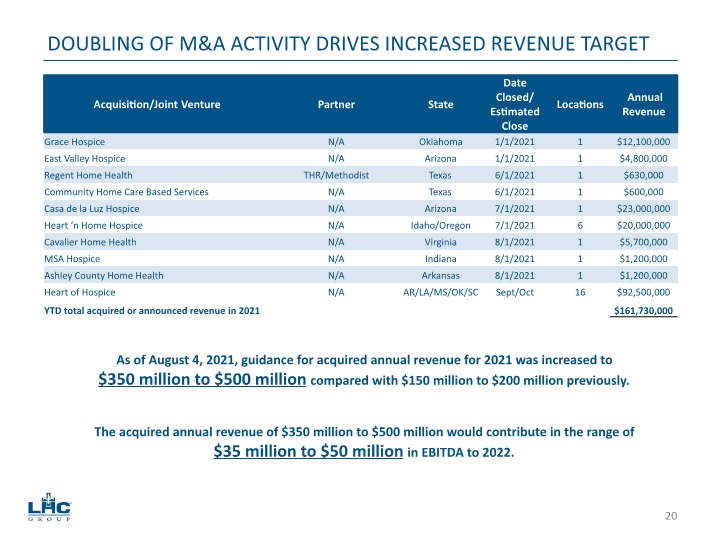
DOUBLING OF M&A ACTIVITY DRIVES INCREASED REVENUE TARGET As of August 4, 2021, guidance for acquired annual revenue for 2021 was increased to $350 million to $500 million compared with $150 million to $200 million previously. The acquired annual revenue of $350 million to $500 million would contribute in the range of $35 million to $50 million in EBITDA to 2022. 20
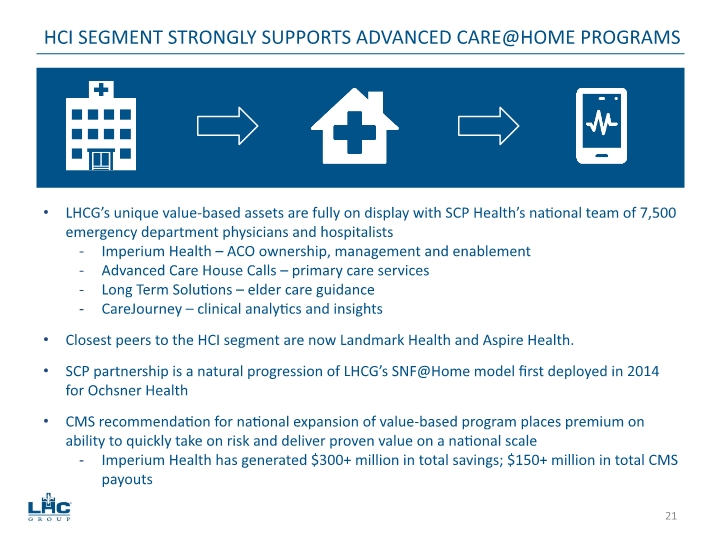
LHCG’s unique value-based assets are fully on display with SCP Health’s national team of 7,500 emergency department physicians and hospitalists Imperium Health – ACO ownership, management and enablement Advanced Care House Calls – primary care services Long Term Solutions – elder care guidance CareJourney – clinical analytics and insights Closest peers to the HCI segment are now Landmark Health and Aspire Health. SCP partnership is a natural progression of LHCG’s SNF@Home model first deployed in 2014 for Ochsner Health CMS recommendation for national expansion of value-based program places premium on ability to quickly take on risk and deliver proven value on a national scale Imperium Health has generated $300+ million in total savings; $150+ million in total CMS payouts HCI SEGMENT STRONGLY SUPPORTS ADVANCED CARE@HOME PROGRAMS 21
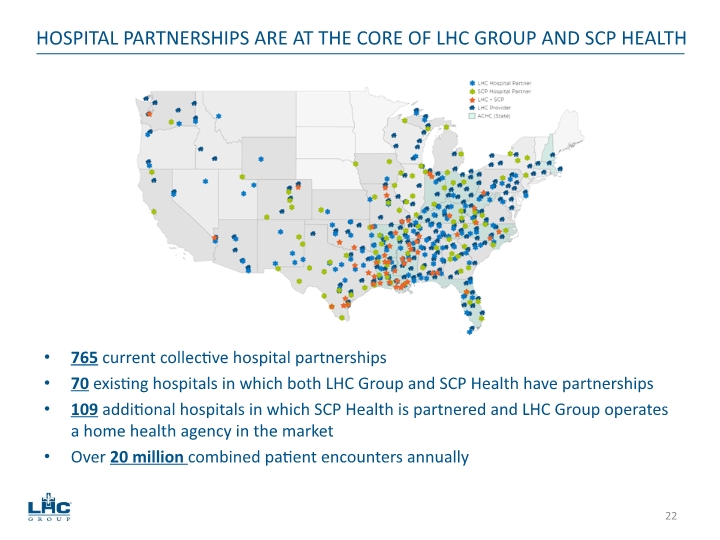
765 current collective hospital partnerships 70 existing hospitals in which both LHC Group and SCP Health have partnerships 109 additional hospitals in which SCP Health is partnered and LHC Group operates a home health agency in the market Over 20 million combined patient encounters annually HOSPITAL PARTNERSHIPS ARE AT THE CORE OF LHC GROUP AND SCP HEALTH 22
2021 CONSOLIDATED RESULTS 23
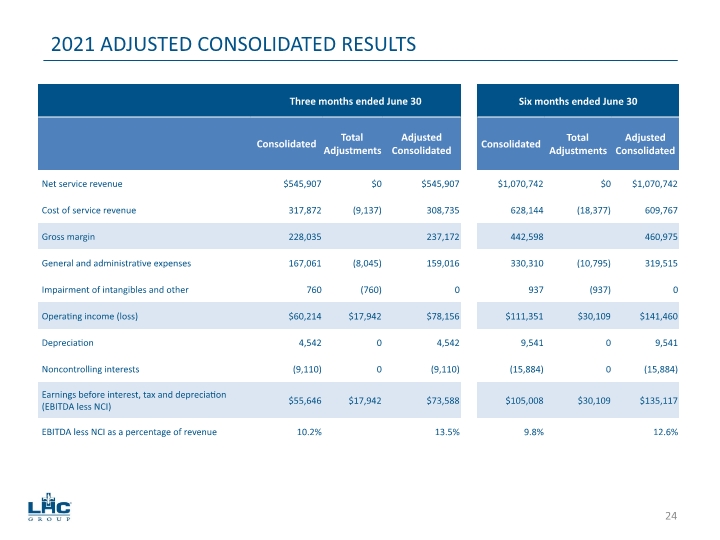
2021 ADJUSTED CONSOLIDATED RESULTS 24
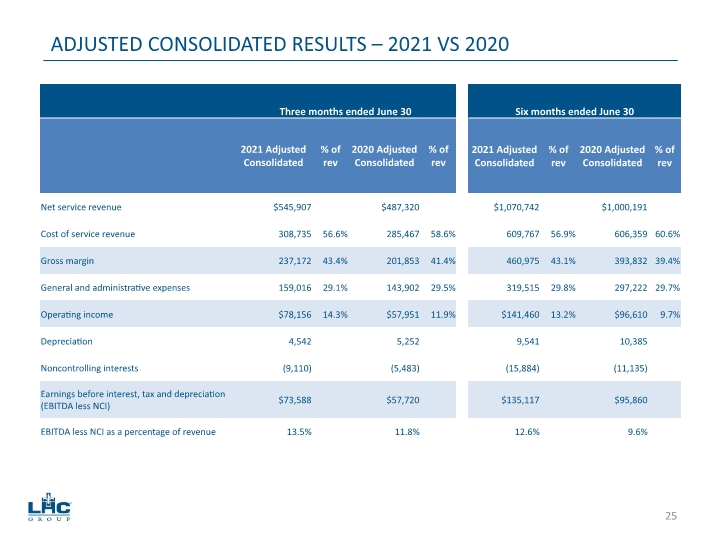
ADJUSTED CONSOLIDATED RESULTS – 2021 VS 2020 25
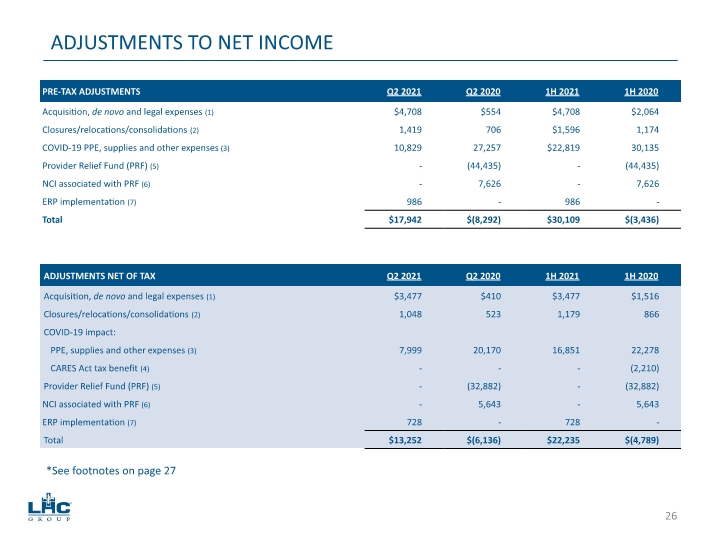
ADJUSTMENTS TO NET INCOME *See footnotes on page 27 26
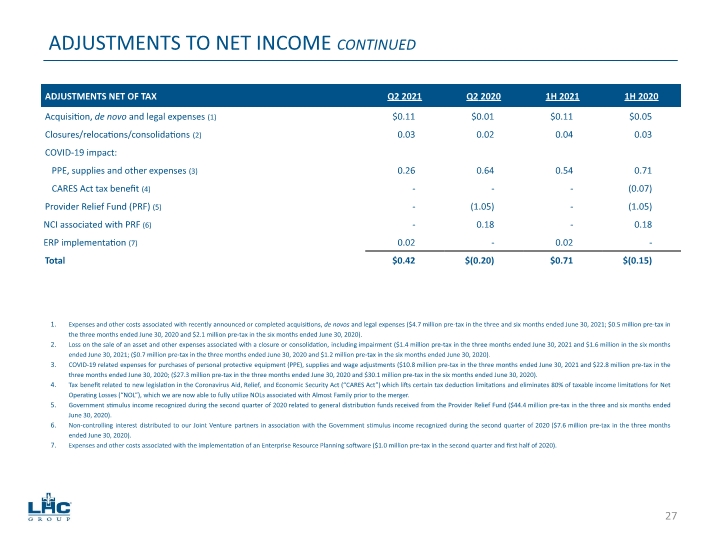
ADJUSTMENTS TO NET INCOME CONTINUED Expenses and other costs associated with recently announced or completed acquisitions, de novos and legal expenses ($4.7 million pre-tax in the three and six months ended June 30, 2021; $0.5 million pre-tax in the three months ended June 30, 2020 and $2.1 million pre-tax in the six months ended June 30, 2020). Loss on the sale of an asset and other expenses associated with a closure or consolidation, including impairment ($1.4 million pre-tax in the three months ended June 30, 2021 and $1.6 million in the six months ended June 30, 2021; ($0.7 million pre-tax in the three months ended June 30, 2020 and $1.2 million pre-tax in the six months ended June 30, 2020). COVID-19 related expenses for purchases of personal protective equipment (PPE), supplies and wage adjustments ($10.8 million pre-tax in the three months ended June 30, 2021 and $22.8 million pre-tax in the three months ended June 30, 2020; ($27.3 million pre-tax in the three months ended June 30, 2020 and $30.1 million pre-tax in the six months ended June 30, 2020). Tax benefit related to new legislation in the Coronavirus Aid, Relief, and Economic Security Act (“CARES Act”) which lifts certain tax deduction limitations and eliminates 80% of taxable income limitations for Net Operating Losses (“NOL”), which we are now able to fully utilize NOLs associated with Almost Family prior to the merger. Government stimulus income recognized during the second quarter of 2020 related to general distribution funds received from the Provider Relief Fund ($44.4 million pre-tax in the three and six months ended June 30, 2020). Non-controlling interest distributed to our Joint Venture partners in association with the Government stimulus income recognized during the second quarter of 2020 ($7.6 million pre-tax in the three months ended June 30, 2020). Expenses and other costs associated with the implementation of an Enterprise Resource Planning software ($1.0 million pre-tax in the second quarter and first half of 2020). 27
SEGMENT RESULTS 28
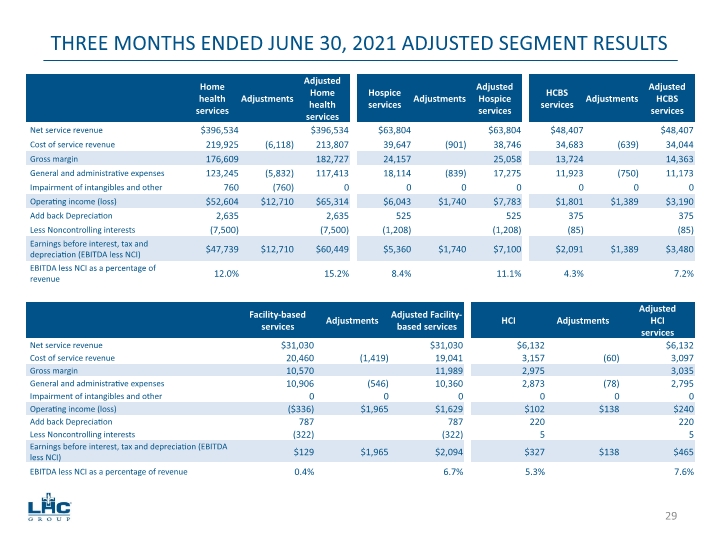
THREE MONTHS ENDED JUNE 30, 2021 ADJUSTED SEGMENT RESULTS 29
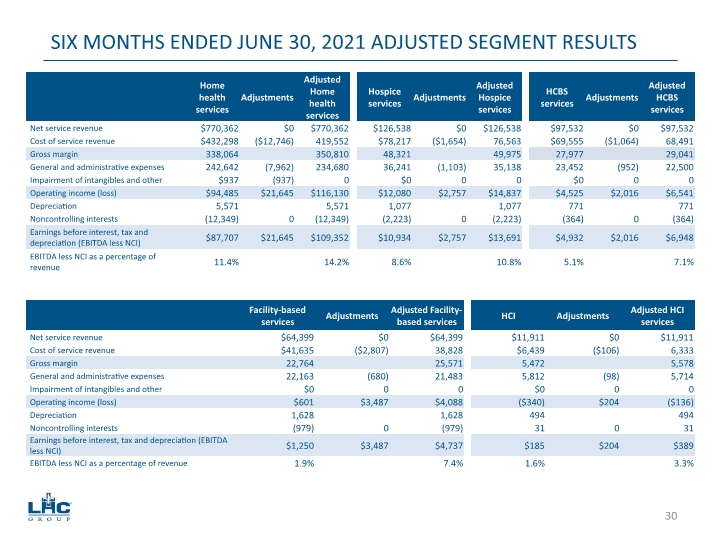
SIX MONTHS ENDED JUNE 30, 2021 ADJUSTED SEGMENT RESULTS 30
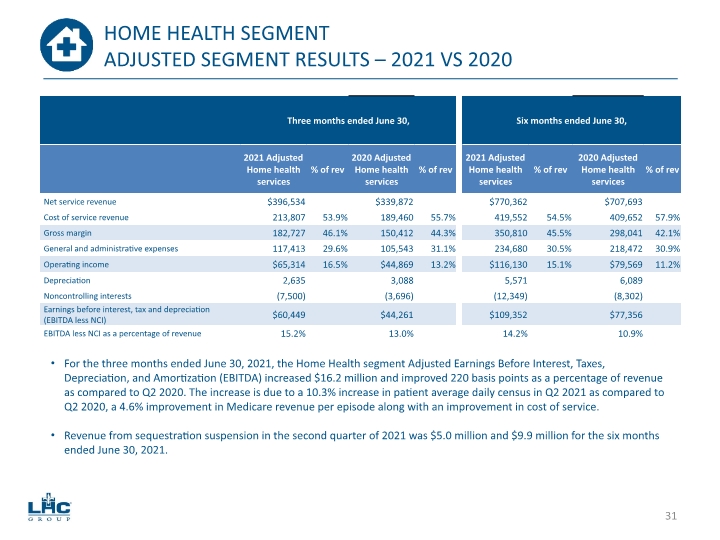
HOME HEALTH SEGMENT ADJUSTED SEGMENT RESULTS – 2021 VS 2020 For the three months ended June 30, 2021, the Home Health segment Adjusted Earnings Before Interest, Taxes, Depreciation, and Amortization (EBITDA) increased $16.2 million and improved 220 basis points as a percentage of revenue as compared to Q2 2020. The increase is due to a 10.3% increase in patient average daily census in Q2 2021 as compared to Q2 2020, a 4.6% improvement in Medicare revenue per episode along with an improvement in cost of service. Revenue from sequestration suspension in the second quarter of 2021 was $5.0 million and $9.9 million for the six months ended June 30, 2021. 31
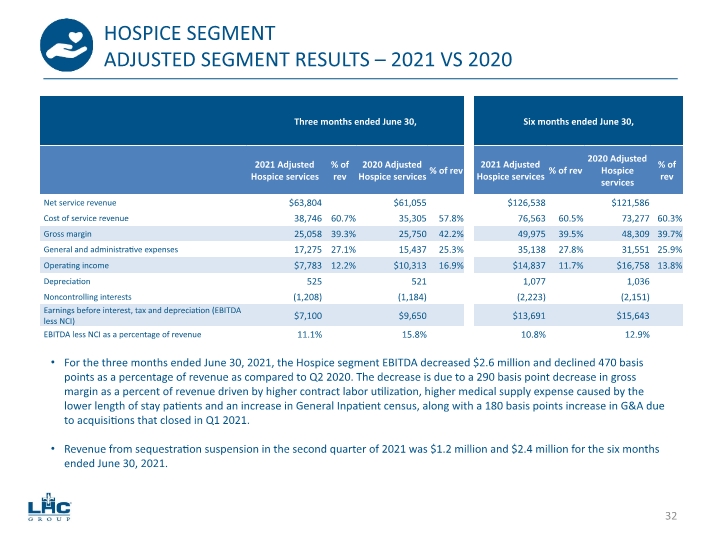
HOSPICE SEGMENT ADJUSTED SEGMENT RESULTS – 2021 VS 2020 For the three months ended June 30, 2021, the Hospice segment EBITDA decreased $2.6 million and declined 470 basis points as a percentage of revenue as compared to Q2 2020. The decrease is due to a 290 basis point decrease in gross margin as a percent of revenue driven by higher contract labor utilization, higher medical supply expense caused by the lower length of stay patients and an increase in General Inpatient census, along with a 180 basis points increase in G&A due to acquisitions that closed in Q1 2021. Revenue from sequestration suspension in the second quarter of 2021 was $1.2 million and $2.4 million for the six months ended June 30, 2021. 32
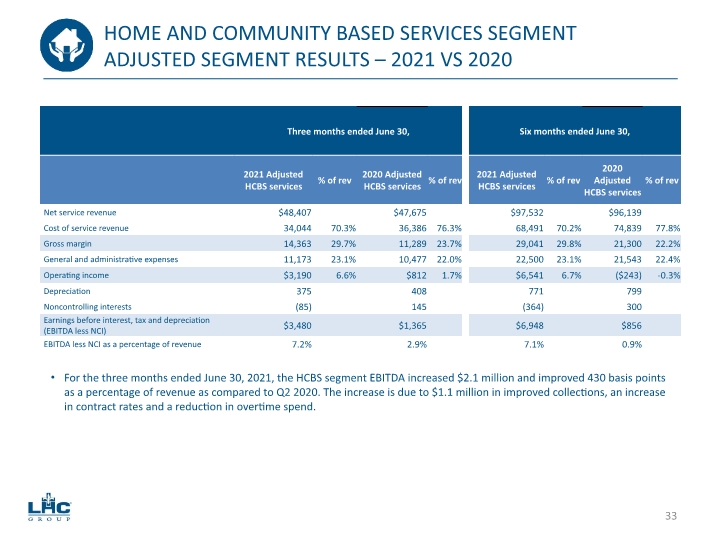
HOME AND COMMUNITY BASED SERVICES SEGMENT ADJUSTED SEGMENT RESULTS – 2021 VS 2020 For the three months ended June 30, 2021, the HCBS segment EBITDA increased $2.1 million and improved 430 basis points as a percentage of revenue as compared to Q2 2020. The increase is due to $1.1 million in improved collections, an increase in contract rates and a reduction in overtime spend. 33
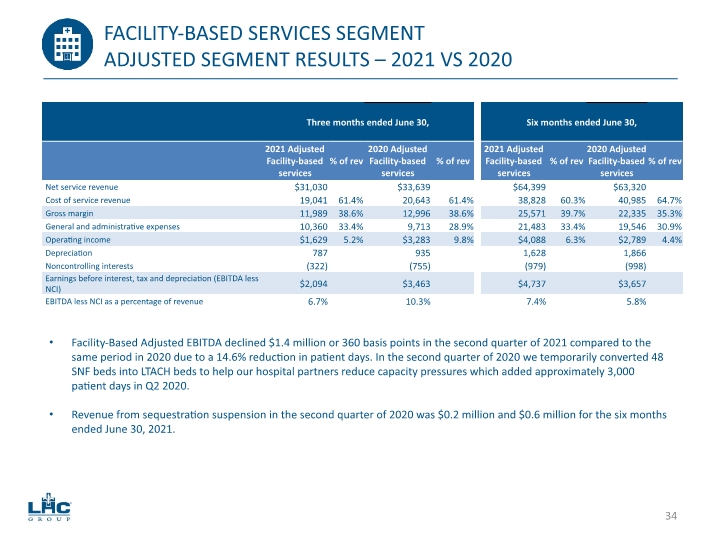
FACILITY-BASED SERVICES SEGMENT ADJUSTED SEGMENT RESULTS – 2021 VS 2020 Facility-Based Adjusted EBITDA declined $1.4 million or 360 basis points in the second quarter of 2021 compared to the same period in 2020 due to a 14.6% reduction in patient days. In the second quarter of 2020 we temporarily converted 48 SNF beds into LTACH beds to help our hospital partners reduce capacity pressures which added approximately 3,000 patient days in Q2 2020. Revenue from sequestration suspension in the second quarter of 2020 was $0.2 million and $0.6 million for the six months ended June 30, 2021. 34
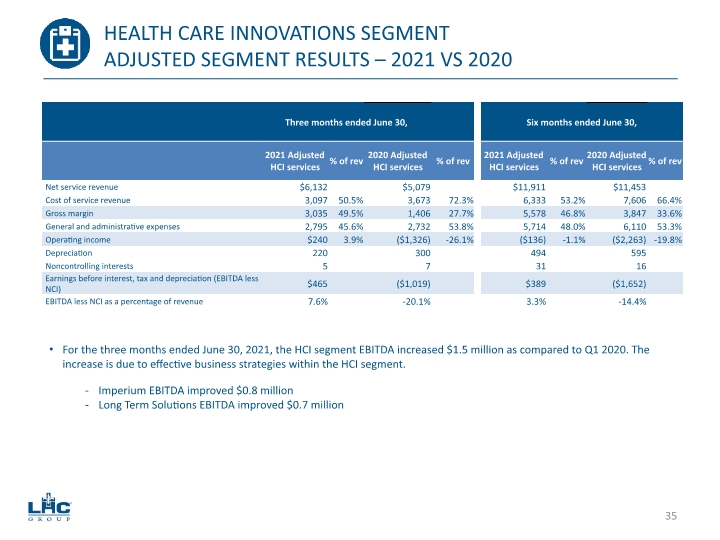
HEALTH CARE INNOVATIONS SEGMENT ADJUSTED SEGMENT RESULTS – 2021 VS 2020 For the three months ended June 30, 2021, the HCI segment EBITDA increased $1.5 million as compared to Q1 2020. The increase is due to effective business strategies within the HCI segment. Imperium EBITDA improved $0.8 million Long Term Solutions EBITDA improved $0.7 million 35

GUIDANCE, LIQUIDITY & OUTLOOK 36
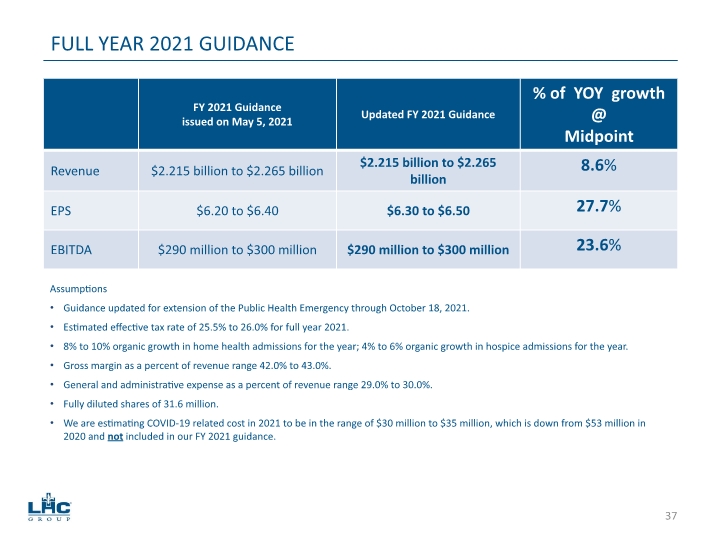
Assumptions Guidance updated for extension of the Public Health Emergency through October 18, 2021. Estimated effective tax rate of 25.5% to 26.0% for full year 2021. 8% to 10% organic growth in home health admissions for the year; 4% to 6% organic growth in hospice admissions for the year. Gross margin as a percent of revenue range 42.0% to 43.0%. General and administrative expense as a percent of revenue range 29.0% to 30.0%. Fully diluted shares of 31.6 million. We are estimating COVID-19 related cost in 2021 to be in the range of $30 million to $35 million, which is down from $53 million in 2020 and not included in our FY 2021 guidance. FULL YEAR 2021 GUIDANCE 37
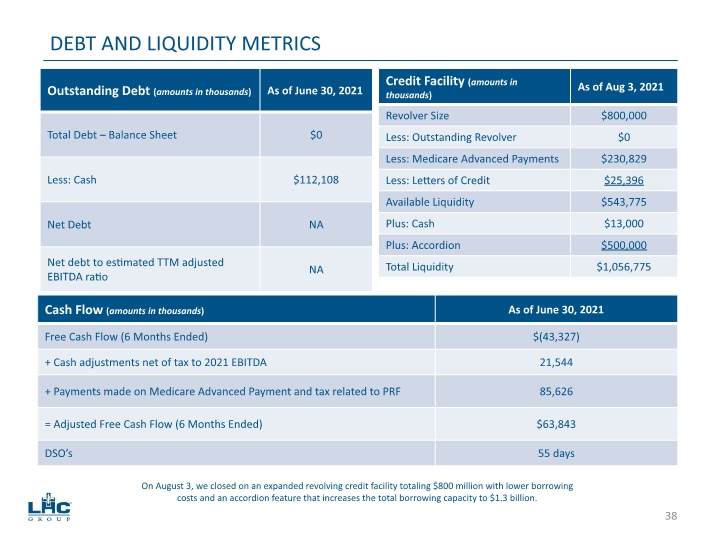
DEBT AND LIQUIDITY METRICS On August 3, we closed on an expanded revolving credit facility totaling $800 million with lower borrowing costs and an accordion feature that increases the total borrowing capacity to $1.3 billion. 38
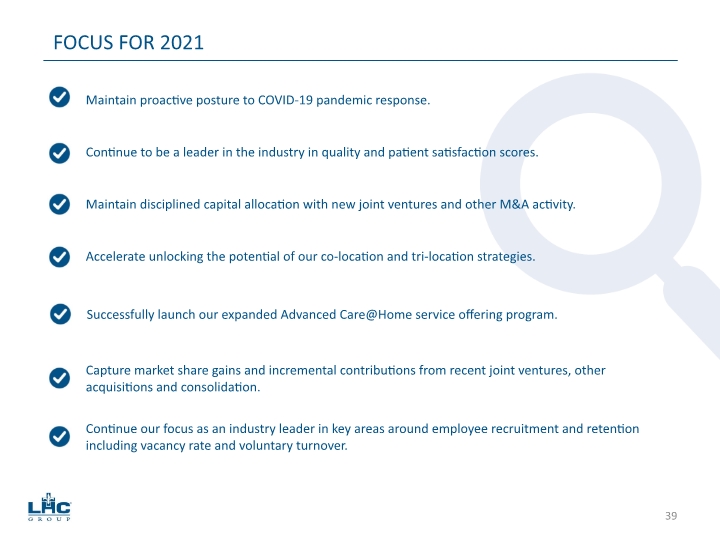
FOCUS FOR 2021 Maintain disciplined capital allocation with new joint ventures and other M&A activity. Accelerate unlocking the potential of our co-location and tri-location strategies. Maintain proactive posture to COVID-19 pandemic response. Continue to be a leader in the industry in quality and patient satisfaction scores. Capture market share gains and incremental contributions from recent joint ventures, other acquisitions and consolidation. Continue our focus as an industry leader in key areas around employee recruitment and retention including vacancy rate and voluntary turnover. Successfully launch our expanded Advanced Care@Home service offering program. 39
APPENDIX 40
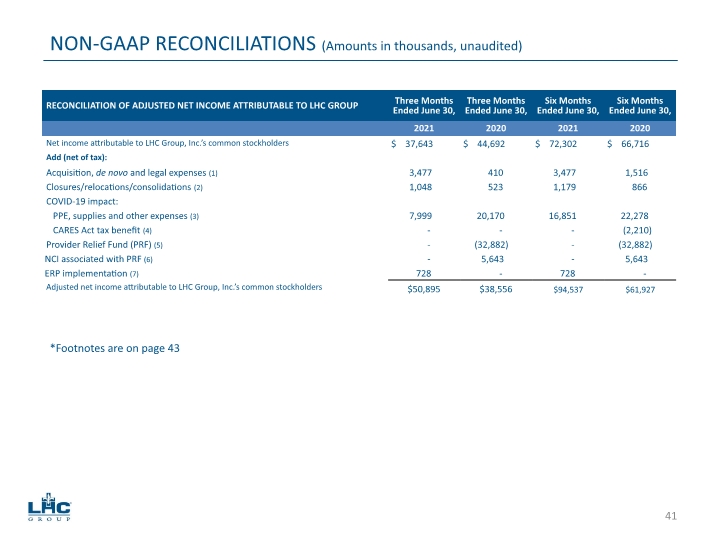
NON-GAAP RECONCILIATIONS (Amounts in thousands, unaudited) *Footnotes are on page 43 41
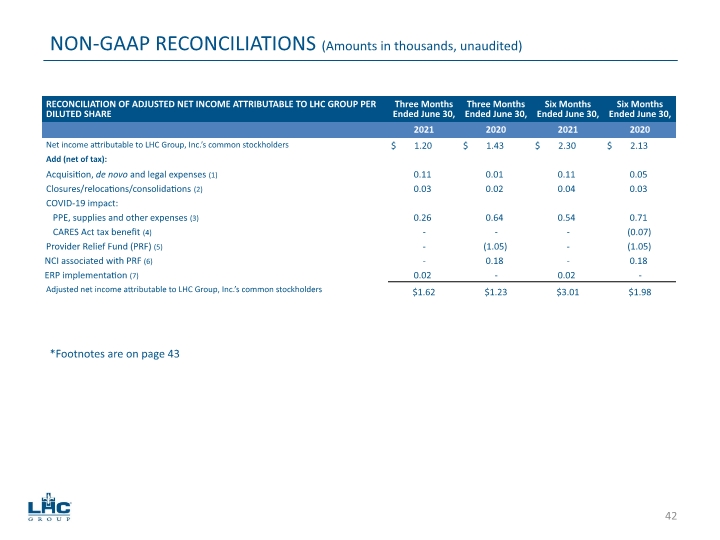
NON-GAAP RECONCILIATIONS (Amounts in thousands, unaudited) *Footnotes are on page 43 42
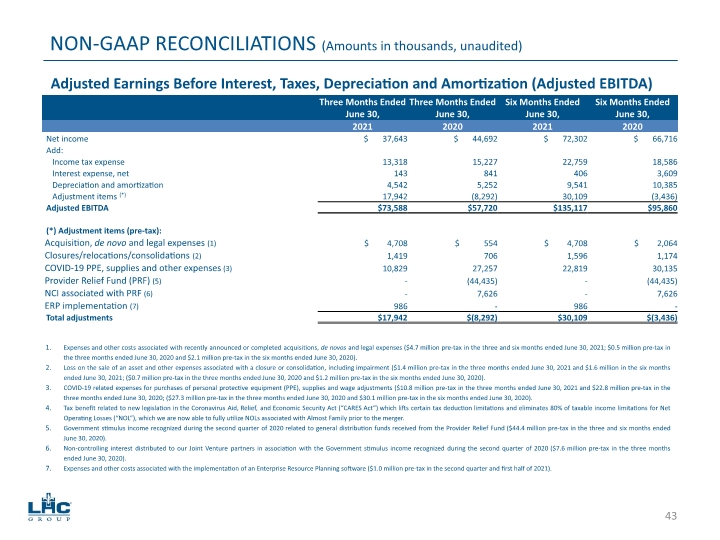
NON-GAAP RECONCILIATIONS (Amounts in thousands, unaudited) Adjusted Earnings Before Interest, Taxes, Depreciation and Amortization (Adjusted EBITDA) Expenses and other costs associated with recently announced or completed acquisitions and de novos ($2.1 million pre-tax in the three and six months ended June 30, 2021; $0.5 million pre-tax in the three months ended June 30, 2020 and $2.1 million pre-tax in the six months ended June 30, 2020). Loss on the sale of an asset and other expenses associated with a closure or consolidation, including impairment ($1.4 million pre-tax in the three months ended June 30, 2021 and $1.6 million in the six months ended June 30, 2021; ($0.7 million pre-tax in the three months ended June 30, 2020 and $1.2 million pre-tax in the six months ended June 30, 2020). COVID-19 related expenses for purchases of personal protective equipment (PPE), supplies and wage adjustments ($10.8 million pre-tax in the three months ended June 30, 2021 and $22.8 million pre-tax in the three months ended June 30, 2020; ($27.3 million pre-tax in the three months ended June 30, 2020 and $30.1 million pre-tax in the six months ended June 30, 2020). Tax benefit related to new legislation in the Coronavirus Aid, Relief, and Economic Security Act (“CARES Act”) which lifts certain tax deduction limitations and eliminates 80% of taxable income limitations for Net Operating Losses (“NOL”), which we are now able to fully utilize NOLs associated with Almost Family prior to the merger. Government stimulus income recognized during the second quarter of 2020 related to general distribution funds received from the Provider Relief Fund ($44.4 million pre-tax in the three and six months ended June 30, 2020). Non-controlling interest distributed to our Joint Venture partners in association with the Government stimulus income recognized during the second quarter of 2020 ($7.6 million pre-tax in the three months ended June 30, 2020). Expenses and other costs associated with the implementation of an Enterprise Resource Planning software ($1.0 million pre-tax in the second quarter and first half of 2020). Expenses and other costs associated with legal expense ($2.6 million pre-tax in the second quarter and first half of 2020). Expenses and other costs associated with recently announced or completed acquisitions, de novos and legal expenses ($4.7 million pre-tax in the three and six months ended June 30, 2021; $0.5 million pre-tax in the three months ended June 30, 2020 and $2.1 million pre-tax in the six months ended June 30, 2020). Loss on the sale of an asset and other expenses associated with a closure or consolidation, including impairment ($1.4 million pre-tax in the three months ended June 30, 2021 and $1.6 million in the six months ended June 30, 2021; ($0.7 million pre-tax in the three months ended June 30, 2020 and $1.2 million pre-tax in the six months ended June 30, 2020). COVID-19 related expenses for purchases of personal protective equipment (PPE), supplies and wage adjustments ($10.8 million pre-tax in the three months ended June 30, 2021 and $22.8 million pre-tax in the three months ended June 30, 2020; ($27.3 million pre-tax in the three months ended June 30, 2020 and $30.1 million pre-tax in the six months ended June 30, 2020). Tax benefit related to new legislation in the Coronavirus Aid, Relief, and Economic Security Act (“CARES Act”) which lifts certain tax deduction limitations and eliminates 80% of taxable income limitations for Net Operating Losses (“NOL”), which we are now able to fully utilize NOLs associated with Almost Family prior to the merger. Government stimulus income recognized during the second quarter of 2020 related to general distribution funds received from the Provider Relief Fund ($44.4 million pre-tax in the three and six months ended June 30, 2020). Non-controlling interest distributed to our Joint Venture partners in association with the Government stimulus income recognized during the second quarter of 2020 ($7.6 million pre-tax in the three months ended June 30, 2020). Expenses and other costs associated with the implementation of an Enterprise Resource Planning software ($1.0 million pre-tax in the second quarter and first half of 2021). 43
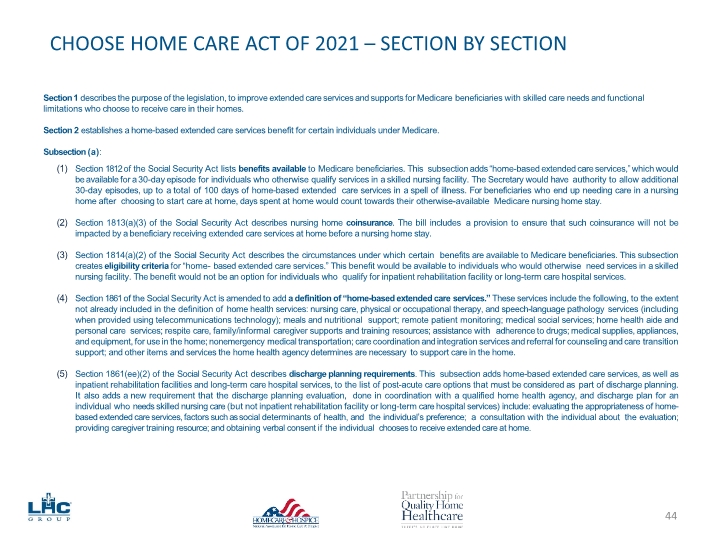
Section 1 describes the purpose of the legislation, to improve extended care services and supports for Medicare beneficiaries with skilled care needs and functional limitations who choose to receive care in their homes. Section 2 establishes a home-based extended care services benefit for certain individuals under Medicare. Subsection (a): Section 1812 of the Social Security Act lists benefits available to Medicare beneficiaries. This subsection adds “home-based extended care services,” which would be available for a 30-day episode for individuals who otherwise qualify services in a skilled nursing facility. The Secretary would have authority to allow additional 30-day episodes, up to a total of 100 days of home-based extended care services in a spell of illness. For beneficiaries who end up needing care in a nursing home after choosing to start care at home, days spent at home would count towards their otherwise-available Medicare nursing home stay. Section 1813(a)(3) of the Social Security Act describes nursing home coinsurance. The bill includes a provision to ensure that such coinsurance will not be impacted by a beneficiary receiving extended care services at home before a nursing home stay. Section 1814(a)(2) of the Social Security Act describes the circumstances under which certain benefits are available to Medicare beneficiaries. This subsection creates eligibility criteria for “home- based extended care services.” This benefit would be available to individuals who would otherwise need services in a skilled nursing facility. The benefit would not be an option for individuals who qualify for inpatient rehabilitation facility or long-term care hospital services. Section 1861 of the Social Security Act is amended to add a definition of “home-based extended care services.” These services include the following, to the extent not already included in the definition of home health services: nursing care, physical or occupational therapy, and speech-language pathology services (including when provided using telecommunications technology); meals and nutritional support; remote patient monitoring; medical social services; home health aide and personal care services; respite care, family/informal caregiver supports and training resources; assistance with adherence to drugs; medical supplies, appliances, and equipment, for use in the home; nonemergency medical transportation; care coordination and integration services and referral for counseling and care transition support; and other items and services the home health agency determines are necessary to support care in the home. Section 1861(ee)(2) of the Social Security Act describes discharge planning requirements. This subsection adds home-based extended care services, as well as inpatient rehabilitation facilities and long-term care hospital services, to the list of post-acute care options that must be considered as part of discharge planning. It also adds a new requirement that the discharge planning evaluation, done in coordination with a qualified home health agency, and discharge plan for an individual who needs skilled nursing care (but not inpatient rehabilitation facility or long-term care hospital services) include: evaluating the appropriateness of home-based extended care services, factors such as social determinants of health, and the individual’s preference; a consultation with the individual about the evaluation; providing caregiver training resource; and obtaining verbal consent if the individual chooses to receive extended care at home. NAHC.org PQHH.org 44 CHOOSE HOME CARE ACT OF 2021 – SECTION BY SECTION
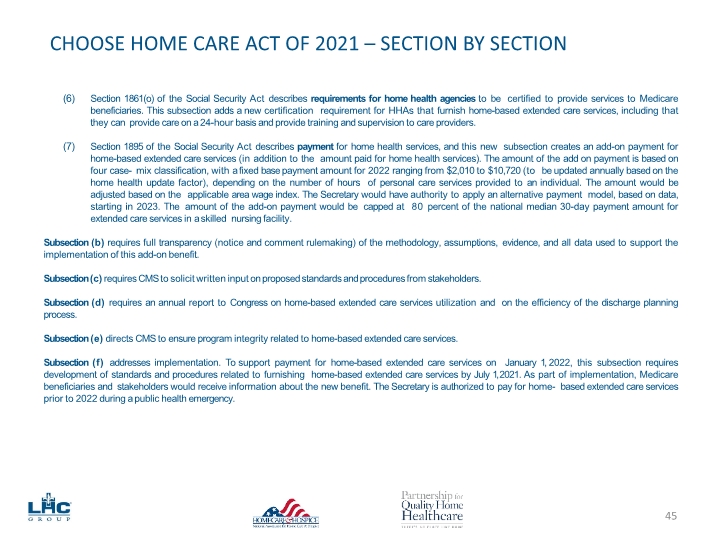
Section 1861(o) of the Social Security Act describes requirements for home health agencies to be certified to provide services to Medicare beneficiaries. This subsection adds a new certification requirement for HHAs that furnish home-based extended care services, including that they can provide care on a 24-hour basis and provide training and supervision to care providers. Section 1895 of the Social Security Act describes payment for home health services, and this new subsection creates an add-on payment for home-based extended care services (in addition to the amount paid for home health services). The amount of the add on payment is based on four case- mix classification, with a fixed base payment amount for 2022 ranging from $2,010 to $10,720 (to be updated annually based on the home health update factor), depending on the number of hours of personal care services provided to an individual. The amount would be adjusted based on the applicable area wage index. The Secretary would have authority to apply an alternative payment model, based on data, starting in 2023. The amount of the add-on payment would be capped at 80 percent of the national median 30-day payment amount for extended care services in a skilled nursing facility. Subsection (b) requires full transparency (notice and comment rulemaking) of the methodology, assumptions, evidence, and all data used to support the implementation of this add-on benefit. Subsection (c) requires CMS to solicit written input on proposed standards and procedures from stakeholders. Subsection (d) requires an annual report to Congress on home-based extended care services utilization and on the efficiency of the discharge planning process. Subsection (e) directs CMS to ensure program integrity related to home-based extended care services. Subsection (f) addresses implementation. To support payment for home-based extended care services on January 1, 2022, this subsection requires development of standards and procedures related to furnishing home-based extended care services by July 1, 2021. As part of implementation, Medicare beneficiaries and stakeholders would receive information about the new benefit. The Secretary is authorized to pay for home- based extended care services prior to 2022 during a public health emergency. NAHC.org PQHH.org 45 CHOOSE HOME CARE ACT OF 2021 – SECTION BY SECTION
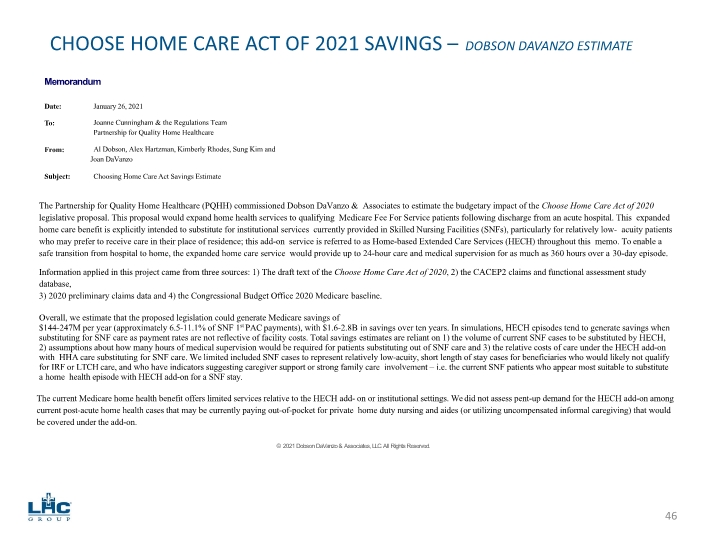
NAHC.org PQHH.org 46 CHOOSE HOME CARE ACT OF 2021 SAVINGS – DOBSON DAVANZO ESTIMATE The Partnership for Quality Home Healthcare (PQHH) commissioned Dobson DaVanzo & Associates to estimate the budgetary impact of the Choose Home Care Act of 2020 legislative proposal. This proposal would expand home health services to qualifying Medicare Fee For Service patients following discharge from an acute hospital. This expanded home care benefit is explicitly intended to substitute for institutional services currently provided in Skilled Nursing Facilities (SNFs), particularly for relatively low- acuity patients who may prefer to receive care in their place of residence; this add-on service is referred to as Home-based Extended Care Services (HECH) throughout this memo. To enable a safe transition from hospital to home, the expanded home care service would provide up to 24-hour care and medical supervision for as much as 360 hours over a 30-day episode. Information applied in this project came from three sources: 1) The draft text of the Choose Home Care Act of 2020, 2) the CACEP2 claims and functional assessment study database, 3) 2020 preliminary claims data and 4) the Congressional Budget Office 2020 Medicare baseline. Overall, we estimate that the proposed legislation could generate Medicare savings of $144-247M per year (approximately 6.5-11.1% of SNF 1st PAC payments), with $1.6-2.8B in savings over ten years. In simulations, HECH episodes tend to generate savings when substituting for SNF care as payment rates are not reflective of facility costs. Total savings estimates are reliant on 1) the volume of current SNF cases to be substituted by HECH, 2) assumptions about how many hours of medical supervision would be required for patients substituting out of SNF care and 3) the relative costs of care under the HECH add-on with HHA care substituting for SNF care. We limited included SNF cases to represent relatively low-acuity, short length of stay cases for beneficiaries who would likely not qualify for IRF or LTCH care, and who have indicators suggesting caregiver support or strong family care involvement – i.e. the current SNF patients who appear most suitable to substitute a home health episode with HECH add-on for a SNF stay. The current Medicare home health benefit offers limited services relative to the HECH add- on or institutional settings. We did not assess pent-up demand for the HECH add-on among current post-acute home health cases that may be currently paying out-of-pocket for private home duty nursing and aides (or utilizing uncompensated informal caregiving) that would be covered under the add-on. © 2021 Dobson DaVanzo & Associates, LLC. All Rights Reserved.
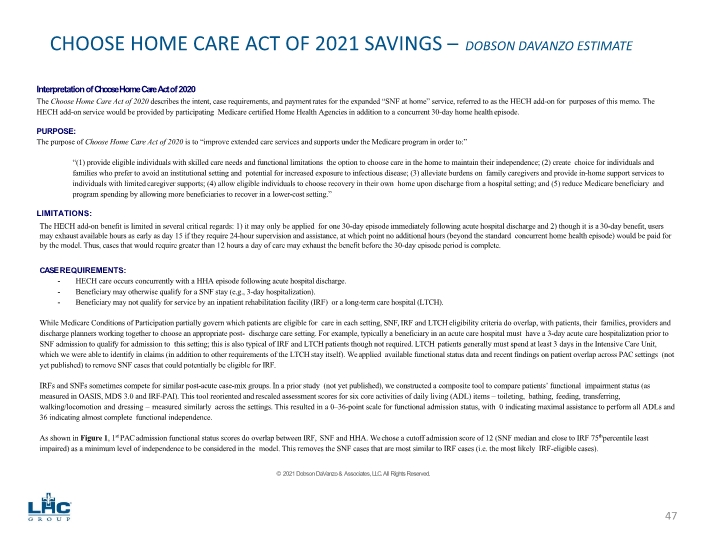
NAHC.org PQHH.org 47 CHOOSE HOME CARE ACT OF 2021 SAVINGS – DOBSON DAVANZO ESTIMATE Interpretation of Choose Home Care Act of 2020 The Choose Home Care Act of 2020 describes the intent, case requirements, and payment rates for the expanded “SNF at home��� service, referred to as the HECH add-on for purposes of this memo. The HECH add-on service would be provided by participating Medicare certified Home Health Agencies in addition to a concurrent 30-day home health episode. PURPOSE: The purpose of Choose Home Care Act of 2020 is to “improve extended care services and supports under the Medicare program in order to:” “(1) provide eligible individuals with skilled care needs and functional limitations the option to choose care in the home to maintain their independence; (2) create choice for individuals and families who prefer to avoid an institutional setting and potential for increased exposure to infectious disease; (3) alleviate burdens on family caregivers and provide in-home support services to individuals with limited caregiver supports; (4) allow eligible individuals to choose recovery in their own home upon discharge from a hospital setting; and (5) reduce Medicare beneficiary and program spending by allowing more beneficiaries to recover in a lower-cost setting.” LIMITATIONS: The HECH add-on benefit is limited in several critical regards: 1) it may only be applied for one 30-day episode immediately following acute hospital discharge and 2) though it is a 30-day benefit, users may exhaust available hours as early as day 15 if they require 24-hour supervision and assistance, at which point no additional hours (beyond the standard concurrent home health episode) would be paid for by the model. Thus, cases that would require greater than 12 hours a day of care may exhaust the benefit before the 30-day episode period is complete. CASE REQUIREMENTS: HECH care occurs concurrently with a HHA episode following acute hospital discharge. Beneficiary may otherwise qualify for a SNF stay (e.g., 3-day hospitalization). Beneficiary may not qualify for service by an inpatient rehabilitation facility (IRF) or a long-term care hospital (LTCH). While Medicare Conditions of Participation partially govern which patients are eligible for care in each setting, SNF, IRF and LTCH eligibility criteria do overlap, with patients, their families, providers and discharge planners working together to choose an appropriate post- discharge care setting. For example, typically a beneficiary in an acute care hospital must have a 3-day acute care hospitalization prior to SNF admission to qualify for admission to this setting; this is also typical of IRF and LTCH patients though not required. LTCH patients generally must spend at least 3 days in the Intensive Care Unit, which we were able to identify in claims (in addition to other requirements of the LTCH stay itself). We applied available functional status data and recent findings on patient overlap across PAC settings (not yet published) to remove SNF cases that could potentially be eligible for IRF. IRFs and SNFs sometimes compete for similar post-acute case-mix groups. In a prior study (not yet published), we constructed a composite tool to compare patients’ functional impairment status (as measured in OASIS, MDS 3.0 and IRF-PAI). This tool reoriented and rescaled assessment scores for six core activities of daily living (ADL) items – toileting, bathing, feeding, transferring, walking/locomotion and dressing – measured similarly across the settings. This resulted in a 0–36-point scale for functional admission status, with 0 indicating maximal assistance to perform all ADLs and 36 indicating almost complete functional independence. As shown in Figure 1, 1st PAC admission functional status scores do overlap between IRF, SNF and HHA. We chose a cutoff admission score of 12 (SNF median and close to IRF 75th percentile least impaired) as a minimum level of independence to be considered in the model. This removes the SNF cases that are most similar to IRF cases (i.e. the most likely IRF-eligible cases). © 2021 Dobson DaVanzo & Associates, LLC. All Rights Reserved.
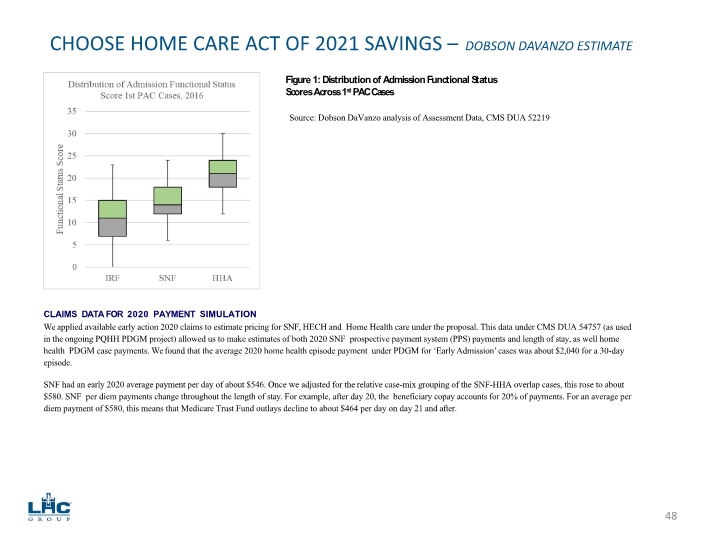
NAHC.org PQHH.org 48 CHOOSE HOME CARE ACT OF 2021 SAVINGS – DOBSON DAVANZO ESTIMATE Figure 1: Distribution of Admission Functional Status Scores Across 1st PAC Cases CLAIMS DATA FOR 2020 PAYMENT SIMULATION We applied available early action 2020 claims to estimate pricing for SNF, HECH and Home Health care under the proposal. This data under CMS DUA 54757 (as used in the ongoing PQHH PDGM project) allowed us to make estimates of both 2020 SNF prospective payment system (PPS) payments and length of stay, as well home health PDGM case payments. We found that the average 2020 home health episode payment under PDGM for ‘Early Admission’ cases was about $2,040 for a 30-day episode. SNF had an early 2020 average payment per day of about $546. Once we adjusted for the relative case-mix grouping of the SNF-HHA overlap cases, this rose to about $580. SNF per diem payments change throughout the length of stay. For example, after day 20, the beneficiary copay accounts for 20% of payments. For an average per diem payment of $580, this means that Medicare Trust Fund outlays decline to about $464 per day on day 21 and after. Source: Dobson DaVanzo analysis of Assessment Data, CMS DUA 52219
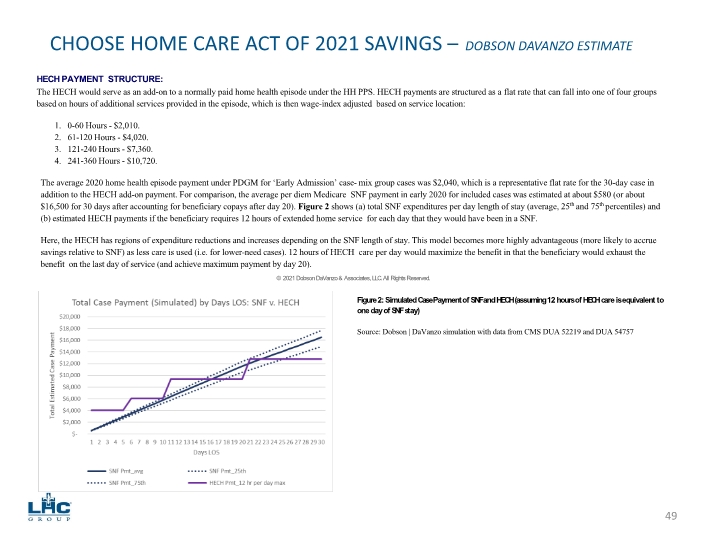
NAHC.org PQHH.org 49 CHOOSE HOME CARE ACT OF 2021 SAVINGS – DOBSON DAVANZO ESTIMATE HECH PAYMENT STRUCTURE: The HECH would serve as an add-on to a normally paid home health episode under the HH PPS. HECH payments are structured as a flat rate that can fall into one of four groups based on hours of additional services provided in the episode, which is then wage-index adjusted based on service location: 1. 0-60 Hours - $2,010. 2. 61-120 Hours - $4,020. 3. 121-240 Hours - $7,360. 4. 241-360 Hours - $10,720. The average 2020 home health episode payment under PDGM for ‘Early Admission’ case- mix group cases was $2,040, which is a representative flat rate for the 30-day case in addition to the HECH add-on payment. For comparison, the average per diem Medicare SNF payment in early 2020 for included cases was estimated at about $580 (or about $16,500 for 30 days after accounting for beneficiary copays after day 20). Figure 2 shows (a) total SNF expenditures per day length of stay (average, 25th and 75th percentiles) and (b) estimated HECH payments if the beneficiary requires 12 hours of extended home service for each day that they would have been in a SNF. Here, the HECH has regions of expenditure reductions and increases depending on the SNF length of stay. This model becomes more highly advantageous (more likely to accrue savings relative to SNF) as less care is used (i.e. for lower-need cases). 12 hours of HECH care per day would maximize the benefit in that the beneficiary would exhaust the benefit on the last day of service (and achieve maximum payment by day 20). © 2021 Dobson DaVanzo & Associates, LLC. All Rights Reserved. Figure 2: Simulated Case Payment of SNF and HECH (assuming 12 hours of HECH care is equivalent to one day of SNF stay) Source: Dobson | DaVanzo simulation with data from CMS DUA 52219 and DUA 54757
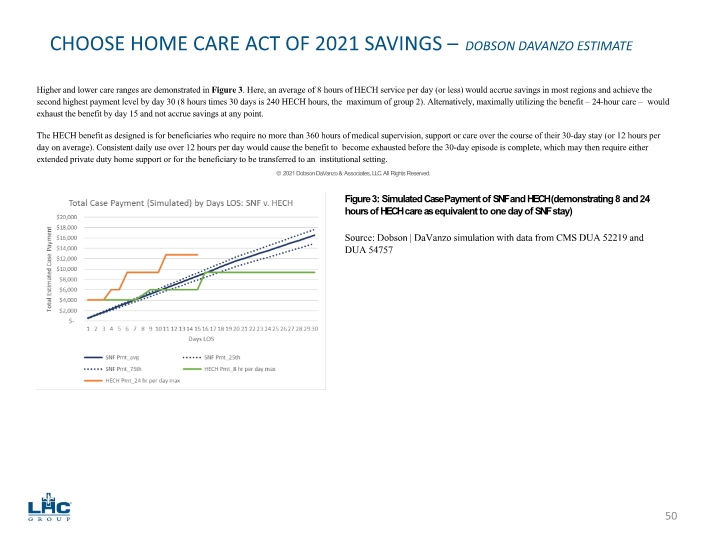
NAHC.org PQHH.org 50 CHOOSE HOME CARE ACT OF 2021 SAVINGS – DOBSON DAVANZO ESTIMATE Higher and lower care ranges are demonstrated in Figure 3. Here, an average of 8 hours of HECH service per day (or less) would accrue savings in most regions and achieve the second highest payment level by day 30 (8 hours times 30 days is 240 HECH hours, the maximum of group 2). Alternatively, maximally utilizing the benefit – 24-hour care – would exhaust the benefit by day 15 and not accrue savings at any point. The HECH benefit as designed is for beneficiaries who require no more than 360 hours of medical supervision, support or care over the course of their 30-day stay (or 12 hours per day on average). Consistent daily use over 12 hours per day would cause the benefit to become exhausted before the 30-day episode is complete, which may then require either extended private duty home support or for the beneficiary to be transferred to an institutional setting. © 2021 Dobson DaVanzo & Associates, LLC. All Rights Reserved. Figure 3: Simulated Case Payment of SNF and HECH (demonstrating 8 and 24 hours of HECH care as equivalent to one day of SNF stay) Source: Dobson | DaVanzo simulation with data from CMS DUA 52219 and DUA 54757
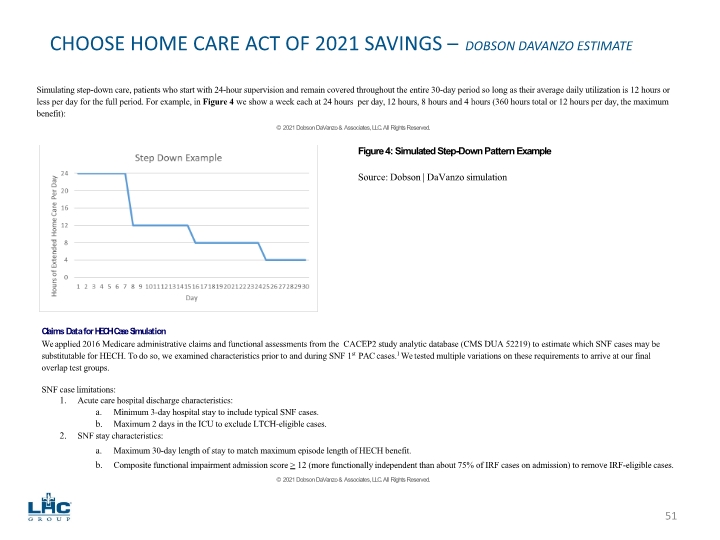
NAHC.org PQHH.org 51 CHOOSE HOME CARE ACT OF 2021 SAVINGS – DOBSON DAVANZO ESTIMATE Simulating step-down care, patients who start with 24-hour supervision and remain covered throughout the entire 30-day period so long as their average daily utilization is 12 hours or less per day for the full period. For example, in Figure 4 we show a week each at 24 hours per day, 12 hours, 8 hours and 4 hours (360 hours total or 12 hours per day, the maximum benefit): © 2021 Dobson DaVanzo & Associates, LLC. All Rights Reserved. Figure 4: Simulated Step-Down Pattern Example Source: Dobson | DaVanzo simulation Claims Data for HECH Case Simulation We applied 2016 Medicare administrative claims and functional assessments from the CACEP2 study analytic database (CMS DUA 52219) to estimate which SNF cases may be substitutable for HECH. To do so, we examined characteristics prior to and during SNF 1st PAC cases.1 We tested multiple variations on these requirements to arrive at our final overlap test groups. SNF case limitations: Acute care hospital discharge characteristics: Minimum 3-day hospital stay to include typical SNF cases. Maximum 2 days in the ICU to exclude LTCH-eligible cases. SNF stay characteristics: Maximum 30-day length of stay to match maximum episode length of HECH benefit. Composite functional impairment admission score > 12 (more functionally independent than about 75% of IRF cases on admission) to remove IRF-eligible cases. © 2021 Dobson DaVanzo & Associates, LLC. All Rights Reserved.
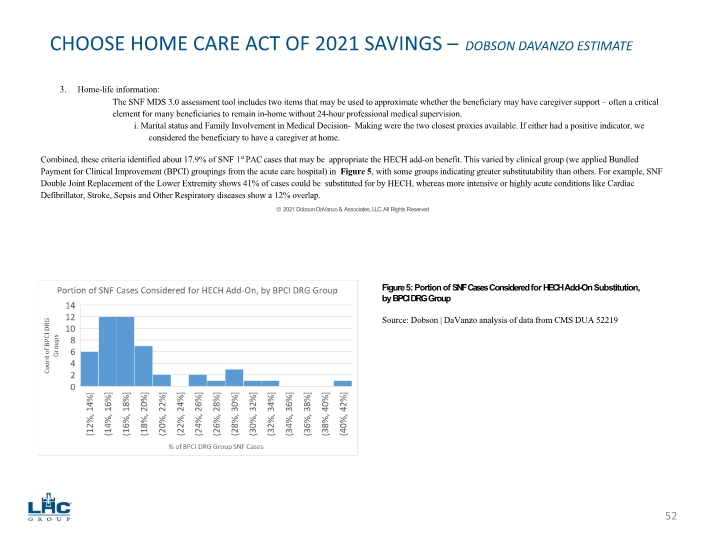
NAHC.org PQHH.org 52 CHOOSE HOME CARE ACT OF 2021 SAVINGS – DOBSON DAVANZO ESTIMATE Home-life information: The SNF MDS 3.0 assessment tool includes two items that may be used to approximate whether the beneficiary may have caregiver support – often a critical element for many beneficiaries to remain in-home without 24-hour professional medical supervision. i. Marital status and Family Involvement in Medical Decision- Making were the two closest proxies available. If either had a positive indicator, we considered the beneficiary to have a caregiver at home. Combined, these criteria identified about 17.9% of SNF 1st PAC cases that may be appropriate the HECH add-on benefit. This varied by clinical group (we applied Bundled Payment for Clinical Improvement (BPCI) groupings from the acute care hospital) in Figure 5, with some groups indicating greater substitutability than others. For example, SNF Double Joint Replacement of the Lower Extremity shows 41% of cases could be substituted for by HECH, whereas more intensive or highly acute conditions like Cardiac Defibrillator, Stroke, Sepsis and Other Respiratory diseases show a 12% overlap. © 2021 Dobson DaVanzo & Associates, LLC. All Rights Reserved. Figure 5: Portion of SNF Cases Considered for HECH Add-On Substitution, by BPCI DRG Group Source: Dobson | DaVanzo analysis of data from CMS DUA 52219
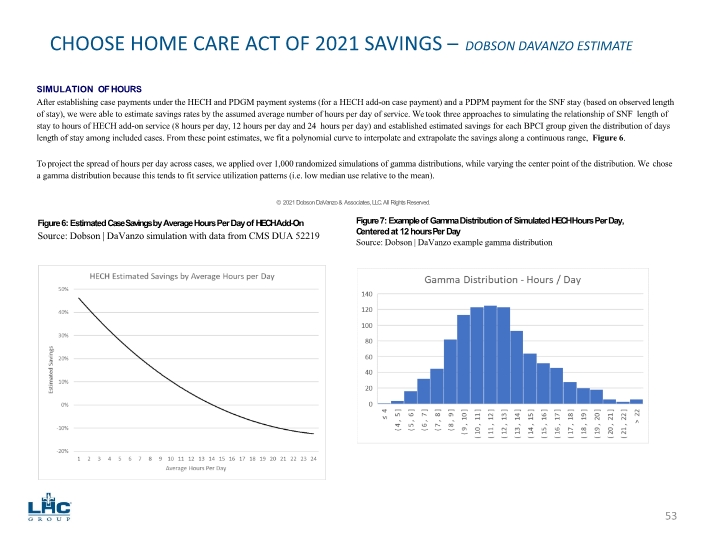
NAHC.org PQHH.org 53 CHOOSE HOME CARE ACT OF 2021 SAVINGS – DOBSON DAVANZO ESTIMATE SIMULATION OF HOURS After establishing case payments under the HECH and PDGM payment systems (for a HECH add-on case payment) and a PDPM payment for the SNF stay (based on observed length of stay), we were able to estimate savings rates by the assumed average number of hours per day of service. We took three approaches to simulating the relationship of SNF length of stay to hours of HECH add-on service (8 hours per day, 12 hours per day and 24 hours per day) and established estimated savings for each BPCI group given the distribution of days length of stay among included cases. From these point estimates, we fit a polynomial curve to interpolate and extrapolate the savings along a continuous range, Figure 6. To project the spread of hours per day across cases, we applied over 1,000 randomized simulations of gamma distributions, while varying the center point of the distribution. We chose a gamma distribution because this tends to fit service utilization patterns (i.e. low median use relative to the mean). © 2021 Dobson DaVanzo & Associates, LLC. All Rights Reserved. Figure 6: Estimated Case Savings by Average Hours Per Day of HECH Add-On Source: Dobson | DaVanzo simulation with data from CMS DUA 52219 Figure 7: Example of Gamma Distribution of Simulated HECH Hours Per Day, Centered at 12 hours Per Day Source: Dobson | DaVanzo example gamma distribution
NAHC.org PQHH.org 54 CHOOSE HOME CARE ACT OF 2021 SAVINGS – DOBSON DAVANZO ESTIMATE We varied the center point of the gamma distribution from 4 hours per day to 18 to establish savings estimates for a broad range of assumptions. Ultimately, we used peaks of 10-12 hours of care per day to estimate savings. Based on these analyses, we identified 12 hours as the realistic maximum benefit and this approach allows for potential outliers who would exhaust the benefit early. Findings To estimate the potential impact and reach of the HECH add-on benefit as proposed, we applied the CACEP2 database and draft Choose Home Care Act of 2020 rule text to identify SNF cases that could potentially be appropriate HECH cases. We then adjusted the payment levels found in the CACEP2 database (2016) with 2020 payment levels and to address payment system updates (e.g. PDGM, PDPM). We evaluated the net impact of a potential HECH implementation approach with several criteria in mind: 1) what is the expected change in Medicare outlays and 2) how would this affect home health case load relative to current volume. Overall, the most critical analytic assumption is how each day of SNF institutional care would translate to hours of care in HECH. After establishing payment rates and defining overlapping cases, we ran deterministic simulations of three distinct translation patterns (i.e., how SNF length of stay relates to HECH payment group – 8, 12 and 24 hours of HECH care to a SNF day) to establish an equation relating expected savings by hours of service per day (see Figure 6) accounting for the actual distribution of SNF case lengths of stay. We then ran thousands of simulations allowing for random variation in hours per day (in a gamma distribution, as in Figure 7) to estimate ranges of savings. Thus, savings are estimated from a combination of real-world variation in SNF length of stay and random variation in the relationship between the SNF length of stay and number of hours applied under the HECH model. Last, we applied the 2020 Congressional Budget Office SNF Medicare baseline to estimate long-term savings. These estimates were made prior to broad understanding of the effects of COVID-19 on the healthcare system. While we did examine early action 2020 claims (and found SNFs with 19% reduced volume but 1.5% increased payments in the first 6 months of 2020 relative to 2019), we ultimately did not alter the 10-year CBO outlook from which we draw savings estimates. Key findings: SNF cases for HECH add-on consideration: 17.9% of included 1st PAC CACEP2 SNF cases (198k), 13.2% of simulated 2020 SNF payments ($2.2B). Substitutions would increase home health 1st PAC case volume by about 20.7%. Total spending under the HECH add-on range depends on assumptions; applying a gamma distribution within a monte carlo framework and varying assumptions, we estimate this could generate savings from $144-247M (6.5-11.1% savings on matched cases) per year. These annual savings would accrue to $1.6-2.8B over ten years. This represents a 0.5-0.9% overall reduction in relative to SNF expenditures over the period. © 2021 Dobson DaVanzo & Associates, LLC. All Rights Reserved.
NAHC.org PQHH.org 55 CHOOSE HOME CARE ACT OF 2021 SAVINGS – DOBSON DAVANZO ESTIMATE Discussion The HECH add-on would meaningfully expand the Medicare home health benefit and allow expanded choice of care setting for qualifying beneficiaries, specifically allowing more beneficiaries to remain in their place of residence following a hospital discharge. This is particularly important during the ongoing COVID-19 public health emergencies, wherein poor infection control in SNFs and nursing homes has been a contributing factor in patient mortality. In simulations, the HECH add-on could also provide significant Medicare savings when substituting for SNF institutional care. There are a few points of caution. One is that the HECH add-on payment structure where payments are based on achievement of utilization thresholds engenders a key criticism of the historic HH PPS HHRG system. The HECH add-on payment levels could invite threshold effects that could partially reduce savings and yield program integrity inquiries. Second, we made multiple analytic assumptions to identify appropriate patients and simulate the care they might need under the HECH add-on if they substitute this for SNF institutional care. We assume that patients and their providers, discharge planners, and caregivers will work together to make clinically appropriate judgements and will understand the limitations (and care implications there-of) of the new benefit when they make such decisions. We simulated this in a relatively nuanced way by limiting SNF substitution cases to those with length of stay of 30 days or shorter, setting a maximum level of assessed functional dependence, and requiring some manner of family or caregiver involvement. Last, we did not estimate the pent-up demand for this service among current 1st PAC home health users (e.g. what portion of current utilizers pay for a HECH-like service out of pocket or utilize informal caregivers for that role). Estimated savings are predicated on the substitution for SNF institutional stays. HECH add-ons to current home health cases would not generate Medicare savings unless they accrued through lower service use (e.g. reduced readmissions or other setting use), though it would still provide much-expanded home services to beneficiaries, potentially offsetting privately paid nursing and/or unpaid informal caregiving. © 2021 Dobson DaVanzo & Associates, LLC. All Rights Reserved.

56


