UNITED STATES
SECURITIES AND EXCHANGE COMMISSION
Washington, D.C. 20549
FORM N-CSR
CERTIFIED SHAREHOLDER REPORT OF REGISTERED
MANAGEMENT INVESTMENT COMPANIES
Investment Company Act file number 811-21667
Fidelity Central Investment Portfolios LLC
(Exact name of registrant as specified in charter)
245 Summer St., Boston, MA 02210
(Address of principal executive offices) (Zip code)
Nicole Macarchuk, Secretary
245 Summer St.
Boston, Massachusetts 02210
(Name and address of agent for service)
Registrant's telephone number, including area code:
617-563-7000
| |
Date of fiscal year end: | June 30 |
|
|
Date of reporting period: | December 31, 2024 |
Item 1.
Reports to Stockholders
| |
| | SEMI-ANNUAL SHAREHOLDER REPORT | AS OF DECEMBER 31, 2024 | |
| | Fidelity® U.S. Equity Central Fund Fidelity® U.S. Equity Central Fund true |
| | | |
This semi-annual shareholder report contains information about Fidelity® U.S. Equity Central Fund for the period July 1, 2024 to December 31, 2024. You can find additional information about the Fund at fundresearch.fidelity.com/prospectus/sec. You can also request this information by contacting us at 1-800-544-8544.
What were your Fund costs for the last six months?(based on hypothetical $10,000 investment)
| | Costs of a $10,000 investment | Costs paid as a percentage of a $10,000 investment | |
| Fidelity® U.S. Equity Central Fund | $ 0 A | 0.00%B | |
A Amount represents less than $.50
B Amount represents less than 0.005%
Key Fund Statistics(as of December 31, 2024)
KEY FACTS | | |
| Fund Size | $18,630,023,282 | |
| Number of Holdings | 385 | |
| Portfolio Turnover | 54% | |
What did the Fund invest in?
(as of December 31, 2024)
MARKET SECTORS (% of Fund's net assets) | | |
| Information Technology | 30.9 | |
| Financials | 12.6 | |
| Consumer Discretionary | 10.4 | |
| Health Care | 9.5 | |
| Communication Services | 8.9 | |
| Industrials | 8.0 | |
| Consumer Staples | 5.4 | |
| Energy | 3.0 | |
| Utilities | 2.0 | |
| Real Estate | 2.0 | |
| Materials | 1.9 | |
| |
| Common Stocks | 94.4 |
| Preferred Stocks | 0.2 |
| Bonds | 0.0 |
| Short-Term Investments and Net Other Assets (Liabilities) | 5.4 |
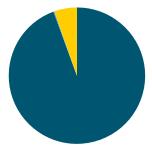
ASSET ALLOCATION (% of Fund's net assets) |
|
| | Common Stocks - 94.4 |
| | Preferred Stocks - 0.2 |
| | Bonds - 0.0 |
| | Short-Term Investments and Net Other Assets (Liabilities) - 5.4 |
| |
| United States | 95.2 |
| Canada | 1.2 |
| Taiwan | 0.8 |
| United Kingdom | 0.5 |
| Netherlands | 0.4 |
| Puerto Rico | 0.3 |
| Belgium | 0.2 |
| Ireland | 0.2 |
| France | 0.2 |
| Others | 1.0 |
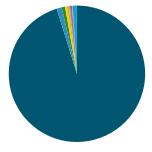
GEOGRAPHIC DIVERSIFICATION (% of Fund's net assets) |
|
| | United States - 95.2 |
| | Canada - 1.2 |
| | Taiwan - 0.8 |
| | United Kingdom - 0.5 |
| | Netherlands - 0.4 |
| | Puerto Rico - 0.3 |
| | Belgium - 0.2 |
| | Ireland - 0.2 |
| | France - 0.2 |
| | Others - 1.0 |
| |
TOP HOLDINGS(% of Fund's net assets) | | |
| Microsoft Corp | 7.3 | |
| Apple Inc | 6.8 | |
| NVIDIA Corp | 6.7 | |
| Alphabet Inc Class A | 4.5 | |
| Amazon.com Inc | 4.3 | |
| Meta Platforms Inc Class A | 2.5 | |
| Tesla Inc | 1.7 | |
| Exxon Mobil Corp | 1.4 | |
| UnitedHealth Group Inc | 1.1 | |
| Boston Scientific Corp | 1.1 | |
| | 37.4 | |
| Fidelity, the Fidelity Investments Logo and all other Fidelity trademarks or service marks used herein are trademarks or service marks of FMR LLC. Any third-party marks that are used herein are trademarks or service marks of their respective owners. © 2025 FMR LLC. All rights reserved. |
| | For additional information about the Fund; including its prospectus, financial information, holdings and proxy information, scan the QR code or visit fundresearch.fidelity.com/prospectus/sec 1.9915172.100 6211-TSRS-0225 |
Item 2.
Code of Ethics
Not applicable.
Item 3.
Audit Committee Financial Expert
Not applicable.
Item 4.
Principal Accountant Fees and Services
Not applicable.
Item 5.
Audit Committee of Listed Registrants
Not applicable.
Item 6.
Investments
(a)
Not applicable.
(b)
Not applicable
Item 7.
Financial Statements and Financial Highlights for Open-End Management Investment Companies
Fidelity® U.S. Equity Central Fund
Semi-Annual Report
December 31, 2024
Contents
To view a fund's proxy voting guidelines and proxy voting record for the 12-month period ended June 30, visit http://www.fidelity.com/proxyvotingresults or visit the Securities and Exchange Commission's (SEC) web site at http://www.sec.gov.
You may also call 1-800-544-8544 to request a free copy of the proxy voting guidelines.
Standard & Poor's, S&P and S&P 500 are registered service marks of The McGraw-Hill Companies, Inc. and have been licensed for use by Fidelity Distributors Corporation.
Other third-party marks appearing herein are the property of their respective owners.
All other marks appearing herein are registered or unregistered trademarks or service marks of FMR LLC or an affiliated company. © 2025 FMR LLC. All rights reserved.
A fund files its complete schedule of portfolio holdings with the SEC for the first and third quarters of each fiscal year on Form N-PORT. Forms N-PORT are available on the SEC's web site at http://www.sec.gov. A fund's Forms N-PORT may be reviewed and copied at the SEC's Public Reference Room in Washington, DC. Information regarding the operation of the SEC's Public Reference Room may be obtained by calling 1-800-SEC-0330.
Item 7: Consolidated Financial Statements and Consolidated Financial Highlights for Open-End Management Investment Companies (Semi-Annual Report)
Fidelity® U.S. Equity Central Fund
Consolidated Schedule of Investments December 31, 2024 (Unaudited)
Showing Percentage of Net Assets
| Common Stocks - 94.4% |
| | | Shares | Value ($) |
| BAILIWICK OF JERSEY - 0.1% | | | |
| Consumer Discretionary - 0.1% | | | |
| Automobile Components - 0.1% | | | |
| Aptiv PLC | | 356,600 | 21,567,168 |
| BELGIUM - 0.2% | | | |
| Health Care - 0.2% | | | |
| Pharmaceuticals - 0.2% | | | |
| UCB SA | | 228,000 | 45,392,604 |
| BRAZIL - 0.1% | | | |
| Materials - 0.1% | | | |
| Metals & Mining - 0.1% | | | |
| Wheaton Precious Metals Corp (United States) | | 218,721 | 12,300,869 |
| CANADA - 1.2% | | | |
| Consumer Discretionary - 0.2% | | | |
| Hotels, Restaurants & Leisure - 0.2% | | | |
| Restaurant Brands International Inc | | 460,900 | 30,040,503 |
| Consumer Staples - 0.1% | | | |
| Consumer Staples Distribution & Retail - 0.1% | | | |
| Alimentation Couche-Tard Inc | | 266,406 | 14,774,696 |
| Energy - 0.7% | | | |
| Oil, Gas & Consumable Fuels - 0.7% | | | |
| Africa Oil Corp | | 7,262,257 | 9,952,796 |
| Athabasca Oil Corp (b) | | 5,658,000 | 20,979,610 |
| Imperial Oil Ltd | | 762,300 | 46,980,527 |
| MEG Energy Corp | | 2,186,950 | 35,905,263 |
| South Bow Corp | | 352,100 | 8,308,624 |
| | | | 122,126,820 |
| Financials - 0.2% | | | |
| Insurance - 0.2% | | | |
| Fairfax Financial Holdings Ltd Subordinate Voting Shares | | 26,706 | 37,157,466 |
| Health Care - 0.0% | | | |
| Biotechnology - 0.0% | | | |
| Xenon Pharmaceuticals Inc (b) | | 287,247 | 11,260,082 |
| Information Technology - 0.0% | | | |
| IT Services - 0.0% | | | |
| Shopify Inc Class A (United States) (b) | | 43,037 | 4,576,124 |
| Software - 0.0% | | | |
| Constellation Software Inc/Canada warrants 3/31/2040 (b)(c) | | 9,990 | 1 |
TOTAL INFORMATION TECHNOLOGY | | | 4,576,125 |
| | | | |
| Materials - 0.0% | | | |
| Metals & Mining - 0.0% | | | |
| Teck Resources Ltd Class B (United States) | | 131,100 | 5,313,483 |
| TOTAL CANADA | | | 225,249,175 |
| CHINA - 0.1% | | | |
| Health Care - 0.0% | | | |
| Pharmaceuticals - 0.0% | | | |
| Chime Biologics Wuhan Co Ltd (b)(c) | | 1,008,062 | 10 |
| Information Technology - 0.1% | | | |
| Semiconductors & Semiconductor Equipment - 0.1% | | | |
| NXP Semiconductors NV | | 56,961 | 11,839,344 |
| TOTAL CHINA | | | 11,839,354 |
| CONGO DEMOCRATIC REPUBLIC OF - 0.0% | | | |
| Materials - 0.0% | | | |
| Metals & Mining - 0.0% | | | |
| Ivanhoe Mine Ltd Class A (b) | | 762,100 | 9,044,785 |
| DENMARK - 0.2% | | | |
| Health Care - 0.2% | | | |
| Biotechnology - 0.2% | | | |
| Ascendis Pharma A/S ADR (b) | | 208,000 | 28,635,360 |
| FINLAND - 0.0% | | | |
| Consumer Discretionary - 0.0% | | | |
| Textiles, Apparel & Luxury Goods - 0.0% | | | |
| Amer Sports Inc | | 150,400 | 4,205,184 |
| FRANCE - 0.2% | | | |
| Information Technology - 0.2% | | | |
| IT Services - 0.2% | | | |
| Capgemini SE | | 210,012 | 34,300,779 |
| GERMANY - 0.0% | | | |
| Health Care - 0.0% | | | |
| Biotechnology - 0.0% | | | |
| BioNTech SE ADR (b) | | 70,000 | 7,976,500 |
| GREECE - 0.1% | | | |
| Financials - 0.1% | | | |
| Banks - 0.1% | | | |
| Piraeus Financial Holdings SA | | 2,713,502 | 10,800,666 |
| IRELAND - 0.2% | | | |
| Financials - 0.2% | | | |
| Banks - 0.1% | | | |
| Bank of Ireland Group PLC | | 2,626,500 | 23,958,132 |
| Financial Services - 0.1% | | | |
| Circle Internet Financial LLC (c) | | 388,096 | 11,755,428 |
| Circle Internet Financial LLC (c) | | 160,054 | 4,848,036 |
| | | | 16,603,464 |
| TOTAL IRELAND | | | 40,561,596 |
| MAURITIUS - 0.0% | | | |
| Financials - 0.0% | | | |
| Financial Services - 0.0% | | | |
| Jumo World Holding Limited (b)(c)(d) | | 999,839 | 1,779,713 |
| Jumo World Ltd (b)(c) | | 998 | 0 |
| | | | |
| TOTAL MAURITIUS | | | 1,779,713 |
| NETHERLANDS - 0.4% | | | |
| Health Care - 0.4% | | | |
| Biotechnology - 0.4% | | | |
| Argenx SE ADR (b) | | 90,000 | 55,350,000 |
| Merus NV (b) | | 350,000 | 14,717,500 |
| | | | |
| TOTAL NETHERLANDS | | | 70,067,500 |
| PORTUGAL - 0.2% | | | |
| Energy - 0.2% | | | |
| Oil, Gas & Consumable Fuels - 0.2% | | | |
| Galp Energia SGPS SA | | 1,691,500 | 28,036,069 |
| PUERTO RICO - 0.3% | | | |
| Financials - 0.3% | | | |
| Banks - 0.3% | | | |
| Popular Inc | | 506,300 | 47,622,578 |
| SWITZERLAND - 0.1% | | | |
| Financials - 0.1% | | | |
| Capital Markets - 0.1% | | | |
| UBS Group AG (United States) | | 666,367 | 20,204,247 |
| TAIWAN - 0.8% | | | |
| Health Care - 0.0% | | | |
| Life Sciences Tools & Services - 0.0% | | | |
| Eden Biologics Inc (b)(c) | | 1,008,062 | 0 |
| Information Technology - 0.8% | | | |
| Semiconductors & Semiconductor Equipment - 0.8% | | | |
| Taiwan Semiconductor Manufacturing Co Ltd ADR | | 799,600 | 157,913,004 |
| TOTAL TAIWAN | | | 157,913,004 |
| UNITED KINGDOM - 0.5% | | | |
| Consumer Staples - 0.2% | | | |
| Beverages - 0.1% | | | |
| Diageo PLC | | 765,578 | 24,328,410 |
| Food Products - 0.1% | | | |
| Nomad Foods Ltd | | 738,407 | 12,390,469 |
| Tobacco - 0.0% | | | |
| British American Tobacco PLC ADR | | 226,700 | 8,233,744 |
| Financials - 0.3% | | | |
| Banks - 0.1% | | | |
| Starling Bank Ltd Class D (b)(c)(d) | | 4,618,325 | 14,627,653 |
| Capital Markets - 0.1% | | | |
| London Stock Exchange Group PLC | | 138,000 | 19,479,385 |
| Insurance - 0.1% | | | |
| Beazley PLC | | 1,912,752 | 19,551,699 |
TOTAL FINANCIALS | | | 53,658,737 |
| | | | |
| TOTAL UNITED KINGDOM | | | 98,611,360 |
| UNITED STATES - 89.6% | | | |
| Communication Services - 8.9% | | | |
| Diversified Telecommunication Services - 0.1% | | | |
| AT&T Inc | | 1,012,200 | 23,047,794 |
| GCI Liberty Inc Class A (b)(c)(d) | | 264,647 | 2 |
| | | | 23,047,796 |
| Entertainment - 1.6% | | | |
| Liberty Media Corp-Liberty Formula One Class C (b) | | 70,000 | 6,486,200 |
| Live Nation Entertainment Inc (b) | | 185,600 | 24,035,200 |
| Netflix Inc (b) | | 166,805 | 148,676,633 |
| ROBLOX Corp Class A (b) | | 142,100 | 8,221,906 |
| Take-Two Interactive Software Inc (b) | | 93,200 | 17,156,256 |
| TKO Group Holdings Inc Class A (b) | | 53,012 | 7,533,535 |
| Walt Disney Co/The | | 716,720 | 79,806,772 |
| Warner Bros Discovery Inc (b) | | 1,354,000 | 14,311,780 |
| | | | 306,228,282 |
| Interactive Media & Services - 7.0% | | | |
| Alphabet Inc Class A | | 4,336,736 | 820,944,125 |
| Meta Platforms Inc Class A | | 800,725 | 468,832,495 |
| Reddit Inc Class A | | 51,272 | 8,379,896 |
| Snap Inc Class A (b) | | 515,900 | 5,556,242 |
| | | | 1,303,712,758 |
| Media - 0.2% | | | |
| Fox Corp Class A | | 209,700 | 10,187,227 |
| Liberty Broadband Corp Class A (b) | | 64,643 | 4,806,853 |
| Magnite Inc (b) | | 441,786 | 7,033,233 |
| Trade Desk Inc (The) Class A (b) | | 58,600 | 6,887,258 |
| | | | 28,914,571 |
TOTAL COMMUNICATION SERVICES | | | 1,661,903,407 |
| | | | |
| Consumer Discretionary - 10.1% | | | |
| Automobiles - 1.7% | | | |
| Tesla Inc (b) | | 783,310 | 316,331,910 |
| Broadline Retail - 4.3% | | | |
| Amazon.com Inc (b) | | 3,605,868 | 791,091,381 |
| Etsy Inc (b) | | 134,800 | 7,129,572 |
| | | | 798,220,953 |
| Distributors - 0.1% | | | |
| LKQ Corp | | 441,000 | 16,206,750 |
| Diversified Consumer Services - 0.1% | | | |
| Service Corp International/US | | 254,208 | 20,290,883 |
| Hotels, Restaurants & Leisure - 1.7% | | | |
| Airbnb Inc Class A (b) | | 260,700 | 34,258,587 |
| Booking Holdings Inc | | 6,723 | 33,402,688 |
| Caesars Entertainment Inc (b) | | 280,758 | 9,382,932 |
| Churchill Downs Inc | | 197,763 | 26,409,271 |
| Domino's Pizza Inc | | 79,980 | 33,572,405 |
| DraftKings Inc Class A (b) | | 500,400 | 18,614,880 |
| Dutch Bros Inc Class A (b) | | 149,600 | 7,836,048 |
| Hilton Worldwide Holdings Inc | | 101,584 | 25,107,501 |
| Marriott International Inc/MD Class A1 | | 222,476 | 62,057,456 |
| Red Rock Resorts Inc Class A | | 218,479 | 10,102,469 |
| Starbucks Corp | | 227,900 | 20,795,875 |
| Yum! Brands Inc | | 255,800 | 34,318,128 |
| | | | 315,858,240 |
| Household Durables - 0.0% | | | |
| PulteGroup Inc | | 3,513 | 382,565 |
| Leisure Products - 0.0% | | | |
| Brunswick Corp/DE | | 85,700 | 5,543,076 |
| Specialty Retail - 1.6% | | | |
| Foot Locker Inc (b)(e) | | 301,900 | 6,569,343 |
| Home Depot Inc/The | | 153,734 | 59,800,989 |
| Lowe's Cos Inc | | 609,561 | 150,439,655 |
| Ross Stores Inc | | 270,900 | 40,979,043 |
| TJX Cos Inc/The | | 325,876 | 39,369,080 |
| | | | 297,158,110 |
| Textiles, Apparel & Luxury Goods - 0.6% | | | |
| NIKE Inc Class B | | 607,110 | 45,940,014 |
| PVH Corp | | 311,676 | 32,959,737 |
| Tapestry Inc | | 459,361 | 30,010,054 |
| | | | 108,909,805 |
TOTAL CONSUMER DISCRETIONARY | | | 1,878,902,292 |
| | | | |
| Consumer Staples - 5.1% | | | |
| Beverages - 2.0% | | | |
| Boston Beer Co Inc/The Class A (b) | | 109,417 | 32,822,912 |
| Brown-Forman Corp Class B (e) | | 185,700 | 7,052,886 |
| Celsius Holdings Inc (b) | | 126,700 | 3,337,277 |
| Coca-Cola Co/The | | 1,986,791 | 123,697,608 |
| Constellation Brands Inc Class A | | 200,966 | 44,413,486 |
| Keurig Dr Pepper Inc | | 2,962,871 | 95,167,417 |
| Monster Beverage Corp (b) | | 605,429 | 31,821,348 |
| PepsiCo Inc | | 266,400 | 40,508,784 |
| | | | 378,821,718 |
| Consumer Staples Distribution & Retail - 0.9% | | | |
| Albertsons Cos Inc | | 770,400 | 15,130,656 |
| Costco Wholesale Corp | | 10,300 | 9,437,581 |
| Target Corp | | 345,155 | 46,658,053 |
| Walmart Inc | | 1,010,400 | 91,289,640 |
| | | | 162,515,930 |
| Food Products - 0.7% | | | |
| Archer-Daniels-Midland Co | | 568,600 | 28,725,672 |
| JM Smucker Co | | 305,900 | 33,685,708 |
| Kraft Heinz Co/The | | 386,300 | 11,863,273 |
| Lamb Weston Holdings Inc | | 151,100 | 10,098,013 |
| Mondelez International Inc | | 433,712 | 25,905,618 |
| TreeHouse Foods Inc (b) | | 483,140 | 16,972,708 |
| Tyson Foods Inc Class A | | 91,900 | 5,278,736 |
| | | | 132,529,728 |
| Household Products - 0.9% | | | |
| Energizer Holdings Inc | | 887,977 | 30,981,518 |
| Procter & Gamble Co/The | | 803,093 | 134,638,541 |
| Reynolds Consumer Products Inc | | 109,900 | 2,966,201 |
| | | | 168,586,260 |
| Personal Care Products - 0.4% | | | |
| Estee Lauder Cos Inc/The Class A | | 656,800 | 49,246,864 |
| Kenvue Inc | | 1,416,112 | 30,233,991 |
| | | | 79,480,855 |
| Tobacco - 0.2% | | | |
| Philip Morris International Inc | | 270,953 | 32,609,194 |
TOTAL CONSUMER STAPLES | | | 954,543,685 |
| | | | |
| Energy - 2.1% | | | |
| Energy Equipment & Services - 0.0% | | | |
| Kodiak Gas Services Inc | | 19,975 | 815,579 |
| Weatherford International PLC | | 89,700 | 6,425,211 |
| | | | 7,240,790 |
| Oil, Gas & Consumable Fuels - 2.1% | | | |
| DT Midstream Inc | | 83,315 | 8,284,010 |
| Expand Energy Corp | | 125,536 | 12,497,109 |
| Exxon Mobil Corp | | 2,427,638 | 261,141,020 |
| Marathon Petroleum Corp | | 91,000 | 12,694,500 |
| Shell PLC ADR | | 847,000 | 53,064,550 |
| Targa Resources Corp | | 90,400 | 16,136,400 |
| Valero Energy Corp | | 240,086 | 29,432,143 |
| | | | 393,249,732 |
TOTAL ENERGY | | | 400,490,522 |
| | | | |
| Financials - 11.4% | | | |
| Banks - 4.2% | | | |
| Bancorp Inc/The (b) | | 855,100 | 45,003,913 |
| Bank of America Corp | | 3,209,914 | 141,075,720 |
| Citigroup Inc | | 1,366,733 | 96,204,336 |
| East West Bancorp Inc | | 82,427 | 7,893,210 |
| JPMorgan Chase & Co | | 398,544 | 95,534,982 |
| KeyCorp | | 1,572,741 | 26,956,781 |
| M&T Bank Corp | | 261,223 | 49,112,536 |
| Synovus Financial Corp | | 170,600 | 8,739,838 |
| Truist Financial Corp | | 785,400 | 34,070,652 |
| US Bancorp | | 1,789,483 | 85,590,972 |
| Wells Fargo & Co | | 2,666,087 | 187,265,951 |
| | | | 777,448,891 |
| Capital Markets - 2.8% | | | |
| Bank of New York Mellon Corp/The | | 535,301 | 41,127,176 |
| Blackrock Inc | | 26,200 | 26,857,882 |
| Cboe Global Markets Inc | | 157,830 | 30,839,982 |
| Charles Schwab Corp/The | | 483,200 | 35,761,632 |
| Coinbase Global Inc Class A (b) | | 34,700 | 8,616,010 |
| Intercontinental Exchange Inc | | 351,200 | 52,332,312 |
| LPL Financial Holdings Inc | | 145,936 | 47,649,563 |
| MarketAxess Holdings Inc | | 213,747 | 48,315,372 |
| Morgan Stanley | | 737,295 | 92,692,727 |
| Northern Trust Corp | | 320,213 | 32,821,833 |
| State Street Corp | | 511,500 | 50,203,725 |
| StepStone Group Inc rights 12/31/2038 (b)(c) | | 18,125 | 1,313,519 |
| Tradeweb Markets Inc Class A | | 137,700 | 18,027,684 |
| Virtu Financial Inc Class A | | 1,084,718 | 38,702,738 |
| | | | 525,262,155 |
| Consumer Finance - 0.3% | | | |
| Discover Financial Services | | 251,479 | 43,563,707 |
| OneMain Holdings Inc | | 313,204 | 16,327,325 |
| | | | 59,891,032 |
| Financial Services - 2.3% | | | |
| Affirm Holdings Inc Class A (b) | | 134,100 | 8,166,690 |
| Apollo Global Management Inc | | 298,040 | 49,224,286 |
| AvidXchange Holdings Inc (b) | | 60,773 | 628,393 |
| Berkshire Hathaway Inc Class A (b) | | 41 | 27,917,720 |
| Block Inc Class A (b) | | 369,392 | 31,394,626 |
| Fiserv Inc (b) | | 333,636 | 68,535,507 |
| Mastercard Inc Class A | | 175,744 | 92,541,518 |
| PayPal Holdings Inc (b) | | 194,100 | 16,566,435 |
| UWM Holdings Corp Class A | | 107,318 | 629,957 |
| Visa Inc Class A | | 402,457 | 127,192,510 |
| | | | 422,797,642 |
| Insurance - 1.8% | | | |
| Arthur J Gallagher & Co | | 162,531 | 46,134,424 |
| Chubb Ltd | | 294,652 | 81,412,348 |
| Hartford Financial Services Group Inc/The | | 382,847 | 41,883,462 |
| Marsh & McLennan Cos Inc | | 353,158 | 75,014,291 |
| Reinsurance Group of America Inc | | 80,406 | 17,177,134 |
| The Travelers Companies, Inc. | | 185,100 | 44,588,739 |
| Unum Group | | 308,045 | 22,496,526 |
| Willis Towers Watson PLC | | 16,918 | 5,299,394 |
| | | | 334,006,318 |
TOTAL FINANCIALS | | | 2,119,406,038 |
| | | | |
| Health Care - 8.5% | | | |
| Biotechnology - 1.4% | | | |
| AbbVie Inc | | 76,000 | 13,505,200 |
| Alnylam Pharmaceuticals Inc (b) | | 114,355 | 26,908,875 |
| Cargo Therapeutics Inc (b) | | 334,300 | 4,820,606 |
| Caris Life Sciences Inc (b)(c)(d) | | 227,063 | 653,941 |
| Crinetics Pharmaceuticals Inc (b) | | 129,135 | 6,602,673 |
| Cytokinetics Inc (b) | | 175,000 | 8,232,000 |
| Exact Sciences Corp (b) | | 590,000 | 33,152,100 |
| Gilead Sciences Inc | | 310,000 | 28,634,700 |
| Janux Therapeutics Inc (b) | | 228,000 | 12,207,120 |
| Keros Therapeutics Inc (b) | | 170,000 | 2,691,100 |
| Legend Biotech Corp ADR (b) | | 800,000 | 26,032,000 |
| MoonLake Immunotherapeutics Class A (b) | | 210,000 | 11,371,500 |
| Nurix Therapeutics Inc (b) | | 500,000 | 9,420,000 |
| Nuvalent Inc Class A (b) | | 170,000 | 13,307,600 |
| Regeneron Pharmaceuticals Inc (b) | | 50,000 | 35,616,500 |
| Spyre Therapeutics Inc (b) | | 8,480 | 197,414 |
| Vaxcyte Inc (b) | | 230,167 | 18,841,471 |
| | | | 252,194,800 |
| Health Care Equipment & Supplies - 3.0% | | | |
| Boston Scientific Corp (b) | | 2,213,716 | 197,729,113 |
| Glaukos Corp (b) | | 163,550 | 24,522,687 |
| Inspire Medical Systems Inc (b) | | 106,760 | 19,791,169 |
| Insulet Corp (b) | | 240,059 | 62,672,203 |
| Intuitive Surgical Inc (b) | | 49,500 | 25,837,020 |
| Masimo Corp (b) | | 405,000 | 66,946,500 |
| Medical Microinstruments Inc/Italy warrants 2/16/2031 (b)(c)(d) | | 4,627 | 56,820 |
| Penumbra Inc (b) | | 395,000 | 93,804,600 |
| Stryker Corp | | 184,000 | 66,249,200 |
| | | | 557,609,312 |
| Health Care Providers & Services - 2.0% | | | |
| Cigna Group/The | | 114,000 | 31,479,960 |
| CVS Health Corp | | 490,000 | 21,996,100 |
| LifeStance Health Group Inc (b) | | 1,674,283 | 12,339,466 |
| McKesson Corp | | 64,000 | 36,474,240 |
| Molina Healthcare Inc (b) | | 58,764 | 17,103,262 |
| Privia Health Group Inc (b) | | 1,280,000 | 25,024,000 |
| Surgery Partners Inc (b) | | 980,409 | 20,755,259 |
| UnitedHealth Group Inc | | 420,000 | 212,461,200 |
| | | | 377,633,487 |
| Health Care Technology - 0.1% | | | |
| Phreesia Inc (b) | | 440,000 | 11,070,400 |
| Veeva Systems Inc Class A (b) | | 120,000 | 25,230,000 |
| | | | 36,300,400 |
| Life Sciences Tools & Services - 1.1% | | | |
| 10X Genomics Inc Class A (b) | | 840,000 | 12,062,400 |
| Bruker Corp | | 281,680 | 16,512,082 |
| Danaher Corp | | 410,000 | 94,115,500 |
| Thermo Fisher Scientific Inc | | 105,000 | 54,624,150 |
| West Pharmaceutical Services Inc | | 60,000 | 19,653,600 |
| | | | 196,967,732 |
| Pharmaceuticals - 0.9% | | | |
| Eli Lilly & Co | | 155,000 | 119,660,000 |
| Merck & Co Inc | | 390,000 | 38,797,200 |
| Royalty Pharma PLC Class A | | 340,000 | 8,673,400 |
| | | | 167,130,600 |
TOTAL HEALTH CARE | | | 1,587,836,331 |
| | | | |
| Industrials - 8.0% | | | |
| Aerospace & Defense - 2.3% | | | |
| Axon Enterprise Inc (b) | | 21,619 | 12,848,604 |
| Boeing Co (b) | | 452,220 | 80,042,940 |
| GE Aerospace | | 683,600 | 114,017,644 |
| General Dynamics Corp | | 37,405 | 9,855,843 |
| HEICO Corp Class A | | 78,070 | 14,527,266 |
| Howmet Aerospace Inc | | 514,800 | 56,303,676 |
| Lockheed Martin Corp | | 96,937 | 47,105,566 |
| Northrop Grumman Corp | | 6,587 | 3,091,213 |
| RTX Corp | | 174,900 | 20,239,428 |
| Standardaero Inc (e) | | 13,120 | 324,851 |
| TransDigm Group Inc | | 46,000 | 58,294,880 |
| | | | 416,651,911 |
| Building Products - 0.8% | | | |
| AZEK Co Inc/The Class A (b) | | 659,292 | 31,296,591 |
| Carlisle Cos Inc | | 21,438 | 7,907,192 |
| Fortune Brands Innovations Inc | | 96,300 | 6,580,179 |
| Trane Technologies PLC | | 256,910 | 94,889,709 |
| | | | 140,673,671 |
| Construction & Engineering - 0.2% | | | |
| EMCOR Group Inc | | 6,857 | 3,112,392 |
| Quanta Services Inc | | 110,800 | 35,018,341 |
| WillScot Holdings Corp (b) | | 211,743 | 7,082,803 |
| | | | 45,213,536 |
| Electrical Equipment - 1.1% | | | |
| AMETEK Inc | | 496,632 | 89,522,884 |
| Eaton Corp PLC | | 192,765 | 63,972,921 |
| GE Vernova Inc | | 176,450 | 58,039,698 |
| | | | 211,535,503 |
| Ground Transportation - 0.8% | | | |
| CSX Corp | | 1,271,378 | 41,027,368 |
| Old Dominion Freight Line Inc | | 316,428 | 55,817,899 |
| Uber Technologies Inc (b) | | 268,200 | 16,177,824 |
| Union Pacific Corp | | 194,400 | 44,330,976 |
| | | | 157,354,067 |
| Machinery - 2.6% | | | |
| Caterpillar Inc | | 178,683 | 64,819,045 |
| Chart Industries Inc (b) | | 41,746 | 7,966,807 |
| Deere & Co | | 112,253 | 47,561,596 |
| Dover Corp | | 422,759 | 79,309,588 |
| Fortive Corp | | 440,694 | 33,052,050 |
| Ingersoll Rand Inc | | 924,107 | 83,594,719 |
| Parker-Hannifin Corp | | 176,200 | 112,068,487 |
| Westinghouse Air Brake Technologies Corp | | 233,603 | 44,288,793 |
| | | | 472,661,085 |
| Passenger Airlines - 0.0% | | | |
| Delta Air Lines Inc | | 66,500 | 4,023,250 |
| Professional Services - 0.0% | | | |
| Dun & Bradstreet Holdings Inc | | 82,490 | 1,027,825 |
| Trading Companies & Distributors - 0.2% | | | |
| FTAI Aviation Ltd | | 27,041 | 3,894,986 |
| Watsco Inc | | 73,200 | 34,688,748 |
| | | | 38,583,734 |
TOTAL INDUSTRIALS | | | 1,487,724,582 |
| | | | |
| Information Technology - 29.8% | | | |
| Communications Equipment - 0.5% | | | |
| Arista Networks Inc | | 217,015 | 23,986,668 |
| Cisco Systems Inc | | 1,247,816 | 73,870,707 |
| | | | 97,857,375 |
| Electronic Equipment, Instruments & Components - 0.1% | | | |
| Amphenol Corp Class A | | 209,493 | 14,549,289 |
| IT Services - 0.9% | | | |
| Cognizant Technology Solutions Corp Class A | | 165,713 | 12,743,330 |
| EPAM Systems Inc (b) | | 177,228 | 41,439,451 |
| Gartner Inc (b) | | 25,527 | 12,367,066 |
| MongoDB Inc Class A (b) | | 239,199 | 55,687,919 |
| Okta Inc Class A (b) | | 238,161 | 18,767,087 |
| Snowflake Inc Class A (b) | | 93,554 | 14,445,673 |
| Twilio Inc Class A (b) | | 160,404 | 17,336,464 |
| X Holdings Corp Class A (b)(c)(d) | | 31,890 | 973,602 |
| | | | 173,760,592 |
| Semiconductors & Semiconductor Equipment - 9.9% | | | |
| Advanced Micro Devices Inc (b) | | 524,709 | 63,379,600 |
| Analog Devices Inc | | 686,661 | 145,887,996 |
| Astera Labs Inc (b) | | 83,492 | 11,058,515 |
| Broadcom Inc | | 419,113 | 97,167,158 |
| Entegris Inc (e) | | 119,035 | 11,791,607 |
| Lam Research Corp | | 128,431 | 9,276,571 |
| Lattice Semiconductor Corp (b) | | 82,475 | 4,672,209 |
| Marvell Technology Inc | | 1,029,244 | 113,680,000 |
| Microchip Technology Inc | | 83,267 | 4,775,362 |
| Micron Technology Inc | | 1,303,958 | 109,741,105 |
| NVIDIA Corp | | 9,291,722 | 1,247,785,348 |
| ON Semiconductor Corp (b) | | 463,082 | 29,197,320 |
| | | | 1,848,412,791 |
| Software - 11.6% | | | |
| Adobe Inc (b) | | 281,100 | 124,999,548 |
| AppLovin Corp Class A (b) | | 44,100 | 14,280,903 |
| Atlassian Corp Class A (b) | | 92,284 | 22,460,080 |
| Autodesk Inc (b) | | 172,229 | 50,905,726 |
| BILL Holdings Inc (b) | | 55,880 | 4,733,595 |
| BlackLine Inc (b) | | 620,113 | 37,678,066 |
| Cadence Design Systems Inc (b) | | 88,310 | 26,533,623 |
| Datadog Inc Class A (b) | | 220,189 | 31,462,806 |
| Elastic NV (b) | | 425,165 | 42,125,348 |
| Five9 Inc (b) | | 1,552,461 | 63,092,015 |
| Gen Digital Inc | | 34,681 | 949,565 |
| HubSpot Inc (b) | | 112,724 | 78,542,701 |
| Microsoft Corp | | 3,162,142 | 1,332,842,853 |
| OpenAI Global LLC rights (b)(c)(d) | | 1,650,181 | 1,650,180 |
| Oracle Corp | | 18,165 | 3,027,016 |
| Palantir Technologies Inc Class A (b) | | 85,300 | 6,451,239 |
| Palo Alto Networks Inc (b) | | 80,004 | 14,557,528 |
| Salesforce Inc | | 359,766 | 120,280,567 |
| Servicenow Inc (b) | | 9,268 | 9,825,192 |
| Tenable Holdings Inc (b) | | 1,119,083 | 44,069,489 |
| Unity Software Inc (b) | | 329,245 | 7,398,135 |
| Workday Inc Class A (b) | | 175,991 | 45,410,958 |
| Workiva Inc Class A (b) | | 496,869 | 54,407,156 |
| | | | 2,137,684,289 |
| Technology Hardware, Storage & Peripherals - 6.8% | | | |
| Apple Inc | | 5,088,300 | 1,274,212,086 |
TOTAL INFORMATION TECHNOLOGY | | | 5,546,476,422 |
| | | | |
| Materials - 1.7% | | | |
| Chemicals - 1.2% | | | |
| Air Products and Chemicals Inc | | 94,489 | 27,405,590 |
| Axalta Coating Systems Ltd (b) | | 298,400 | 10,211,248 |
| Balchem Corp | | 67,790 | 11,049,431 |
| Cabot Corp | | 62,327 | 5,691,078 |
| Chemours Co/The | | 348,900 | 5,896,410 |
| Corteva Inc | | 313,000 | 17,828,480 |
| Dow Inc | | 295,100 | 11,842,363 |
| Ecolab Inc | | 140,200 | 32,851,664 |
| Element Solutions Inc | | 385,833 | 9,811,733 |
| Linde PLC | | 178,600 | 74,774,463 |
| Sherwin-Williams Co/The | | 29,700 | 10,095,921 |
| Tronox Holdings PLC | | 599,363 | 6,035,585 |
| | | | 223,493,966 |
| Construction Materials - 0.1% | | | |
| CRH PLC | | 11,979 | 1,108,296 |
| Martin Marietta Materials Inc | | 30,922 | 15,971,213 |
| | | | 17,079,509 |
| Containers & Packaging - 0.2% | | | |
| AptarGroup Inc | | 99,237 | 15,590,133 |
| Avery Dennison Corp | | 27,040 | 5,059,995 |
| International Paper Co | | 320,000 | 17,222,400 |
| | | | 37,872,528 |
| Metals & Mining - 0.2% | | | |
| ATI Inc (b) | | 142,447 | 7,840,283 |
| Freeport-McMoRan Inc | | 285,800 | 10,883,264 |
| Hecla Mining Co | | 187,577 | 921,003 |
| Nucor Corp | | 104,500 | 12,196,195 |
| Steel Dynamics Inc | | 94,400 | 10,768,208 |
| | | | 42,608,953 |
TOTAL MATERIALS | | | 321,054,956 |
| | | | |
| Real Estate - 2.0% | | | |
| Health Care REITs - 0.2% | | | |
| Omega Healthcare Investors Inc | | 41,253 | 1,561,426 |
| Ventas Inc | | 671,400 | 39,538,746 |
| | | | 41,100,172 |
| Hotel & Resort REITs - 0.0% | | | |
| Ryman Hospitality Properties Inc | | 40,643 | 4,240,691 |
| Industrial REITs - 0.2% | | | |
| Prologis Inc | | 356,771 | 37,710,695 |
| Terreno Realty Corp | | 86,658 | 5,124,954 |
| | | | 42,835,649 |
| Office REITs - 0.0% | | | |
| Douglas Emmett Inc | | 289,200 | 5,367,552 |
| Real Estate Management & Development - 0.3% | | | |
| Jones Lang LaSalle Inc (b) | | 148,118 | 37,494,591 |
| Zillow Group Inc Class C (b) | | 143,600 | 10,633,580 |
| | | | 48,128,171 |
| Residential REITs - 0.2% | | | |
| Invitation Homes Inc | | 262,757 | 8,400,341 |
| Mid-America Apartment Communities Inc | | 192,500 | 29,754,725 |
| Sun Communities Inc | | 58,200 | 7,156,854 |
| | | | 45,311,920 |
| Retail REITs - 0.3% | | | |
| Curbline Properties Corp | | 108,307 | 2,514,888 |
| Federal Realty Investment Trust | | 156,506 | 17,520,847 |
| Macerich Co/The | | 1,073,500 | 21,384,120 |
| NNN REIT Inc | | 353,800 | 14,452,730 |
| | | | 55,872,585 |
| Specialized REITs - 0.8% | | | |
| American Tower Corp | | 197,400 | 36,205,134 |
| Equinix Inc | | 57,200 | 53,933,308 |
| Public Storage Operating Co | | 114,700 | 34,345,768 |
| | | | 124,484,210 |
TOTAL REAL ESTATE | | | 367,340,950 |
| | | | |
| Utilities - 2.0% | | | |
| Electric Utilities - 1.3% | | | |
| Constellation Energy Corp | | 120,771 | 27,017,680 |
| Duke Energy Corp | | 81,200 | 8,748,488 |
| Edison International | | 264,872 | 21,147,380 |
| Entergy Corp | | 313,200 | 23,746,824 |
| Evergy Inc | | 131,100 | 8,069,205 |
| Eversource Energy | | 148,400 | 8,522,612 |
| Exelon Corp | | 312,800 | 11,773,792 |
| FirstEnergy Corp | | 297,501 | 11,834,590 |
| NextEra Energy Inc | | 610,417 | 43,760,795 |
| NRG Energy Inc | | 38,201 | 3,446,494 |
| PG&E Corp | | 1,911,906 | 38,582,263 |
| Pinnacle West Capital Corp | | 117,300 | 9,943,521 |
| Southern Co/The | | 97,746 | 8,046,451 |
| Xcel Energy Inc | | 277,200 | 18,716,544 |
| | | | 243,356,639 |
| Gas Utilities - 0.0% | | | |
| UGI Corp | | 11,029 | 311,349 |
| Independent Power and Renewable Electricity Producers - 0.2% | | | |
| AES Corp/The | | 795,300 | 10,235,511 |
| Vistra Corp | | 156,078 | 21,518,474 |
| | | | 31,753,985 |
| Multi-Utilities - 0.5% | | | |
| Ameren Corp | | 171,500 | 15,287,510 |
| CenterPoint Energy Inc | | 563,500 | 17,879,855 |
| NiSource Inc | | 414,602 | 15,240,770 |
| Public Service Enterprise Group Inc | | 206,656 | 17,460,365 |
| Sempra | | 381,406 | 33,456,934 |
| | | | 99,325,434 |
TOTAL UTILITIES | | | 374,747,407 |
| | | | |
| TOTAL UNITED STATES | | | 16,700,426,592 |
| ZAMBIA - 0.1% | | | |
| Materials - 0.1% | | | |
| Metals & Mining - 0.1% | | | |
| First Quantum Minerals Ltd (b) | | 795,677 | 10,256,979 |
| TOTAL COMMON STOCKS (Cost $10,068,370,865) | | | 17,586,792,082 |
| | | | |
| Convertible Corporate Bonds - 0.0% |
| | | Principal Amount (a) | Value ($) |
| UNITED STATES - 0.0% | | | |
| Health Care - 0.0% | | | |
| Pharmaceuticals - 0.0% | | | |
Galvanize Therapeutics 6% 2/28/2027 (c)(d) (Cost $973,100) | | 973,100 | 1,077,708 |
| | | | |
| Convertible Preferred Stocks - 0.2% |
| | | Shares | Value ($) |
| CHINA - 0.0% | | | |
| Health Care - 0.0% | | | |
| Health Care Providers & Services - 0.0% | | | |
| dMed Biopharmaceutical Co Ltd Series C (b)(c)(d) | | 416,172 | 3,491,683 |
| UNITED STATES - 0.2% | | | |
| Consumer Discretionary - 0.0% | | | |
| Automobiles - 0.0% | | | |
| Waymo LLC (c)(d) | | 21,928 | 1,702,271 |
| Financials - 0.0% | | | |
| Financial Services - 0.0% | | | |
| Saluda Medical Inc Series E (b)(c)(d) | | 301,188 | 2,036,031 |
| Health Care - 0.2% | | | |
| Biotechnology - 0.2% | | | |
| Asimov Inc Series B (b)(c)(d) | | 35,044 | 986,138 |
| Caris Life Sciences Inc Series D (b)(c)(d) | | 1,077,331 | 3,102,713 |
| Cleerly Inc Series C (b)(c)(d) | | 411,426 | 4,834,256 |
| Element Biosciences Inc Series C (b)(c)(d) | | 195,016 | 1,889,705 |
| ElevateBio LLC Series C (b)(c)(d) | | 626,000 | 1,815,400 |
| Inscripta Inc Series E (b)(c)(d) | | 423,474 | 1,270,422 |
| | | | 13,898,634 |
| Health Care Equipment & Supplies - 0.0% | | | |
| Medical Microinstruments Inc/Italy Series C (c)(d) | | 92,546 | 3,056,794 |
| Health Care Providers & Services - 0.0% | | | |
| Thriveworks Topco LLC (b)(c)(d)(f) | | 141,317 | 640,165 |
| Health Care Technology - 0.0% | | | |
| Aledade Inc Series B1 (b)(c)(d) | | 67,586 | 2,514,200 |
| Aledade Inc Series E1 (b)(c)(d) | | 14,822 | 551,378 |
| Omada Health Inc Series E (b)(c)(d) | | 597,550 | 2,575,441 |
| Wugen Inc Series B (b)(c)(d) | | 155,150 | 592,672 |
| | | | 6,233,691 |
| Pharmaceuticals - 0.0% | | | |
| Galvanize Therapeutics Series B (b)(c)(d) | | 1,112,588 | 834,441 |
TOTAL HEALTH CARE | | | 24,663,725 |
| | | | |
| TOTAL UNITED STATES | | | 28,402,027 |
| TOTAL CONVERTIBLE PREFERRED STOCKS (Cost $54,570,229) | | | 31,893,710 |
| | | | |
| U.S. Treasury Obligations - 0.1% |
| | | Yield (%) (g) | Principal Amount (a) | Value ($) |
| US Treasury Bills 0% 1/2/2025 | | 4.53 | 180,000 | 179,999 |
| US Treasury Bills 0% 1/30/2025 | | 4.47 | 1,280,000 | 1,275,789 |
| US Treasury Bills 0% 1/9/2025 | | 4.59 | 1,510,000 | 1,508,764 |
| US Treasury Bills 0% 2/13/2025 | | 4.45 | 990,000 | 985,104 |
| US Treasury Bills 0% 2/20/2025 | | 4.46 | 1,670,000 | 1,660,507 |
| US Treasury Bills 0% 2/6/2025 (h) | | 4.46 to 4.48 | 9,100,000 | 9,062,641 |
| US Treasury Bills 0% 3/20/2025 | | 4.27 to 4.29 | 7,840,000 | 7,769,965 |
| US Treasury Bills 0% 3/27/2025 (h) | | 4.24 to 4.28 | 2,610,000 | 2,584,484 |
| TOTAL U.S. TREASURY OBLIGATIONS (Cost $25,020,402) | | | | 25,027,253 |
| | | | | |
| Money Market Funds - 1.7% |
| | | Yield (%) | Shares | Value ($) |
| Fidelity Cash Central Fund (i) | | 4.36 | 316,315,941 | 316,379,204 |
| Fidelity Securities Lending Cash Central Fund (i)(j) | | 4.35 | 5,050,795 | 5,051,300 |
| TOTAL MONEY MARKET FUNDS (Cost $321,430,503) | | | | 321,430,504 |
| | | | | |
| TOTAL INVESTMENT IN SECURITIES - 96.4% (Cost $10,470,365,099) | 17,966,221,257 |
NET OTHER ASSETS (LIABILITIES) - 3.6% | 663,802,025 |
| NET ASSETS - 100.0% | 18,630,023,282 |
| | |
| Futures Contracts |
| | Number of contracts | Expiration Date | Notional Amount ($) | Value ($) | Unrealized Appreciation/ (Depreciation) ($) |
| Purchased | | | | | |
| | | | | | |
| Equity Contracts | | | | | |
| CME E-mini S&P 500 Index Contracts (United States) | 2,129 | Mar 2025 | 631,860,588 | 66,794 | 66,794 |
| | | | | | |
| The notional amount of futures purchased as a percentage of Net Assets is 3.4% |
Legend
| (a) | Amount is stated in United States dollars unless otherwise noted. |
| (d) | Restricted securities (including private placements) - Investment in securities not registered under the Securities Act of 1933 (excluding 144A issues). At the end of the period, the value of restricted securities (excluding 144A issues) amounted to $52,713,329 or 0.3% of net assets. |
| (e) | Security or a portion of the security is on loan at period end. |
| (f) | Investment is owned by a wholly-owned subsidiary (Subsidiary) that is treated as a corporation for U.S. tax purposes. |
| (g) | Yield represents either the annualized yield at the date of purchase, or the stated coupon rate, or, for floating and adjustable rate securities, the rate at period end. |
| (h) | Security or a portion of the security was pledged to cover margin requirements for futures contracts. At period end, the value of securities pledged amounted to $3,897,074. |
| (i) | Affiliated fund that is generally available only to investment companies and other accounts managed by Fidelity Investments. The rate quoted is the annualized seven-day yield of the fund at period end. A complete unaudited listing of the fund's holdings as of its most recent quarter end is available upon request. In addition, each Fidelity Central Fund's financial statements are available on the SEC's website or upon request. |
| (j) | Investment made with cash collateral received from securities on loan. |
| Additional information on each restricted holding is as follows: |
| Security | Acquisition Date | Acquisition Cost ($) |
| Aledade Inc Series B1 | 5/07/21 | 2,587,915 |
| | | |
| Aledade Inc Series E1 | 5/20/22 | 738,349 |
| | | |
| Asimov Inc Series B | 10/29/21 | 3,247,902 |
| | | |
| Caris Life Sciences Inc | 10/06/22 | 1,271,553 |
| | | |
| Caris Life Sciences Inc Series D | 5/11/21 | 8,726,381 |
| | | |
| Cleerly Inc Series C | 7/08/22 | 4,846,845 |
| | | |
| dMed Biopharmaceutical Co Ltd Series C | 12/01/20 | 5,910,953 |
| | | |
| Element Biosciences Inc Series C | 6/21/21 | 4,008,885 |
| | | |
| ElevateBio LLC Series C | 3/09/21 | 2,626,070 |
| | | |
| Galvanize Therapeutics 6% 2/28/2027 | 2/28/24 | 973,100 |
| | | |
| Galvanize Therapeutics Series B | 3/29/22 | 1,926,207 |
| | | |
| GCI Liberty Inc Class A | 5/23/23 | 0 |
| | | |
| Inscripta Inc Series E | 3/30/21 | 3,739,275 |
| | | |
| Jumo World Holding Limited | 9/06/23 | 999,839 |
| | | |
| Medical Microinstruments Inc/Italy Series C | 2/16/24 | 3,084,901 |
| | | |
| Medical Microinstruments Inc/Italy warrants 2/16/2031 | 2/16/24 | 0 |
| | | |
| Omada Health Inc Series E | 12/22/21 | 3,582,432 |
| | | |
| OpenAI Global LLC rights | 9/30/24 | 1,650,181 |
| | | |
| Saluda Medical Inc Series E | 4/06/23 | 2,431,732 |
| | | |
| Starling Bank Ltd Class D | 6/18/21 | 8,257,037 |
| | | |
| Thriveworks Topco LLC | 7/23/21 - 2/25/22 | 4,060,362 |
| | | |
| Waymo LLC | 10/18/24 | 1,714,798 |
| | | |
| Wugen Inc Series B | 7/09/21 | 1,203,173 |
| | | |
| X Holdings Corp Class A | 10/27/21 | 2,390,803 |
| | | |
Affiliated Central Funds
Fiscal year to date information regarding the Fund's investments in Fidelity Central Funds, including the ownership percentage, is presented below.
| Affiliate | Value, beginning of period ($) | Purchases ($) | Sales Proceeds ($) | Dividend Income ($) | Realized Gain (loss) ($) | Change in Unrealized appreciation (depreciation) ($) | Value, end of period ($) | Shares, end of period | % ownership, end of period |
| Fidelity Cash Central Fund | 292,864,317 | 2,886,996,359 | 2,863,481,473 | 7,516,563 | - | 1 | 316,379,204 | 316,315,941 | 0.6% |
| Fidelity Securities Lending Cash Central Fund | 22,724,699 | 361,267,517 | 378,940,916 | 30,836 | - | - | 5,051,300 | 5,050,795 | 0.0% |
| Total | 315,589,016 | 3,248,263,876 | 3,242,422,389 | 7,547,399 | - | 1 | 321,430,504 | 321,366,736 | |
| | | | | | | | | | |
Amounts in the dividend income column in the above table include any capital gain distributions from underlying funds, which are presented in the corresponding line item in the Consolidated Statement of Operations, if applicable.
Amounts in the dividend income column for Fidelity Securities Lending Cash Central Fund represents the income earned on investing cash collateral, less rebates paid to borrowers and any lending agent fees associated with the loan, plus any premium payments received for lending certain types of securities.
Amounts included in the purchases and sales proceeds columns may include in-kind transactions, if applicable.
Investment Valuation
The following is a summary of the inputs used, as of December 31, 2024, involving the Fund's assets and liabilities carried at fair value. The inputs or methodology used for valuing securities may not be an indication of the risk associated with investing in those securities. For more information on valuation inputs, and their aggregation into the levels used below, please refer to the Investment Valuation section in the accompanying Notes to Consolidated Financial Statements.
| Valuation Inputs at Reporting Date: |
| Description | Total ($) | Level 1 ($) | Level 2 ($) | Level 3 ($) |
Investments in Securities: | | | | |
|
| Common Stocks | | | | |
Communication Services | 1,661,903,407 | 1,661,903,405 | - | 2 |
Consumer Discretionary | 1,934,715,147 | 1,934,715,147 | - | - |
Consumer Staples | 1,014,271,004 | 989,942,594 | 24,328,410 | - |
Energy | 550,653,411 | 522,617,342 | 28,036,069 | - |
Financials | 2,331,191,041 | 2,266,586,641 | 30,280,051 | 34,324,349 |
Health Care | 1,751,168,387 | 1,750,457,616 | - | 710,771 |
Industrials | 1,487,724,582 | 1,487,724,582 | - | - |
Information Technology | 5,755,105,674 | 5,718,181,112 | 34,300,779 | 2,623,783 |
Materials | 357,971,072 | 357,971,072 | - | - |
Real Estate | 367,340,950 | 367,340,950 | - | - |
Utilities | 374,747,407 | 374,747,407 | - | - |
|
| Convertible Corporate Bonds | | | | |
Health Care | 1,077,708 | - | - | 1,077,708 |
|
| Convertible Preferred Stocks | | | | |
Consumer Discretionary | 1,702,271 | - | - | 1,702,271 |
Financials | 2,036,031 | - | - | 2,036,031 |
Health Care | 28,155,408 | - | - | 28,155,408 |
|
| U.S. Treasury Obligations | 25,027,253 | - | 25,027,253 | - |
|
| Money Market Funds | 321,430,504 | 321,430,504 | - | - |
| Total Investments in Securities: | 17,966,221,257 | 17,753,618,372 | 141,972,562 | 70,630,323 |
Derivative Instruments: Assets | | | | |
Futures Contracts | 66,794 | 66,794 | - | - |
| Total Assets | 66,794 | 66,794 | - | - |
| Total Derivative Instruments: | 66,794 | 66,794 | - | - |
Value of Derivative Instruments
The following table is a summary of the Fund's value of derivative instruments by primary risk exposure as of December 31, 2024. For additional information on derivative instruments, please refer to the Derivative Instruments section in the accompanying Notes to Consolidated Financial Statements.
Primary Risk Exposure / Derivative Type | Value |
| Asset ($) | Liability ($) |
| Equity Risk | | |
Futures Contracts (a) | 66,794 | 0 |
| Total Equity Risk | 66,794 | 0 |
| Total Value of Derivatives | 66,794 | 0 |
(a)Reflects gross cumulative appreciation (depreciation) on futures contracts as presented in the Consolidated Schedule of Investments. In the Consolidated Statement of Assets and Liabilities, the period end daily variation margin is included in receivable or payable for daily variation margin on futures contracts, and the net cumulative appreciation (depreciation) is included in Total accumulated earnings (loss).
Consolidated Financial Statements (Unaudited)
| Consolidated Statement of Assets and Liabilities |
| As of December 31, 2024 (Unaudited) |
| Assets | | | | |
| Investment in securities, at value (including securities loaned of $4,905,836) - See accompanying schedule: | | | | |
Unaffiliated issuers (cost $10,148,934,596) | $ | 17,644,790,753 | | |
Fidelity Central Funds (cost $321,430,503) | | 321,430,504 | | |
| | | | | |
| | | | | |
| Total Investment in Securities (cost $10,470,365,099) | | | $ | 17,966,221,257 |
| Cash | | | | 212,464 |
| Foreign currency held at value (cost $944,127) | | | | 925,890 |
| Receivable for investments sold | | | | 2,326,595,765 |
| Receivable for fund shares sold | | | | 9,136,752 |
| Dividends receivable | | | | 11,603,288 |
| Interest receivable | | | | 49,108 |
| Distributions receivable from Fidelity Central Funds | | | | 1,653,355 |
| Other receivables | | | | 333,178 |
Total assets | | | | 20,316,731,057 |
| Liabilities | | | | |
| Payable for investments purchased | $ | 475,176,528 | | |
| Payable for fund shares redeemed | | 1,206,001,099 | | |
| Payable for daily variation margin on futures contracts | | 440,015 | | |
| Other payables and accrued expenses | | 38,833 | | |
| Collateral on securities loaned | | 5,051,300 | | |
| Total liabilities | | | | 1,686,707,775 |
| Net Assets | | | $ | 18,630,023,282 |
| Net Assets consist of: | | | | |
| Paid in capital | | | $ | 10,375,061,178 |
| Total accumulated earnings (loss) | | | | 8,254,962,104 |
| Net Assets | | | $ | 18,630,023,282 |
Net Asset Value, offering price and redemption price per share ($18,630,023,282 ÷ 136,267,104 shares) | | | $ | 136.72 |
| Consolidated Statement of Operations |
Six months ended December 31, 2024 (Unaudited) |
| Investment Income | | | | |
| Dividends | | | $ | 105,703,846 |
| Interest | | | | 220,322 |
| Income from Fidelity Central Funds (including $30,836 from security lending) | | | | 7,547,399 |
| Total income | | | | 113,471,567 |
| Expenses | | | | |
| Custodian fees and expenses | $ | 51,618 | | |
| Independent trustees' fees and expenses | | 42,604 | | |
| Miscellaneous | | 24 | | |
| Total expenses before reductions | | 94,246 | | |
| Expense reductions | | (1,980) | | |
| Total expenses after reductions | | | | 92,266 |
| Net Investment income (loss) | | | | 113,379,301 |
| Realized and Unrealized Gain (Loss) | | | | |
| Net realized gain (loss) on: | | | | |
| Investment Securities: | | | | |
| Unaffiliated issuers | | 1,366,581,229 | | |
| Foreign currency transactions | | (39,559) | | |
| Futures contracts | | 5,941,250 | | |
| Total net realized gain (loss) | | | | 1,372,482,920 |
| Change in net unrealized appreciation (depreciation) on: | | | | |
| Investment Securities: | | | | |
| Unaffiliated issuers | | 89,660,134 | | |
| Fidelity Central Funds | | 1 | | |
| Assets and liabilities in foreign currencies | | (117,636) | | |
| Futures contracts | | (71,439) | | |
| Total change in net unrealized appreciation (depreciation) | | | | 89,471,060 |
| Net gain (loss) | | | | 1,461,953,980 |
| Net increase (decrease) in net assets resulting from operations | | | $ | 1,575,333,281 |
| Consolidated Statement of Changes in Net Assets |
| |
| | Six months ended December 31, 2024 (Unaudited) | | Year ended June 30, 2024 |
| Increase (Decrease) in Net Assets | | | | |
| Operations | | | | |
| Net investment income (loss) | $ | 113,379,301 | $ | 223,605,804 |
| Net realized gain (loss) | | 1,372,482,920 | | 1,286,911,181 |
| Change in net unrealized appreciation (depreciation) | | 89,471,060 | | 1,900,497,921 |
| Net increase (decrease) in net assets resulting from operations | | 1,575,333,281 | | 3,411,014,906 |
| Distributions to shareholders | | (1,611,493,219) | | (1,060,981,097) |
| | | | | |
| Affiliated share transactions | | | | |
| Proceeds from sales of shares | | 1,120,637,980 | | 903,611,745 |
| Reinvestment of distributions | | 1,611,493,219 | | 1,060,981,097 |
| Cost of shares redeemed | | (3,390,633,304) | | (1,689,398,232) |
| | | | | |
Net increase (decrease) in net assets resulting from share transactions | | (658,502,105) | | 275,194,610 |
| Total increase (decrease) in net assets | | (694,662,043) | | 2,625,228,419 |
| | | | | |
| Net Assets | | | | |
| Beginning of period | | 19,324,685,325 | | 16,699,456,906 |
| End of period | $ | 18,630,023,282 | $ | 19,324,685,325 |
| | | | | |
| Other Information | | | | |
| Shares | | | | |
| Sold | | 7,837,593 | | 7,218,667 |
| Issued in reinvestment of distributions | | 11,272,611 | | 8,850,529 |
| Redeemed | | (24,183,829) | | (13,607,009) |
| Net increase (decrease) | | (5,073,625) | | 2,462,187 |
| | | | | |
Consolidated Financial Highlights
Fidelity® U.S. Equity Central Fund |
| |
| | Six months ended (Unaudited) December 31, 2024 | | Years ended June 30, 2024 | | 2023 | | 2022 | | 2021 A |
Selected Per-Share Data | | | | | | | | | | |
| Net asset value, beginning of period | $ | 136.72 | $ | 120.25 | $ | 102.27 | $ | 132.73 | $ | 100.00 |
| Income from Investment Operations | | | | | | | | | | |
Net investment income (loss) B,C | | .82 | | 1.60 | | 1.47 | | 1.41 | | 1.05 |
| Net realized and unrealized gain (loss) | | 11.16 | | 22.76 | | 19.57 | | (19.85) | | 33.21 |
| Total from investment operations | | 11.98 | | 24.36 | | 21.04 | | (18.44) | | 34.26 |
| Distributions from net investment income | | (1.15) | | (1.62) | | (1.52) | | (1.38) | | (.87) |
| Distributions from net realized gain | | (10.82) | | (6.27) | | (1.54) | | (10.64) | | (.66) |
| Total distributions | | (11.98) D | | (7.89) | | (3.06) | | (12.02) | | (1.53) |
| Net asset value, end of period | $ | 136.72 | $ | 136.72 | $ | 120.25 | $ | 102.27 | $ | 132.73 |
Total Return E,F | | | | 21.24% | | 20.95% | | (15.73)% | | 34.47% |
Ratios to Average Net Assets C,G,H | | | | | | | | | | |
Expenses before reductions I | | -% J | | -% | | -% | | -% | | -% J |
Expenses net of fee waivers, if any I | | | | -% | | -% | | -% | | -% J |
Expenses net of all reductions I | | -% J | | -% | | -% | | -% | | -% J |
| Net investment income (loss) | | 1.15% J | | 1.28% | | 1.34% | | 1.10% | | 1.12% J |
| Supplemental Data | | | | | | | | | | |
| Net assets, end of period (000 omitted) | $ | 18,630,023 | $ | 19,324,685 | $ | 16,699,457 | $ | 16,632,716 | $ | 28,240,621 |
Portfolio turnover rate K | | | | 44% | | 31% | | 34% L | | 47% J,M |
AFor the period September 18, 2020 (commencement of operations) through June 30, 2021.
BCalculated based on average shares outstanding during the period.
CNet investment income (loss) is affected by the timing of the declaration of dividends by any underlying mutual funds or exchange-traded funds (ETFs). Net investment income (loss) of any mutual funds or ETFs is not included in the Fund's net investment income (loss) ratio.
DTotal distributions per share do not sum due to rounding.
ETotal returns for periods of less than one year are not annualized.
FTotal returns would have been lower if certain expenses had not been reduced during the applicable periods shown.
GFees and expenses of any underlying mutual funds or exchange-traded funds (ETFs) are not included in the Fund's expense ratio. The Fund indirectly bears its proportionate share of these expenses. For additional expense information related to investments in Fidelity Central Funds, please refer to the "Investments in Fidelity Central Funds" note found in the Notes to Consolidated Financial Statements section of the most recent Annual or Semi-Annual report.
HExpense ratios reflect operating expenses of the class. Expenses before reductions do not reflect amounts reimbursed, waived, or reduced through arrangements with the investment adviser, brokerage services, or other offset arrangements, if applicable, and do not represent the amount paid by the class during periods when reimbursements, waivers or reductions occur.
IAmount represents less than .005%.
JAnnualized.
KAmount does not include the portfolio activity of any underlying mutual funds or exchange-traded funds (ETFs), derivatives or securities that mature within one year from acquisition.
LPortfolio turnover rate excludes securities received or delivered in-kind.
MThe portfolio turnover rate does not include the assets acquired in the reorganization.
Notes to Consolidated Financial Statements
(Unaudited)For the period ended December 31, 2024
1. Organization.
Fidelity U.S. Equity Central Fund (the Fund) is a fund of Fidelity Central Investment Portfolios LLC (the LLC) and is authorized to issue an unlimited number of shares. Shares of the Fund are only offered to other investment companies and accounts managed by Fidelity Management & Research Company LLC (FMR), or its affiliates (the Investing Funds). The LLC is registered under the Investment Company Act of 1940, as amended (the 1940 Act), as an open-end management investment company organized as a Delaware Limited Liability Company.
2. Investments in Fidelity Central Funds.
Funds may invest in Fidelity Central Funds, which are open-end investment companies generally available only to other investment companies and accounts managed by the investment adviser and its affiliates. The Consolidated Schedule of Investments lists any Fidelity Central Funds held as an investment as of period end, but does not include the underlying holdings of each Fidelity Central Fund. An investing fund indirectly bears its proportionate share of the expenses of the underlying Fidelity Central Funds.
Based on its investment objective, each Fidelity Central Fund may invest or participate in various investment vehicles or strategies that are similar to those of the investing fund. These strategies are consistent with the investment objectives of the investing fund and may involve certain economic risks which may cause a decline in value of each of the Fidelity Central Funds and thus a decline in the value of the investing fund.
| Fidelity Central Fund | Investment Manager | Investment Objective | Investment Practices | Expense RatioA |
| Fidelity Money Market Central Funds | Fidelity Management & Research Company LLC (FMR) | Each fund seeks to obtain a high level of current income consistent with the preservation of capital and liquidity. | Short-term Investments | Less than .005% |
A Expenses expressed as a percentage of average net assets and are as of each underlying Central Fund's most recent annual or semi-annual shareholder report.
A complete unaudited list of holdings for each Fidelity Central Fund is available upon request or at the Securities and Exchange Commission website at www.sec.gov. In addition, the financial statements of the Fidelity Central Funds which contain the significant accounting policies (including investment valuation policies) of those funds, and are not covered by the Report of Independent Registered Public Accounting Firm, are available on the Securities and Exchange Commission website or upon request.
3. Significant Accounting Policies.
The Fund is an investment company and applies the accounting and reporting guidance of the Financial Accounting Standards Board (FASB) Accounting Standards Codification Topic 946 Financial Services - Investment Companies. The consolidated financial statements have been prepared in conformity with accounting principles generally accepted in the United States of America (GAAP), which require management to make certain estimates and assumptions at the date of the consolidated financial statements. Actual results could differ from those estimates. The Fund operates as a single operating segment. The Fund's income, expenses, assets, and performance are regularly monitored and assessed as a whole by the investment adviser and other individuals responsible for oversight functions of the Trust, using the information presented in the financial statements and financial highlights. Subsequent events, if any, through the date that the consolidated financial statements were issued have been evaluated in the preparation of the consolidated financial statements. The Fund's Consolidated Schedule of Investments lists any underlying mutual funds or exchange-traded funds (ETFs) but does not include the underlying holdings of these funds. The following summarizes the significant accounting policies of the Fund:
Investment Valuation. Investments are valued as of 4:00 p.m. Eastern time on the last calendar day of the period. The Board of Directors (the Board) has designated the Fund's investment adviser as the valuation designee responsible for the fair valuation function and performing fair value determinations as needed. The investment adviser has established a Fair Value Committee (the Committee) to carry out the day-to-day fair valuation responsibilities and has adopted policies and procedures to govern the fair valuation process and the activities of the Committee. In accordance with these fair valuation policies and procedures, which have been approved by the Board, the Fund attempts to obtain prices from one or more third party pricing services or brokers to value its investments. When current market prices, quotations or currency exchange rates are not readily available or reliable, investments will be fair valued in good faith by the Committee, in accordance with the policies and procedures. Factors used in determining fair value vary by investment type and may include market or investment specific events, transaction data, estimated cash flows, and market observations of comparable investments. The frequency that the fair valuation procedures are used cannot be predicted and they may be utilized to a significant extent. The Committee manages the Fund's fair valuation practices and maintains the fair valuation policies and procedures. The Fund's investment adviser reports to the Board information regarding the fair valuation process and related material matters.
The Fund categorizes the inputs to valuation techniques used to value its investments into a disclosure hierarchy consisting of three levels as shown below:
Level 1 - unadjusted quoted prices in active markets for identical investments
Level 2 - other significant observable inputs (including quoted prices for similar investments, interest rates, prepayment speeds, etc.)
Level 3 - unobservable inputs (including the Fund's own assumptions based on the best information available)
Valuation techniques used to value the Fund's investments by major category are as follows:
Equity securities, including restricted securities, for which market quotations are readily available, are valued at the last reported sale price or official closing price as reported by a third party pricing service on the primary market or exchange on which they are traded and are categorized as Level 1 in the hierarchy. In the event there were no sales during the day or closing prices are not available, securities are valued at the last quoted bid price or may be valued using the last available price and are generally categorized as Level 2 in the hierarchy. For foreign equity securities, when market or security specific events arise, comparisons to the valuation of American Depositary Receipts (ADRs), futures contracts, Exchange-Traded Funds (ETFs) and certain indexes as well as quoted prices for similar securities may be used and would be categorized as Level 2 in the hierarchy. For equity securities, including restricted securities, where observable inputs are limited, assumptions about market activity and risk are used and these securities may be categorized as Level 3 in the hierarchy.
Debt securities, including restricted securities, are valued based on evaluated prices received from third party pricing services or from brokers who make markets in such securities. Corporate bonds and U.S. government and government agency obligations are valued by pricing services who utilize matrix pricing which considers prepayment speed assumptions, attributes of the collateral, yield or price of bonds of comparable quality, coupon, maturity and type or by broker-supplied prices. When independent prices are unavailable or unreliable, debt securities may be valued utilizing pricing methodologies which consider similar factors that would be used by third party pricing services. Debt securities are generally categorized as Level 2 in the hierarchy but may be Level 3 depending on the circumstances.
Futures contracts are valued at the settlement price established each day by the board of trade or exchange on which they are traded and are categorized as Level 1 in the hierarchy. Investments in open-end mutual funds, including the Fidelity Central Funds, are valued at their closing net asset value (NAV) each business day and are categorized as Level 1 in the hierarchy.
Changes in valuation techniques may result in transfers in or out of an assigned level within the disclosure hierarchy. The aggregate value of investments by input level as of December 31, 2024 is included at the end of the Fund's Consolidated Schedule of Investments.
Foreign Currency. Certain Funds may use foreign currency contracts to facilitate transactions in foreign-denominated securities. Gains and losses from these transactions may arise from changes in the value of the foreign currency or if the counterparties do not perform under the contracts' terms.
Foreign-denominated assets, including investment securities, and liabilities are translated into U.S. dollars at the exchange rates at period end. Purchases and sales of investment securities, income and dividends received, and expenses denominated in foreign currencies are translated into U.S. dollars at the exchange rate in effect on the transaction date.
The effects of exchange rate fluctuations on investments are included with the net realized and unrealized gain (loss) on investment securities. Other foreign currency transactions resulting in realized and unrealized gain (loss) are disclosed separately.
Investment Transactions and Income. For financial reporting purposes, the Fund's investment holdings and NAV include trades executed through the end of the last business day of the period. The NAV per share for processing shareholder transactions is calculated as of the close of business of the New York Stock Exchange (NYSE), normally 4:00 p.m. Eastern time and includes trades executed through the end of the prior business day. Gains and losses on securities sold are determined on the basis of identified cost and include proceeds received from litigation. Commissions paid to certain brokers with whom the investment adviser, or its affiliates, places trades on behalf of a fund include an amount in addition to trade execution, which may be rebated back to a fund. Any such rebates are included in net realized gain (loss) on investments in the Consolidated Statement of Operations. Dividend income is recorded on the ex-dividend date, except for certain dividends from foreign securities where the ex-dividend date may have passed, which are recorded as soon as the Fund is informed of the ex-dividend date. Non-cash dividends included in dividend income, if any, are recorded at the fair market value of the securities received. Income and capital gain distributions from Fidelity Central Funds, if any, are recorded on the ex-dividend date. Certain distributions received by the Fund represent a return of capital or capital gain. The Fund determines the components of these distributions subsequent to the ex-dividend date, based upon receipt of tax filings or other correspondence relating to the underlying investment. These distributions are recorded as a reduction of cost of investments and/or as a realized gain. Interest income is accrued as earned and includes coupon interest and amortization of premium and accretion of discount on debt securities as applicable. Investment income is recorded net of foreign taxes withheld where recovery of such taxes is uncertain. Funds may file withholding tax reclaims in certain jurisdictions to recover a portion of amounts previously withheld. Any withholding tax reclaims income is included in the Consolidated Statement of Operations in dividends. Any receivables for withholding tax reclaims are included in the Consolidated Statement of Assets and Liabilities in dividends receivable.
Expenses. Expenses directly attributable to a fund are charged to that fund. Expenses attributable to more than one fund are allocated among the respective funds on the basis of relative net assets or other appropriate methods. Expenses included in the accompanying consolidated financial statements reflect the expenses of that fund and do not include any expenses associated with any underlying mutual funds or exchange-traded funds. Although not included in a fund's expenses, a fund indirectly bears its proportionate share of these expenses through the net asset value of each underlying mutual fund or exchange-traded fund. Expense estimates are accrued in the period to which they relate and adjustments are made when actual amounts are known.
Income Tax Information and Distributions to Shareholders. Each year, the Fund intends to qualify as a regulated investment company under Subchapter M of the Internal Revenue Code, including distributing substantially all of its taxable income and realized gains. As a result, no provision for U.S. Federal income taxes is required. The Fund files a U.S. federal tax return, in addition to state and local tax returns as required. The Fund's federal income tax returns are subject to examination by the Internal Revenue Service (IRS) for a period of three fiscal years after they are filed. State and local tax returns may be subject to examination for an additional fiscal year depending on the jurisdiction. Foreign taxes are provided for based on the Fund's understanding of the tax rules and rates that exist in the foreign markets in which it invests.
Distributions are declared and recorded on the ex-dividend date. Income and capital gain distributions are determined in accordance with income tax regulations, which may differ from GAAP.
Capital accounts within the consolidated financial statements are adjusted for permanent book-tax differences. These adjustments have no impact on net assets or the results of operations. Capital accounts are not adjusted for temporary book-tax differences which will reverse in a subsequent period.
Book-tax differences are primarily due futures contracts, foreign currency transactions, passive foreign investment companies (PFIC), partnerships and losses deferred due to wash sales.
As of period end, the cost and unrealized appreciation (depreciation) in securities, and derivatives if applicable, for federal income tax purposes were as follows:
| Gross unrealized appreciation | $7,798,360,736 |
| Gross unrealized depreciation | (335,122,359) |
| Net unrealized appreciation (depreciation) | $7,463,238,377 |
| Tax cost | $10,503,049,674 |
Restricted Securities (including Private Placements). Funds may invest in securities that are subject to legal or contractual restrictions on resale. These securities generally may be resold in transactions exempt from registration or to the public if the securities are registered. Disposal of these securities may involve time-consuming negotiations and expense, and prompt sale at an acceptable price may be difficult. Information regarding restricted securities held at period end is included at the end of the Consolidated Schedule of Investments, if applicable.
Consolidated Subsidiary. The Funds included in the table below hold certain investments through a wholly-owned subsidiary ("Subsidiary"), which may be subject to federal and state taxes upon disposition.
As of period end, investments in Subsidiaries were as follows:
| | Amount ($) | % of Net Assets |
| Fidelity U.S. Equity Central Fund | 640,165 | -A |
A Amount represents less than .005%.
The financial statements have been consolidated to include the Subsidiary accounts where applicable. Accordingly, all inter-company transactions and balances have been eliminated.
At period end, any estimated tax liability for these investments is presented as "Deferred taxes" in the Consolidated Statement of Assets and Liabilities and included in "Change in net unrealized appreciation (depreciation) on investment securities" in the Consolidated Statement of Operations. The tax liability incurred may differ materially depending on conditions when these investments are disposed. Any cash held by a Subsidiary is restricted as to its use and is presented as "Restricted cash" in the Consolidated Statement of Assets and Liabilities, if applicable.
New Accounting Pronouncement. FASB Accounting Standards Update (ASU) 2023-07 Segment Reporting (Topic 280): Improvements to Reportable Segment Disclosures became effective in this reporting period. ASU 2023-07 enhances segment information disclosure in the notes to financial statements.
4. Derivative Instruments.
Risk Exposures and the Use of Derivative Instruments. The Fund's investment objectives allow for various types of derivative instruments, including futures contracts. Derivatives are investments whose value is primarily derived from underlying assets, indices or reference rates and may be transacted on an exchange or over-the-counter (OTC). Derivatives may involve a future commitment to buy or sell a specified asset based on specified terms, to exchange future cash flows at periodic intervals based on a notional principal amount, or for one party to make one or more payments upon the occurrence of specified events in exchange for periodic payments from the other party.
Derivatives were used to increase returns and to manage exposure to certain risks as defined below. The success of any strategy involving derivatives depends on analysis of numerous economic factors, and if the strategies for investment do not work as intended, the objectives may not be achieved.
Derivatives were used to increase or decrease exposure to the following risk(s):
| | |
| Equity Risk | Equity risk relates to the fluctuations in the value of financial instruments as a result of changes in market prices (other than those arising from interest rate risk or foreign exchange risk), whether caused by factors specific to an individual investment, its issuer, or all factors affecting all instruments traded in a market or market segment. |
Funds are also exposed to additional risks from investing in derivatives, such as liquidity risk and counterparty credit risk. Liquidity risk is the risk that a fund will be unable to close out the derivative in the open market in a timely manner. Counterparty credit risk is the risk that the counterparty will not be able to fulfill its obligation to a fund. Counterparty credit risk related to exchange-traded contracts may be mitigated by the protection provided by the exchange on which they trade.
Investing in derivatives may involve greater risks than investing in the underlying assets directly and, to varying degrees, may involve risk of loss in excess of any initial investment and collateral received and amounts recognized in the Consolidated Statement of Assets and Liabilities. In addition, there may be the risk that the change in value of the derivative contract does not correspond to the change in value of the underlying instrument.
Futures Contracts. A futures contract is an agreement between two parties to buy or sell a specified underlying instrument for a fixed price at a specified future date. Futures contracts were used to manage exposure to the stock market.
Upon entering into a futures contract, a fund is required to deposit either cash or securities (initial margin) with a clearing broker in an amount equal to a certain percentage of the face value of the contract. Futures contracts are marked-to-market daily and subsequent daily payments are made or received by a fund depending on the daily fluctuations in the value of the futures contracts and are recorded as unrealized appreciation or (depreciation). This receivable and/or payable, if any, is included in daily variation margin on futures contracts in the Consolidated Statement of Assets and Liabilities. Realized gain or (loss) is recorded upon the expiration or closing of a futures contract. The net realized gain (loss) and change in net unrealized appreciation (depreciation) on futures contracts during the period is presented in the Consolidated Statement of Operations.
Any open futures contracts at period end are presented in the Consolidated Schedule of Investments under the caption "Futures Contracts". The notional amount at value reflects each contract's exposure to the underlying instrument or index at period end, and is representative of volume of activity during the period.
Any securities deposited to meet initial margin requirements are identified in the Consolidated Schedule of Investments. Any cash deposited to meet initial margin requirements is presented as segregated cash with brokers for derivative instruments in the Consolidated Statement of Assets and Liabilities.
5. Purchases and Sales of Investments.
Purchases and sales of securities, other than short-term securities, U.S. government securities and in-kind transactions, as applicable, are noted in the table below.
| | Purchases ($) | Sales ($) |
| Fidelity U.S. Equity Central Fund | 5,189,228,204 | 7,985,506,309 |
6. Fees and Other Transactions with Affiliates.
Management Fee and Expense Contract. Fidelity Management & Research Company LLC (the investment adviser) provides the Fund with investment management services. The Fund does not pay any fees for these services. Pursuant to the Fund's expense contract, the investment adviser also pays all other expenses of the Fund, excluding custody fees, the compensation of the independent Directors, and certain miscellaneous expenses such as proxy and shareholder meeting expenses.
Brokerage Commissions. A portion of portfolio transactions were placed with brokerage firms which are affiliates of the investment adviser. Brokerage commissions are included in net realized gain (loss) and change in net unrealized appreciation (depreciation) in the Consolidated Statement of Operations. The commissions paid to these affiliated firms were as follows:
| | Amount ($) |
| Fidelity U.S. Equity Central Fund | 104,527 |
Interfund Trades. Funds may purchase from or sell securities to other Fidelity Funds under procedures adopted by the Board. The procedures have been designed to ensure these interfund trades are executed in accordance with Rule 17a-7 of the 1940 Act. Any interfund trades are included within the respective purchases and sales amounts shown in the Purchases and Sales of Investments note. Interfund trades during the period are noted in the table below.
| | Purchases ($) | Sales ($) | Realized Gain (Loss) ($) |
| Fidelity U.S. Equity Central Fund | 530,233,479 | 882,992,621 | 105,188,343 |
7. Security Lending.
Funds lend portfolio securities from time to time in order to earn additional income. Lending agents are used, including National Financial Services (NFS), an affiliate of the investment adviser. Pursuant to a securities lending agreement, NFS will receive a fee, which is capped at 9.9% of a fund's daily lending revenue, for its services as lending agent. A fund may lend securities to certain qualified borrowers, including NFS. On the settlement date of the loan, a fund receives collateral (in the form of U.S. Treasury obligations, letters of credit and/or cash) against the loaned securities and maintains collateral in an amount not less than 100% of the market value of the loaned securities during the period of the loan. The market value of the loaned securities is determined at the close of business of a fund and any additional required collateral is delivered to a fund on the next business day. A fund or borrower may terminate the loan at any time, and if the borrower defaults on its obligation to return the securities loaned because of insolvency or other reasons, a fund may apply collateral received from the borrower against the obligation. A fund may experience delays and costs in recovering the securities loaned. Any cash collateral received is invested in the Fidelity Securities Lending Cash Central Fund. Any loaned securities are identified as such in the Consolidated Schedule of Investments, and the value of loaned securities and cash collateral at period end, as applicable, are presented in the Consolidated Statement of Assets and Liabilities. Security lending income represents the income earned on investing cash collateral, less rebates paid to borrowers and any lending agent fees associated with the loan, plus any premium payments received for lending certain types of securities. Security lending income is presented in the Consolidated Statement of Operations as a component of income from Fidelity Central Funds. Affiliated security lending activity, if any, was as follows:
| | Total Security Lending Fees Paid to NFS ($) | Security Lending Income From Securities Loaned to NFS ($) | Value of Securities Loaned to NFS at Period End ($) |
| Fidelity U.S. Equity Central Fund | 3,266 | 4 | - |
8. Expense Reductions.
Through arrangements with the Fund's custodian, credits realized as a result of certain uninvested cash balances were used to reduce the Fund's expenses by $1,980.
9. Other.
A fund's organizational documents provide former and current directors and officers with a limited indemnification against liabilities arising in connection with the performance of their duties to the fund. In the normal course of business, a fund may also enter into contracts that provide general indemnifications. A fund's maximum exposure under these arrangements is unknown as this would be dependent on future claims that may be made against a fund. The risk of material loss from such claims is considered remote.
At the end of the period, mutual funds managed by the investment adviser or its affiliates were the owners of record of all of the outstanding shares of the Fund.
10. Risk and Uncertainties.
Many factors affect a fund's performance. Developments that disrupt global economies and financial markets, such as pandemics, epidemics, outbreaks of infectious diseases, war, terrorism, and environmental disasters, may significantly affect a fund's investment performance. The effects of these developments to a fund will be impacted by the types of securities in which a fund invests, the financial condition, industry, economic sector, and geographic location of an issuer, and a fund's level of investment in the securities of that issuer. Significant concentrations in security types, issuers, industries, sectors, and geographic locations may magnify the factors that affect a fund's performance.
Item 8: Changes in and Disagreements with Accountants for Open-End Management Investment Companies
(Unaudited)
Note: This is not applicable for any fund included in this document.
Item 9: Proxy Disclosures for Open-End Management Investment Companies
(Unaudited)
| A special meeting of shareholders was held on July 16, 2024. The results of votes taken among shareholders on the proposal before them are reported below. Each vote reported represents one dollar of net asset value held on the record date for the meeting. |
| Proposal 1 |
| To elect a Board of Trustees. |
| | # of Votes | % of Votes |
| Bettina Doulton |
| Affirmative | 31,231,071,082.58 | 100.00 |
| TOTAL | 31,231,071,082.58 | 100.00 |
| Robert A. Lawrence |
| Affirmative | 31,231,071,082.58 | 100.00 |
| TOTAL | 31,231,071,082.58 | 100.00 |
| Vijay C. Advani |
| Affirmative | 31,231,071,082.58 | 100.00 |
| TOTAL | 31,231,071,082.58 | 100.00 |
| Thomas P. Bostick |
| Affirmative | 31,231,071,082.58 | 100.00 |
| TOTAL | 31,231,071,082.58 | 100.00 |
| Donald F. Donahue |
| Affirmative | 31,231,071,082.58 | 100.00 |
| TOTAL | 31,231,071,082.58 | 100.00 |
| Vicki L. Fuller |
| Affirmative | 31,231,071,082.58 | 100.00 |
| TOTAL | 31,231,071,082.58 | 100.00 |
| Patricia L. Kampling |
| Affirmative | 31,231,071,082.58 | 100.00 |
| TOTAL | 31,231,071,082.58 | 100.00 |
| Thomas A. Kennedy |
| Affirmative | 31,231,071,082.58 | 100.00 |
| TOTAL | 31,231,071,082.58 | 100.00 |
| Oscar Munoz |
| Affirmative | 31,231,071,082.58 | 100.00 |
| TOTAL | 31,231,071,082.58 | 100.00 |
| Karen B. Peetz |
| Affirmative | 31,231,071,082.58 | 100.00 |
| TOTAL | 31,231,071,082.58 | 100.00 |
| David M. Thomas |
| Affirmative | 31,231,071,082.58 | 100.00 |
| TOTAL | 31,231,071,082.58 | 100.00 |
| Susan Tomasky |
| Affirmative | 31,231,071,082.58 | 100.00 |
| TOTAL | 31,231,071,082.58 | 100.00 |
| Michael E. Wiley |
| Affirmative | 31,231,071,082.58 | 100.00 |
| TOTAL | 31,231,071,082.58 | 100.00 |
| | | |
| Proposal 1 reflects trust-wide proposal and voting results. |
Item 10: Remuneration Paid to Directors, Officers, and others of Open-End Management Investment Companies
(Unaudited)
Note: This information is disclosed as part of the consolidated financial statements for each Fund as part of Item 7: Consolidated Financial Statements and Consolidated Financial Highlights for Open-End Management Investment companies.
Item 11: Statement Regarding Basis for Approval of Investment Advisory Contract
(Unaudited)
Note: This is not applicable for any fund included in this document.
1.9900194.104
USE-SANN-0225
Item 8.
Changes in and Disagreements with Accountants for Open-End Management Investment Companies
See Item 7.
Item 9.
Proxy Disclosures for Open-End Management Investment Companies
See Item 7.
Item 10.
Remuneration Paid to Directors, Officers, and Others of Open-End Management Investment Companies
See Item 7.
Item 11.
Statement Regarding Basis for Approval of Investment Advisory Contract
See Item 7.
Item 12.
Disclosure of Proxy Voting Policies and Procedures for Closed-End Management Investment Companies
Not applicable.
Item 13.
Portfolio Managers of Closed-End Management Investment Companies
Not applicable.
Item 14.
Purchases of Equity Securities by Closed-End Management Investment Company and Affiliated Purchasers
Not applicable.
Item 15.
Submission of Matters to a Vote of Security Holders
There were no material changes to the procedures by which shareholders may recommend nominees to the Fidelity Central Investment Portfolios LLC’s Board of Trustees.
Item 16.
Controls and Procedures
(a)(i) The President and Treasurer and the Chief Financial Officer have concluded that the Fidelity Central Investment Portfolios LLC’s (the “Trust”) disclosure controls and procedures (as defined in Rule 30a-3(c) under the Investment Company Act) provide reasonable assurances that material information relating to the Trust is made known to them by the appropriate persons, based on their evaluation of these controls and procedures as of a date within 90 days of the filing date of this report.
(a)(ii) There was no change in the Trust’s internal control over financial reporting (as defined in Rule 30a-3(d) under the Investment Company Act) that occurred during the period covered by this report that has materially affected, or is reasonably likely to materially affect, the Trust’s internal control over financial reporting.
Item 17.
Disclosure of Securities Lending Activities for Closed-End Management Investment Companies
Not applicable.
Item 18.
Recovery of Erroneously Awarded Compensation
(a)
Not applicable.
(b)
Not applicable.
Item 19.
Exhibits
SIGNATURES
Pursuant to the requirements of the Securities Exchange Act of 1934 and the Investment Company Act of 1940, the registrant has duly caused this report to be signed on its behalf by the undersigned, thereunto duly authorized.
Fidelity Central Investment Portfolios LLC
|
By: | /s/Stacie M. Smith |
| Stacie M. Smith |
| President and Treasurer (Principal Executive Officer) |
|
|
Date: | February 21, 2025 |
Pursuant to the requirements of the Securities Exchange Act of 1934 and the Investment Company Act of 1940, this report has been signed below by the following persons on behalf of the registrant and in the capacities and on the dates indicated.
|
By: | /s/Stacie M. Smith |
| Stacie M. Smith |
| President and Treasurer (Principal Executive Officer) |
|
|
Date: | February 21, 2025 |
|
By: | /s/Stephanie Caron |
| Stephanie Caron |
| Chief Financial Officer (Principal Financial Officer) |
|
|
Date: | February 21, 2025 |