UNITED STATES
SECURITIES AND EXCHANGE COMMISSION
Washington, D.C. 20549
FORM N-CSR
CERTIFIED SHAREHOLDER REPORT OF REGISTERED
MANAGEMENT INVESTMENT COMPANIES
Investment Company Act file number 811-21667
Fidelity Central Investment Portfolios LLC
(Exact name of registrant as specified in charter)
245 Summer St., Boston, MA 02210
(Address of principal executive offices) (Zip code)
Cynthia Lo Bessette, Secretary
245 Summer St.
Boston, Massachusetts 02210
(Name and address of agent for service)
Registrant's telephone number, including area code:
617-563-7000
Date of fiscal year end: | August 31 |
Date of reporting period: | February 28, 2022 |
Item 1.
Reports to Stockholders
Fidelity® High Income Central Fund
Semi-Annual Report
February 28, 2022

Contents
To view a fund's proxy voting guidelines and proxy voting record for the 12-month period ended June 30, visit http://www.fidelity.com/proxyvotingresults or visit the Securities and Exchange Commission's (SEC) web site at http://www.sec.gov.
You may also call 1-800-544-8544 to request a free copy of the proxy voting guidelines.
Standard & Poor's, S&P and S&P 500 are registered service marks of The McGraw-Hill Companies, Inc. and have been licensed for use by Fidelity Distributors Corporation.
Other third-party marks appearing herein are the property of their respective owners.
All other marks appearing herein are registered or unregistered trademarks or service marks of FMR LLC or an affiliated company. © 2022 FMR LLC. All rights reserved.
A fund files its complete schedule of portfolio holdings with the SEC for the first and third quarters of each fiscal year on Form N-PORT. Forms N-PORT are available on the SEC’s web site at http://www.sec.gov. A fund's Forms N-PORT may be reviewed and copied at the SEC’s Public Reference Room in Washington, DC. Information regarding the operation of the SEC's Public Reference Room may be obtained by calling 1-800-SEC-0330.
Note to Shareholders:
Early in 2020, the outbreak and spread of COVID-19 emerged as a public health emergency that had a major influence on financial markets, primarily based on its impact on the global economy and corporate earnings. On March 11, 2020, the World Health Organization declared the COVID-19 outbreak a pandemic, citing sustained risk of further global spread. The pandemic prompted a number of measures to limit the spread of COVID-19, including travel and border restrictions, quarantines, and restrictions on large gatherings. In turn, these resulted in lower consumer activity, diminished demand for a wide range of products and services, disruption in manufacturing and supply chains, and – given the wide variability in outcomes regarding the outbreak – significant market uncertainty and volatility. To help stem the turmoil, the U.S. government took unprecedented action – in concert with the U.S. Federal Reserve and central banks around the world – to help support consumers, businesses, and the broader economy, and to limit disruption to the financial system.
In general, the overall impact of the pandemic lessened in 2021, amid a resilient economy and widespread distribution of three COVID-19 vaccines granted emergency use authorization from the U.S. Food and Drug Administration (FDA) early in the year. Still, the situation remains dynamic, and the extent and duration of its influence on financial markets and the economy is highly uncertain, due in part to a recent spike in cases based on highly contagious variants of the coronavirus.
Extreme events such as the COVID-19 crisis are exogenous shocks that can have significant adverse effects on mutual funds and their investments. Although multiple asset classes may be affected by market disruption, the duration and impact may not be the same for all types of assets. Fidelity is committed to helping you stay informed amid news about COVID-19 and during increased market volatility, and we continue to take extra steps to be responsive to customer needs. We encourage you to visit us online, where we offer ongoing updates, commentary, and analysis on the markets and our funds.
Investment Summary (Unaudited)
Top Five Holdings as of February 28, 2022
| (by issuer, excluding cash equivalents) | % of fund's net assets |
| Occidental Petroleum Corp. | 2.5 |
| Pacific Gas & Electric Co. | 2.0 |
| CCO Holdings LLC/CCO Holdings Capital Corp. | 1.8 |
| Sprint Capital Corp. | 1.7 |
| Mesquite Energy, Inc. | 1.7 |
| 9.7 |
Top Five Market Sectors as of February 28, 2022
| % of fund's net assets | |
| Energy | 17.0 |
| Telecommunications | 8.4 |
| Healthcare | 7.6 |
| Utilities | 6.5 |
| Services | 5.2 |
Quality Diversification (% of fund's net assets)
| As of February 28, 2022 | ||
| BBB | 5.4% | |
| BB | 28.9% | |
| B | 40.6% | |
| CCC,CC,C | 13.2% | |
| Not Rated | 2.6% | |
| Equities | 6.8% | |
| Short-Term Investments and Net Other Assets | 2.5% | |
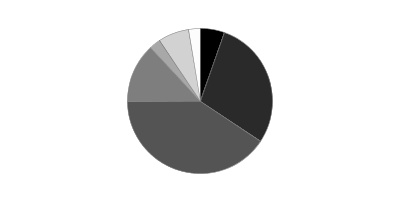
We have used ratings from Moody's Investors Service, Inc. Where Moody's® ratings are not available, we have used S&P® ratings. All ratings are as of the date indicated and do not reflect subsequent changes.
Asset Allocation (% of fund's net assets)
| As of February 28, 2022 * | ||
| Nonconvertible Bonds | 83.9% | |
| Convertible Bonds, Preferred Stocks | 2.3% | |
| Common Stocks | 6.2% | |
| Fixed-Income Funds | 0.3% | |
| Bank Loan Obligations | 2.9% | |
| Preferred Securities | 1.9% | |
| Short-Term Investments and Net Other Assets (Liabilities) | 2.5% | |

* Foreign investments - 18.6%
Schedule of Investments February 28, 2022 (Unaudited)
Showing Percentage of Net Assets
| Corporate Bonds - 85.6% | |||
| Principal Amount | Value | ||
| Convertible Bonds - 2.3% | |||
| Broadcasting - 1.1% | |||
| DISH Network Corp.: | |||
| 2.375% 3/15/24 | $4,765,000 | $4,533,898 | |
| 3.375% 8/15/26 | 20,439,000 | 18,538,173 | |
| 23,072,071 | |||
| Diversified Financial Services - 0.1% | |||
| New Cotai LLC 5% 2/24/27 (a) | 1,526,251 | 1,526,251 | |
| Energy - 1.1% | |||
| Mesquite Energy, Inc. 15% 7/15/23 (a)(b) | 1,687,240 | 9,111,096 | |
| Mesquite Energy, Inc. 15% 7/15/23 (a)(b) | 2,913,114 | 14,186,865 | |
| 23,297,961 | |||
| TOTAL CONVERTIBLE BONDS | 47,896,283 | ||
| Nonconvertible Bonds - 83.3% | |||
| Aerospace - 2.4% | |||
| Allegheny Technologies, Inc.: | |||
| 4.875% 10/1/29 | 1,205,000 | 1,165,825 | |
| 5.125% 10/1/31 | 845,000 | 821,763 | |
| 5.875% 12/1/27 | 2,480,000 | 2,530,840 | |
| Bombardier, Inc.: | |||
| 6% 2/15/28 (c) | 3,615,000 | 3,452,361 | |
| 7.125% 6/15/26 (c) | 3,320,000 | 3,315,850 | |
| 7.5% 12/1/24 (c) | 4,520,000 | 4,678,200 | |
| 7.5% 3/15/25 (c) | 6,045,000 | 6,105,450 | |
| 7.875% 4/15/27 (c) | 9,105,000 | 9,157,581 | |
| Moog, Inc. 4.25% 12/15/27 (c) | 735,000 | 720,572 | |
| TransDigm, Inc.: | |||
| 5.5% 11/15/27 | 12,450,000 | 12,387,750 | |
| 7.5% 3/15/27 | 5,250,000 | 5,427,188 | |
| Wolverine Escrow LLC 8.5% 11/15/24 (c) | 1,611,000 | 1,372,089 | |
| 51,135,469 | |||
| Air Transportation - 0.6% | |||
| Air Canada 3.875% 8/15/26 (c) | 4,380,000 | 4,252,958 | |
| Hawaiian Brand Intellectual Property Ltd. / HawaiianMiles Loyalty Ltd. 5.75% 1/20/26 (c) | 2,190,000 | 2,217,375 | |
| United Airlines, Inc. 4.625% 4/15/29 (c) | 2,980,000 | 2,906,975 | |
| Western Global Airlines LLC 10.375% 8/15/25 (c) | 2,660,000 | 2,889,425 | |
| 12,266,733 | |||
| Automotive - 0.1% | |||
| Ford Motor Credit Co. LLC 3.625% 6/17/31 | 2,480,000 | 2,384,799 | |
| Automotive & Auto Parts - 1.9% | |||
| Dana, Inc.: | |||
| 4.25% 9/1/30 | 1,400,000 | 1,334,802 | |
| 5.625% 6/15/28 | 2,450,000 | 2,505,125 | |
| Ford Motor Co. 3.25% 2/12/32 | 4,510,000 | 4,253,516 | |
| Ford Motor Credit Co. LLC: | |||
| 2.9% 2/16/28 | 2,000,000 | 1,893,800 | |
| 5.125% 6/16/25 | 7,810,000 | 8,169,260 | |
| General Motors Financial Co., Inc. 4.25% 5/15/23 | 615,000 | 632,746 | |
| LCM Investments Holdings 4.875% 5/1/29 (c) | 3,665,000 | 3,492,085 | |
| Nesco Holdings II, Inc. 5.5% 4/15/29 (c) | 1,770,000 | 1,701,413 | |
| PECF USS Intermediate Holding III Corp. 8% 11/15/29 (c) | 875,000 | 853,125 | |
| Real Hero Merger Sub 2 6.25% 2/1/29 (c) | 685,000 | 645,613 | |
| Rivian Holdco & Rivian LLC & Rivian Automotive LLC 6 month U.S. LIBOR + 5.620% 6.625% 10/15/26 (c)(d)(e) | 9,915,000 | 9,964,575 | |
| Thor Industries, Inc. 4% 10/15/29 (c) | 3,220,000 | 2,938,250 | |
| Winnebago Industries, Inc. 6.25% 7/15/28 (c) | 2,075,000 | 2,147,625 | |
| 40,531,935 | |||
| Banks & Thrifts - 1.6% | |||
| Ally Financial, Inc.: | |||
| 5.8% 5/1/25 | 20,000 | 21,643 | |
| 8% 11/1/31 | 11,003,000 | 14,341,060 | |
| 8% 11/1/31 | 5,273,000 | 6,945,768 | |
| CQP Holdco LP / BIP-V Chinook Holdco LLC 5.5% 6/15/31 (c) | 7,280,000 | 7,243,600 | |
| VistaJet Malta Finance PLC / XO Management Holding, Inc. 6.375% 2/1/30 (c) | 4,250,000 | 4,044,045 | |
| 32,596,116 | |||
| Broadcasting - 1.5% | |||
| Clear Channel Outdoor Holdings, Inc.: | |||
| 7.5% 6/1/29 (c) | 2,590,000 | 2,691,424 | |
| 7.75% 4/15/28 (c) | 1,370,000 | 1,431,650 | |
| Diamond Sports Group LLC/Diamond Sports Finance Co. 5.375% 8/15/26 (c) | 2,515,000 | 1,031,150 | |
| Gray Escrow II, Inc. 5.375% 11/15/31 (c) | 2,970,000 | 2,859,100 | |
| iHeartCommunications, Inc. 9% 5/15/22 (a)(f) | 780,000 | 0 | |
| Nexstar Broadcasting, Inc. 5.625% 7/15/27 (c) | 2,755,000 | 2,816,988 | |
| Scripps Escrow II, Inc.: | |||
| 3.875% 1/15/29 (c) | 2,170,000 | 2,033,594 | |
| 5.375% 1/15/31 (c) | 1,130,000 | 1,074,630 | |
| Scripps Escrow, Inc. 5.875% 7/15/27 (c) | 2,215,000 | 2,210,692 | |
| Sirius XM Radio, Inc.: | |||
| 4.125% 7/1/30 (c) | 3,430,000 | 3,242,105 | |
| 5% 8/1/27 (c) | 5,295,000 | 5,366,668 | |
| Tegna, Inc. 5% 9/15/29 | 2,100,000 | 2,094,225 | |
| Univision Communications, Inc. 6.625% 6/1/27 (c) | 5,150,000 | 5,356,000 | |
| 32,208,226 | |||
| Building Materials - 0.5% | |||
| Advanced Drain Systems, Inc. 5% 9/30/27 (c) | 505,000 | 508,767 | |
| Gypsum Management & Supply, Inc. 4.625% 5/1/29 (c) | 2,170,000 | 2,024,610 | |
| MIWD Holdco II LLC / MIWD Finance Corp. 5.5% 2/1/30 (c) | 590,000 | 562,541 | |
| SRS Distribution, Inc.: | |||
| 4.625% 7/1/28 (c) | 1,825,000 | 1,749,719 | |
| 6% 12/1/29 (c) | 1,705,000 | 1,611,225 | |
| 6.125% 7/1/29 (c) | 1,005,000 | 960,237 | |
| Victors Merger Corp. 6.375% 5/15/29 (c) | 3,465,000 | 3,000,326 | |
| 10,417,425 | |||
| Cable/Satellite TV - 4.9% | |||
| CCO Holdings LLC/CCO Holdings Capital Corp.: | |||
| 4.25% 1/15/34 (c) | 3,730,000 | 3,429,362 | |
| 4.5% 8/15/30 (c) | 3,095,000 | 2,980,733 | |
| 4.5% 6/1/33 (c) | 4,415,000 | 4,139,063 | |
| 4.75% 3/1/30 (c) | 5,200,000 | 5,106,322 | |
| 5% 2/1/28 (c) | 12,055,000 | 12,128,475 | |
| 5.125% 5/1/27 (c) | 8,920,000 | 9,009,200 | |
| CSC Holdings LLC: | |||
| 3.375% 2/15/31 (c) | 3,305,000 | 2,815,488 | |
| 4.125% 12/1/30 (c) | 2,590,000 | 2,325,613 | |
| 4.5% 11/15/31 (c) | 2,175,000 | 1,979,250 | |
| 4.625% 12/1/30 (c) | 5,895,000 | 4,912,760 | |
| 5% 11/15/31 (c) | 2,290,000 | 1,906,425 | |
| 5.375% 2/1/28 (c) | 4,625,000 | 4,494,922 | |
| 5.75% 1/15/30 (c) | 3,690,000 | 3,262,846 | |
| 5.875% 9/15/22 | 805,000 | 816,069 | |
| 7.5% 4/1/28 (c) | 4,545,000 | 4,538,273 | |
| DIRECTV Financing LLC / DIRECTV Financing Co-Obligor, Inc. 5.875% 8/15/27 (c) | 2,505,000 | 2,504,148 | |
| DISH DBS Corp.: | |||
| 5.25% 12/1/26 (c) | 1,465,000 | 1,436,158 | |
| 5.75% 12/1/28 (c) | 1,465,000 | 1,400,906 | |
| Radiate Holdco LLC/Radiate Financial Service Ltd.: | |||
| 4.5% 9/15/26 (c) | 6,820,000 | 6,516,476 | |
| 6.5% 9/15/28 (c) | 5,050,000 | 4,797,500 | |
| Telenet Finance Luxembourg Notes SARL 5.5% 3/1/28 (c) | 8,600,000 | 8,514,000 | |
| VZ Secured Financing BV 5% 1/15/32 (c) | 6,990,000 | 6,675,450 | |
| Ziggo Bond Co. BV: | |||
| 5.125% 2/28/30 (c) | 1,155,000 | 1,077,038 | |
| 6% 1/15/27 (c) | 4,760,000 | 4,819,500 | |
| Ziggo BV 4.875% 1/15/30 (c) | 1,730,000 | 1,650,299 | |
| 103,236,276 | |||
| Chemicals - 2.9% | |||
| Avient Corp. 5.75% 5/15/25 (c) | 1,970,000 | 2,021,713 | |
| Axalta Coating Systems/Dutch Holding BV 4.75% 6/15/27 (c) | 2,445,000 | 2,451,113 | |
| CF Industries Holdings, Inc.: | |||
| 5.15% 3/15/34 | 2,585,000 | 2,892,602 | |
| 5.375% 3/15/44 | 4,565,000 | 5,143,203 | |
| CVR Partners LP 6.125% 6/15/28 (c) | 3,010,000 | 3,028,813 | |
| GrafTech Finance, Inc. 4.625% 12/15/28 (c) | 2,290,000 | 2,225,308 | |
| Kobe U.S. Midco 2, Inc. 9.25% 11/1/26 pay-in-kind (c)(d) | 5,905,000 | 5,949,288 | |
| Kronos Acquisition Holdings, Inc. / KIK Custom Products, Inc.: | |||
| 5% 12/31/26 (c) | 535,000 | 482,838 | |
| 7% 12/31/27 (c) | 680,000 | 575,416 | |
| LSB Industries, Inc. 6.25% 10/15/28 (c) | 270,000 | 271,350 | |
| NOVA Chemicals Corp. 4.25% 5/15/29 (c) | 2,650,000 | 2,483,263 | |
| SCIH Salt Holdings, Inc.: | |||
| 4.875% 5/1/28 (c) | 2,630,000 | 2,491,925 | |
| 6.625% 5/1/29 (c) | 1,755,000 | 1,649,700 | |
| The Chemours Co. LLC: | |||
| 4.625% 11/15/29 (c) | 2,245,000 | 2,079,431 | |
| 5.375% 5/15/27 | 10,220,000 | 10,256,843 | |
| 5.75% 11/15/28 (c) | 6,595,000 | 6,482,687 | |
| Tronox, Inc. 4.625% 3/15/29 (c) | 2,210,000 | 2,087,400 | |
| Valvoline, Inc. 4.25% 2/15/30 (c) | 1,600,000 | 1,515,128 | |
| W.R. Grace Holding LLC: | |||
| 4.875% 6/15/27 (c) | 3,255,000 | 3,251,810 | |
| 5.625% 8/15/29 (c) | 2,375,000 | 2,274,063 | |
| 59,613,894 | |||
| Consumer Products - 1.0% | |||
| Central Garden & Pet Co. 4.125% 10/15/30 | 1,675,000 | 1,590,915 | |
| Diamond BC BV 4.625% 10/1/29 (c) | 1,145,000 | 1,042,190 | |
| Ferrellgas LP/Ferrellgas Finance Corp. 5.375% 4/1/26 (c) | 1,775,000 | 1,668,571 | |
| Gannett Holdings LLC 6% 11/1/26 (c) | 1,390,000 | 1,383,050 | |
| Mattel, Inc. 3.375% 4/1/26 (c) | 745,000 | 739,860 | |
| Michaels Companies, Inc.: | |||
| 5.25% 5/1/28 (c) | 2,370,000 | 2,215,950 | |
| 7.875% 5/1/29 (c) | 3,590,000 | 3,141,250 | |
| Tempur Sealy International, Inc.: | |||
| 3.875% 10/15/31 (c) | 2,515,000 | 2,259,363 | |
| 4% 4/15/29 (c) | 2,345,000 | 2,209,975 | |
| The Scotts Miracle-Gro Co. 4% 4/1/31 | 1,495,000 | 1,371,663 | |
| TKC Holdings, Inc. 10.5% 5/15/29 (c) | 2,545,000 | 2,608,625 | |
| 20,231,412 | |||
| Containers - 1.0% | |||
| ARD Finance SA 6.5% 6/30/27 pay-in-kind (c)(d) | 2,525,000 | 2,417,890 | |
| Ardagh Packaging Finance PLC/Ardagh MP Holdings U.S.A., Inc. 5.25% 8/15/27 (c) | 7,225,000 | 6,867,819 | |
| Berry Global, Inc.: | |||
| 4.5% 2/15/26 (c) | 2,134,000 | 2,138,268 | |
| 4.875% 7/15/26 (c) | 1,355,000 | 1,373,767 | |
| Flex Acquisition Co., Inc.: | |||
| 6.875% 1/15/25 (c) | 2,080,000 | 2,084,534 | |
| 7.875% 7/15/26 (c) | 275,000 | 283,594 | |
| Graham Packaging Co., Inc. 7.125% 8/15/28 (c) | 1,430,000 | 1,376,375 | |
| Graphic Packaging International, Inc. 3.75% 2/1/30 (c) | 1,185,000 | 1,129,157 | |
| OI European Group BV 4.75% 2/15/30 (c) | 2,835,000 | 2,714,484 | |
| Trivium Packaging Finance BV 5.5% 8/15/26 (c) | 1,510,000 | 1,524,028 | |
| 21,909,916 | |||
| Diversified Financial Services - 2.8% | |||
| Altice France Holding SA 10.5% 5/15/27 (c) | 4,240,000 | 4,439,280 | |
| Coinbase Global, Inc.: | |||
| 3.375% 10/1/28 (c) | 9,445,000 | 8,605,717 | |
| 3.625% 10/1/31 (c) | 6,085,000 | 5,359,516 | |
| Diamond Sports Group LLC/Diamond Sports Finance Co. 6.625% 8/15/27 (c) | 3,500,000 | 840,000 | |
| FLY Leasing Ltd. 7% 10/15/24 (c) | 7,485,000 | 7,178,583 | |
| Hightower Holding LLC 6.75% 4/15/29 (c) | 970,000 | 970,000 | |
| Icahn Enterprises LP/Icahn Enterprises Finance Corp.: | |||
| 4.75% 9/15/24 | 2,200,000 | 2,194,500 | |
| 5.25% 5/15/27 | 5,970,000 | 5,925,225 | |
| 6.375% 12/15/25 | 1,740,000 | 1,753,877 | |
| MSCI, Inc. 4% 11/15/29 (c) | 5,785,000 | 5,816,123 | |
| OneMain Finance Corp.: | |||
| 7.125% 3/15/26 | 3,460,000 | 3,750,640 | |
| 8.875% 6/1/25 | 3,325,000 | 3,507,875 | |
| PRA Group, Inc. 5% 10/1/29 (c) | 7,620,000 | 7,391,400 | |
| 57,732,736 | |||
| Diversified Media - 1.7% | |||
| Allen Media LLC 10.5% 2/15/28 (c) | 6,230,000 | 6,188,944 | |
| Lamar Media Corp. 4.875% 1/15/29 | 1,980,000 | 1,984,950 | |
| Nielsen Co. SARL (Luxembourg) 5% 2/1/25 (c) | 1,645,000 | 1,657,584 | |
| Nielsen Finance LLC/Nielsen Finance Co.: | |||
| 5.625% 10/1/28 (c) | 2,530,000 | 2,444,878 | |
| 5.875% 10/1/30 (c) | 2,530,000 | 2,450,204 | |
| Terrier Media Buyer, Inc. 8.875% 12/15/27 (c) | 3,285,000 | 3,367,125 | |
| Twitter, Inc. 5% 3/1/30 (c) | 17,170,000 | 17,255,850 | |
| 35,349,535 | |||
| Energy - 11.5% | |||
| Antero Midstream Partners LP/Antero Midstream Finance Corp. 5.75% 1/15/28 (c) | 2,220,000 | 2,253,300 | |
| Apache Corp. 4.625% 11/15/25 | 2,475,000 | 2,555,438 | |
| Archrock Partners LP / Archrock Partners Finance Corp.: | |||
| 6.25% 4/1/28 (c) | 2,475,000 | 2,475,000 | |
| 6.875% 4/1/27 (c) | 700,000 | 718,578 | |
| Atlantica Sustainable Infrastructure PLC 4.125% 6/15/28 (c) | 1,235,000 | 1,188,688 | |
| California Resources Corp. 7.125% 2/1/26 (c) | 3,735,000 | 3,884,400 | |
| Cheniere Energy, Inc. 4.625% 10/15/28 | 3,250,000 | 3,320,395 | |
| Citgo Holding, Inc. 9.25% 8/1/24 (c) | 2,625,000 | 2,638,125 | |
| Citgo Petroleum Corp.: | |||
| 6.375% 6/15/26 (c) | 2,610,000 | 2,589,903 | |
| 7% 6/15/25 (c) | 6,180,000 | 6,180,000 | |
| CNX Resources Corp. 6% 1/15/29 (c) | 1,185,000 | 1,210,122 | |
| Colgate Energy Partners III LLC 5.875% 7/1/29 (c) | 2,610,000 | 2,686,421 | |
| Comstock Resources, Inc.: | |||
| 5.875% 1/15/30 (c) | 1,595,000 | 1,543,059 | |
| 6.75% 3/1/29 (c) | 3,485,000 | 3,546,162 | |
| 7.5% 5/15/25 (c) | 2,725,000 | 2,787,239 | |
| Crestwood Midstream Partners LP/Crestwood Midstream Finance Corp.: | |||
| 5.75% 4/1/25 | 1,045,000 | 1,051,531 | |
| 6% 2/1/29 (c) | 7,210,000 | 7,266,743 | |
| CrownRock LP/CrownRock Finance, Inc. 5% 5/1/29 (c) | 830,000 | 844,525 | |
| CVR Energy, Inc.: | |||
| 5.25% 2/15/25 (c) | 4,990,000 | 4,830,470 | |
| 5.75% 2/15/28 (c) | 4,990,000 | 4,703,075 | |
| DCP Midstream Operating LP 5.85% 5/21/43 (c)(d) | 3,410,000 | 3,171,300 | |
| Delek Logistics Partners LP 7.125% 6/1/28 (c) | 1,520,000 | 1,486,119 | |
| DT Midstream, Inc.: | |||
| 4.125% 6/15/29 (c) | 2,545,000 | 2,455,925 | |
| 4.375% 6/15/31 (c) | 2,545,000 | 2,485,956 | |
| Endeavor Energy Resources LP/EER Finance, Inc.: | |||
| 5.75% 1/30/28 (c) | 4,185,000 | 4,334,363 | |
| 6.625% 7/15/25 (c) | 2,455,000 | 2,565,696 | |
| EnLink Midstream LLC 5.625% 1/15/28 (c) | 1,060,000 | 1,070,600 | |
| EQT Corp.: | |||
| 3.125% 5/15/26 (c) | 1,720,000 | 1,691,715 | |
| 3.625% 5/15/31 (c) | 1,720,000 | 1,672,700 | |
| 5% 1/15/29 | 2,500,000 | 2,637,500 | |
| Exterran Energy Solutions LP 8.125% 5/1/25 | 885,000 | 888,465 | |
| Harvest Midstream I LP 7.5% 9/1/28 (c) | 5,565,000 | 5,616,755 | |
| Hess Midstream Partners LP: | |||
| 4.25% 2/15/30 (c) | 1,560,000 | 1,505,899 | |
| 5.125% 6/15/28 (c) | 2,905,000 | 2,966,978 | |
| 5.625% 2/15/26 (c) | 6,900,000 | 7,072,500 | |
| KLX Energy Services Holdings, Inc. 11.5% 11/1/25 (c) | 2,685,000 | 1,500,244 | |
| MC Brazil Downstream Trading SARL 7.25% 6/30/31 (c) | 7,410,000 | 6,835,725 | |
| MEG Energy Corp. 5.875% 2/1/29 (c) | 4,235,000 | 4,281,204 | |
| Nabors Industries, Inc. 5.75% 2/1/25 | 4,196,000 | 4,028,160 | |
| Neptune Energy Bondco PLC 6.625% 5/15/25 (c) | 1,065,000 | 1,075,384 | |
| New Fortress Energy, Inc. 6.75% 9/15/25 (c) | 2,500,000 | 2,403,100 | |
| NGL Energy Operating LLC/NGL Energy Finance Corp. 7.5% 2/1/26 (c) | 7,325,000 | 7,355,216 | |
| Nine Energy Service, Inc. 8.75% 11/1/23 (c) | 600,000 | 255,000 | |
| Northern Oil & Gas, Inc. 8.125% 3/1/28 (c) | 3,455,000 | 3,630,946 | |
| Occidental Petroleum Corp.: | |||
| 4.3% 8/15/39 | 880,000 | 831,600 | |
| 4.4% 4/15/46 | 1,750,000 | 1,662,465 | |
| 4.5% 7/15/44 | 815,000 | 770,175 | |
| 5.875% 9/1/25 | 1,665,000 | 1,785,713 | |
| 6.125% 1/1/31 | 4,345,000 | 4,940,700 | |
| 6.2% 3/15/40 | 980,000 | 1,090,529 | |
| 6.375% 9/1/28 | 2,500,000 | 2,825,000 | |
| 6.45% 9/15/36 | 1,717,000 | 2,021,768 | |
| 6.6% 3/15/46 | 2,590,000 | 3,095,050 | |
| 6.625% 9/1/30 | 8,330,000 | 9,693,329 | |
| 6.95% 7/1/24 | 2,770,000 | 3,005,450 | |
| 7.5% 5/1/31 | 10,215,000 | 12,385,688 | |
| 8.875% 7/15/30 | 6,715,000 | 8,682,495 | |
| PBF Holding Co. LLC/PBF Finance Corp.: | |||
| 6% 2/15/28 | 5,755,000 | 4,210,531 | |
| 7.25% 6/15/25 | 2,085,000 | 1,751,400 | |
| 9.25% 5/15/25 (c) | 6,375,000 | 6,438,750 | |
| PBF Logistics LP/PBF Logistics Finance, Inc. 6.875% 5/15/23 | 3,935,000 | 3,915,325 | |
| SM Energy Co.: | |||
| 6.5% 7/15/28 | 920,000 | 943,000 | |
| 6.625% 1/15/27 | 1,145,000 | 1,162,278 | |
| 6.75% 9/15/26 | 805,000 | 813,050 | |
| Southwestern Energy Co.: | |||
| 4.75% 2/1/32 | 2,135,000 | 2,123,087 | |
| 5.375% 2/1/29 | 4,415,000 | 4,542,020 | |
| 8.375% 9/15/28 | 2,500,000 | 2,728,125 | |
| Suburban Propane Partners LP/Suburban Energy Finance Corp. 5.875% 3/1/27 | 3,905,000 | 3,978,219 | |
| Sunoco LP/Sunoco Finance Corp. 4.5% 5/15/29 | 2,280,000 | 2,184,924 | |
| Tallgrass Energy Partners LP / Tallgrass Energy Finance Corp. 6% 12/31/30 (c) | 2,370,000 | 2,282,689 | |
| Targa Resources Partners LP/Targa Resources Partners Finance Corp.: | |||
| 6.5% 7/15/27 | 1,275,000 | 1,351,500 | |
| 6.875% 1/15/29 | 2,255,000 | 2,454,365 | |
| Transocean Sentry Ltd. 5.375% 5/15/23 (c) | 2,253,695 | 2,174,815 | |
| Tullow Oil PLC 10.25% 5/15/26 (c) | 7,345,000 | 7,124,650 | |
| Valaris Ltd. 8.25% 4/30/28 pay-in-kind (d) | 660,000 | 688,182 | |
| Venture Global Calcasieu Pass LLC: | |||
| 3.875% 8/15/29 (c) | 2,220,000 | 2,173,269 | |
| 4.125% 8/15/31 (c) | 2,220,000 | 2,197,800 | |
| Viper Energy Partners LP 5.375% 11/1/27 (c) | 1,105,000 | 1,133,730 | |
| 240,422,295 | |||
| Environmental - 0.5% | |||
| Covanta Holding Corp. 4.875% 12/1/29 (c) | 1,355,000 | 1,296,577 | |
| Darling Ingredients, Inc. 5.25% 4/15/27 (c) | 2,760,000 | 2,808,466 | |
| Madison IAQ LLC: | |||
| 4.125% 6/30/28 (c) | 1,795,000 | 1,698,043 | |
| 5.875% 6/30/29 (c) | 2,775,000 | 2,518,313 | |
| Stericycle, Inc. 3.875% 1/15/29 (c) | 1,645,000 | 1,531,906 | |
| 9,853,305 | |||
| Food & Drug Retail - 0.8% | |||
| Albertsons Companies LLC/Safeway, Inc./New Albertson's, Inc./Albertson's LLC: | |||
| 3.5% 3/15/29 (c) | 1,655,000 | 1,539,150 | |
| 4.625% 1/15/27 (c) | 4,615,000 | 4,635,248 | |
| 4.875% 2/15/30 (c) | 6,890,000 | 6,907,225 | |
| Emergent BioSolutions, Inc. 3.875% 8/15/28 (c) | 1,605,000 | 1,435,689 | |
| Murphy Oil U.S.A., Inc. 3.75% 2/15/31 (c) | 960,000 | 890,400 | |
| SEG Holding LLC/SEG Finance Corp. 5.625% 10/15/28 (c) | 2,200,000 | 2,266,000 | |
| 17,673,712 | |||
| Food/Beverage/Tobacco - 2.7% | |||
| C&S Group Enterprises LLC 5% 12/15/28 (c) | 1,905,000 | 1,657,350 | |
| Chobani LLC/Finance Corp., Inc.: | |||
| 4.625% 11/15/28 (c) | 1,465,000 | 1,411,029 | |
| 7.5% 4/15/25 (c) | 450,000 | 447,750 | |
| Del Monte Foods, Inc. 11.875% 5/15/25 (c) | 3,785,000 | 4,183,825 | |
| JBS U.S.A. LLC/JBS U.S.A. Finance, Inc. 6.75% 2/15/28 (c) | 6,150,000 | 6,472,937 | |
| JBS U.S.A. Lux SA / JBS Food Co.: | |||
| 5.5% 1/15/30 (c) | 4,395,000 | 4,541,024 | |
| 6.5% 4/15/29 (c) | 3,640,000 | 3,862,950 | |
| KeHE Distributors LLC / KeHE Finance Corp. 8.625% 10/15/26 (c) | 1,702,000 | 1,799,865 | |
| Kraft Heinz Foods Co.: | |||
| 4.375% 6/1/46 | 645,000 | 661,125 | |
| 4.875% 10/1/49 | 3,225,000 | 3,571,688 | |
| 5.5% 6/1/50 | 855,000 | 1,023,863 | |
| Lamb Weston Holdings, Inc. 4.125% 1/31/30 (c) | 2,290,000 | 2,215,575 | |
| Performance Food Group, Inc.: | |||
| 4.25% 8/1/29 (c) | 1,350,000 | 1,287,900 | |
| 5.5% 10/15/27 (c) | 5,775,000 | 5,876,063 | |
| 6.875% 5/1/25 (c) | 995,000 | 1,031,069 | |
| Pilgrim's Pride Corp. 4.25% 4/15/31 (c) | 3,045,000 | 2,941,242 | |
| Post Holdings, Inc.: | |||
| 4.625% 4/15/30 (c) | 3,690,000 | 3,473,987 | |
| 5.75% 3/1/27 (c) | 800,000 | 808,400 | |
| Simmons Foods, Inc. 4.625% 3/1/29 (c) | 1,455,000 | 1,347,825 | |
| TreeHouse Foods, Inc. 4% 9/1/28 | 860,000 | 784,750 | |
| Triton Water Holdings, Inc. 6.25% 4/1/29 (c) | 1,080,000 | 995,090 | |
| U.S. Foods, Inc.: | |||
| 4.625% 6/1/30 (c) | 1,110,000 | 1,079,342 | |
| 4.75% 2/15/29 (c) | 3,100,000 | 3,066,520 | |
| United Natural Foods, Inc. 6.75% 10/15/28 (c) | 1,810,000 | 1,871,088 | |
| 56,412,257 | |||
| Gaming - 3.1% | |||
| Affinity Gaming LLC 6.875% 12/15/27 (c) | 890,000 | 876,650 | |
| Boyd Gaming Corp. 8.625% 6/1/25 (c) | 3,034,000 | 3,193,285 | |
| Caesars Entertainment, Inc.: | |||
| 4.625% 10/15/29 (c) | 2,860,000 | 2,713,425 | |
| 8.125% 7/1/27 (c) | 12,765,000 | 13,760,415 | |
| Fertitta Entertainment LLC / Fertitta Entertainment Finance Co., Inc.: | |||
| 4.625% 1/15/29 (c) | 2,925,000 | 2,800,688 | |
| 6.75% 1/15/30 (c) | 5,120,000 | 4,873,907 | |
| Golden Entertainment, Inc. 7.625% 4/15/26 (c) | 935,000 | 960,713 | |
| Jacobs Entertainment, Inc. 6.75% 2/15/29 (c) | 1,245,000 | 1,249,669 | |
| MGM Growth Properties Operating Partnership LP: | |||
| 4.5% 9/1/26 | 4,310,000 | 4,397,191 | |
| 4.625% 6/15/25 (c) | 5,180,000 | 5,335,400 | |
| MGM Resorts International: | |||
| 6.75% 5/1/25 | 3,350,000 | 3,467,250 | |
| 7.75% 3/15/22 | 660,000 | 661,386 | |
| Peninsula Pacific Entertainment LLC 8.5% 11/15/27 (c) | 3,010,000 | 3,332,612 | |
| Station Casinos LLC 4.625% 12/1/31 (c) | 3,685,000 | 3,473,113 | |
| Studio City Finance Ltd. 6.5% 1/15/28 (c) | 5,015,000 | 4,388,125 | |
| Sugarhouse HSP Gaming Prop Mezz LP/Sugarhouse HSP Gaming Finance Corp. 5.875% 5/15/25 (c) | 3,915,000 | 3,866,063 | |
| Wynn Resorts Finance LLC / Wynn Resorts Capital Corp. 7.75% 4/15/25 (c) | 4,675,000 | 4,880,233 | |
| 64,230,125 | |||
| Healthcare - 7.4% | |||
| AHP Health Partners, Inc. 5.75% 7/15/29 (c) | 2,665,000 | 2,519,384 | |
| Akumin, Inc. 7% 11/1/25 (c) | 4,155,000 | 3,625,238 | |
| Avantor Funding, Inc.: | |||
| 3.875% 11/1/29 (c) | 2,290,000 | 2,203,690 | |
| 4.625% 7/15/28 (c) | 3,345,000 | 3,395,175 | |
| Bausch Health Companies, Inc.: | |||
| 7.25% 5/30/29 (c) | 1,055,000 | 923,083 | |
| 9% 12/15/25 (c) | 1,775,000 | 1,830,469 | |
| Catalent Pharma Solutions 5% 7/15/27 (c) | 825,000 | 842,993 | |
| Centene Corp.: | |||
| 3.375% 2/15/30 | 2,690,000 | 2,580,974 | |
| 4.25% 12/15/27 | 3,475,000 | 3,557,184 | |
| 4.625% 12/15/29 | 3,825,000 | 3,939,750 | |
| Charles River Laboratories International, Inc.: | |||
| 3.75% 3/15/29 (c) | 740,000 | 711,288 | |
| 4% 3/15/31 (c) | 2,080,000 | 1,991,600 | |
| 4.25% 5/1/28 (c) | 735,000 | 728,569 | |
| Community Health Systems, Inc.: | |||
| 4.75% 2/15/31 (c) | 2,885,000 | 2,715,506 | |
| 5.25% 5/15/30 (c) | 4,900,000 | 4,746,189 | |
| 5.625% 3/15/27 (c) | 2,430,000 | 2,449,926 | |
| 6% 1/15/29 (c) | 2,415,000 | 2,418,019 | |
| 6.125% 4/1/30 (c) | 5,840,000 | 5,431,200 | |
| 6.875% 4/15/29 (c) | 2,815,000 | 2,729,706 | |
| 8% 3/15/26 (c) | 12,925,000 | 13,409,688 | |
| DaVita HealthCare Partners, Inc.: | |||
| 3.75% 2/15/31 (c) | 2,495,000 | 2,279,806 | |
| 4.625% 6/1/30 (c) | 6,965,000 | 6,677,694 | |
| Encompass Health Corp. 5.75% 9/15/25 | 4,660,000 | 4,718,250 | |
| Grifols Escrow Issuer SA 4.75% 10/15/28 (c) | 1,085,000 | 1,022,613 | |
| HCA Holdings, Inc.: | |||
| 5.875% 5/1/23 | 1,150,000 | 1,196,000 | |
| 5.875% 2/1/29 | 1,355,000 | 1,514,213 | |
| HealthEquity, Inc. 4.5% 10/1/29 (c) | 1,005,000 | 956,609 | |
| Hologic, Inc. 3.25% 2/15/29 (c) | 2,525,000 | 2,392,438 | |
| IQVIA, Inc.: | |||
| 5% 10/15/26 (c) | 1,750,000 | 1,786,015 | |
| 5% 5/15/27 (c) | 1,385,000 | 1,416,758 | |
| Jazz Securities DAC 4.375% 1/15/29 (c) | 1,980,000 | 1,961,111 | |
| Minerva Merger Sub, Inc. 6.5% 2/15/30 (c) | 8,510,000 | 8,192,747 | |
| Molina Healthcare, Inc.: | |||
| 3.875% 11/15/30 (c) | 2,430,000 | 2,387,475 | |
| 3.875% 5/15/32 (c) | 3,315,000 | 3,247,689 | |
| 4.375% 6/15/28 (c) | 1,835,000 | 1,832,706 | |
| Mozart Debt Merger Sub, Inc. 3.875% 4/1/29 (c) | 4,435,000 | 4,208,083 | |
| Option Care Health, Inc. 4.375% 10/31/29 (c) | 1,060,000 | 1,022,900 | |
| Organon & Co. / Organon Foreign Debt Co-Issuer BV: | |||
| 4.125% 4/30/28 (c) | 3,005,000 | 2,955,748 | |
| 5.125% 4/30/31 (c) | 2,995,000 | 2,989,819 | |
| Ortho-Clinical Diagnostics, Inc.: | |||
| 7.25% 2/1/28 (c) | 609,000 | 636,405 | |
| 7.375% 6/1/25 (c) | 1,296,000 | 1,338,379 | |
| Radiology Partners, Inc. 9.25% 2/1/28 (c) | 5,385,000 | 5,371,538 | |
| RP Escrow Issuer LLC 5.25% 12/15/25 (c) | 2,295,000 | 2,243,363 | |
| Surgery Center Holdings, Inc.: | |||
| 6.75% 7/1/25 (c) | 250,000 | 248,750 | |
| 10% 4/15/27 (c) | 3,010,000 | 3,171,035 | |
| Tenet Healthcare Corp.: | |||
| 4.25% 6/1/29 (c) | 6,200,000 | 5,984,240 | |
| 4.375% 1/15/30 (c) | 6,565,000 | 6,336,735 | |
| 6.125% 10/1/28 (c) | 10,860,000 | 11,001,180 | |
| 6.875% 11/15/31 | 330,000 | 352,351 | |
| Valeant Pharmaceuticals International, Inc. 9.25% 4/1/26 (c) | 2,030,000 | 2,098,939 | |
| Vizient, Inc. 6.25% 5/15/27 (c) | 680,000 | 704,650 | |
| 154,995,870 | |||
| Homebuilders/Real Estate - 1.7% | |||
| Arcosa, Inc. 4.375% 4/15/29 (c) | 1,425,000 | 1,350,188 | |
| Ashton Woods U.S.A. LLC/Ashton Woods Finance Co.: | |||
| 4.625% 8/1/29 (c) | 1,380,000 | 1,311,000 | |
| 6.625% 1/15/28 (c) | 40,000 | 41,100 | |
| Kennedy-Wilson, Inc.: | |||
| 4.75% 3/1/29 | 2,190,000 | 2,138,951 | |
| 5% 3/1/31 | 2,190,000 | 2,125,012 | |
| MPT Operating Partnership LP/MPT Finance Corp. 5% 10/15/27 | 5,005,000 | 5,114,134 | |
| New Home Co., Inc. 7.25% 10/15/25 (c) | 1,685,000 | 1,672,363 | |
| Realogy Group LLC/Realogy Co-Issuer Corp. 5.75% 1/15/29 (c) | 1,225,000 | 1,211,219 | |
| Realogy Group LLC/Realogy Co.-Issuer Corp. 5.25% 4/15/30 (c) | 3,620,000 | 3,449,860 | |
| Starwood Property Trust, Inc. 4.75% 3/15/25 | 2,420,000 | 2,445,173 | |
| Taylor Morrison Communities, Inc./Monarch Communities, Inc. 5.75% 1/15/28 (c) | 2,945,000 | 3,070,163 | |
| TRI Pointe Homes, Inc. 5.7% 6/15/28 | 795,000 | 800,966 | |
| Uniti Group LP / Uniti Group Finance, Inc.: | |||
| 4.75% 4/15/28 (c) | 2,035,000 | 1,937,045 | |
| 6.5% 2/15/29 (c) | 3,300,000 | 3,058,341 | |
| VICI Properties, Inc.: | |||
| 3.75% 2/15/27 (c) | 1,965,000 | 1,950,263 | |
| 4.125% 8/15/30 (c) | 2,575,000 | 2,555,688 | |
| Weekley Homes LLC/Weekley Finance Corp. 4.875% 9/15/28 (c) | 1,185,000 | 1,127,184 | |
| 35,358,650 | |||
| Hotels - 0.6% | |||
| Hilton Domestic Operating Co., Inc.: | |||
| 3.625% 2/15/32 (c) | 1,470,000 | 1,397,382 | |
| 3.75% 5/1/29 (c) | 1,650,000 | 1,592,250 | |
| 4% 5/1/31 (c) | 1,650,000 | 1,612,735 | |
| 5.375% 5/1/25 (c) | 3,525,000 | 3,634,522 | |
| Lindblad Expeditions LLC 6.75% 2/15/27 (c) | 2,120,000 | 2,130,600 | |
| Marriott Ownership Resorts, Inc. 4.5% 6/15/29 (c) | 2,365,000 | 2,240,838 | |
| 12,608,327 | |||
| Insurance - 1.5% | |||
| Acrisure LLC / Acrisure Finance, Inc.: | |||
| 7% 11/15/25 (c) | 9,401,000 | 9,364,336 | |
| 10.125% 8/1/26 (c) | 2,450,000 | 2,595,138 | |
| Alliant Holdings Intermediate LLC: | |||
| 5.875% 11/1/29 (c) | 3,030,000 | 2,860,472 | |
| 6.75% 10/15/27 (c) | 9,895,000 | 9,672,363 | |
| AmWINS Group, Inc. 4.875% 6/30/29 (c) | 1,400,000 | 1,333,500 | |
| AssuredPartners, Inc. 5.625% 1/15/29 (c) | 1,445,000 | 1,329,111 | |
| HUB International Ltd. 7% 5/1/26 (c) | 1,395,000 | 1,404,347 | |
| USI, Inc. 6.875% 5/1/25 (c) | 3,250,000 | 3,263,683 | |
| 31,822,950 | |||
| Leisure - 1.8% | |||
| Carnival Corp.: | |||
| 5.75% 3/1/27 (c) | 5,135,000 | 4,993,788 | |
| 9.875% 8/1/27 (c) | 4,130,000 | 4,635,925 | |
| 10.5% 2/1/26 (c) | 2,400,000 | 2,694,000 | |
| NCL Corp. Ltd.: | |||
| 5.875% 3/15/26 (c) | 735,000 | 707,438 | |
| 5.875% 2/15/27 (c) | 2,890,000 | 2,888,338 | |
| 7.75% 2/15/29 (c) | 2,575,000 | 2,651,735 | |
| NCL Finance Ltd. 6.125% 3/15/28 (c) | 910,000 | 878,150 | |
| Royal Caribbean Cruises Ltd.: | |||
| 4.25% 7/1/26 (c) | 4,375,000 | 4,145,313 | |
| 5.375% 7/15/27 (c) | 1,975,000 | 1,940,161 | |
| 5.5% 8/31/26 (c) | 4,495,000 | 4,473,761 | |
| 11.5% 6/1/25 (c) | 1,196,000 | 1,317,095 | |
| Studio City Co. Ltd. 7% 2/15/27 (c) | 2,315,000 | 2,284,442 | |
| Vail Resorts, Inc. 6.25% 5/15/25 (c) | 1,435,000 | 1,478,050 | |
| Viking Cruises Ltd. 13% 5/15/25 (c) | 2,135,000 | 2,372,519 | |
| 37,460,715 | |||
| Metals/Mining - 2.2% | |||
| Alcoa Nederland Holding BV 4.125% 3/31/29 (c) | 2,670,000 | 2,678,205 | |
| Alpha Natural Resources, Inc. 9.75% 4/15/18 (a)(f) | 1,099,000 | 0 | |
| Arconic Corp. 6% 5/15/25 (c) | 1,520,000 | 1,565,600 | |
| Cleveland-Cliffs, Inc.: | |||
| 4.625% 3/1/29 (c) | 1,465,000 | 1,413,725 | |
| 4.875% 3/1/31 (c) | 1,465,000 | 1,430,426 | |
| Constellium NV 5.875% 2/15/26 (c) | 990,000 | 1,002,375 | |
| ERO Copper Corp. 6.5% 2/15/30 (c) | 7,425,000 | 7,184,579 | |
| First Quantum Minerals Ltd.: | |||
| 6.875% 3/1/26 (c) | 5,275,000 | 5,424,348 | |
| 6.875% 10/15/27 (c) | 8,465,000 | 8,959,102 | |
| 7.5% 4/1/25 (c) | 2,320,000 | 2,367,125 | |
| FMG Resources (August 2006) Pty Ltd.: | |||
| 4.375% 4/1/31 (c) | 1,615,000 | 1,567,035 | |
| 5.125% 5/15/24 (c) | 770,000 | 791,344 | |
| Freeport-McMoRan, Inc. 4.625% 8/1/30 | 2,510,000 | 2,591,173 | |
| Howmet Aerospace, Inc. 5.95% 2/1/37 | 1,505,000 | 1,665,087 | |
| HudBay Minerals, Inc. 6.125% 4/1/29 (c) | 4,755,000 | 4,861,988 | |
| Joseph T. Ryerson & Son, Inc. 8.5% 8/1/28 (c) | 1,411,000 | 1,526,377 | |
| 45,028,489 | |||
| Paper - 0.5% | |||
| Berry Global, Inc. 5.625% 7/15/27 (c) | 1,110,000 | 1,137,306 | |
| Enviva Partners LP / Enviva Partners Finance Corp. 6.5% 1/15/26 (c) | 3,315,000 | 3,418,097 | |
| Intertape Polymer Group, Inc. 4.375% 6/15/29 (c) | 1,430,000 | 1,355,283 | |
| Mercer International, Inc. 5.125% 2/1/29 | 2,220,000 | 2,170,899 | |
| SPA Holdings 3 OY 4.875% 2/4/28 (c) | 1,770,000 | 1,671,765 | |
| 9,753,350 | |||
| Publishing/Printing - 0.1% | |||
| Clear Channel International BV 6.625% 8/1/25 (c) | 1,170,000 | 1,187,550 | |
| Restaurants - 0.7% | |||
| 1011778 BC Unlimited Liability Co./New Red Finance, Inc. 4% 10/15/30 (c) | 7,635,000 | 7,052,831 | |
| CEC Entertainment LLC 6.75% 5/1/26 (c) | 2,250,000 | 2,141,145 | |
| KFC Holding Co./Pizza Hut Holding LLC 4.75% 6/1/27 (c) | 1,325,000 | 1,357,396 | |
| Papa John's International, Inc. 3.875% 9/15/29 (c) | 870,000 | 809,100 | |
| Yum! Brands, Inc.: | |||
| 4.625% 1/31/32 | 2,585,000 | 2,533,300 | |
| 7.75% 4/1/25 (c) | 785,000 | 817,931 | |
| 14,711,703 | |||
| Services - 4.5% | |||
| Adtalem Global Education, Inc. 5.5% 3/1/28 (c) | 8,760,000 | 7,835,207 | |
| Allied Universal Holdco LLC / Allied Universal Finance Corp. 6% 6/1/29 (c) | 1,050,000 | 976,500 | |
| Aramark Services, Inc. 6.375% 5/1/25 (c) | 3,410,000 | 3,531,055 | |
| ASGN, Inc. 4.625% 5/15/28 (c) | 5,875,000 | 5,801,563 | |
| Atlas Luxco 4 SARL / Allied Universal Holdco LLC / Allied Universal Finance Corp. 4.625% 6/1/28 (c) | 1,328,000 | 1,242,649 | |
| Avis Budget Car Rental LLC/Avis Budget Finance, Inc. 5.375% 3/1/29 (c) | 1,470,000 | 1,446,083 | |
| Booz Allen Hamilton, Inc. 3.875% 9/1/28 (c) | 2,405,000 | 2,354,086 | |
| Brand Energy & Infrastructure Services, Inc. 8.5% 7/15/25 (c) | 15,565,000 | 14,280,888 | |
| CoreCivic, Inc.: | |||
| 4.625% 5/1/23 | 255,000 | 255,056 | |
| 8.25% 4/15/26 | 3,735,000 | 3,791,025 | |
| GEMS MENASA Cayman Ltd. 7.125% 7/31/26 (c) | 9,979,000 | 10,102,490 | |
| H&E Equipment Services, Inc. 3.875% 12/15/28 (c) | 4,110,000 | 3,846,097 | |
| Hertz Corp.: | |||
| 4.625% 12/1/26 (c) | 1,680,000 | 1,600,200 | |
| 5% 12/1/29 (c) | 2,190,000 | 2,042,832 | |
| 5.5% 10/15/24 (a)(c)(f) | 3,155,000 | 3,944 | |
| 6% 1/15/28 (a)(c)(f) | 3,900,000 | 229,125 | |
| 6.25% 10/15/22 (a)(f) | 2,880,000 | 3,600 | |
| 7.125% 8/1/26 (a)(c)(f) | 3,980,000 | 228,850 | |
| IHS Markit Ltd.: | |||
| 4% 3/1/26 (c) | 400,000 | 424,343 | |
| 4.75% 2/15/25 (c) | 955,000 | 1,014,822 | |
| 5% 11/1/22 (c) | 200,000 | 203,325 | |
| KAR Auction Services, Inc. 5.125% 6/1/25 (c) | 810,000 | 820,222 | |
| Sabre GLBL, Inc. 7.375% 9/1/25 (c) | 2,500,000 | 2,591,138 | |
| Service Corp. International 5.125% 6/1/29 | 1,845,000 | 1,891,125 | |
| Sotheby's 7.375% 10/15/27 (c) | 3,160,000 | 3,290,540 | |
| The GEO Group, Inc.: | |||
| 5.125% 4/1/23 | 1,665,000 | 1,581,750 | |
| 5.875% 10/15/24 | 685,000 | 602,800 | |
| 6% 4/15/26 | 6,055,000 | 4,995,375 | |
| Uber Technologies, Inc.: | |||
| 4.5% 8/15/29 (c) | 12,875,000 | 12,325,881 | |
| 6.25% 1/15/28 (c) | 2,145,000 | 2,188,694 | |
| WASH Multifamily Acquisition, Inc. 5.75% 4/15/26 (c) | 1,640,000 | 1,653,104 | |
| 93,154,369 | |||
| Steel - 0.4% | |||
| Commercial Metals Co. 3.875% 2/15/31 | 1,125,000 | 1,052,516 | |
| Infrabuild Australia Pty Ltd. 12% 10/1/24 (c) | 5,780,000 | 5,895,600 | |
| Roller Bearing Co. of America, Inc. 4.375% 10/15/29 (c) | 690,000 | 665,850 | |
| 7,613,966 | |||
| Super Retail - 1.7% | |||
| Asbury Automotive Group, Inc.: | |||
| 4.5% 3/1/28 | 681,000 | 669,307 | |
| 4.625% 11/15/29 (c) | 1,520,000 | 1,482,000 | |
| 4.75% 3/1/30 | 680,000 | 659,600 | |
| 5% 2/15/32 (c) | 1,520,000 | 1,475,449 | |
| Bath & Body Works, Inc. 6.625% 10/1/30 (c) | 5,045,000 | 5,461,414 | |
| Carvana Co.: | |||
| 4.875% 9/1/29 (c) | 3,620,000 | 3,018,030 | |
| 5.5% 4/15/27 (c) | 3,045,000 | 2,720,829 | |
| 5.875% 10/1/28 (c) | 2,505,000 | 2,235,713 | |
| EG Global Finance PLC: | |||
| 6.75% 2/7/25 (c) | 12,050,000 | 12,050,000 | |
| 8.5% 10/30/25 (c) | 2,520,000 | 2,545,200 | |
| Gap, Inc.: | |||
| 3.625% 10/1/29 (c) | 1,520,000 | 1,376,360 | |
| 3.875% 10/1/31 (c) | 2,595,000 | 2,325,600 | |
| 36,019,502 | |||
| Technology - 4.2% | |||
| Arches Buyer, Inc.: | |||
| 4.25% 6/1/28 (c) | 1,580,000 | 1,496,260 | |
| 6.125% 12/1/28 (c) | 555,000 | 521,700 | |
| Black Knight InfoServ LLC 3.625% 9/1/28 (c) | 2,675,000 | 2,532,235 | |
| Block, Inc.: | |||
| 2.75% 6/1/26 (c) | 2,555,000 | 2,478,350 | |
| 3.5% 6/1/31 (c) | 2,555,000 | 2,399,247 | |
| CA Magnum Holdings 5.375% (c)(g) | 770,000 | 770,963 | |
| Camelot Finance SA 4.5% 11/1/26 (c) | 2,285,000 | 2,287,171 | |
| CDK Global, Inc.: | |||
| 4.875% 6/1/27 | 460,000 | 471,063 | |
| 5.25% 5/15/29 (c) | 1,305,000 | 1,337,625 | |
| CDW LLC/CDW Finance Corp. 4.25% 4/1/28 | 2,960,000 | 2,915,600 | |
| Elastic NV 4.125% 7/15/29 (c) | 1,275,000 | 1,169,813 | |
| Go Daddy Operating Co. LLC / GD Finance Co., Inc. 5.25% 12/1/27 (c) | 2,235,000 | 2,274,113 | |
| II-VI, Inc. 5% 12/15/29 (c) | 1,385,000 | 1,383,504 | |
| ION Trading Technologies Ltd. 5.75% 5/15/28 (c) | 2,530,000 | 2,485,725 | |
| Match Group Holdings II LLC: | |||
| 4.125% 8/1/30 (c) | 2,335,000 | 2,260,233 | |
| 5% 12/15/27 (c) | 1,235,000 | 1,235,000 | |
| 5.625% 2/15/29 (c) | 2,035,000 | 2,110,702 | |
| MicroStrategy, Inc. 6.125% 6/15/28 (c) | 5,985,000 | 5,745,600 | |
| NCR Corp. 5.125% 4/15/29 (c) | 1,775,000 | 1,755,031 | |
| Northwest Fiber LLC/Northwest Fiber Finance Sub, Inc. 10.75% 6/1/28 (c) | 1,450,000 | 1,530,606 | |
| NortonLifeLock, Inc. 5% 4/15/25 (c) | 6,075,000 | 6,077,916 | |
| Nuance Communications, Inc. 5.625% 12/15/26 | 1,035,000 | 1,063,659 | |
| onsemi 3.875% 9/1/28 (c) | 3,110,000 | 3,082,788 | |
| Open Text Corp. 3.875% 12/1/29 (c) | 2,200,000 | 2,076,305 | |
| Open Text Holdings, Inc.: | |||
| 4.125% 2/15/30 (c) | 3,095,000 | 2,963,463 | |
| 4.125% 12/1/31 (c) | 2,200,000 | 2,090,000 | |
| Qorvo, Inc. 4.375% 10/15/29 | 5,505,000 | 5,566,931 | |
| Rackspace Hosting, Inc. 5.375% 12/1/28 (c) | 1,430,000 | 1,283,425 | |
| Roblox Corp. 3.875% 5/1/30(c) | 6,055,000 | 5,757,548 | |
| Sensata Technologies BV 4% 4/15/29 (c) | 2,480,000 | 2,380,800 | |
| Synaptics, Inc. 4% 6/15/29 (c) | 1,210,000 | 1,166,452 | |
| TTM Technologies, Inc. 4% 3/1/29 (c) | 2,215,000 | 2,043,338 | |
| Twilio, Inc.: | |||
| 3.625% 3/15/29 | 1,725,000 | 1,648,341 | |
| 3.875% 3/15/31 | 1,805,000 | 1,694,669 | |
| Uber Technologies, Inc.: | |||
| 7.5% 5/15/25 (c) | 5,010,000 | 5,211,653 | |
| 7.5% 9/15/27 (c) | 2,765,000 | 2,955,094 | |
| Unisys Corp. 6.875% 11/1/27 (c) | 1,425,000 | 1,499,813 | |
| 87,722,736 | |||
| Telecommunications - 8.0% | |||
| Altice Financing SA: | |||
| 5% 1/15/28 (c) | 2,375,000 | 2,140,041 | |
| 5.75% 8/15/29 (c) | 7,480,000 | 6,816,150 | |
| Altice France SA: | |||
| 5.125% 1/15/29 (c) | 2,270,000 | 2,060,025 | |
| 5.125% 7/15/29 (c) | 4,510,000 | 4,081,550 | |
| 5.5% 1/15/28 (c) | 4,825,000 | 4,511,375 | |
| C&W Senior Financing Designated Activity Co. 6.875% 9/15/27 (c) | 9,965,000 | 10,288,663 | |
| Cablevision Lightpath LLC: | |||
| 3.875% 9/15/27 (c) | 1,280,000 | 1,201,139 | |
| 5.625% 9/15/28 (c) | 1,010,000 | 914,050 | |
| Cogent Communications Group, Inc. 3.5% 5/1/26 (c) | 1,700,000 | 1,644,750 | |
| Consolidated Communications, Inc. 5% 10/1/28 (c) | 1,320,000 | 1,250,700 | |
| Frontier Communications Holdings LLC: | |||
| 5% 5/1/28 (c) | 2,480,000 | 2,407,460 | |
| 5.875% 10/15/27 (c) | 2,440,000 | 2,474,502 | |
| 5.875% 11/1/29 | 615,475 | 566,237 | |
| 6% 1/15/30 (c) | 3,035,000 | 2,827,103 | |
| 6.75% 5/1/29 (c) | 2,795,000 | 2,713,372 | |
| Intelsat Jackson Holdings SA: | |||
| 5.5% 8/1/23 (a)(f) | 7,570,000 | 1 | |
| 6.5% 3/15/30 (c) | 10,625,000 | 10,810,938 | |
| 8.5% 10/15/24 (a)(c)(f) | 2,965,000 | 0 | |
| LCPR Senior Secured Financing DAC: | |||
| 5.125% 7/15/29 (c) | 2,520,000 | 2,421,720 | |
| 6.75% 10/15/27 (c) | 4,724,000 | 4,806,670 | |
| Level 3 Financing, Inc.: | |||
| 3.75% 7/15/29 (c) | 3,850,000 | 3,433,892 | |
| 4.25% 7/1/28 (c) | 3,420,000 | 3,157,994 | |
| 4.625% 9/15/27 (c) | 7,220,000 | 6,967,300 | |
| Lumen Technologies, Inc.: | |||
| 4% 2/15/27 (c) | 4,225,000 | 4,020,383 | |
| 5.125% 12/15/26 (c) | 5,000,000 | 4,651,825 | |
| Northwest Fiber LLC/Northwest Fiber Finance Sub, Inc.: | |||
| 4.75% 4/30/27 (c) | 1,700,000 | 1,580,252 | |
| 6% 2/15/28 (c) | 790,000 | 691,250 | |
| Sable International Finance Ltd. 5.75% 9/7/27 (c) | 4,895,000 | 4,995,959 | |
| Sabre GLBL, Inc. 9.25% 4/15/25 (c) | 1,820,000 | 2,052,523 | |
| SBA Communications Corp. 3.875% 2/15/27 | 9,320,000 | 9,303,876 | |
| Sprint Capital Corp. 8.75% 3/15/32 | 26,030,000 | 36,116,589 | |
| Telecom Italia SpA 5.303% 5/30/24 (c) | 2,020,000 | 2,078,913 | |
| Telesat Canada/Telesat LLC 6.5% 10/15/27 (c) | 1,735,000 | 867,500 | |
| Uniti Group, Inc. 6% 1/15/30 (c) | 6,860,000 | 6,132,223 | |
| Windstream Escrow LLC 7.75% 8/15/28 (c) | 10,615,000 | 10,714,781 | |
| Zayo Group Holdings, Inc.: | |||
| 4% 3/1/27 (c) | 3,835,000 | 3,645,935 | |
| 6.125% 3/1/28 (c) | 2,115,000 | 1,965,321 | |
| 166,312,962 | |||
| Textiles/Apparel - 0.2% | |||
| Crocs, Inc.: | |||
| 4.125% 8/15/31 (c) | 2,540,000 | 2,165,350 | |
| 4.25% 3/15/29 (c) | 1,490,000 | 1,318,650 | |
| Victoria's Secret & Co. 4.625% 7/15/29 (c) | 1,665,000 | 1,565,100 | |
| 5,049,100 | |||
| Transportation Ex Air/Rail - 0.6% | |||
| Avolon Holdings Funding Ltd.: | |||
| 3.95% 7/1/24 (c) | 9,000 | 9,208 | |
| 4.375% 5/1/26 (c) | 7,000 | 7,208 | |
| Navios Maritime Holdings, Inc. 11.25% 8/15/22 (c) | 460,000 | 458,275 | |
| Navios South American Logistics, Inc./Navios Logistics Finance U.S., Inc. 10.75% 7/1/25 (c) | 5,110,000 | 5,368,694 | |
| Seaspan Corp.: | |||
| 5.5% 8/1/29 (c) | 3,695,000 | 3,519,488 | |
| 6.5% 4/29/26 (c) | 2,100,000 | 2,173,500 | |
| 11,536,373 | |||
| Utilities - 5.7% | |||
| Clearway Energy Operating LLC 4.75% 3/15/28 (c) | 5,885,000 | 5,915,278 | |
| DPL, Inc. 4.35% 4/15/29 | 9,480,000 | 9,243,000 | |
| InterGen NV 7% 6/30/23 (c) | 30,215,000 | 29,588,039 | |
| NRG Energy, Inc.: | |||
| 3.875% 2/15/32 (c) | 1,470,000 | 1,363,013 | |
| 5.25% 6/15/29 (c) | 3,050,000 | 3,111,000 | |
| 6.625% 1/15/27 | 891,000 | 920,840 | |
| Pacific Gas & Electric Co.: | |||
| 3.75% 8/15/42 | 350,000 | 298,980 | |
| 3.95% 12/1/47 | 2,495,000 | 2,173,509 | |
| 4.55% 7/1/30 | 16,150,000 | 16,589,316 | |
| 4.95% 7/1/50 | 23,225,000 | 23,005,850 | |
| PG&E Corp.: | |||
| 5% 7/1/28 | 3,405,000 | 3,370,950 | |
| 5.25% 7/1/30 | 9,430,000 | 9,367,102 | |
| Pike Corp. 5.5% 9/1/28 (c) | 6,330,000 | 6,092,625 | |
| TerraForm Global, Inc. 6.125% 3/1/26 (c) | 2,450,000 | 2,443,875 | |
| Vertiv Group Corp. 4.125% 11/15/28 (c) | 3,055,000 | 2,802,963 | |
| Vistra Operations Co. LLC 5.625% 2/15/27 (c) | 2,000,000 | 2,047,820 | |
| 118,334,160 | |||
| TOTAL NONCONVERTIBLE BONDS | 1,736,876,938 | ||
| TOTAL CORPORATE BONDS | |||
| (Cost $1,780,108,153) | 1,784,773,221 | ||
| Shares | Value | ||
| Common Stocks - 6.5% | |||
| Automotive & Auto Parts - 0.0% | |||
| UC Holdings, Inc. (a)(h) | 32,168 | 178,211 | |
| Broadcasting - 0.0% | |||
| iHeartMedia, Inc. (h) | 8,204 | 175,976 | |
| Chemicals - 0.0% | |||
| Corteva, Inc. | 10,266 | 534,140 | |
| Energy - 4.4% | |||
| California Resources Corp. | 233,262 | 9,617,392 | |
| California Resources Corp. warrants 10/27/24 (h) | 20,004 | 244,049 | |
| Chesapeake Energy Corp. (i) | 137,681 | 10,635,857 | |
| Chesapeake Energy Corp. (b) | 2,990 | 230,978 | |
| Denbury, Inc. (h) | 91,241 | 6,629,571 | |
| Denbury, Inc. warrants 9/18/25 (a)(h) | 118,677 | 5,093,617 | |
| EP Energy Corp. (a)(h) | 218,900 | 19,473,344 | |
| Forbes Energy Services Ltd. (a)(h) | 72,087 | 7 | |
| Jonah Energy Parent LLC (a)(h) | 425,801 | 23,572,343 | |
| Mesquite Energy, Inc. (a)(h) | 214,437 | 12,310,810 | |
| Noble Finance Co. (c) | 1,015 | 26,197 | |
| Noble Finance Co. (h) | 6,653 | 171,714 | |
| Noble Finance Co.: | |||
| warrants 2/5/28 (h) | 27,051 | 270,510 | |
| warrants 2/5/28 (h) | 27,051 | 235,344 | |
| PureWest Energy (a) | 2,832 | 33,999 | |
| PureWest Energy rights (a)(h) | 1,707 | 0 | |
| Superior Energy Services, Inc. Class A (a) | 15,005 | 384,137 | |
| Tidewater, Inc.: | |||
| warrants 11/14/42 (h) | 23,695 | 385,846 | |
| warrants 11/14/42 (h) | 8,251 | 134,358 | |
| Tribune Resources, Inc. (a)(h) | 182,155 | 123,865 | |
| Tribune Resources, Inc. warrants 3/30/23 (a)(h) | 51,925 | 1 | |
| Valaris Ltd. (h)(i) | 72,187 | 2,940,898 | |
| TOTAL ENERGY | 92,514,837 | ||
| Entertainment/Film - 0.0% | |||
| New Cotai LLC/New Cotai Capital Corp. (a)(b)(h) | 1,330,466 | 252,789 | |
| Food & Drug Retail - 0.8% | |||
| Northeast Grocery, Inc. (a)(b) | 228,430 | 90,888 | |
| Southeastern Grocers, Inc. (a)(b)(h) | 687,397 | 15,624,534 | |
| TOTAL FOOD & DRUG RETAIL | 15,715,422 | ||
| Gaming - 0.3% | |||
| Caesars Entertainment, Inc. (h) | 57,808 | 4,866,856 | |
| Studio City International Holdings Ltd. (c) | 25,434 | 127,913 | |
| Studio City International Holdings Ltd. ADR (h) | 28,000 | 140,818 | |
| TOTAL GAMING | 5,135,587 | ||
| Services - 0.2% | |||
| United Rentals, Inc. (h) | 11,400 | 3,666,468 | |
| Telecommunications - 0.3% | |||
| CUI Acquisition Corp. Class E (a)(h) | 0 | 16,065 | |
| Frontier Communications Parent, Inc. (h) | 77,463 | 2,134,106 | |
| Intelsat Emergence SA (a) | 99,434 | 3,878,920 | |
| Intelsat Jackson Holdings SA: | |||
| Series A rights (a) | 10,413 | 0 | |
| Series B rights (a) | 10,413 | 0 | |
| TOTAL TELECOMMUNICATIONS | 6,029,091 | ||
| Utilities - 0.5% | |||
| NRG Energy, Inc. | 60,111 | 2,274,600 | |
| Vistra Corp. | 359,562 | 8,205,205 | |
| TOTAL UTILITIES | 10,479,805 | ||
| TOTAL COMMON STOCKS | |||
| (Cost $77,078,179) | 134,682,326 | ||
| Convertible Preferred Stocks - 0.3% | |||
| Utilities - 0.3% | |||
| PG&E Corp. | |||
| (Cost $6,993,013) | 61,000 | 6,591,050 | |
| Principal Amount | Value | ||
| Bank Loan Obligations - 2.9% | |||
| Banks & Thrifts - 0.1% | |||
| First Eagle Holdings, Inc. Tranche B 1LN, term loan 3 month U.S. LIBOR + 2.500% 2.7238% 2/1/27 (d)(e)(j) | 1,073,526 | 1,054,739 | |
| Broadcasting - 0.1% | |||
| Springer Nature Deutschland GmbH Tranche B18 1LN, term loan 3 month U.S. LIBOR + 3.500% 3.75% 8/14/26 (d)(e)(j) | 1,130,162 | 1,124,512 | |
| Building Materials - 0.1% | |||
| Hunter Douglas, Inc. term loan U.S. Secured Overnight Fin. Rate (SOFR) Indx + 3.500% 2/9/29 (e)(j)(k) | 1,545,000 | 1,520,867 | |
| Chemicals - 0.3% | |||
| Consolidated Energy Finance SA: | |||
| Tranche B 1LN, term loan 3 month U.S. LIBOR + 3.500% 4.0287% 5/7/25 (a)(d)(e)(j) | 5,756,075 | 5,640,954 | |
| Tranche B, term loan 3 month U.S. LIBOR + 2.500% 2.964% 5/7/25 (d)(e)(j) | 525,925 | 496,999 | |
| Starfruit U.S. Holdco LLC Tranche B, term loan 3 month U.S. LIBOR + 3.000% 3.1872% 10/1/25 (d)(e)(j) | 657,589 | 648,876 | |
| TOTAL CHEMICALS | 6,786,829 | ||
| Consumer Products - 0.1% | |||
| Michaels Companies, Inc. 1LN, term loan 3 month U.S. LIBOR + 4.250% 5% 4/15/28 (d)(e)(j) | 930,325 | 863,137 | |
| The Golub Corp. 2LN, term loan 3 month U.S. LIBOR + 13.500% 15.5% 5/8/26 (a)(d)(e)(j) | 1,311,652 | 1,311,652 | |
| TOTAL CONSUMER PRODUCTS | 2,174,789 | ||
| Diversified Financial Services - 0.1% | |||
| Cabazon Finance Authority term loan 11% 3/7/24 pay-in-kind (a)(d)(j) | 2,733,751 | 2,733,751 | |
| HarbourVest Partners LLC Tranche B 1LN, term loan 3 month U.S. LIBOR + 2.250% 2.4884% 3/1/25 (d)(e)(j) | 252,962 | 250,875 | |
| TOTAL DIVERSIFIED FINANCIAL SERVICES | 2,984,626 | ||
| Energy - 0.2% | |||
| BCP Raptor II LLC Tranche B, term loan 3 month U.S. LIBOR + 4.750% 4.9586% 11/3/25 (d)(e)(j) | 1,159,724 | 1,155,131 | |
| BCP Raptor LLC Tranche B, term loan 3 month U.S. LIBOR + 4.250% 5.25% 6/24/24 (d)(e)(j) | 1,236,590 | 1,233,053 | |
| Citgo Holding, Inc. Tranche B 1LN, term loan 3 month U.S. LIBOR + 7.000% 8% 8/1/23 (d)(e)(j) | 298,138 | 293,442 | |
| Epic Crude Services LP Tranche B 1LN, term loan 3 month U.S. LIBOR + 5.000% 5.18% 3/1/26 (d)(e)(j) | 3,006,931 | 2,477,711 | |
| Mesquite Energy, Inc.: | |||
| 1LN, term loan 3 month U.S. LIBOR + 8.000% 0% (a)(e)(f)(j) | 3,964,252 | 0 | |
| term loan 3 month U.S. LIBOR + 0.000% 0% (a)(e)(f)(j) | 1,710,000 | 0 | |
| TOTAL ENERGY | 5,159,337 | ||
| Gaming - 0.1% | |||
| Boyd Gaming Corp. Tranche B 1LN, term loan 3 month U.S. LIBOR + 2.250% 2.3697% 9/15/23 (d)(e)(j) | 616,795 | 615,179 | |
| Golden Entertainment, Inc. Tranche B, term loan 3 month U.S. LIBOR + 3.000% 3.75% 10/20/24 (d)(e)(j) | 1,048,125 | 1,043,209 | |
| Scientific Games Holdings LP term loan U.S. Secured Overnight Fin. Rate (SOFR) Indx + 3.500% 2/4/29 (e)(j)(k) | 455,000 | 451,779 | |
| TOTAL GAMING | 2,110,167 | ||
| Healthcare - 0.1% | |||
| Electron BidCo, Inc. Tranche B 1LN, term loan 1 month U.S. LIBOR + 3.250% 3.75% 11/1/28 (d)(e)(j) | 290,000 | 286,784 | |
| Phoenix Newco, Inc. Tranche B 1LN, term loan 1 month U.S. LIBOR + 3.500% 4% 11/15/28 (d)(e)(j) | 1,135,000 | 1,125,069 | |
| TOTAL HEALTHCARE | 1,411,853 | ||
| Hotels - 0.1% | |||
| Travelport Finance Luxembourg SARL 1LN, term loan 3 month U.S. LIBOR + 6.750% 6.9738% 5/30/26 (d)(e)(j) | 1,382,134 | 1,129,894 | |
| Insurance - 0.1% | |||
| Acrisure LLC Tranche B 1LN, term loan 1 month U.S. LIBOR + 4.250% 4.75% 2/15/27 (d)(e)(j) | 215,000 | 212,717 | |
| Alliant Holdings Intermediate LLC: | |||
| Tranche B, term loan 3 month U.S. LIBOR + 3.250% 3.355% 5/10/25 (d)(e)(j) | 62,088 | 61,343 | |
| Tranche B-2 1LN, term loan 3 month U.S. LIBOR + 3.250% 3.355% 5/9/25 (d)(e)(j) | 2,008,500 | 1,983,032 | |
| USI, Inc. Tranche B, term loan 3 month U.S. LIBOR + 3.000% 3.2238% 5/16/24 (d)(e)(j) | 440,450 | 436,182 | |
| TOTAL INSURANCE | 2,693,274 | ||
| Leisure - 0.0% | |||
| Alterra Mountain Co. Tranche B 1LN, term loan 1 month U.S. LIBOR + 3.500% 4% 8/17/28 (d)(e)(j) | 43,316 | 42,811 | |
| Railroad - 0.0% | |||
| Einstein Merger Sub, Inc. 2LN, term loan 3 month U.S. LIBOR + 7.250% 7.75% 10/25/28 (a)(d)(e)(j) | 915,000 | 910,425 | |
| Services - 0.5% | |||
| ABG Intermediate Holdings 2 LLC Tranche B 2LN, term loan 3 month U.S. LIBOR + 6.000% 6.5% 12/20/29 (d)(e)(j) | 165,000 | 165,206 | |
| Ascend Learning LLC 2LN, term loan 1 month U.S. LIBOR + 5.750% 6.25% 12/10/29 (d)(e)(j) | 305,000 | 303,856 | |
| Finastra U.S.A., Inc. Tranche 2LN, term loan 3 month U.S. LIBOR + 7.250% 8.25% 6/13/25 (d)(e)(j) | 4,035,000 | 4,000,138 | |
| IRI Holdings, Inc. Tranche B 1LN, term loan 3 month U.S. LIBOR + 4.250% 4.355% 11/30/25 (d)(e)(j) | 3,048,331 | 3,039,430 | |
| KUEHG Corp. Tranche B 2LN, term loan 3 month U.S. LIBOR + 8.250% 9.25% 8/22/25 (d)(e)(j) | 2,230,000 | 2,200,742 | |
| Spin Holdco, Inc. Tranche B 1LN, term loan 3 month U.S. LIBOR + 4.000% 4.75% 3/4/28 (d)(e)(j) | 1,498,675 | 1,489,098 | |
| TOTAL SERVICES | 11,198,470 | ||
| Super Retail - 0.1% | |||
| Bass Pro Group LLC Tranche B 1LN, term loan 3 month U.S. LIBOR + 3.750% 4.5% 3/5/28 (d)(e)(j) | 2,649,528 | 2,633,631 | |
| Technology - 0.8% | |||
| Anastasia Parent LLC Tranche B, term loan 3 month U.S. LIBOR + 3.750% 3.9738% 8/10/25 (d)(e)(j) | 4,961,538 | 4,267,965 | |
| Athenahealth, Inc.: | |||
| Tranche B 1LN, term loan U.S. Secured Overnight Fin. Rate (SOFR) Indx + 3.500% 4% 1/27/29 (d)(e)(j) | 2,727,681 | 2,699,722 | |
| Tranche DD 1LN, term loan U.S. Secured Overnight Fin. Rate (SOFR) Indx + 3.500% 1/27/29 (e)(j)(l) | 462,319 | 457,580 | |
| Ceridian HCM Holding, Inc. Tranche B, term loan 3 month U.S. LIBOR + 2.500% 2.7086% 4/30/25 (d)(e)(j) | 1,586,700 | 1,561,916 | |
| Epicor Software Corp. 2LN, term loan 3 month U.S. LIBOR + 7.750% 8.75% 7/31/28 (d)(e)(j) | 1,945,000 | 1,980,010 | |
| UKG, Inc. 1LN, term loan 3 month U.S. LIBOR + 3.750% 3.9586% 5/4/26 (d)(e)(j) | 698,913 | 693,265 | |
| Ultimate Software Group, Inc.: | |||
| 1LN, term loan 1 month U.S. LIBOR + 3.250% 3.75% 5/3/26 (d)(e)(j) | 3,948,050 | 3,918,440 | |
| 2LN, term loan 1 month U.S. LIBOR + 5.250% 5.75% 5/3/27 (d)(e)(j) | 590,000 | 586,956 | |
| VS Buyer LLC Tranche B 1LN, term loan 3 month U.S. LIBOR + 3.000% 3.2086% 2/28/27 (d)(e)(j) | 442,125 | 437,151 | |
| TOTAL TECHNOLOGY | 16,603,005 | ||
| Telecommunications - 0.1% | |||
| Altice France SA Tranche B 13LN, term loan 3 month U.S. LIBOR + 4.000% 4.5064% 8/14/26 (d)(e)(j) | 1,064,250 | 1,053,033 | |
| TOTAL BANK LOAN OBLIGATIONS | |||
| (Cost $64,938,731) | 60,592,262 | ||
| Preferred Securities - 1.9% | |||
| Banks & Thrifts - 1.6% | |||
| Bank of America Corp.: | |||
| 4.3% (d)(g) | 2,610,000 | 2,528,571 | |
| 6.1% (d)(g) | 3,690,000 | 3,985,214 | |
| 6.25% (d)(g) | 2,310,000 | 2,477,970 | |
| Citigroup, Inc. 5.95% (d)(g) | 11,215,000 | 11,380,609 | |
| JPMorgan Chase & Co. 6% (d)(g) | 11,680,000 | 12,055,406 | |
| Wells Fargo & Co. 5.9% (d)(g) | 1,955,000 | 1,993,746 | |
| TOTAL BANKS & THRIFTS | 34,421,516 | ||
| Energy - 0.1% | |||
| MPLX LP 6.875% (d)(g) | 1,270,000 | 1,257,883 | |
| Summit Midstream Partners LP 9.5% (d)(g) | 204,000 | 171,581 | |
| TOTAL ENERGY | 1,429,464 | ||
| Insurance - 0.2% | |||
| Alliant Holdings Intermediate LLC 9.75% (a)(g) | 4,000,000 | 3,857,000 | |
| TOTAL PREFERRED SECURITIES | |||
| (Cost $40,096,844) | 39,707,980 | ||
| Shares | Value | ||
| Fixed-Income Funds - 0.2% | |||
| Fidelity Direct Lending Fund, LP (a)(b)(m) | |||
| (Cost $5,131,346) | 513,277 | 5,127,633 | |
| Other - 0.0% | |||
| Other - 0.0% | |||
| Tribune Co. Claim (a)(h) | |||
| (Cost $11,217) | 11,217 | 7,516 | |
| Money Market Funds - 1.9% | |||
| Fidelity Cash Central Fund 0.07% (n) | 27,170,120 | 27,175,554 | |
| Fidelity Securities Lending Cash Central Fund 0.07% (n)(o) | 12,454,955 | 12,456,200 | |
| TOTAL MONEY MARKET FUNDS | |||
| (Cost $39,631,754) | 39,631,754 | ||
| TOTAL INVESTMENT IN SECURITIES - 99.3% | |||
| (Cost $2,013,989,237) | 2,071,113,742 | ||
| NET OTHER ASSETS (LIABILITIES) - 0.7% | 14,299,821 | ||
| NET ASSETS - 100% | $2,085,413,563 |
Amounts shown as 0 in the Schedule of Investments may represent less than 1 share.
Legend
(a) Level 3 security
(b) Restricted securities (including private placements) - Investment in securities not registered under the Securities Act of 1933 (excluding 144A issues). At the end of the period, the value of restricted securities (excluding 144A issues) amounted to $44,624,783 or 2.1% of net assets.
(c) Security exempt from registration under Rule 144A of the Securities Act of 1933. These securities may be resold in transactions exempt from registration, normally to qualified institutional buyers. At the end of the period, the value of these securities amounted to $1,334,985,782 or 64.0% of net assets.
(d) Coupon rates for floating and adjustable rate securities reflect the rates in effect at period end.
(e) Coupon is indexed to a floating interest rate which may be multiplied by a specified factor and/or subject to caps or floors.
(f) Non-income producing - Security is in default.
(g) Security is perpetual in nature with no stated maturity date.
(h) Non-income producing
(i) Security or a portion of the security is on loan at period end.
(j) Remaining maturities of bank loan obligations may be less than the stated maturities shown as a result of contractual or optional prepayments by the borrower. Such prepayments cannot be predicted with certainty.
(k) The coupon rate will be determined upon settlement of the loan after period end.
(l) Position or a portion of the position represents an unfunded loan commitment. At period end, the total principal amount and market value of unfunded commitments totaled $462,319 and $456,397, respectively.
(m) Affiliated Fund
(n) Affiliated fund that is generally available only to investment companies and other accounts managed by Fidelity Investments. The rate quoted is the annualized seven-day yield of the fund at period end. A complete unaudited listing of the fund's holdings as of its most recent quarter end is available upon request. In addition, each Fidelity Central Fund's financial statements are available on the SEC's website or upon request.
(o) Investment made with cash collateral received from securities on loan.
Additional information on each restricted holding is as follows:
| Security | Acquisition Date | Acquisition Cost |
| Chesapeake Energy Corp. | 2/10/21 | $28,315 |
| Fidelity Direct Lending Fund, LP | 12/9/21 - 2/28/22 | $5,131,345 |
| Mesquite Energy, Inc. 15% 7/15/23 | 7/10/20 - 1/18/22 | $1,687,240 |
| Mesquite Energy, Inc. 15% 7/15/23 | 11/5/20 - 1/18/22 | $2,913,114 |
| New Cotai LLC/New Cotai Capital Corp. | 9/11/20 | $6,590,796 |
| Northeast Grocery, Inc. | 11/8/21 | $90,888 |
| Southeastern Grocers, Inc. | 6/1/18 - 4/26/19 | $5,072,958 |
Affiliated Central Funds
Fiscal year to date information regarding the Fund's investments in Fidelity Central Funds, including the ownership percentage, is presented below.
| Fund | Value, beginning of period | Purchases | Sales Proceeds | Dividend Income | Realized Gain/Loss | Change in Unrealized appreciation (depreciation) | Value, end of period | % ownership, end of period |
| Fidelity Cash Central Fund 0.07% | $101,214,485 | $367,588,397 | $441,627,328 | $17,917 | $-- | $-- | $27,175,554 | 0.1% |
| Fidelity Securities Lending Cash Central Fund 0.07% | -- | 18,892,730 | 6,436,530 | 617 | -- | -- | 12,456,200 | 0.0% |
| Total | $101,214,485 | $386,481,127 | $448,063,858 | $18,534 | $-- | $-- | $39,631,754 |
Amounts in the income column in the above table include any capital gain distributions from underlying funds, which are presented in the corresponding line-item in the Statement of Operations, if applicable. Amount for Fidelity Securities Lending Cash Central Fund represents the income earned on investing cash collateral, less rebates paid to borrowers and any lending agent fees associated with the loan, plus any premium payments received for lending certain types of securities.
Affiliated Underlying Funds
Fiscal year to date information regarding the Fund's investments in affiliated Underlying Funds is presented below. Exchanges between classes of the same affiliated Underlying Funds may occur. If an underlying Fund changes its name, the name presented below is the name in effect at period end.
| Affiliate | Value, beginning of period | Purchases | Sales Proceeds | Dividend Income | Realized Gain (loss) | Change in Unrealized appreciation (depreciation) | Value, end of period |
| Fidelity Direct Lending Fund, LP | $-- | $5,131,346 | $-- | $49,347 | $-- | $(3,713) | $5,127,633 |
| Total | $-- | $5,131,346 | $-- | $49,347 | $-- | $(3,713) | $5,127,633 |
Amounts in the income column in the above table include any capital gain distributions from underlying funds, which are presented in the corresponding line-item in the Statement of Operations, if applicable.
Investment Valuation
The following is a summary of the inputs used, as of February 28, 2022, involving the Fund's assets and liabilities carried at fair value. The inputs or methodology used for valuing securities may not be an indication of the risk associated with investing in those securities. For more information on valuation inputs, and their aggregation into the levels used below, please refer to the Investment Valuation section in the accompanying Notes to Financial Statements.
| Valuation Inputs at Reporting Date: | ||||
| Description | Total | Level 1 | Level 2 | Level 3 |
| Investments in Securities: | ||||
| Equities: | ||||
| Communication Services | $6,457,856 | $2,310,082 | $-- | $4,147,774 |
| Consumer Discretionary | 5,313,798 | 5,135,587 | -- | 178,211 |
| Consumer Staples | 15,715,422 | -- | -- | 15,715,422 |
| Energy | 92,480,838 | 31,002,510 | 520,204 | 60,958,124 |
| Industrials | 3,666,468 | 3,666,468 | -- | -- |
| Materials | 534,140 | 534,140 | -- | -- |
| Utilities | 17,104,854 | 10,479,805 | 6,591,050 | 33,999 |
| Corporate Bonds | 1,784,773,221 | -- | 1,759,483,489 | 25,289,732 |
| Bank Loan Obligations | 60,592,262 | -- | 49,995,480 | 10,596,782 |
| Preferred Securities | 39,707,980 | -- | 35,850,980 | 3,857,000 |
| Fixed-Income Funds | 5,127,633 | -- | -- | 5,127,633 |
| Other | 7,516 | -- | -- | 7,516 |
| Money Market Funds | 39,631,754 | 39,631,754 | -- | -- |
| Total Investments in Securities: | $2,071,113,742 | $92,760,346 | $1,852,441,203 | $125,912,193 |
The following is a reconciliation of Investments in Securities for which Level 3 inputs were used in determining value:
| Investments in Securities: | |
| Equities - Energy | |
| Beginning Balance | $47,227,878 |
| Net Realized Gain (Loss) on Investment Securities | -- |
| Net Unrealized Gain (Loss) on Investment Securities | 9,058,039 |
| Cost of Purchases | -- |
| Proceeds of Sales | -- |
| Amortization/Accretion | -- |
| Transfers into Level 3 | 4,672,207 |
| Transfers out of Level 3 | -- |
| Ending Balance | $60,958,124 |
| The change in unrealized gain (loss) for the period attributable to Level 3 securities held at February 28, 2022 | $9,058,039 |
| Corporate Bonds | |
| Beginning Balance | $15,036,742 |
| Net Realized Gain (Loss) on Investment Securities | (3,431,383) |
| Net Unrealized Gain (Loss) on Investment Securities | 12,042,380 |
| Cost of Purchases | 1,795,449 |
| Proceeds of Sales | (5,540,463) |
| Amortization/Accretion | (136,145) |
| Transfers into Level 3 | 5,537,500 |
| Transfers out of Level 3 | (14,348) |
| Ending Balance | $25,289,732 |
| The change in unrealized gain (loss) for the period attributable to Level 3 securities held at February 28, 2022 | $11,164,272 |
| Other Investments in Securities | |
| Beginning Balance | $33,272,800 |
| Net Realized Gain (Loss) on Investment Securities | 18,697 |
| Net Unrealized Gain (Loss) on Investment Securities | (2,903,443) |
| Cost of Purchases | 11,556,017 |
| Proceeds of Sales | (2,297,509) |
| Amortization/Accretion | 17,775 |
| Transfers into Level 3 | -- |
| Transfers out of Level 3 | -- |
| Ending Balance | $39,664,337 |
| The change in unrealized gain (loss) for the period attributable to Level 3 securities held at February 28, 2022 | $(2,885,212) |
The information used in the above reconciliations represents fiscal year to date activity for any Investments in Securities identified as using Level 3 inputs at either the beginning or the end of the current fiscal period. Cost of purchases and proceeds of sales may include securities received and/or delivered through in-kind transactions. Transfers in or out of Level 3 represent the beginning value of any Security or Instrument where a change in the pricing level occurred from the beginning to the end of the period. The cost of purchases and the proceeds of sales may include securities received or delivered through corporate actions or exchanges. Realized and unrealized gains (losses) disclosed in the reconciliations are included in Net Gain (Loss) on the Fund's Statement of Operations.
Other Information
Distribution of investments by country or territory of incorporation, as a percentage of Total Net Assets, is as follows (Unaudited):
| United States of America | 81.8% |
| Canada | 4.0% |
| Netherlands | 2.7% |
| Luxembourg | 2.3% |
| Multi-National | 1.4% |
| United Kingdom | 1.2% |
| Others (Individually Less Than 1%) | 6.6% |
| 100.0% |
See accompanying notes which are an integral part of the financial statements.
Financial Statements
Statement of Assets and Liabilities
| February 28, 2022 (Unaudited) | ||
| Assets | ||
| Investment in securities, at value (including securities loaned of $12,536,232) — See accompanying schedule: Unaffiliated issuers (cost $1,969,226,137) | $2,026,354,355 | |
| Fidelity Central Funds (cost $39,631,754) | 39,631,754 | |
| Other affiliated issuers (cost $5,131,346) | 5,127,633 | |
| Total Investment in Securities (cost $2,013,989,237) | $2,071,113,742 | |
| Cash | 16,575 | |
| Receivable for investments sold | 1,657,468 | |
| Receivable for fund shares sold | 1,822 | |
| Dividends receivable | 54,082 | |
| Interest receivable | 27,669,394 | |
| Distributions receivable from Fidelity Central Funds | 2,060 | |
| Other receivables | 1,198 | |
| Total assets | 2,100,516,341 | |
| Liabilities | ||
| Payable for investments purchased | $2,453,457 | |
| Payable for fund shares redeemed | 192,238 | |
| Other payables and accrued expenses | 883 | |
| Collateral on securities loaned | 12,456,200 | |
| Total liabilities | 15,102,778 | |
| Net Assets | $2,085,413,563 | |
| Net Assets consist of: | ||
| Paid in capital | $2,029,712,047 | |
| Total accumulated earnings (loss) | 55,701,516 | |
| Net Assets | $2,085,413,563 | |
| Net Asset Value, offering price and redemption price per share ($2,085,413,563 ÷ 18,712,998 shares) | $111.44 |
See accompanying notes which are an integral part of the financial statements.
Statement of Operations
| Six months ended February 28, 2022 (Unaudited) | ||
| Investment Income | ||
| Dividends (including $49,347 earned from other affiliated issuers) | $1,552,901 | |
| Interest | 56,848,521 | |
| Income from Fidelity Central Funds (including $617 from security lending) | 18,534 | |
| Total income | 58,419,956 | |
| Expenses | ||
| Custodian fees and expenses | $1,864 | |
| Independent directors' fees and expenses | 4,063 | |
| Legal | 95,280 | |
| Total expenses before reductions | 101,207 | |
| Expense reductions | (274) | |
| Total expenses after reductions | 100,933 | |
| Net investment income (loss) | 58,319,023 | |
| Realized and Unrealized Gain (Loss) | ||
| Net realized gain (loss) on: | ||
| Investment securities: | ||
| Unaffiliated issuers | 32,765,369 | |
| Total net realized gain (loss) | 32,765,369 | |
| Change in net unrealized appreciation (depreciation) on: | ||
| Investment securities: | ||
| Unaffiliated issuers | (108,486,956) | |
| Affiliated issuers | (3,713) | |
| Total change in net unrealized appreciation (depreciation) | (108,490,669) | |
| Net gain (loss) | (75,725,300) | |
| Net increase (decrease) in net assets resulting from operations | $(17,406,277) |
See accompanying notes which are an integral part of the financial statements.
Statement of Changes in Net Assets
| Six months ended February 28, 2022 (Unaudited) | Year ended August 31, 2021 | |
| Increase (Decrease) in Net Assets | ||
| Operations | ||
| Net investment income (loss) | $58,319,023 | $138,033,576 |
| Net realized gain (loss) | 32,765,369 | 8,306,687 |
| Change in net unrealized appreciation (depreciation) | (108,490,669) | 196,172,701 |
| Net increase (decrease) in net assets resulting from operations | (17,406,277) | 342,512,964 |
| Distributions to shareholders | (59,271,719) | (134,064,264) |
| Affiliated share transactions | ||
| Proceeds from sales of shares | 26,754,305 | 419,626,749 |
| Reinvestment of distributions | 59,143,359 | 133,259,818 |
| Cost of shares redeemed | (358,212,199) | (1,016,564,138) |
| Net increase (decrease) in net assets resulting from share transactions | (272,314,535) | (463,677,571) |
| Total increase (decrease) in net assets | (348,992,531) | (255,228,871) |
| Net Assets | ||
| Beginning of period | 2,434,406,094 | 2,689,634,965 |
| End of period | $2,085,413,563 | $2,434,406,094 |
| Other Information | ||
| Shares | ||
| Sold | 233,388 | 3,910,646 |
| Issued in reinvestment of distributions | 519,126 | 1,207,995 |
| Redeemed | (3,114,486) | (9,398,838) |
| Net increase (decrease) | (2,361,972) | (4,280,197) |
See accompanying notes which are an integral part of the financial statements.
Financial Highlights
Fidelity High Income Central Fund
| Six months ended (Unaudited) February 28, | Years endedAugust 31, | |||||
| 2022 | 2021 | 2020 | 2019 | 2018 | 2017 | |
| Selected Per–Share Data | ||||||
| Net asset value, beginning of period | $115.51 | $106.08 | $111.37 | $112.30 | $113.78 | $110.82 |
| Income from Investment Operations | ||||||
| Net investment income (loss)A,B | 2.948 | 6.202 | 6.432 | 7.276 | 7.336 | 7.352 |
| Net realized and unrealized gain (loss) | (4.017) | 9.246 | (5.023) | (.267) | (1.497) | 2.982 |
| Total from investment operations | (1.069) | 15.448 | 1.409 | 7.009 | 5.839 | 10.334 |
| Distributions from net investment income | (3.001) | (6.018) | (6.685) | (7.089) | (7.240) | (7.374) |
| Distributions from net realized gain | – | – | (.014) | (.850) | (.079) | – |
| Total distributions | (3.001) | (6.018) | (6.699) | (7.939) | (7.319) | (7.374) |
| Net asset value, end of period | $111.44 | $115.51 | $106.08 | $111.37 | $112.30 | $113.78 |
| Total ReturnC,D | (.95)% | 14.97% | 1.45% | 6.59% | 5.29% | 9.60% |
| Ratios to Average Net AssetsB,E,F | ||||||
| Expenses before reductions | .01%G | - %H | - %H | - %H | - %H | .01% |
| Expenses net of fee waivers, if any | .01%G | - %H | - %H | - %H | - %H | .01% |
| Expenses net of all reductions | .01%G | - %H | - %H | - %H | - %H | .01% |
| Net investment income (loss) | 5.20%G | 5.62% | 6.06% | 6.70% | 6.49% | 6.54% |
| Supplemental Data | ||||||
| Net assets, end of period (000 omitted) | $2,085,414 | $2,434,406 | $2,689,635 | $2,600,771 | $884,331 | $885,301 |
| Portfolio turnover rateI | 31%G | 37% | 59%J | 39%J,K | 57% | 46% |
A Calculated based on average shares outstanding during the period.
B Net investment income (loss) is affected by the timing of the declaration of dividends by any underlying mutual funds or exchange-traded funds (ETFs). Net investment income (loss) of any such underlying funds is not included in the Fund's net investment income (loss) ratio.
C Total returns for periods of less than one year are not annualized.
D Total returns would have been lower if certain expenses had not been reduced during the applicable periods shown.
E Fees and expenses of any underlying mutual funds or exchange-traded funds (ETFs) are not included in the Fund's expense ratio. The Fund indirectly bears its proportionate share of these expenses. For additional expense information related to investments in Fidelity Central Funds, please refer to the "Investments in Fidelity Central Funds" note found in the Notes to Financial Statements section of the most recent Annual or Semi-Annual report. For additional expense information related to investments in Fidelity Direct Lending Fund, LP, please refer to the Investment in Fidelity Direct Lending Fund, LP note found in the Notes to Financial Statements section of the most recent Annual or Semi-Annual report.
F Expense ratios reflect operating expenses of the class. Expenses before reductions do not reflect amounts reimbursed, waived, or reduced through arrangements with the investment adviser, brokerage services, or other offset arrangements, if applicable, and do not represent the amount paid by the class during periods when reimbursements, waivers or reductions occur.
G Annualized
H Amount represents less than .005%.
I Amount does not include the portfolio activity of any underlying mutual funds or exchange-traded funds (ETFs).
J Portfolio turnover rate excludes securities received or delivered in-kind.
K The portfolio turnover rate does not include the assets acquired in the merger.
See accompanying notes which are an integral part of the financial statements.
Notes to Financial Statements (Unaudited)
For the period ended February 28, 2022
1. Organization.
Fidelity High Income Central Fund (the Fund) is a fund of Fidelity Central Investment Portfolios LLC (the LLC) and is authorized to issue an unlimited number of shares. Shares of the Fund are only offered to other investment companies and accounts managed by Fidelity Management & Research Company LLC (FMR), or its affiliates (the Investing Funds). The LLC is registered under the Investment Company Act of 1940, as amended (the 1940 Act), as an open-end management investment company organized as a Delaware Limited Liability Company.
2. Investments in Fidelity Central Funds.
Funds may invest in Fidelity Central Funds, which are open-end investment companies generally available only to other investment companies and accounts managed by the investment adviser and its affiliates. The Schedule of Investments lists any Fidelity Central Funds held as an investment as of period end, but does not include the underlying holdings of each Fidelity Central Fund. An investing fund indirectly bears its proportionate share of the expenses of the underlying Fidelity Central Funds.
Based on its investment objective, each Fidelity Central Fund may invest or participate in various investment vehicles or strategies that are similar to those of the investing fund. These strategies are consistent with the investment objectives of the investing fund and may involve certain economic risks which may cause a decline in value of each of the Fidelity Central Funds and thus a decline in the value of the investing fund.
| Fidelity Central Fund | Investment Manager | Investment Objective | Investment Practices | Expense Ratio(a) |
| Fidelity Money Market Central Funds | Fidelity Management & Research Company LLC (FMR) | Each fund seeks to obtain a high level of current income consistent with the preservation of capital and liquidity. | Short-term Investments | Less than .005% |
(a) Expenses expressed as a percentage of average net assets and are as of each underlying Central Fund's most recent annual or semi-annual shareholder report.
A complete unaudited list of holdings for each Fidelity Central Fund is available upon request or at the Securities and Exchange Commission website at www.sec.gov. In addition, the financial statements of the Fidelity Central Funds which contain the significant accounting policies (including investment valuation policies) of those funds, and are not covered by the Report of Independent Registered Public Accounting Firm, are available on the Securities and Exchange Commission website or upon request.
3. Investment in Fidelity Direct Lending Fund, LP.
The Fund invests in Fidelity Direct Lending Fund, LP, which is a limited partnership available only to certain investment companies managed by the investment adviser and its affiliates. The Fund's limited partnership interest is not registered under the Securities Act of 1933, and is subject to substantial restrictions on transfer. The Fund has no redemption rights under the partnership agreement. There will be no trading market for the partnership interest, and the Fund most likely will hold its shares until Fidelity Direct Lending Fund, LP converts by operation of law to a Delaware corporation, trust, or other limited liability entity and (i) registers as a closed-end management investment company under the 1940 Act or (ii) elects to be treated as a business development company under the 1940 Act.
Based on its investment objective, Fidelity Direct Lending Fund, LP may invest or participate in various investments or strategies that are similar to those in which the Fund may invest or participate. These strategies are consistent with the investment objectives of the Fund and may involve certain economic risks which may cause a decline in value of Fidelity Direct Lending Fund, LP and thus a decline in the value of the Fund. The Fidelity Direct Lending Fund, LP intends to invest primarily in direct loans made to private U.S. companies, specifically small- and middle-market companies.
The Schedule of Investments lists Fidelity Direct Lending Fund, LP as an investment as of period end, but does not include the underlying holdings of Fidelity Direct Lending Fund, LP. Fidelity Direct Lending Fund, LP represented less than 5% of the Fund's net assets at period end. The Fund indirectly bears its proportionate share of the expenses of Fidelity Direct Lending Fund, LP, which commenced operations on December 8, 2021. The annual expense ratio for Fidelity Direct Lending Fund, LP is estimated to be a maximum of .20%.
4. Significant Accounting Policies.
The Fund is an investment company and applies the accounting and reporting guidance of the Financial Accounting Standards Board (FASB) Accounting Standards Codification Topic 946 Financial Services - Investment Companies. The financial statements have been prepared in conformity with accounting principles generally accepted in the United States of America (GAAP), which require management to make certain estimates and assumptions at the date of the financial statements. Actual results could differ from those estimates. Subsequent events, if any, through the date that the financial statements were issued have been evaluated in the preparation of the financial statements. The Fund's Schedule of Investments lists any underlying mutual funds or exchange-traded funds (ETFs) but does not include the underlying holdings of these funds. The following summarizes the significant accounting policies of the Fund:
Investment Valuation. Investments are valued as of 4:00 p.m. Eastern time on the last calendar day of the period. The Board of Directors (the Board) has delegated the day to day responsibility for the valuation of the Fund's investments to the Fair Value Committee (the Committee) established by the Fund's investment adviser. In accordance with valuation policies and procedures approved by the Board, the Fund attempts to obtain prices from one or more third party pricing vendors or brokers to value its investments. When current market prices, quotations or currency exchange rates are not readily available or reliable, investments will be fair valued in good faith by the Committee, in accordance with procedures adopted by the Board. Factors used in determining fair value vary by investment type and may include market or investment specific events, changes in interest rates and credit quality. The frequency with which these procedures are used cannot be predicted and they may be utilized to a significant extent. The Committee oversees the Fund's valuation policies and procedures and reports to the Board on the Committee's activities and fair value determinations. The Board monitors the appropriateness of the procedures used in valuing the Fund's investments and ratifies the fair value determinations of the Committee.
The Fund categorizes the inputs to valuation techniques used to value its investments into a disclosure hierarchy consisting of three levels as shown below:
- Level 1 – Unadjusted quoted prices in active markets for identical investments
- Level 2 – other significant observable inputs (including quoted prices for similar investments, interest rates, prepayment speeds, etc.)
- Level 3 – unobservable inputs (including the Fund's own assumptions based on the best information available)
Valuation techniques used to value the Fund's investments by major category are as follows:
Debt securities, including restricted securities, are valued based on evaluated prices received from third party pricing vendors or from brokers who make markets in such securities. Corporate bonds, bank loan obligations and preferred securities are valued by pricing vendors who utilize matrix pricing which considers yield or price of bonds of comparable quality, coupon, maturity and type or by broker-supplied prices. When independent prices are unavailable or unreliable, debt securities may be valued utilizing pricing methodologies which consider similar factors that would be used by third party pricing vendors. Debt securities are generally categorized as Level 2 in the hierarchy but may be Level 3 depending on the circumstances. The Fund invests a significant portion of its assets in below investment grade securities. The value of these securities can be more volatile due to changes in the credit quality of the issuer and is sensitive to changes in economic, market and regulatory conditions.
Equity securities, including restricted securities, for which market quotations are readily available, are valued at the last reported sale price or official closing price as reported by a third party pricing vendor on the primary market or exchange on which they are traded and are categorized as Level 1 in the hierarchy. In the event there were no sales during the day or closing prices are not available, securities are valued at the last quoted bid price or may be valued using the last available price and are generally categorized as Level 2 in the hierarchy. For equity securities, including restricted securities, where observable inputs are limited, assumptions about market activity and risk are used and these securities may be categorized as Level 3 in the hierarchy. Securities, including private placements or other restricted securities, for which observable inputs are not available are valued using alternate valuation approaches, including the market approach, the income approach and cost approach, and are categorized as Level 3 in the hierarchy. The market approach considers factors including the price of recent investments in the same or a similar security or financial metrics of comparable securities. The income approach considers factors including expected future cash flows, security specific risks and corresponding discount rates. The cost approach considers factors including the value of the security's underlying assets and liabilities.
Investments in open-end mutual funds, including the Fidelity Central Funds, are valued at their closing net asset value (NAV) each business day and are categorized as Level 1 in the hierarchy.
Fidelity Direct Lending Fund, LP is valued using NAV as a practical expedient in accordance with the specialized accounting guidance for investment companies and is categorized as Level 3 in the hierarchy.
The following provides information on Level 3 securities held by the Fund that were valued at period end based on unobservable inputs. These amounts exclude valuations provided by a broker and valuations using NAV as a practical expedient.
| Asset Type | Fair Value | Valuation Technique(s) | Unobservable Input | Amount or Range/Weighted Average | Impact to Valuation from an Increase in Input(a) |
| Equities | $75,939,906 | Market comparable | Discount rate | 5.0% - 30.0% / 6.8% | Decrease |
| Enterprise value/EBITDA multiple (EV/EBITDA) | 3.2 - 5.0 / 3.4 | Increase | |||
| Discount for lack of marketability | 10.0% | Decrease | |||
| Book value multiple | 1.0 | Increase | |||
| Enterprise value/Revenue (EV/S) | 0.4 | Increase | |||
| Comparable sales - land ($/Acre) | $5,500.00 | Increase | |||
| Daily production multiple ($/Boe/d) | $22,500.00 | Increase | |||
| Recovery value | Recovery value | 0.0% - 45228.2% / 45228.2% | Increase | ||
| Market approach | Transaction price | $0.00 - $88.96 / $88.40 | Increase | ||
| Parity price | $0.40 - $25.60 / $20.19 | Increase | |||
| Discounted cash flow | Discount rate | 7.0% | Decrease | ||
| Weighted average cost of capital (WACC) | 8.7% | Decrease | |||
| Discount for lack of marketability | 10.0% | Decrease | |||
| Growth rate | 1.5% | Increase | |||
| Book value | Book value multiple | 1.0 | Increase | ||
| Corporate Bonds | $25,289,732 | Market comparable | Discount rate | 10.0% | Decrease |
| Enterprise value/EBITDA multiple (EV/EBITDA) | 3.3 | Increase | |||
| Discount for lack of marketability | 10.0% | Decrease | |||
| Book value multiple | 1.0 | Increase | |||
| Comparable sales - land ($/Acre) | $5,500.00 | Increase | |||
| Daily production multiple ($/Boe/d) | $22,500.00 | Increase | |||
| Recovery value | Recovery value | 0.0% | Increase | ||
| Indicative market price | Evaluated bid | $0.13 - $5.88 / $5.72 | Increase | ||
| Book value | Book value multiple | 1.0 | Increase | ||
| Preferred Securities | $3,857,000 | Discounted cash flow | Discount rate | 10.2% | Decrease |
| Bank Loan Obligations | $10,596,782 | Market comparable | Enterprise value/EBITDA multiple (EV/EBITDA) | 6.5 | Increase |
| Discount for lack of marketability | 15.0% | Decrease | |||
| Recovery value | Recovery value | 0.0% | Increase | ||
| Market approach | Transaction price | $99.50 | Increase | ||
| Parity price | $100.00 | Increase | |||
| Indicative market price | Evaluated bid | $98.00 | Increase | ||
| Fixed-Income Funds | $5,127,633 | Market approach | Net asset value | $9.99 | Increase |
| Other | $7,516 | Recovery value | Recovery value | 0.7% | Increase |
(a) Represents the directional change in the fair value of the Level 3 investments that could have resulted from an increase in the corresponding input as of period end. A decrease to the unobservable input would have had the opposite effect. Significant changes in these inputs may have resulted in a significantly higher or lower fair value measurement at period end.
Changes in valuation techniques may result in transfers in or out of an assigned level within the disclosure hierarchy. The aggregate value of investments by input level as of February 28, 2022, as well as a roll forward of Level 3 investments, is included at the end of the Fund's Schedule of Investments.
Investment Transactions and Income. For financial reporting purposes, the Fund's investment holdings and NAV include trades executed through the end of the last business day of the period. The NAV per share for processing shareholder transactions is calculated as of the close of business of the New York Stock Exchange (NYSE), normally 4:00 p.m. Eastern time and includes trades executed through the end of the prior business day. Gains and losses on securities sold are determined on the basis of identified cost and include proceeds received from litigation. Commissions paid to certain brokers with whom the investment adviser, or its affiliates, places trades on behalf of a fund include an amount in addition to trade execution, which may be rebated back to a fund. Any such rebates are included in net realized gain (loss) on investments in the Statement of Operations. Dividend income is recorded on the ex-dividend date, except for certain dividends from foreign securities where the ex-dividend date may have passed, which are recorded as soon as the Fund is informed of the ex-dividend date. Non-cash dividends included in dividend income, if any, are recorded at the fair market value of the securities received. Income and capital gain distributions from Fidelity Central Funds, if any, are recorded on the ex-dividend date. Certain distributions received by the Fund represent a return of capital or capital gain. The Fund determines the components of these distributions subsequent to the ex-dividend date, based upon receipt of tax filings or other correspondence relating to the underlying investment. These distributions are recorded as a reduction of cost of investments and/or as a realized gain. Interest income is accrued as earned and includes coupon interest and amortization of premium and accretion of discount on debt securities as applicable. Paid in Kind (PIK) income is recorded at the fair market value of the securities received. Debt obligations may be placed on non-accrual status and related interest income may be reduced by ceasing current accruals and writing off interest receivables when the collection of all or a portion of interest has become doubtful based on consistently applied procedures. A debt obligation is removed from non-accrual status when the issuer resumes interest payments or when collectability of interest is reasonably assured.
Expenses. Expenses directly attributable to a fund are charged to that fund. Expenses attributable to more than one fund are allocated among the respective funds on the basis of relative net assets or other appropriate methods. Expenses included in the accompanying financial statements reflect the expenses of that fund and do not include any expenses associated with any underlying mutual funds or exchange-traded funds. Although not included in a fund's expenses, a fund indirectly bears its proportionate share of these expenses through the net asset value of each underlying mutual fund or exchange-traded fund. Expense estimates are accrued in the period to which they relate and adjustments are made when actual amounts are known.
Income Tax Information and Distributions to Shareholders. Each year, the Fund intends to qualify as a regulated investment company under Subchapter M of the Internal Revenue Code, including distributing substantially all of its taxable income and realized gains. As a result, no provision for U.S. Federal income taxes is required. The Fund files a U.S. federal tax return, in addition to state and local tax returns as required. The Fund's federal income tax returns are subject to examination by the Internal Revenue Service (IRS) for a period of three fiscal years after they are filed. State and local tax returns may be subject to examination for an additional fiscal year depending on the jurisdiction.
Distributions are declared and recorded daily and paid monthly from net investment income. Distributions from realized gains, if any, are declared and recorded on the ex-dividend date. Income and capital gain distributions are determined in accordance with income tax regulations, which may differ from GAAP.
Capital accounts within the financial statements are adjusted for permanent book-tax differences. These adjustments have no impact on net assets or the results of operations. Capital accounts are not adjusted for temporary book-tax differences which will reverse in a subsequent period.
Book-tax differences are primarily due to foreign currency transactions, prior period premium and discount on debt securities, partnerships, capital loss carryforwards and losses deferred due to wash sales.
As of period end, the cost and unrealized appreciation (depreciation) in securities, and derivatives if applicable, for federal income tax purposes were as follows:
| Gross unrealized appreciation | $128,224,728 |
| Gross unrealized depreciation | (70,816,016) |
| Net unrealized appreciation (depreciation) | $57,408,712 |
| Tax cost | $2,013,705,030 |
Capital loss carryforwards are only available to offset future capital gains of the Fund to the extent provided by regulations and may be limited. The capital loss carryforward information presented below, including any applicable limitation, is estimated as of prior fiscal period end and is subject to adjustment.
| No expiration | |
| Long-term | $(34,050,988) |
Restricted Securities (including Private Placements). Funds may invest in securities that are subject to legal or contractual restrictions on resale. These securities generally may be resold in transactions exempt from registration or to the public if the securities are registered. Disposal of these securities may involve time-consuming negotiations and expense, and prompt sale at an acceptable price may be difficult. Information regarding restricted securities held at period end is included at the end of the Schedule of Investments, if applicable.
Loans and Other Direct Debt Instruments. Direct debt instruments are interests in amounts owed to lenders by corporate or other borrowers. These instruments may be in the form of loans, trade claims or other receivables and may include standby financing commitments such as revolving credit facilities that obligate a fund to supply additional cash to the borrower on demand. Loans may be acquired through assignment, participation, or may be made directly to a borrower. Such instruments are presented in the Bank Loan Obligations section in the Schedule of Investments. Certain funds may also invest in unfunded loan commitments, which are contractual obligations for future funding. Information regarding unfunded commitments is included at the end of the Schedule of Investments, if applicable.
Commitments. A commitment is an agreement to acquire an investment at a future date (subject to conditions) in connection with a potential public or non-public offering. The amount of commitments outstanding at period end are presented in the table below. These commitments are not included in the net assets of the Fund at period end.
| Investment to be Acquired | Commitment Amount | |
| Fidelity High Income Central Fund | Fidelity Direct Lending Fund, LP | $21,868,654 |
5. Purchases and Sales of Investments.
Purchases and sales of securities, other than short-term securities and in-kind transactions, as applicable, are noted in the table below.
| Purchases ($) | Sales ($) | |
| Fidelity High Income Central Fund | 331,670,116 | 522,159,558 |
6. Fees and Other Transactions with Affiliates.
Management Fee and Expense Contract. Fidelity Management & Research Company LLC (the investment adviser) provides the Fund with investment management services. The Fund does not pay any fees for these services. Pursuant to the Fund's management contract, the investment adviser receives a monthly management fee that represents a portion of the management fees it receives from the Investing Funds. In addition, under an expense contract, the investment adviser also pays all other expenses of the Fund, excluding custody fees, the compensation of the independent Directors, and certain miscellaneous expenses such as proxy and shareholder meeting expenses.
Brokerage Commissions. A portion of portfolio transactions were placed with brokerage firms which are affiliates of the investment adviser. Brokerage commissions are included in net realized gain (loss) and change in net unrealized appreciation (depreciation) in the Statement of Operations. The commissions paid to these affiliated firms were as follows:
| Amount | |
| Fidelity High Income Central Fund | $397 |
Interfund Trades. Funds may purchase from or sell securities to other Fidelity Funds under procedures adopted by the Board. The procedures have been designed to ensure these interfund trades are executed in accordance with Rule 17a-7 of the 1940 Act. Any interfund trades are included within the respective purchases and sales amounts shown in the Purchases and Sales of Investments note. Interfund trades during the period are noted in the table below.
| Purchases ($) | Sales ($) | Realized Gain (Loss) ($) | |
| Fidelity High Income Central Fund | – | 1,962,661 | 1,216,028 |
7. Security Lending.
Funds lend portfolio securities from time to time in order to earn additional income. Lending agents are used, including National Financial Services (NFS), an affiliate of the investment adviser. Pursuant to a securities lending agreement, NFS will receive a fee, which is capped at 9.9% of a fund's daily lending revenue, for its services as lending agent. A fund may lend securities to certain qualified borrowers, including NFS. On the settlement date of the loan, a fund receives collateral (in the form of U.S. Treasury obligations, letters of credit and/or cash) against the loaned securities and maintains collateral in an amount not less than 100% of the market value of the loaned securities during the period of the loan. The market value of the loaned securities is determined at the close of business of a fund and any additional required collateral is delivered to a fund on the next business day. A fund or borrower may terminate the loan at any time, and if the borrower defaults on its obligation to return the securities loaned because of insolvency or other reasons, a fund may apply collateral received from the borrower against the obligation. A fund may experience delays and costs in recovering the securities loaned. Any cash collateral received is invested in the Fidelity Securities Lending Cash Central Fund. Any loaned securities are identified as such in the Schedule of Investments, and the value of loaned securities and cash collateral at period end, as applicable, are presented in the Statement of Assets and Liabilities. Security lending income represents the income earned on investing cash collateral, less rebates paid to borrowers and any lending agent fees associated with the loan, plus any premium payments received for lending certain types of securities. Security lending income is presented in the Statement of Operations as a component of income from Fidelity Central Funds. Affiliated security lending activity, if any, was as follows:
| Total Security Lending Fees Paid to NFS | Security Lending Income From Securities Loaned to NFS | Value of Securities Loaned to NFS at Period End | |
| Fidelity High Income Central Fund | $73 | $– | $– |
8. Expense Reductions.
Through arrangements with the Fund's custodian, credits realized as a result of certain uninvested cash balances were used to reduce the Fund's expenses by $274.
9. Other.
A fund's organizational documents provide former and current directors and officers with a limited indemnification against liabilities arising in connection with the performance of their duties to the fund. In the normal course of business, a fund may also enter into contracts that provide general indemnifications. A fund's maximum exposure under these arrangements is unknown as this would be dependent on future claims that may be made against a fund. The risk of material loss from such claims is considered remote.
At the end of the period, mutual funds managed by the investment adviser or its affiliates were the owners of record of all of the outstanding shares of the Fund.
10. Coronavirus (COVID-19) Pandemic.
An outbreak of COVID-19 first detected in China during December 2019 has since spread globally and was declared a pandemic by the World Health Organization during March 2020. Developments that disrupt global economies and financial markets, such as the COVID-19 pandemic, may magnify factors that affect the Fund's performance.
Shareholder Expense Example
As a shareholder, you incur two types of costs: (1) transaction costs, which may include sales charges (loads) on purchase payments or redemption proceeds, as applicable and (2) ongoing costs, which generally include management fees, distribution and/or service (12b-1) fees and other Fund expenses. This Example is intended to help you understand your ongoing costs (in dollars) of investing in a fund and to compare these costs with the ongoing costs of investing in other mutual funds.
The Example is based on an investment of $1,000 invested at the beginning of the period and held for the entire period (September 1, 2021 to February 28, 2022).
Actual Expenses
The first line of the accompanying table provides information about actual account values and actual expenses. You may use the information in this line, together with the amount you invested, to estimate the expenses that you paid over the period. Simply divide your account value by $1,000.00 (for example, an $8,600 account value divided by $1,000.00 = 8.6), then multiply the result by the number in the first line for a class/Fund under the heading entitled "Expenses Paid During Period" to estimate the expenses you paid on your account during this period. If any fund is a shareholder of any underlying mutual funds or exchange-traded funds (ETFs) (the Underlying Funds), such fund indirectly bears its proportional share of the expenses of the Underlying Funds in addition to the direct expenses incurred presented in the table. These fees and expenses are not included in the annualized expense ratio used to calculate the expense estimate in the table below.
Hypothetical Example for Comparison Purposes
The second line of the accompanying table provides information about hypothetical account values and hypothetical expenses based on the actual expense ratio and an assumed rate of return of 5% per year before expenses, which is not the actual return. The hypothetical account values and expenses may not be used to estimate the actual ending account balance or expenses you paid for the period. You may use this information to compare the ongoing costs of investing in the Fund and other funds. To do so, compare this 5% hypothetical example with the 5% hypothetical examples that appear in the shareholder reports of the other funds. If any fund is a shareholder of any Underlying Funds, such fund indirectly bears its proportional share of the expenses of the Underlying Funds in addition to the direct expenses as presented in the table. These fees and expenses are not included in the annualized expense ratio used to calculate the expense estimate in the table below.
Please note that the expenses shown in the table are meant to highlight your ongoing costs only and do not reflect any transaction costs. Therefore, the second line of the table is useful in comparing ongoing costs only, and will not help you determine the relative total costs of owning different funds. In addition, if these transactional costs were included, your costs would have been higher.
| Annualized Expense Ratio-A | Beginning Account Value September 1, 2021 | Ending Account Value February 28, 2022 | Expenses Paid During Period-B September 1, 2021 to February 28, 2022 | |
| Fidelity High Income Central Fund | .0090% | |||
| Actual | $1,000.00 | $990.50 | $.04 | |
| Hypothetical-C | $1,000.00 | $1,024.75 | $.05 |
A Annualized expense ratio reflects expenses net of applicable fee waivers.
B Expenses are equal to the annualized expense ratio, multiplied by the average account value over the period, multiplied by 181/ 365 (to reflect the one-half year period). The fees and expenses of any Underlying Funds are not included in each annualized expense ratio.
C 5% return per year before expenses
Liquidity Risk Management Program
The Securities and Exchange Commission adopted Rule 22e-4 under the Investment Company Act of 1940 (the Liquidity Rule) to promote effective liquidity risk management throughout the open-end investment company industry, thereby reducing the risk that funds will be unable to meet their redemption obligations and mitigating dilution of the interests of fund shareholders.
The Fund has adopted and implemented a liquidity risk management program pursuant to the Liquidity Rule (the Program) effective December 1, 2018. The Program is reasonably designed to assess and manage the Fund’s liquidity risk and to comply with the requirements of the Liquidity Rule. The Fund’s Board of Trustees (the Board) has designated the Fund’s investment adviser as administrator of the Program. The Fidelity advisers have established a Liquidity Risk Management Committee (the LRM Committee) to manage the Program for each of the Fidelity Funds. The LRM Committee monitors the adequacy and effectiveness of implementation of the Program and on a periodic basis assesses each Fund’s liquidity risk based on a variety of factors including (1) the Fund’s investment strategy, (2) portfolio liquidity and cash flow projections during normal and reasonably foreseeable stressed conditions, (3) shareholder redemptions, (4) borrowings and other funding sources and (5) in the case of exchange-traded funds, certain additional factors including the effect of the Fund’s prices and spreads, market participants, and basket compositions on the overall liquidity of the Fund’s portfolio, as applicable.
In accordance with the Program, each of the Fund’s portfolio investments is classified into one of four liquidity categories described below based on a determination of a reasonable expectation for how long it would take to convert the investment to cash (or sell or dispose of the investment) without significantly changing its market value.
- Highly liquid investments – cash or convertible to cash within three business days or less
- Moderately liquid investments – convertible to cash in three to seven calendar days
- Less liquid investments – can be sold or disposed of, but not settled, within seven calendar days
- Illiquid investments – cannot be sold or disposed of within seven calendar days
Liquidity classification determinations take into account a variety of factors including various market, trading and investment-specific considerations, as well as market depth, and generally utilize analysis from a third-party liquidity metrics service.
The Liquidity Rule places a 15% limit on a fund’s illiquid investments and requires funds that do not primarily hold assets that are highly liquid investments to determine and maintain a minimum percentage of the fund’s net assets to be invested in highly liquid investments (highly liquid investment minimum or HLIM). The Program includes provisions reasonably designed to comply with the 15% limit on illiquid investments and for determining, periodically reviewing and complying with the HLIM requirement as applicable.
At a recent meeting of the Fund’s Board of Trustees, the LRM Committee provided a written report to the Board pertaining to the operation, adequacy, and effectiveness of implementation of the Program for the annual period from December 1, 2020 through November 30, 2021. The report concluded that the Program has been implemented and is operating effectively and is reasonably designed to assess and manage the Fund’s liquidity risk.
![]()
HICII-SANN-0422
1.861965.113
Fidelity® Specialized High Income Central Fund
Semi-Annual Report
February 28, 2022
Contents
To view a fund's proxy voting guidelines and proxy voting record for the 12-month period ended June 30, visit http://www.fidelity.com/proxyvotingresults or visit the Securities and Exchange Commission's (SEC) web site at http://www.sec.gov.
You may also call 1-800-544-8544 to request a free copy of the proxy voting guidelines.
Standard & Poor's, S&P and S&P 500 are registered service marks of The McGraw-Hill Companies, Inc. and have been licensed for use by Fidelity Distributors Corporation.
Other third-party marks appearing herein are the property of their respective owners.
All other marks appearing herein are registered or unregistered trademarks or service marks of FMR LLC or an affiliated company. © 2022 FMR LLC. All rights reserved.
A fund files its complete schedule of portfolio holdings with the SEC for the first and third quarters of each fiscal year on Form N-PORT. Forms N-PORT are available on the SEC’s web site at http://www.sec.gov. A fund's Forms N-PORT may be reviewed and copied at the SEC’s Public Reference Room in Washington, DC. Information regarding the operation of the SEC's Public Reference Room may be obtained by calling 1-800-SEC-0330.
Note to Shareholders:
Early in 2020, the outbreak and spread of COVID-19 emerged as a public health emergency that had a major influence on financial markets, primarily based on its impact on the global economy and corporate earnings. On March 11, 2020, the World Health Organization declared the COVID-19 outbreak a pandemic, citing sustained risk of further global spread. The pandemic prompted a number of measures to limit the spread of COVID-19, including travel and border restrictions, quarantines, and restrictions on large gatherings. In turn, these resulted in lower consumer activity, diminished demand for a wide range of products and services, disruption in manufacturing and supply chains, and – given the wide variability in outcomes regarding the outbreak – significant market uncertainty and volatility. To help stem the turmoil, the U.S. government took unprecedented action – in concert with the U.S. Federal Reserve and central banks around the world – to help support consumers, businesses, and the broader economy, and to limit disruption to the financial system.
In general, the overall impact of the pandemic lessened in 2021, amid a resilient economy and widespread distribution of three COVID-19 vaccines granted emergency use authorization from the U.S. Food and Drug Administration (FDA) early in the year. Still, the situation remains dynamic, and the extent and duration of its influence on financial markets and the economy is highly uncertain, due in part to a recent spike in cases based on highly contagious variants of the coronavirus.
Extreme events such as the COVID-19 crisis are exogenous shocks that can have significant adverse effects on mutual funds and their investments. Although multiple asset classes may be affected by market disruption, the duration and impact may not be the same for all types of assets. Fidelity is committed to helping you stay informed amid news about COVID-19 and during increased market volatility, and we continue to take extra steps to be responsive to customer needs. We encourage you to visit us online, where we offer ongoing updates, commentary, and analysis on the markets and our funds.
Investment Summary (Unaudited)
Top Five Holdings as of February 28, 2022
| (by issuer, excluding cash equivalents) | % of fund's net assets |
| Sprint Capital Corp. | 3.9 |
| Occidental Petroleum Corp. | 2.8 |
| Icahn Enterprises LP/Icahn Enterprises Finance Corp. | 2.6 |
| CCO Holdings LLC/CCO Holdings Capital Corp. | 2.3 |
| Crestwood Midstream Partners LP/Crestwood Midstream Finance Corp. | 2.2 |
| 13.8 |
Top Five Market Sectors as of February 28, 2022
| % of fund's net assets | |
| Energy | 14.6 |
| Telecommunications | 9.7 |
| Healthcare | 8.8 |
| Utilities | 8.7 |
| Chemicals | 6.0 |
Quality Diversification (% of fund's net assets)
| As of February 28, 2022 | ||
| BBB | 6.9% | |
| BB | 66.8% | |
| B | 22.4% | |
| CCC,CC,C | 0.1% | |
| Short-Term Investments and Net Other Assets | 3.8% | |
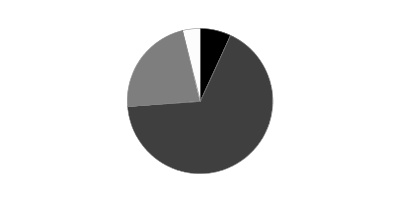
We have used ratings from Moody's Investors Service, Inc. Where Moody's® ratings are not available, we have used S&P® ratings. All ratings are as of the date indicated and do not reflect subsequent changes.
Asset Allocation (% of fund's net assets)
| As of February 28, 2022* | ||
| Nonconvertible Bonds | 95.2% | |
| Preferred Securities | 1.0% | |
| Short-Term Investments and Net Other Assets (Liabilities) | 3.8% | |

* Foreign investments - 12.2%
Schedule of Investments February 28, 2022 (Unaudited)
Showing Percentage of Net Assets
| Nonconvertible Bonds - 95.2% | |||
| Principal Amount | Value | ||
| Aerospace - 3.6% | |||
| BWX Technologies, Inc. 4.125% 6/30/28 (a) | $995,000 | $965,150 | |
| Howmet Aerospace, Inc. 6.75% 1/15/28 | 755,000 | 839,669 | |
| Kaiser Aluminum Corp. 4.625% 3/1/28 (a) | 2,085,000 | 1,968,803 | |
| Moog, Inc. 4.25% 12/15/27 (a) | 1,460,000 | 1,431,340 | |
| Rolls-Royce PLC 5.75% 10/15/27 (a) | 1,270,000 | 1,308,392 | |
| TransDigm, Inc. 6.25% 3/15/26 (a) | 5,853,000 | 6,021,274 | |
| TOTAL AEROSPACE | 12,534,628 | ||
| Air Transportation - 0.2% | |||
| United Airlines, Inc. 4.375% 4/15/26 (a) | 670,000 | 668,285 | |
| Automotive & Auto Parts - 2.0% | |||
| Allison Transmission, Inc. 3.75% 1/30/31 (a) | 1,270,000 | 1,179,513 | |
| Dana, Inc. 4.5% 2/15/32 | 365,000 | 342,644 | |
| Ford Motor Credit Co. LLC: | |||
| 2.3% 2/10/25 | 360,000 | 349,240 | |
| 2.9% 2/10/29 | 360,000 | 336,150 | |
| 4% 11/13/30 | 1,710,000 | 1,696,320 | |
| 4.687% 6/9/25 | 1,005,000 | 1,035,854 | |
| 5.113% 5/3/29 | 650,000 | 685,224 | |
| 5.125% 6/16/25 | 660,000 | 690,360 | |
| LCM Investments Holdings 4.875% 5/1/29 (a) | 160,000 | 152,451 | |
| Thor Industries, Inc. 4% 10/15/29 (a) | 475,000 | 433,438 | |
| TOTAL AUTOMOTIVE & AUTO PARTS | 6,901,194 | ||
| Banks & Thrifts - 0.4% | |||
| Jane Street Group LLC/JSG Finance, Inc. 4.5% 11/15/29 (a) | 205,000 | 199,875 | |
| Quicken Loans LLC/Quicken Loans Co-Issuer, Inc. 3.625% 3/1/29 (a) | 1,360,000 | 1,273,477 | |
| TOTAL BANKS & THRIFTS | 1,473,352 | ||
| Broadcasting - 1.9% | |||
| Diamond Sports Group LLC/Diamond Sports Finance Co. 5.375% 8/15/26 (a) | 650,000 | 266,500 | |
| Scripps Escrow II, Inc. 3.875% 1/15/29 (a) | 465,000 | 435,770 | |
| Sirius XM Radio, Inc.: | |||
| 3.875% 9/1/31 (a) | 365,000 | 336,264 | |
| 5% 8/1/27 (a) | 1,160,000 | 1,175,701 | |
| 5.5% 7/1/29 (a) | 2,845,000 | 2,909,013 | |
| Tegna, Inc.: | |||
| 4.625% 3/15/28 | 1,270,000 | 1,269,149 | |
| 5% 9/15/29 | 240,000 | 239,340 | |
| TOTAL BROADCASTING | 6,631,737 | ||
| Building Materials - 1.0% | |||
| Advanced Drain Systems, Inc. 5% 9/30/27 (a) | 1,880,000 | 1,894,025 | |
| Builders FirstSource, Inc. 4.25% 2/1/32 (a) | 350,000 | 335,970 | |
| Standard Industries, Inc./New Jersey 4.375% 7/15/30 (a) | 1,485,000 | 1,405,968 | |
| TOTAL BUILDING MATERIALS | 3,635,963 | ||
| Cable/Satellite TV - 4.9% | |||
| CCO Holdings LLC/CCO Holdings Capital Corp.: | |||
| 4.25% 2/1/31 (a) | 200,000 | 187,388 | |
| 4.5% 8/15/30 (a) | 780,000 | 751,202 | |
| 4.5% 5/1/32 | 2,370,000 | 2,251,500 | |
| 4.5% 6/1/33 (a) | 730,000 | 684,375 | |
| 5% 2/1/28 (a) | 4,214,000 | 4,239,684 | |
| CSC Holdings LLC: | |||
| 3.375% 2/15/31 (a) | 4,195,000 | 3,573,668 | |
| 4.125% 12/1/30 (a) | 1,065,000 | 956,285 | |
| 5.375% 2/1/28 (a) | 700,000 | 680,313 | |
| 5.5% 4/15/27 (a) | 1,961,000 | 1,956,098 | |
| VZ Secured Financing BV 5% 1/15/32 (a) | 1,805,000 | 1,723,775 | |
| TOTAL CABLE/SATELLITE TV | 17,004,288 | ||
| Chemicals - 6.0% | |||
| Axalta Coating Systems/Dutch Holding BV 4.75% 6/15/27 (a) | 1,200,000 | 1,203,000 | |
| CF Industries Holdings, Inc.: | |||
| 4.95% 6/1/43 | 9,000 | 9,752 | |
| 5.15% 3/15/34 | 1,533,000 | 1,715,419 | |
| 5.375% 3/15/44 | 531,000 | 598,256 | |
| Methanex Corp.: | |||
| 5.125% 10/15/27 | 1,585,000 | 1,608,934 | |
| 5.25% 12/15/29 | 130,000 | 131,300 | |
| 5.65% 12/1/44 | 1,034,000 | 965,756 | |
| NOVA Chemicals Corp.: | |||
| 5% 5/1/25 (a) | 1,000,000 | 1,010,250 | |
| 5.25% 6/1/27 (a) | 1,960,000 | 1,964,900 | |
| Nufarm Australia Ltd. 5% 1/27/30 (a) | 895,000 | 883,813 | |
| Olin Corp.: | |||
| 5% 2/1/30 | 1,944,000 | 1,958,580 | |
| 5.125% 9/15/27 | 2,525,000 | 2,556,563 | |
| SPCM SA 3.125% 3/15/27 (a) | 360,000 | 340,888 | |
| The Chemours Co. LLC 5.375% 5/15/27 | 2,885,000 | 2,895,400 | |
| Valvoline, Inc. 4.25% 2/15/30 (a) | 1,410,000 | 1,335,207 | |
| W.R. Grace Holding LLC: | |||
| 4.875% 6/15/27 (a) | 630,000 | 629,383 | |
| 5.625% 10/1/24 (a) | 1,246,000 | 1,270,721 | |
| TOTAL CHEMICALS | 21,078,122 | ||
| Consumer Products - 1.0% | |||
| Mattel, Inc. 3.75% 4/1/29 (a) | 630,000 | 630,630 | |
| Newell Brands, Inc.: | |||
| 5.875% 4/1/36 | 565,000 | 619,381 | |
| 6% 4/1/46 | 1,735,000 | 1,939,609 | |
| Tempur Sealy International, Inc. 3.875% 10/15/31 (a) | 375,000 | 336,883 | |
| TOTAL CONSUMER PRODUCTS | 3,526,503 | ||
| Containers - 0.5% | |||
| Ardagh Packaging Finance PLC/Ardagh MP Holdings U.S.A., Inc. 4.125% 8/15/26 (a) | 55,000 | 53,213 | |
| Ball Corp. 3.125% 9/15/31 | 1,280,000 | 1,175,539 | |
| Graphic Packaging International, Inc. 3.75% 2/1/30 (a) | 180,000 | 171,518 | |
| OI European Group BV 4.75% 2/15/30 (a) | 370,000 | 354,271 | |
| TOTAL CONTAINERS | 1,754,541 | ||
| Diversified Financial Services - 5.6% | |||
| Coinbase Global, Inc.: | |||
| 3.375% 10/1/28 (a) | 905,000 | 824,582 | |
| 3.625% 10/1/31 (a) | 905,000 | 797,101 | |
| Icahn Enterprises LP/Icahn Enterprises Finance Corp.: | |||
| 5.25% 5/15/27 | 6,705,000 | 6,654,713 | |
| 6.25% 5/15/26 | 2,549,000 | 2,571,215 | |
| Ladder Capital Finance Holdings LLLP/Ladder Capital Finance Corp. 4.25% 2/1/27 (a) | 1,005,000 | 978,619 | |
| LPL Holdings, Inc. 4% 3/15/29 (a) | 1,420,000 | 1,379,175 | |
| MSCI, Inc. 3.25% 8/15/33 (a) | 285,000 | 269,624 | |
| OneMain Finance Corp.: | |||
| 3.5% 1/15/27 | 2,475,000 | 2,341,350 | |
| 3.875% 9/15/28 | 1,435,000 | 1,329,169 | |
| 6.875% 3/15/25 | 1,585,000 | 1,691,346 | |
| 7.125% 3/15/26 | 624,000 | 676,416 | |
| TOTAL DIVERSIFIED FINANCIAL SERVICES | 19,513,310 | ||
| Diversified Media - 0.5% | |||
| Advantage Sales & Marketing, Inc. 6.5% 11/15/28 (a) | 1,765,000 | 1,777,320 | |
| Energy - 14.6% | |||
| Apache Corp.: | |||
| 4.25% 1/15/30 | 244,000 | 245,830 | |
| 5.1% 9/1/40 | 686,000 | 686,069 | |
| 5.25% 2/1/42 | 1,030,000 | 1,014,550 | |
| 5.35% 7/1/49 | 170,000 | 169,231 | |
| Cheniere Energy Partners LP: | |||
| 3.25% 1/31/32 (a) | 365,000 | 343,100 | |
| 4% 3/1/31 | 1,355,000 | 1,334,675 | |
| Cheniere Energy, Inc. 4.625% 10/15/28 | 1,233,000 | 1,259,707 | |
| CNX Midstream Partners LP 4.75% 4/15/30 (a) | 150,000 | 144,938 | |
| Colgate Energy Partners III LLC 5.875% 7/1/29 (a) | 190,000 | 195,563 | |
| Continental Resources, Inc. 5.75% 1/15/31 (a) | 1,860,000 | 2,074,588 | |
| Crestwood Midstream Partners LP/Crestwood Midstream Finance Corp.: | |||
| 5.625% 5/1/27 (a) | 2,198,000 | 2,181,515 | |
| 5.75% 4/1/25 | 3,871,000 | 3,895,194 | |
| 6% 2/1/29 (a) | 1,910,000 | 1,925,032 | |
| CVR Energy, Inc.: | |||
| 5.25% 2/15/25 (a) | 1,580,000 | 1,529,487 | |
| 5.75% 2/15/28 (a) | 175,000 | 164,938 | |
| DCP Midstream Operating LP: | |||
| 5.6% 4/1/44 | 100,000 | 109,500 | |
| 6.45% 11/3/36 (a) | 435,000 | 526,066 | |
| 8.125% 8/16/30 | 30,000 | 38,100 | |
| Endeavor Energy Resources LP/EER Finance, Inc.: | |||
| 5.75% 1/30/28 (a) | 905,000 | 937,299 | |
| 6.625% 7/15/25 (a) | 225,000 | 235,145 | |
| EnLink Midstream LLC 5.625% 1/15/28 (a) | 220,000 | 222,200 | |
| EnLink Midstream Partners LP: | |||
| 5.05% 4/1/45 | 290,000 | 239,789 | |
| 5.45% 6/1/47 | 605,000 | 512,738 | |
| 5.6% 4/1/44 | 1,018,000 | 867,845 | |
| EQM Midstream Partners LP: | |||
| 4.75% 1/15/31 (a) | 1,140,000 | 1,068,750 | |
| 5.5% 7/15/28 | 905,000 | 888,493 | |
| 6.5% 7/15/48 | 550,000 | 536,250 | |
| EQT Corp. 3.9% 10/1/27 | 1,654,000 | 1,671,690 | |
| Hess Midstream Partners LP: | |||
| 5.125% 6/15/28 (a) | 1,130,000 | 1,154,109 | |
| 5.625% 2/15/26 (a) | 592,000 | 606,800 | |
| Hilcorp Energy I LP/Hilcorp Finance Co. 6.25% 11/1/28 (a) | 380,000 | 387,349 | |
| Holly Energy Partners LP/Holly Energy Finance Corp. 5% 2/1/28 (a) | 365,000 | 348,575 | |
| Occidental Petroleum Corp.: | |||
| 4.2% 3/15/48 | 645,000 | 603,075 | |
| 4.3% 8/15/39 | 340,000 | 321,300 | |
| 4.4% 4/15/46 | 995,000 | 945,230 | |
| 4.4% 8/15/49 | 1,140,000 | 1,082,761 | |
| 5.55% 3/15/26 | 1,660,000 | 1,784,002 | |
| 6.125% 1/1/31 | 765,000 | 869,882 | |
| 6.2% 3/15/40 | 330,000 | 367,219 | |
| 6.45% 9/15/36 | 1,745,000 | 2,054,738 | |
| 7.5% 5/1/31 | 330,000 | 400,125 | |
| 7.875% 9/15/31 | 210,000 | 259,732 | |
| 8.875% 7/15/30 | 715,000 | 924,495 | |
| PBF Holding Co. LLC/PBF Finance Corp. 9.25% 5/15/25 (a) | 2,335,000 | 2,358,350 | |
| Rockies Express Pipeline LLC: | |||
| 4.8% 5/15/30 (a) | 1,095,000 | 1,059,413 | |
| 4.95% 7/15/29 (a) | 570,000 | 551,475 | |
| 6.875% 4/15/40 (a) | 220,000 | 224,400 | |
| Sunoco LP/Sunoco Finance Corp.: | |||
| 4.5% 5/15/29 | 1,295,000 | 1,240,999 | |
| 5.875% 3/15/28 | 215,000 | 218,763 | |
| 6% 4/15/27 | 30,000 | 30,967 | |
| Superior Plus LP / Superior General Partner, Inc. 4.5% 3/15/29 (a) | 265,000 | 252,744 | |
| Tallgrass Energy Partners LP / Tallgrass Energy Finance Corp.: | |||
| 5.5% 1/15/28 (a) | 255,000 | 245,756 | |
| 6% 3/1/27 (a) | 1,111,000 | 1,111,000 | |
| 6% 12/31/30 (a) | 1,360,000 | 1,309,898 | |
| Targa Resources Partners LP/Targa Resources Partners Finance Corp.: | |||
| 5.375% 2/1/27 | 332,000 | 341,545 | |
| 5.5% 3/1/30 | 280,000 | 296,464 | |
| Venture Global Calcasieu Pass LLC: | |||
| 3.875% 8/15/29 (a) | 445,000 | 435,633 | |
| 3.875% 11/1/33 (a) | 365,000 | 351,484 | |
| 4.125% 8/15/31 (a) | 430,000 | 425,700 | |
| Western Gas Partners LP: | |||
| 4.55% 2/1/30 | 2,950,000 | 3,034,252 | |
| 4.65% 7/1/26 | 122,000 | 126,410 | |
| TOTAL ENERGY | 50,742,927 | ||
| Environmental - 0.6% | |||
| Darling Ingredients, Inc. 5.25% 4/15/27 (a) | 1,275,000 | 1,297,389 | |
| Stericycle, Inc. 3.875% 1/15/29 (a) | 925,000 | 861,406 | |
| TOTAL ENVIRONMENTAL | 2,158,795 | ||
| Food & Drug Retail - 2.1% | |||
| Albertsons Companies LLC/Safeway, Inc./New Albertson's, Inc./Albertson's LLC: | |||
| 3.5% 3/15/29 (a) | 3,770,000 | 3,506,100 | |
| 4.625% 1/15/27 (a) | 1,400,000 | 1,406,143 | |
| 4.875% 2/15/30 (a) | 700,000 | 701,750 | |
| Emergent BioSolutions, Inc. 3.875% 8/15/28 (a) | 1,585,000 | 1,417,798 | |
| Murphy Oil U.S.A., Inc. 3.75% 2/15/31 (a) | 165,000 | 153,038 | |
| TOTAL FOOD & DRUG RETAIL | 7,184,829 | ||
| Food/Beverage/Tobacco - 3.5% | |||
| JBS U.S.A. LLC/JBS U.S.A. Finance, Inc. 6.75% 2/15/28 (a) | 696,000 | 732,547 | |
| JBS U.S.A. Lux SA / JBS Food Co.: | |||
| 5.5% 1/15/30 (a) | 1,660,000 | 1,715,154 | |
| 6.5% 4/15/29 (a) | 3,994,000 | 4,238,633 | |
| Kraft Heinz Foods Co.: | |||
| 3% 6/1/26 | 2,255,000 | 2,252,069 | |
| 3.875% 5/15/27 | 1,165,000 | 1,206,299 | |
| U.S. Foods, Inc.: | |||
| 4.625% 6/1/30 (a) | 175,000 | 170,167 | |
| 6.25% 4/15/25 (a) | 1,660,000 | 1,716,938 | |
| TOTAL FOOD/BEVERAGE/TOBACCO | 12,031,807 | ||
| Gaming - 2.5% | |||
| Melco Resorts Finance Ltd.: | |||
| 5.375% 12/4/29 (a) | 535,000 | 464,278 | |
| 5.75% 7/21/28 (a) | 805,000 | 727,519 | |
| MGM Growth Properties Operating Partnership LP: | |||
| 4.5% 9/1/26 | 2,592,000 | 2,644,436 | |
| 4.625% 6/15/25 (a) | 315,000 | 324,450 | |
| 5.75% 2/1/27 | 664,000 | 718,780 | |
| MGM Resorts International 5.75% 6/15/25 | 620,000 | 642,475 | |
| VICI Properties, Inc.: | |||
| 4.25% 12/1/26 (a) | 725,000 | 732,250 | |
| 4.625% 12/1/29 (a) | 1,075,000 | 1,096,500 | |
| Wynn Las Vegas LLC/Wynn Las Vegas Capital Corp. 5.5% 3/1/25 (a) | 1,330,000 | 1,348,866 | |
| TOTAL GAMING | 8,699,554 | ||
| Healthcare - 8.8% | |||
| 180 Medical, Inc. 3.875% 10/15/29 (a) | 200,000 | 192,000 | |
| Avantor Funding, Inc. 4.625% 7/15/28 (a) | 1,215,000 | 1,233,225 | |
| Catalent Pharma Solutions 3.5% 4/1/30 (a) | 1,625,000 | 1,512,713 | |
| Centene Corp.: | |||
| 2.45% 7/15/28 | 70,000 | 65,929 | |
| 2.5% 3/1/31 | 1,390,000 | 1,283,929 | |
| 3.375% 2/15/30 | 2,000,000 | 1,918,940 | |
| 4.25% 12/15/27 | 1,425,000 | 1,458,701 | |
| Charles River Laboratories International, Inc.: | |||
| 3.75% 3/15/29 (a) | 265,000 | 254,718 | |
| 4.25% 5/1/28 (a) | 150,000 | 148,688 | |
| Community Health Systems, Inc. 5.25% 5/15/30 (a) | 1,730,000 | 1,675,695 | |
| DaVita HealthCare Partners, Inc. 4.625% 6/1/30 (a) | 640,000 | 613,600 | |
| HCA Holdings, Inc.: | |||
| 5.375% 2/1/25 | 1,600,000 | 1,694,416 | |
| 5.375% 9/1/26 | 5,515,000 | 5,934,112 | |
| Hologic, Inc.: | |||
| 3.25% 2/15/29 (a) | 1,125,000 | 1,065,938 | |
| 4.625% 2/1/28 (a) | 170,000 | 175,525 | |
| IQVIA, Inc. 5% 5/15/27 (a) | 630,000 | 644,446 | |
| Jazz Securities DAC 4.375% 1/15/29 (a) | 305,000 | 302,090 | |
| Molina Healthcare, Inc. 3.875% 5/15/32 (a) | 485,000 | 475,152 | |
| Organon & Co. / Organon Foreign Debt Co-Issuer BV: | |||
| 4.125% 4/30/28 (a) | 775,000 | 762,298 | |
| 5.125% 4/30/31 (a) | 1,050,000 | 1,048,184 | |
| Teleflex, Inc. 4.25% 6/1/28 (a) | 305,000 | 301,188 | |
| Tenet Healthcare Corp.: | |||
| 4.625% 6/15/28 (a) | 5,745,000 | 5,630,100 | |
| 4.875% 1/1/26 (a) | 690,000 | 694,692 | |
| 5.125% 11/1/27 (a) | 1,500,000 | 1,528,950 | |
| TOTAL HEALTHCARE | 30,615,229 | ||
| Homebuilders/Real Estate - 2.8% | |||
| Century Communities, Inc. 3.875% 8/15/29 (a) | 430,000 | 398,679 | |
| HAT Holdings I LLC/HAT Holdings II LLC 3.375% 6/15/26 (a) | 460,000 | 435,850 | |
| Howard Hughes Corp. 4.375% 2/1/31 (a) | 675,000 | 636,188 | |
| Kennedy-Wilson, Inc. 4.75% 2/1/30 | 715,000 | 683,719 | |
| MPT Operating Partnership LP/MPT Finance Corp. 5% 10/15/27 | 3,516,000 | 3,592,666 | |
| Ryan Specialty Group LLC 4.375% 2/1/30 (a) | 530,000 | 509,887 | |
| Service Properties Trust: | |||
| 3.95% 1/15/28 | 85,000 | 73,738 | |
| 4.375% 2/15/30 | 605,000 | 526,792 | |
| 4.95% 2/15/27 | 1,245,000 | 1,157,850 | |
| 4.95% 10/1/29 | 515,000 | 465,560 | |
| 5.5% 12/15/27 | 480,000 | 469,800 | |
| TopBuild Corp. 4.125% 2/15/32 (a) | 765,000 | 727,439 | |
| TOTAL HOMEBUILDERS/REAL ESTATE | 9,678,168 | ||
| Hotels - 1.5% | |||
| Hilton Domestic Operating Co., Inc.: | |||
| 3.625% 2/15/32 (a) | 1,130,000 | 1,074,178 | |
| 4% 5/1/31 (a) | 3,185,000 | 3,113,067 | |
| Hilton Worldwide Finance LLC/Hilton Worldwide Finance Corp. 4.875% 4/1/27 | 426,000 | 435,053 | |
| Wyndham Hotels & Resorts, Inc. 4.375% 8/15/28 (a) | 592,000 | 583,120 | |
| TOTAL HOTELS | 5,205,418 | ||
| Leisure - 1.1% | |||
| Carnival Corp. 10.5% 2/1/26 (a) | 2,290,000 | 2,570,525 | |
| Royal Caribbean Cruises Ltd.: | |||
| 5.375% 7/15/27 (a) | 325,000 | 319,267 | |
| 9.125% 6/15/23 (a) | 265,000 | 276,594 | |
| 11.5% 6/1/25 (a) | 675,000 | 743,344 | |
| TOTAL LEISURE | 3,909,730 | ||
| Metals/Mining - 0.0% | |||
| FMG Resources (August 2006) Pty Ltd. 4.5% 9/15/27 (a) | 20,000 | 20,000 | |
| Howmet Aerospace, Inc. 5.95% 2/1/37 | 55,000 | 60,850 | |
| TOTAL METALS/MINING | 80,850 | ||
| Paper - 0.1% | |||
| Glatfelter Corp. 4.75% 11/15/29 (a) | 290,000 | 275,245 | |
| Restaurants - 0.1% | |||
| Yum! Brands, Inc. 3.625% 3/15/31 | 470,000 | 439,182 | |
| Services - 5.3% | |||
| ADT Corp.: | |||
| 4.125% 8/1/29 (a) | 360,000 | 339,430 | |
| 4.875% 7/15/32 (a) | 355,000 | 331,038 | |
| Adtalem Global Education, Inc. 5.5% 3/1/28 (a) | 375,000 | 335,411 | |
| AECOM 5.125% 3/15/27 | 2,030,000 | 2,080,750 | |
| Aramark Services, Inc. 5% 2/1/28 (a) | 3,660,000 | 3,666,533 | |
| ASGN, Inc. 4.625% 5/15/28 (a) | 3,400,000 | 3,357,500 | |
| Booz Allen Hamilton, Inc.: | |||
| 3.875% 9/1/28 (a) | 1,595,000 | 1,561,234 | |
| 4% 7/1/29 (a) | 140,000 | 138,141 | |
| Fair Isaac Corp. 4% 6/15/28 (a) | 435,000 | 426,844 | |
| Gartner, Inc.: | |||
| 3.625% 6/15/29 (a) | 205,000 | 198,897 | |
| 3.75% 10/1/30 (a) | 530,000 | 515,584 | |
| GEMS MENASA Cayman Ltd. 7.125% 7/31/26 (a) | 800,000 | 809,900 | |
| Iron Mountain, Inc. 4.875% 9/15/29 (a) | 1,270,000 | 1,228,725 | |
| Prime Securities Services Borrower LLC/Prime Finance, Inc. 3.375% 8/31/27 (a) | 2,545,000 | 2,353,977 | |
| Service Corp. International 5.125% 6/1/29 | 695,000 | 712,375 | |
| TriNet Group, Inc. 3.5% 3/1/29 (a) | 595,000 | 559,734 | |
| TOTAL SERVICES | 18,616,073 | ||
| Steel - 0.2% | |||
| Commercial Metals Co. 3.875% 2/15/31 | 755,000 | 706,355 | |
| Super Retail - 1.4% | |||
| Asbury Automotive Group, Inc.: | |||
| 4.625% 11/15/29 (a) | 230,000 | 224,250 | |
| 5% 2/15/32 (a) | 250,000 | 242,673 | |
| Bath & Body Works, Inc. 6.625% 10/1/30 (a) | 1,095,000 | 1,185,381 | |
| Gap, Inc. 3.875% 10/1/31 (a) | 360,000 | 322,627 | |
| Hanesbrands, Inc. 4.875% 5/15/26 (a) | 1,270,000 | 1,293,279 | |
| Levi Strauss & Co. 3.5% 3/1/31 (a) | 525,000 | 489,284 | |
| The William Carter Co. 5.625% 3/15/27 (a) | 1,154,000 | 1,175,638 | |
| TOTAL SUPER RETAIL | 4,933,132 | ||
| Technology - 4.3% | |||
| Block, Inc. 2.75% 6/1/26 (a) | 360,000 | 349,200 | |
| CDK Global, Inc. 5.25% 5/15/29 (a) | 2,398,000 | 2,457,950 | |
| Crowdstrike Holdings, Inc. 3% 2/15/29 | 610,000 | 571,875 | |
| Gartner, Inc. 4.5% 7/1/28 (a) | 820,000 | 830,685 | |
| Match Group Holdings II LLC:�� | |||
| 3.625% 10/1/31 (a) | 575,000 | 536,188 | |
| 4.125% 8/1/30 (a) | 305,000 | 295,234 | |
| MicroStrategy, Inc. 6.125% 6/15/28 (a) | 360,000 | 345,600 | |
| Nuance Communications, Inc. 5.625% 12/15/26 | 488,000 | 501,513 | |
| onsemi 3.875% 9/1/28 (a) | 620,000 | 614,575 | |
| Open Text Corp.: | |||
| 3.875% 2/15/28 (a) | 2,760,000 | 2,672,370 | |
| 3.875% 12/1/29 (a) | 180,000 | 169,880 | |
| Roblox Corp. 3.875% 5/1/30 (a) | 890,000 | 846,279 | |
| Sensata Technologies BV: | |||
| 4% 4/15/29 (a) | 1,115,000 | 1,070,400 | |
| 5.625% 11/1/24 (a) | 1,000,000 | 1,053,560 | |
| Sensata Technologies, Inc. 3.75% 2/15/31 (a) | 1,335,000 | 1,241,550 | |
| TTM Technologies, Inc. 4% 3/1/29 (a) | 460,000 | 424,350 | |
| Twilio, Inc. 3.875% 3/15/31 | 295,000 | 276,968 | |
| Viavi Solutions, Inc. 3.75% 10/1/29 (a) | 725,000 | 687,162 | |
| TOTAL TECHNOLOGY | 14,945,339 | ||
| Telecommunications - 9.7% | |||
| Altice Financing SA 5% 1/15/28 (a) | 460,000 | 414,492 | |
| C&W Senior Financing Designated Activity Co. 6.875% 9/15/27 (a) | 2,719,000 | 2,807,313 | |
| Level 3 Financing, Inc. 4.25% 7/1/28 (a) | 3,815,000 | 3,522,733 | |
| Lumen Technologies, Inc.: | |||
| 5.125% 12/15/26 (a) | 2,440,000 | 2,270,091 | |
| 5.625% 4/1/25 | 1,765,000 | 1,754,926 | |
| 6.875% 1/15/28 | 80,000 | 77,125 | |
| Millicom International Cellular SA: | |||
| 4.5% 4/27/31 (a) | 200,000 | 186,200 | |
| 5.125% 1/15/28 (a) | 1,800,000 | 1,757,025 | |
| Sable International Finance Ltd. 5.75% 9/7/27 (a) | 2,404,000 | 2,453,583 | |
| SBA Communications Corp. 3.875% 2/15/27 | 705,000 | 703,780 | |
| Sprint Capital Corp.: | |||
| 6.875% 11/15/28 | 9,510,000 | 11,292,817 | |
| 8.75% 3/15/32 | 1,720,000 | 2,386,500 | |
| Telecom Italia Capital SA: | |||
| 6% 9/30/34 | 739,000 | 702,050 | |
| 7.2% 7/18/36 | 3,400,000 | 3,451,000 | |
| TOTAL TELECOMMUNICATIONS | 33,779,635 | ||
| Textiles/Apparel - 0.1% | |||
| Foot Locker, Inc. 4% 10/1/29 (a) | 190,000 | 172,900 | |
| Kontoor Brands, Inc. 4.125% 11/15/29 (a) | 125,000 | 117,813 | |
| TOTAL TEXTILES/APPAREL | 290,713 | ||
| Transportation Ex Air/Rail - 0.2% | |||
| Seaspan Corp. 5.5% 8/1/29 (a) | 360,000 | 342,900 | |
| XPO Logistics, Inc. 6.25% 5/1/25 (a) | 370,000 | 383,734 | |
| TOTAL TRANSPORTATION EX AIR/RAIL | 726,634 | ||
| Utilities - 8.7% | |||
| Clearway Energy Operating LLC: | |||
| 3.75% 2/15/31 (a) | 1,355,000 | 1,260,617 | |
| 4.75% 3/15/28 (a) | 290,000 | 291,492 | |
| DCP Midstream Operating LP: | |||
| 5.125% 5/15/29 | 3,305,000 | 3,478,513 | |
| 5.625% 7/15/27 | 1,285,000 | 1,380,090 | |
| InterGen NV 7% 6/30/23 (a) | 1,496,000 | 1,464,958 | |
| NextEra Energy Partners LP 4.25% 9/15/24 (a) | 146,000 | 147,095 | |
| NRG Energy, Inc.: | |||
| 3.625% 2/15/31 (a) | 1,710,000 | 1,572,191 | |
| 5.25% 6/15/29 (a) | 1,251,000 | 1,276,020 | |
| 5.75% 1/15/28 | 1,319,000 | 1,348,651 | |
| 6.625% 1/15/27 | 339,000 | 350,353 | |
| NSG Holdings II LLC/NSG Holdings, Inc. 7.75% 12/15/25 (a) | 2,634,532 | 2,772,845 | |
| PG&E Corp.: | |||
| 5% 7/1/28 | 5,555,000 | 5,499,450 | |
| 5.25% 7/1/30 | 2,395,000 | 2,379,025 | |
| TerraForm Power Operating LLC 5% 1/31/28 (a) | 624,000 | 625,560 | |
| Vertiv Group Corp. 4.125% 11/15/28 (a) | 895,000 | 821,163 | |
| Vistra Operations Co. LLC: | |||
| 5% 7/31/27 (a) | 2,705,000 | 2,725,085 | |
| 5.5% 9/1/26 (a) | 2,052,000 | 2,087,736 | |
| 5.625% 2/15/27 (a) | 960,000 | 982,954 | |
| TOTAL UTILITIES | 30,463,798 | ||
| TOTAL NONCONVERTIBLE BONDS | |||
| (Cost $335,964,104) | 331,982,656 | ||
| Bank Loan Obligations - 0.0% | |||
| Services - 0.0% | |||
| ABG Intermediate Holdings 2 LLC: | |||
| Tranche B1 LN, term loan U.S. Secured Overnight Fin. Rate (SOFR) Indx + 3.500% 12/21/28 (b)(c)(d) | 15,522 | 15,367 | |
| Tranche B2 1LN, term loan U.S. Secured Overnight Fin. Rate (SOFR) Indx + 3.500% 1/31/29 (b)(c)(d) | 98,955 | 97,966 | |
| Tranche B3 1LN, term loan U.S. Secured Overnight Fin. Rate (SOFR) Indx + 3.500% 12/21/28 (b)(c)(d) | 15,522 | 15,367 | |
| TOTAL SERVICES | 128,700 | ||
| TOTAL BANK LOAN OBLIGATIONS | |||
| (Cost $129,051) | 128,700 | ||
| Preferred Securities - 1.0% | |||
| Banks & Thrifts - 1.0% | |||
| Ally Financial, Inc. 4.7% (Cost $3,800,000)(e)(f) | 3,800,000 | 3,631,748 | |
| Shares | Value | ||
| Money Market Funds - 3.9% | |||
| Fidelity Cash Central Fund 0.07% (g) | |||
| (Cost $13,491,422) | 13,490,662 | 13,493,360 | |
| TOTAL INVESTMENT IN SECURITIES - 100.1% | |||
| (Cost $353,384,577) | 349,236,464 | ||
| NET OTHER ASSETS (LIABILITIES) - (0.1)% | (301,166) | ||
| NET ASSETS - 100% | $348,935,298 |
Legend
(a) Security exempt from registration under Rule 144A of the Securities Act of 1933. These securities may be resold in transactions exempt from registration, normally to qualified institutional buyers. At the end of the period, the value of these securities amounted to $195,057,476 or 55.9% of net assets.
(b) The coupon rate will be determined upon settlement of the loan after period end.
(c) Coupon is indexed to a floating interest rate which may be multiplied by a specified factor and/or subject to caps or floors.
(d) Remaining maturities of bank loan obligations may be less than the stated maturities shown as a result of contractual or optional prepayments by the borrower. Such prepayments cannot be predicted with certainty.
(e) Security is perpetual in nature with no stated maturity date.
(f) Coupon rates for floating and adjustable rate securities reflect the rates in effect at period end.
(g) Affiliated fund that is generally available only to investment companies and other accounts managed by Fidelity Investments. The rate quoted is the annualized seven-day yield of the fund at period end. A complete unaudited listing of the fund's holdings as of its most recent quarter end is available upon request. In addition, each Fidelity Central Fund's financial statements are available on the SEC's website or upon request.
Affiliated Central Funds
Fiscal year to date information regarding the Fund's investments in Fidelity Central Funds, including the ownership percentage, is presented below.
| Fund | Value, beginning of period | Purchases | Sales Proceeds | Dividend Income | Realized Gain/Loss | Change in Unrealized appreciation (depreciation) | Value, end of period | % ownership, end of period |
| Fidelity Cash Central Fund 0.07% | $24,916,243 | $27,290,138 | $38,713,021 | $7,374 | $-- | $-- | $13,493,360 | 0.0% |
| Total | $24,916,243 | $27,290,138 | $38,713,021 | $7,374 | $-- | $-- | $13,493,360 |
Amounts in the income column in the above table include any capital gain distributions from underlying funds, which are presented in the corresponding line-item in the Statement of Operations, if applicable.
Investment Valuation
The following is a summary of the inputs used, as of February 28, 2022, involving the Fund's assets and liabilities carried at fair value. The inputs or methodology used for valuing securities may not be an indication of the risk associated with investing in those securities. For more information on valuation inputs, and their aggregation into the levels used below, please refer to the Investment Valuation section in the accompanying Notes to Financial Statements.
| Valuation Inputs at Reporting Date: | ||||
| Description | Total | Level 1 | Level 2 | Level 3 |
| Investments in Securities: | ||||
| Corporate Bonds | $331,982,656 | $-- | $331,982,656 | $-- |
| Bank Loan Obligations | 128,700 | -- | 128,700 | -- |
| Preferred Securities | 3,631,748 | -- | 3,631,748 | -- |
| Money Market Funds | 13,493,360 | 13,493,360 | -- | -- |
| Total Investments in Securities: | $349,236,464 | $13,493,360 | $335,743,104 | $-- |
Other Information
Distribution of investments by country or territory of incorporation, as a percentage of Total Net Assets, is as follows (Unaudited):
| United States of America | 87.8% |
| Canada | 2.5% |
| Multi-National | 2.2% |
| Luxembourg | 1.9% |
| Netherlands | 1.6% |
| Cayman Islands | 1.2% |
| Others (Individually Less Than 1%) | 2.8% |
| 100.0% |
See accompanying notes which are an integral part of the financial statements.
Financial Statements
Statement of Assets and Liabilities
| February 28, 2022 (Unaudited) | ||
| Assets | ||
| Investment in securities, at value — See accompanying schedule: Unaffiliated issuers (cost $339,893,155) | $335,743,104 | |
| Fidelity Central Funds (cost $13,491,422) | 13,493,360 | |
| Total Investment in Securities (cost $353,384,577) | $349,236,464 | |
| Interest receivable | 4,403,933 | |
| Distributions receivable from Fidelity Central Funds | 883 | |
| Total assets | 353,641,280 | |
| Liabilities | ||
| Payable for investments purchased | $4,705,725 | |
| Other payables and accrued expenses | 257 | |
| Total liabilities | 4,705,982 | |
| Net Assets | $348,935,298 | |
| Net Assets consist of: | ||
| Paid in capital | $353,083,901 | |
| Total accumulated earnings (loss) | (4,148,603) | |
| Net Assets | $348,935,298 | |
| Net Asset Value, offering price and redemption price per share ($348,935,298 ÷ 3,794,587 shares) | $91.96 |
See accompanying notes which are an integral part of the financial statements.
Statement of Operations
| Six months ended February 28, 2022 (Unaudited) | ||
| Investment Income | ||
| Dividends | $89,300 | |
| Interest | 7,525,224 | |
| Income from Fidelity Central Funds | 7,374 | |
| Total income | 7,621,898 | |
| Expenses | ||
| Custodian fees and expenses | $689 | |
| Independent directors' fees and expenses | 626 | |
| Total expenses before reductions | 1,315 | |
| Expense reductions | (46) | |
| Total expenses after reductions | 1,269 | |
| Net investment income (loss) | 7,620,629 | |
| Realized and Unrealized Gain (Loss) | ||
| Net realized gain (loss) on: | ||
| Investment securities: | ||
| Unaffiliated issuers | 494,753 | |
| Total net realized gain (loss) | 494,753 | |
| Change in net unrealized appreciation (depreciation) on investment securities | (21,097,112) | |
| Net gain (loss) | (20,602,359) | |
| Net increase (decrease) in net assets resulting from operations | $(12,981,730) |
See accompanying notes which are an integral part of the financial statements.
Statement of Changes in Net Assets
| Six months ended February 28, 2022 (Unaudited) | Year ended August 31, 2021 | |
| Increase (Decrease) in Net Assets | ||
| Operations | ||
| Net investment income (loss) | $7,620,629 | $20,169,902 |
| Net realized gain (loss) | 494,753 | 16,514,516 |
| Change in net unrealized appreciation (depreciation) | (21,097,112) | (8,540,200) |
| Net increase (decrease) in net assets resulting from operations | (12,981,730) | 28,144,218 |
| Distributions to shareholders | (19,904,921) | (24,179,309) |
| Affiliated share transactions | ||
| Proceeds from sales of shares | 400,000 | 7,650,000 |
| Reinvestment of distributions | 19,904,922 | 24,179,308 |
| Cost of shares redeemed | – | (205,326,776) |
| Net increase (decrease) in net assets resulting from share transactions | 20,304,922 | (173,497,468) |
| Total increase (decrease) in net assets | (12,581,729) | (169,532,559) |
| Net Assets | ||
| Beginning of period | 361,517,027 | 531,049,586 |
| End of period | $348,935,298 | $361,517,027 |
| Other Information | ||
| Shares | ||
| Sold | 4,176 | 76,937 |
| Issued in reinvestment of distributions | 207,262 | 243,094 |
| Redeemed | – | (2,047,003) |
| Net increase (decrease) | 211,438 | (1,726,972) |
See accompanying notes which are an integral part of the financial statements.
Financial Highlights
Fidelity Specialized High Income Central Fund
| Six months ended (Unaudited) February 28, | Years endedAugust 31, | |||||
| 2022 | 2021 | 2020 | 2019 | 2018 | 2017 | |
| Selected Per–Share Data | ||||||
| Net asset value, beginning of period | $100.89 | $100.01 | $102.28 | $99.83 | $104.63 | $103.06 |
| Income from Investment Operations | ||||||
| Net investment income (loss)A,B | 2.049 | 4.670 | 5.162 | 5.368 | 5.188 | 5.489 |
| Net realized and unrealized gain (loss) | (5.511) | 1.582 | (1.042) | 2.981 | (2.758) | 1.901 |
| Total from investment operations | (3.462) | 6.252 | 4.120 | 8.349 | 2.430 | 7.390 |
| Distributions from net investment income | (2.048) | (4.623) | (5.093) | (5.335) | (5.217) | (5.531) |
| Distributions from net realized gain | (3.420) | (.749) | (1.297) | (.564) | (2.013) | (.289) |
| Total distributions | (5.468) | (5.372) | (6.390) | (5.899) | (7.230) | (5.820) |
| Net asset value, end of period | $91.96 | $100.89 | $100.01 | $102.28 | $99.83 | $104.63 |
| Total ReturnC,D | (3.58)% | 6.46% | 4.25% | 8.73% | 2.42% | 7.39% |
| Ratios to Average Net AssetsB,E,F | ||||||
| Expenses before reductionsG | - %H | -% | -% | -% | -% | -% |
| Expenses net of fee waivers, if anyG | - %H | -% | -% | -% | -% | -% |
| Expenses net of all reductionsG | - %H | -% | -% | -% | -% | -% |
| Net investment income (loss) | 4.30%H | 4.67% | 5.20% | 5.42% | 5.13% | 5.31% |
| Supplemental Data | ||||||
| Net assets, end of period (000 omitted) | $348,935 | $361,517 | $531,050 | $601,159 | $719,197 | $768,593 |
| Portfolio turnover rateI | 21%H | 55% | 54% | 45%J | 62% | 51% |
A Calculated based on average shares outstanding during the period.
B Net investment income (loss) is affected by the timing of the declaration of dividends by any underlying mutual funds or exchange-traded funds (ETFs). Net investment income (loss) of any such underlying funds is not included in the Fund's net investment income (loss) ratio.
C Total returns for periods of less than one year are not annualized.
D Total returns would have been lower if certain expenses had not been reduced during the applicable periods shown.
E Fees and expenses of any underlying mutual funds or exchange-traded funds (ETFs) are not included in the Fund's expense ratio. The Fund indirectly bears its proportionate share of these expenses.
F Expense ratios reflect operating expenses of the class. Expenses before reductions do not reflect amounts reimbursed, waived, or reduced through arrangements with the investment adviser, brokerage services, or other offset arrangements, if applicable, and do not represent the amount paid by the class during periods when reimbursements, waivers or reductions occur.
G Amount represents less than .005%.
H Annualized
I Amount does not include the portfolio activity of any underlying mutual funds or exchange-traded funds (ETFs).
J Portfolio turnover rate excludes securities received or delivered in-kind.
See accompanying notes which are an integral part of the financial statements.
Notes to Financial Statements (Unaudited)
For the period ended February 28, 2022
1. Organization.
Fidelity Specialized High Income Central Fund (the Fund) is a fund of Fidelity Central Investment Portfolios LLC (the LLC) and is authorized to issue an unlimited number of shares. Shares of the Fund are only offered to other investment companies and accounts managed by Fidelity Management & Research Company LLC (FMR), or its affiliates (the Investing Funds). The LLC is registered under the Investment Company Act of 1940, as amended (the 1940 Act), as an open-end management investment company organized as a Delaware Limited Liability Company.
2. Investments in Fidelity Central Funds.
Funds may invest in Fidelity Central Funds, which are open-end investment companies generally available only to other investment companies and accounts managed by the investment adviser and its affiliates. The Schedule of Investments lists any Fidelity Central Funds held as an investment as of period end, but does not include the underlying holdings of each Fidelity Central Fund. An investing fund indirectly bears its proportionate share of the expenses of the underlying Fidelity Central Funds.
Based on its investment objective, each Fidelity Central Fund may invest or participate in various investment vehicles or strategies that are similar to those of the investing fund. These strategies are consistent with the investment objectives of the investing fund and may involve certain economic risks which may cause a decline in value of each of the Fidelity Central Funds and thus a decline in the value of the investing fund.
| Fidelity Central Fund | Investment Manager | Investment Objective | Investment Practices | Expense Ratio(a) |
| Fidelity Money Market Central Funds | Fidelity Management & Research Company LLC (FMR) | Each fund seeks to obtain a high level of current income consistent with the preservation of capital and liquidity. | Short-term Investments | Less than .005% |
(a) Expenses expressed as a percentage of average net assets and are as of each underlying Central Fund's most recent annual or semi-annual shareholder report.
A complete unaudited list of holdings for each Fidelity Central Fund is available upon request or at the Securities and Exchange Commission website at www.sec.gov. In addition, the financial statements of the Fidelity Central Funds which contain the significant accounting policies (including investment valuation policies) of those funds, and are not covered by the Report of Independent Registered Public Accounting Firm, are available on the Securities and Exchange Commission website or upon request.
3. Significant Accounting Policies.
The Fund is an investment company and applies the accounting and reporting guidance of the Financial Accounting Standards Board (FASB) Accounting Standards Codification Topic 946 Financial Services - Investment Companies. The financial statements have been prepared in conformity with accounting principles generally accepted in the United States of America (GAAP), which require management to make certain estimates and assumptions at the date of the financial statements. Actual results could differ from those estimates. Subsequent events, if any, through the date that the financial statements were issued have been evaluated in the preparation of the financial statements. The Fund's Schedule of Investments lists any underlying mutual funds or exchange-traded funds (ETFs) but does not include the underlying holdings of these funds. The following summarizes the significant accounting policies of the Fund:
Investment Valuation. Investments are valued as of 4:00 p.m. Eastern time on the last calendar day of the period. The Board of Directors (the Board) has delegated the day to day responsibility for the valuation of the Fund's investments to the Fair Value Committee (the Committee) established by the Fund's investment adviser. In accordance with valuation policies and procedures approved by the Board, the Fund attempts to obtain prices from one or more third party pricing vendors or brokers to value its investments. When current market prices, quotations or currency exchange rates are not readily available or reliable, investments will be fair valued in good faith by the Committee, in accordance with procedures adopted by the Board. Factors used in determining fair value vary by investment type and may include market or investment specific events, changes in interest rates and credit quality. The frequency with which these procedures are used cannot be predicted and they may be utilized to a significant extent. The Committee oversees the Fund's valuation policies and procedures and reports to the Board on the Committee's activities and fair value determinations. The Board monitors the appropriateness of the procedures used in valuing the Fund's investments and ratifies the fair value determinations of the Committee.
The Fund categorizes the inputs to valuation techniques used to value its investments into a disclosure hierarchy consisting of three levels as shown below:
- Level 1 – Unadjusted quoted prices in active markets for identical investments
- Level 2 – other significant observable inputs (including quoted prices for similar investments, interest rates, prepayment speeds, etc.)
- Level 3 – unobservable inputs (including the Fund's own assumptions based on the best information available)
Valuation techniques used to value the Fund's investments by major category are as follows:
Debt securities, including restricted securities, are valued based on evaluated prices received from third party pricing vendors or from brokers who make markets in such securities. Corporate bonds, bank loan obligations and preferred securities are valued by pricing vendors who utilize matrix pricing which considers yield or price of bonds of comparable quality, coupon, maturity and type or by broker-supplied prices. When independent prices are unavailable or unreliable, debt securities may be valued utilizing pricing methodologies which consider similar factors that would be used by third party pricing vendors. Debt securities are generally categorized as Level 2 in the hierarchy but may be Level 3 depending on the circumstances. The Fund invests a significant portion of its assets in below investment grade securities. The value of these securities can be more volatile due to changes in the credit quality of the issuer and is sensitive to changes in economic, market and regulatory conditions.
Investments in open-end mutual funds , including the Fidelity Central Funds, are valued at their closing net asset value (NAV) each business day and are categorized as Level 1 in the hierarchy.
Changes in valuation techniques may result in transfers in or out of an assigned level within the disclosure hierarchy. The aggregate value of investments by input level as of February 28, 2022 is included at the end of the Fund's Schedule of Investments.
Investment Transactions and Income. For financial reporting purposes, the Fund's investment holdings and NAV include trades executed through the end of the last business day of the period. The NAV per share for processing shareholder transactions is calculated as of the close of business of the New York Stock Exchange (NYSE), normally 4:00 p.m. Eastern time and includes trades executed through the end of the prior business day. Gains and losses on securities sold are determined on the basis of identified cost and include proceeds received from litigation. Dividend income is recorded on the ex-dividend date. Income and capital gain distributions from Fidelity Central Funds, if any, are recorded on the ex-dividend date. Interest income is accrued as earned and includes coupon interest and amortization of premium and accretion of discount on debt securities as applicable. Debt obligations may be placed on non-accrual status and related interest income may be reduced by ceasing current accruals and writing off interest receivables when the collection of all or a portion of interest has become doubtful based on consistently applied procedures. A debt obligation is removed from non-accrual status when the issuer resumes interest payments or when collectability of interest is reasonably assured.
Expenses. Expenses directly attributable to a fund are charged to that fund. Expenses attributable to more than one fund are allocated among the respective funds on the basis of relative net assets or other appropriate methods. Expenses included in the accompanying financial statements reflect the expenses of that fund and do not include any expenses associated with any underlying mutual funds or exchange-traded funds. Although not included in a fund's expenses, a fund indirectly bears its proportionate share of these expenses through the net asset value of each underlying mutual fund or exchange-traded fund. Expense estimates are accrued in the period to which they relate and adjustments are made when actual amounts are known.
Income Tax Information and Distributions to Shareholders. Each year, the Fund intends to qualify as a regulated investment company under Subchapter M of the Internal Revenue Code, including distributing substantially all of its taxable income and realized gains. As a result, no provision for U.S. Federal income taxes is required. The Fund files a U.S. federal tax return, in addition to state and local tax returns as required. The Fund's federal income tax returns are subject to examination by the Internal Revenue Service (IRS) for a period of three fiscal years after they are filed. State and local tax returns may be subject to examination for an additional fiscal year depending on the jurisdiction.
Distributions are declared and recorded daily and paid monthly from net investment income. Distributions from realized gains, if any, are declared and recorded on the ex-dividend date. Income and capital gain distributions are determined in accordance with income tax regulations, which may differ from GAAP.
Capital accounts within the financial statements are adjusted for permanent book-tax differences. These adjustments have no impact on net assets or the results of operations. Capital accounts are not adjusted for temporary book-tax differences which will reverse in a subsequent period.
Book-tax differences are primarily due to prior period premium and discount on debt securities and losses deferred due to wash sales and excise tax regulations.
As of period end, the cost and unrealized appreciation (depreciation) in securities, and derivatives if applicable, for federal income tax purposes were as follows:
| Gross unrealized appreciation | $7,668,717 |
| Gross unrealized depreciation | (11,622,067) |
| Net unrealized appreciation (depreciation) | $(3,953,350) |
| Tax cost | $353,189,814 |
Restricted Securities (including Private Placements). Funds may invest in securities that are subject to legal or contractual restrictions on resale. These securities generally may be resold in transactions exempt from registration or to the public if the securities are registered. Disposal of these securities may involve time-consuming negotiations and expense, and prompt sale at an acceptable price may be difficult. Information regarding restricted securities held at period end is included at the end of the Schedule of Investments, if applicable.
Loans and Other Direct Debt Instruments. Direct debt instruments are interests in amounts owed to lenders by corporate or other borrowers. These instruments may be in the form of loans, trade claims or other receivables and may include standby financing commitments such as revolving credit facilities that obligate a fund to supply additional cash to the borrower on demand. Loans may be acquired through assignment, participation, or may be made directly to a borrower. Such instruments are presented in the Bank Loan Obligations section in the Schedule of Investments. Certain funds may also invest in unfunded loan commitments, which are contractual obligations for future funding. Information regarding unfunded commitments is included at the end of the Schedule of Investments, if applicable.
4. Purchases and Sales of Investments.
Purchases and sales of securities, other than short-term securities, and in-kind transactions, as applicable, are noted in the table below.
| Purchases ($) | Sales ($) | |
| Fidelity Specialized High Income Central Fund | 59,321,461 | 34,889,432 |
5. Fees and Other Transactions with Affiliates.
Management Fee and Expense Contract. Fidelity Management & Research Company LLC (the investment adviser) provides the Fund with investment management services. The Fund does not pay any fees for these services. Pursuant to the Fund's management contract, the investment adviser receives a monthly management fee that represents a portion of the management fees it receives from the Investing Funds. In addition, under an expense contract, the investment adviser also pays all other expenses of the Fund, excluding custody fees, the compensation of the independent Directors, and certain miscellaneous expenses such as proxy and shareholder meeting expenses.
Interfund Trades. Funds may purchase from or sell securities to other Fidelity Funds under procedures adopted by the Board. The procedures have been designed to ensure these interfund trades are executed in accordance with Rule 17a-7 of the 1940 Act. Any interfund trades are included within the respective purchases and sales amounts shown in the Purchases and Sales of Investments note. During the period there were no interfund trades.
6. Expense Reductions.
Through arrangements with the Fund's custodian, credits realized as a result of certain uninvested cash balances were used to reduce the Fund's expenses by $46.
7. Other.
A fund's organizational documents provide former and current directors and officers with a limited indemnification against liabilities arising in connection with the performance of their duties to the fund. In the normal course of business, a fund may also enter into contracts that provide general indemnifications. A fund's maximum exposure under these arrangements is unknown as this would be dependent on future claims that may be made against a fund. The risk of material loss from such claims is considered remote.
At the end of the period, mutual funds managed by the investment adviser or its affiliates were the owners of record of all of the outstanding shares of the Fund.
8. Coronavirus (COVID-19) Pandemic.
An outbreak of COVID-19 first detected in China during December 2019 has since spread globally and was declared a pandemic by the World Health Organization during March 2020. Developments that disrupt global economies and financial markets, such as the COVID-19 pandemic, may magnify factors that affect the Fund's performance.
Shareholder Expense Example
As a shareholder, you incur two types of costs: (1) transaction costs, which may include sales charges (loads) on purchase payments or redemption proceeds, as applicable and (2) ongoing costs, which generally include management fees, distribution and/or service (12b-1) fees and other Fund expenses. This Example is intended to help you understand your ongoing costs (in dollars) of investing in a fund and to compare these costs with the ongoing costs of investing in other mutual funds.
The Example is based on an investment of $1,000 invested at the beginning of the period and held for the entire period (September 1, 2021 to February 28, 2022).
Actual Expenses
The first line of the accompanying table provides information about actual account values and actual expenses. You may use the information in this line, together with the amount you invested, to estimate the expenses that you paid over the period. Simply divide your account value by $1,000.00 (for example, an $8,600 account value divided by $1,000.00 = 8.6), then multiply the result by the number in the first line for a class/Fund under the heading entitled "Expenses Paid During Period" to estimate the expenses you paid on your account during this period. If any fund is a shareholder of any underlying mutual funds or exchange-traded funds (ETFs) (the Underlying Funds), such fund indirectly bears its proportional share of the expenses of the Underlying Funds in addition to the direct expenses incurred presented in the table. These fees and expenses are not included in the annualized expense ratio used to calculate the expense estimate in the table below.
Hypothetical Example for Comparison Purposes
The second line of the accompanying table provides information about hypothetical account values and hypothetical expenses based on the actual expense ratio and an assumed rate of return of 5% per year before expenses, which is not the actual return. The hypothetical account values and expenses may not be used to estimate the actual ending account balance or expenses you paid for the period. You may use this information to compare the ongoing costs of investing in the Fund and other funds. To do so, compare this 5% hypothetical example with the 5% hypothetical examples that appear in the shareholder reports of the other funds. If any fund is a shareholder of any Underlying Funds, such fund indirectly bears its proportional share of the expenses of the Underlying Funds in addition to the direct expenses as presented in the table. These fees and expenses are not included in the annualized expense ratio used to calculate the expense estimate in the table below.
Please note that the expenses shown in the table are meant to highlight your ongoing costs only and do not reflect any transaction costs. Therefore, the second line of the table is useful in comparing ongoing costs only, and will not help you determine the relative total costs of owning different funds. In addition, if these transactional costs were included, your costs would have been higher.
| Annualized Expense Ratio-A | Beginning Account Value September 1, 2021 | Ending Account Value February 28, 2022 | Expenses Paid During Period-B September 1, 2021 to February 28, 2022 | |
| Fidelity Specialized High Income Central Fund | .0007% | |||
| Actual | $1,000.00 | $964.20 | $--C | |
| Hypothetical-D | $1,000.00 | $1,024.79 | $--C |
A Annualized expense ratio reflects expenses net of applicable fee waivers.
B Expenses are equal to the annualized expense ratio, multiplied by the average account value over the period, multiplied by 181/ 365 (to reflect the one-half year period). The fees and expenses of any Underlying Funds are not included in each annualized expense ratio.
C Amount Represents less than $.005.
D 5% return per year before expenses
Liquidity Risk Management Program
The Securities and Exchange Commission adopted Rule 22e-4 under the Investment Company Act of 1940 (the Liquidity Rule) to promote effective liquidity risk management throughout the open-end investment company industry, thereby reducing the risk that funds will be unable to meet their redemption obligations and mitigating dilution of the interests of fund shareholders.
The Fund has adopted and implemented a liquidity risk management program pursuant to the Liquidity Rule (the Program) effective December 1, 2018. The Program is reasonably designed to assess and manage the Fund’s liquidity risk and to comply with the requirements of the Liquidity Rule. The Fund’s Board of Trustees (the Board) has designated the Fund’s investment adviser as administrator of the Program. The Fidelity advisers have established a Liquidity Risk Management Committee (the LRM Committee) to manage the Program for each of the Fidelity Funds. The LRM Committee monitors the adequacy and effectiveness of implementation of the Program and on a periodic basis assesses each Fund’s liquidity risk based on a variety of factors including (1) the Fund’s investment strategy, (2) portfolio liquidity and cash flow projections during normal and reasonably foreseeable stressed conditions, (3) shareholder redemptions, (4) borrowings and other funding sources and (5) in the case of exchange-traded funds, certain additional factors including the effect of the Fund’s prices and spreads, market participants, and basket compositions on the overall liquidity of the Fund’s portfolio, as applicable.
In accordance with the Program, each of the Fund’s portfolio investments is classified into one of four liquidity categories described below based on a determination of a reasonable expectation for how long it would take to convert the investment to cash (or sell or dispose of the investment) without significantly changing its market value.
- Highly liquid investments – cash or convertible to cash within three business days or less
- Moderately liquid investments – convertible to cash in three to seven calendar days
- Less liquid investments – can be sold or disposed of, but not settled, within seven calendar days
- Illiquid investments – cannot be sold or disposed of within seven calendar days
Liquidity classification determinations take into account a variety of factors including various market, trading and investment-specific considerations, as well as market depth, and generally utilize analysis from a third-party liquidity metrics service.
The Liquidity Rule places a 15% limit on a fund’s illiquid investments and requires funds that do not primarily hold assets that are highly liquid investments to determine and maintain a minimum percentage of the fund’s net assets to be invested in highly liquid investments (highly liquid investment minimum or HLIM). The Program includes provisions reasonably designed to comply with the 15% limit on illiquid investments and for determining, periodically reviewing and complying with the HLIM requirement as applicable.
At a recent meeting of the Fund’s Board of Trustees, the LRM Committee provided a written report to the Board pertaining to the operation, adequacy, and effectiveness of implementation of the Program for the annual period from December 1, 2020 through November 30, 2021. The report concluded that the Program has been implemented and is operating effectively and is reasonably designed to assess and manage the Fund’s liquidity risk.
![]()
SHI-SANN-0422
1.820820.116
Item 2.
Code of Ethics
Not applicable.
Item 3.
Audit Committee Financial Expert
Not applicable.
Item 4.
Principal Accountant Fees and Services
Not applicable.
Item 5.
Audit Committee of Listed Registrants
Not applicable.
Item 6.
Investments
(a)
Not applicable.
(b)
Not applicable
Item 7.
Disclosure of Proxy Voting Policies and Procedures for Closed-End Management Investment Companies
Not applicable.
Item 8.
Portfolio Managers of Closed-End Management Investment Companies
Not applicable.
Item 9.
Purchase of Equity Securities by Closed-End Management Investment Company and Affiliated Purchasers
Not applicable.
Item 10.
Submission of Matters to a Vote of Security Holders
There were no material changes to the procedures by which shareholders may recommend nominees to the Fidelity Central Investment Portfolios LLC’s Board of Trustees.
Item 11.
Controls and Procedures
(a)(i) The President and Treasurer and the Chief Financial Officer have concluded that the Fidelity Central Investment Portfolios LLC’s (the “Trust”) disclosure controls and
procedures (as defined in Rule 30a-3(c) under the Investment Company Act) provide reasonable assurances that material information relating to the Trust is made known to them by the appropriate persons, based on their evaluation of these controls and procedures as of a date within 90 days of the filing date of this report.
(a)(ii) There was no change in the Trust’s internal control over financial reporting (as defined in Rule 30a-3(d) under the Investment Company Act) that occurred during the period covered by this report that has materially affected, or is reasonably likely to materially affect, the Trust’s internal control over financial reporting.
Item 12.
Disclosure of Securities Lending Activities for Closed-End Management
Investment Companies
Not applicable.
Item 13.
Exhibits
(a) | (1) | Not applicable. |
(a) | (2) | |
(a) | (3) | Not applicable. |
(b) |
SIGNATURES
Pursuant to the requirements of the Securities Exchange Act of 1934 and the Investment Company Act of 1940, the registrant has duly caused this report to be signed on its behalf by the undersigned, thereunto duly authorized.
Fidelity Central Investment Portfolios LLC
By: | /s/Stacie M. Smith |
Stacie M. Smith | |
President and Treasurer | |
Date: | April 21, 2022 |
Pursuant to the requirements of the Securities Exchange Act of 1934 and the Investment Company Act of 1940, this report has been signed below by the following persons on behalf of the registrant and in the capacities and on the dates indicated.
By: | /s/Stacie M. Smith |
Stacie M. Smith | |
President and Treasurer | |
Date: | April 21, 2022 |
By: | /s/John J. Burke III |
John J. Burke III | |
Chief Financial Officer | |
Date: | April 21, 2022 |