UNITED STATES
SECURITIES AND EXCHANGE COMMISSION
Washington, D.C. 20549
FORM N-CSR
CERTIFIED SHAREHOLDER REPORT OF REGISTERED
MANAGEMENT INVESTMENT COMPANIES
Investment Company Act file number: 811-21638
JPMorgan Institutional Trust
(Exact name of registrant as specified in charter)
277 Park Avenue
New York, NY 10172
(Address of principal executive offices) (Zip code)
Gregory S. Samuels
277 Park Avenue
New York, NY 10172
(Name and Address of Agent for Service)
Registrant’s telephone number, including area code: (800) 343-1113
Date of fiscal year end: Last day of February
Date of reporting period: March 1, 2023 through August 31, 2023
Form N-CSR is to be used by management investment companies to file reports with the Commission not later than 10 days after the transmission to stockholders of any report that is required to be transmitted to stockholders under Rule 30e-1 under the Investment Company Act of 1940 (17 CFR 270.30e-1). The Commission may use the information provided on Form N-CSR in its regulatory, disclosure review, inspection, and policymaking roles.
A registrant is required to disclose the information specified by Form N-CSR, and the Commission will make this information public. A registrant is not required to respond to the collection of information contained in Form N-CSR unless the Form displays a currently valid Office of Management and Budget (“OMB”) control number. Please direct comments concerning the accuracy of the information collection burden estimate and any suggestions for reducing the burden to Secretary, Securities and Exchange Commission, 450 Fifth Street, NW, Washington, DC 20549-0609. The OMB has reviewed this collection of information under the clearance requirements of 44 U.S.C. Section 3507.
ITEM 1. REPORTS TO STOCKHOLDERS.
a.) The following is a copy of the report transmitted to shareholders pursuant to Rule 30e-1 under the Investment Company Act of 1940 (17 CFR 270.30e-1).
b.) A copy of the notice transmitted to shareholders in reliance on Rule 30e-3 under the 1940 Act that contains disclosures specified by paragraph (c)(3) of that rule is included in the Annual Report. Not Applicable. Notices do not incorporate disclosures from the shareholder reports.
Semi-Annual Report
JPMorgan Institutional Trust Funds
August 31, 2023 (Unaudited)
|
JPMorgan Intermediate Bond Trust |
CONTENTS
Investments in a Fund are not bank deposits or obligations of, or guaranteed or endorsed by, any bank and are not insured or guaranteed by the FDIC, the Federal Reserve Board or any other government agency. You could lose money if you sell when a Fund’s share price is lower than when you invested.
Past performance is no guarantee of future performance. The general market views expressed in this report are opinions based on market and other conditions through the end of the reporting period and are subject to change without notice. These views are not intended to predict the future performance of a Fund or the securities markets.
This report is intended for distribution only to accredited investors. Distribution of this document to anyone other than the intended user is expressly prohibited. This document may not be copied, faxed or otherwise distributed to the general public.
Letter to Shareholders
October 19, 2023 (Unaudited)
Dear Shareholder,
The U.S. economy has continued to expand this year as financial markets have largely generated positive returns even as the U.S. Federal Reserve (the “Fed”) sought to further reduce inflation by raising interest rates. For the six months ended August 31, 2023, equities markets largely outperformed fixed income markets and the U.S. markets led developed market returns, which generally outperformed emerging markets.
|
“A properly diversified portfolio together with a long-term approach may help investors weather economic and geopolitical uncertainties.” — Brian S. Shlissel
|
While inflation in the U.S. had seemingly subsided since the beginning of 2023, pressures raised by geopolitical events have contributed to elevated global prices, particularly for energy and food. The Fed responded to economic conditions this year by continuing to raise interest rates at its meetings in February, March and May but then took a pause from an additional increase at its June 2023 meeting. The Fed then raised the benchmark fed funds discount rate by a quarter of a percentage point in July to 5.50%, then held steady in September.
Higher interest rates in the U.S. have been accompanied by slower economic growth, as gross domestic product edged downward to 2.1% in the second quarter of 2023 from 2.2% in the first quarter. However, estimates on certain key U.S. economic data this year have been revised upward and a surge in consumer spending and factory output during the summer
has brightened the outlook for third quarter growth. Corporate earnings have generally remained strong and the U.S. unemployment rate has remained historically low, although it rose to 3.8% in August from 3.4% in March 2023.
The outlook for the U.S. economy appears brighter than many economists had forecasted at the beginning of the year, as some have prognosticated that the Fed appears to be at, or near, the end of its monetary tightening cycle. Notably, the Fed, the European Central Bank and the Bank of England, as well as certain other developed market central banks, have generally articulated a “higher-for-longer” policy stance, indicating they may not raise interest rates much further but they also do not currently expect to lower rates anytime soon.
Meanwhile, geopolitical events have sharply raised investor uncertainty. Conflicts in the Middle East may have unforeseen impacts on the global economy, while the war in Ukraine has been ongoing for more than 600 days with no clear end in sight.
A properly diversified portfolio together with a long-term approach may help investors weather economic and geopolitical uncertainties. Our suite of investment solutions seeks to provide investors with ability to build durable portfolios that meet their financial goals.
Sincerely,
Brian S. Shlissel
President, J.P. Morgan Funds
J.P. Morgan Asset Management
1-800-480-4111 or www.jpmorganfunds.com for more information
| JPMorgan Institutional Trust Funds | |
JPMorgan Institutional Trust Funds
MARKET OVERVIEW
SIX MONTHS ENDED August 31, 2023 (Unaudited)
While global bond markets largely generated positive returns for the six-month period, fixed-income investment generally underperformed equity amid rising interest rates and continued economic expansion. Within bond markets, yields on sovereign debt rose and the difference between yields on U.S. Treasury bonds and other fixed income securities narrowed.
For the six months ended August 31, 2023, the Bloomberg U.S. Aggregate Index returned 0.95%, the Bloomberg U.S. High Yield Index returned 4.54% and the Bloomberg Emerging Markets Debt Index returned 2.34%.
Leading central banks continued to raise interest rates throughout the period as inflation remained elevated across most developed market economies. However, data showed inflation in the U.S. receding faster than most economists had expected in the first half of 2023, and spending by both consumers and businesses generally remained buoyant during the period. Aggregate corporate earnings were generally better than analysts expected, given slower economic growth.
Within fixed income markets, the positive economic data and expectation for further interest rate increases led to higher bond yields during the period, particularly for sovereign debt. By the end of August 2023, developed market government bond yields reached their highest levels since. Broadly, high yield bonds (also known as junk bonds) outperformed investment grade bonds and lower-rated investment grade bonds generally outperformed higher quality bond.
The period was bracketed by two events that increased financial market volatility. In March 2023, the financials sector was roiled by the failures of Silicon Valley Bank and First Republic Bank in the U.S., and Credit Suisse Group AG in Switzerland. However, in each case government regulators moved to prevent further contagion among with banking industry. In early August 2023, Fitch Ratings Inc. downgraded U.S. sovereign debt, citing rising government spending and political uncertainty surrounding the ability of Congress to lift the U.S. debt ceiling.
| JPMorgan Institutional Trust Funds | |
FUND COMMENTARY
SIX MONTHS ENDED August 31, 2023 (Unaudited)
| |
| |
Bloomberg U.S. Aggregate Index | |
Net Assets as of 8/31/2023 (In Thousands) | |
| |
INVESTMENT OBJECTIVE**
The JPMorgan Core Bond Trust (the “Fund”) seeks to maximize total return by investing primarily in a diversified portfolio of intermediate- and long-term debt securities.
WHAT WERE THE MAIN DRIVERS OF THE FUND’S PERFORMANCE?
For the six months ended August 31, 2023, the Fund underperformed the Bloomberg U.S. Aggregate Index (the “Benchmark”).
Relative to the Benchmark, the Fund’s longer overall duration and its overweight allocation to commercial mortgage-backed securities were leading detractors from performance. Generally, bonds of longer duration will experience a greater decline in price compared with short duration bonds when interest rates rise. The Fund’s security selection in non-agency mortgage-backed securities and asset-backed securities were leading contributors to relative performance. Within corporate bonds, the Fund’s underweight position in regional banks also contributed to performance.
HOW WAS THE FUND POSITIONED?
The Fund’s portfolio managers continued to focus on security selection and relative value, which seeks to exploit pricing discrepancies between individual securities or market sectors.
The portfolio managers used bottom-up fundamental research to construct, in their view, a portfolio of undervalued fixed income securities. At the end of the period, the Fund was underweight in U.S. Treasury securities and overweight in commercial mortgage-backed securities and agency mortgages.
PORTFOLIO COMPOSITION BY ASSET CLASS
AS OF August 31, 2023 | PERCENT OF
TOTAL
INVESTMENTS |
U.S. Treasury Obligations | |
| |
Mortgage-Backed Securities | |
| |
Collateralized Mortgage Obligations | |
Commercial Mortgage-Backed Securities | |
Others (each less than 1.0%) | |
| |
*
The return shown is based on net asset values calculated for shareholder transactions and may differ from the return shown in the financial highlights, which reflects adjustments made to the net asset values in accordance with accounting principles generally accepted in the United States of America.
**
The adviser seeks to achieve the Fund’s objective. There can be no guarantee it will be achieved.
| JPMorgan Institutional Trust Funds | |
FUND COMMENTARY
SIX MONTHS ENDED August 31, 2023 (Unaudited) (continued)
AVERAGE ANNUAL TOTAL RETURNS AS OF August 31, 2023
TEN YEAR FUND PERFORMANCE (8/31/13 TO 8/31/23)

The performance quoted is past performance and is not a guarantee of future results. Mutual funds are subject to certain market risks. Investment returns and principal value of an investment will fluctuate so that an investor’s shares, when redeemed, may be worth more or less than their original cost. Current performance may be higher or lower than the performance data shown. Updated performance information is available by calling 1-800-480-7722.
The graph illustrates comparative performance for $10,000,000 invested in the JPMorgan Core Bond Trust and the Bloomberg U.S. Aggregate Index from August 31, 2013 to August 31, 2023. The performance of the Fund assumes reinvestment of all dividends and capital gain distributions, if any, and does not include a sales charge. The performance of the Bloomberg U.S. Aggregate Index does not reflect the deduction of expenses associated with a mutual fund and has been adjusted to reflect reinvestment of all dividends and capital gain distributions of the securities included in the benchmark, if applicable. The Bloomberg U.S. Aggregate Index is an unmanaged index that represents securities that are SEC-registered, taxable, and dollar denominated. The index
covers the U.S. investment grade fixed rate bond market, with index components for government and corporate securities, mortgage pass-through securities, and asset-backed securities. Investors cannot invest directly in an index.
The Fund’s shares have a $10,000,000 minimum investment.
Fund performance may reflect the waiver of the Fund’s fees and reimbursement of expenses for certain periods. Without these waivers and reimbursements, performance would have been lower. Also, performance shown in this section does not reflect the deduction of taxes that a shareholder would pay on Fund distributions or on gains resulting from redemptions of Fund shares.
The returns shown are based on net asset values calculated for shareholder transactions and may differ from the returns shown in the financial highlights, which reflect adjustments made to the net asset values in accordance with accounting principles generally accepted in the United States of America.
| JPMorgan Institutional Trust Funds | |
JPMorgan Intermediate Bond Trust
FUND COMMENTARY
SIX MONTHS ENDED August 31, 2023 (Unaudited)
| |
| |
Bloomberg Intermediate U.S. Government/Credit Index | |
Net Assets as of 8/31/2023 (In Thousands) | |
| |
INVESTMENT OBJECTIVE**
The JPMorgan Intermediate Bond Trust (the “Fund”) seeks current income consistent with the preservation of capital by investing in high- and medium-grade fixed income securities with intermediate maturities.
WHAT WERE THE MAIN DRIVERS OF THE FUND’S PERFORMANCE?
For the six months ended August 31, 2023, the Fund underperformed the Bloomberg Intermediate U.S. Government/Credit Index (the “Benchmark”).
Relative to the Benchmark, the Fund’s longer overall duration and its overweight allocation to the 10-years and longer part of the yield curve were leading detractors from performance. Generally, bonds of longer duration will experience a greater decline in price compared with shorter duration bonds when interest rates rise. The yield curve shows the relationship between yields and maturity dates for a set of similar bonds at a given point in time. The Fund’s out-of-Benchmark position in commercial mortgage-backed securities also detracted from relative performance.
The Fund’s underweight allocation to U.S. Treasury bonds and its out-of-Benchmark positions in non-agency mortgage-backed securities and asset-backed securities were leading contributors to performance relative to the Benchmark.
HOW WAS THE FUND POSITIONED?
The Fund continued to focus on security selection and relative value, which seeks to exploit pricing discrepancies between individual securities or market sectors. The Fund’s portfolio managers used bottom-up fundamental research to construct, in their view, a portfolio of undervalued fixed income securities.
PORTFOLIO COMPOSITION BY ASSET CLASS
AS OF August 31, 2023 | PERCENT OF
TOTAL
INVESTMENTS |
U.S. Treasury Obligations | |
| |
Collateralized Mortgage Obligations | |
Mortgage-Backed Securities | |
| |
Commercial Mortgage-Backed Securities | |
Others (each less than 1.0%) | |
| |
*
The return shown is based on net asset values calculated for shareholder transactions and may differ from the return shown in the financial highlights, which reflects adjustments made to the net asset values in accordance with accounting principles generally accepted in the United States of America.
**
The adviser seeks to achieve the Fund’s objective. There can be no guarantee it will be achieved.
| JPMorgan Institutional Trust Funds | |
JPMorgan Intermediate Bond Trust
FUND COMMENTARY
SIX MONTHS ENDED August 31, 2023 (Unaudited) (continued)
AVERAGE ANNUAL TOTAL RETURNS AS OF August 31, 2023
TEN YEAR FUND PERFORMANCE (8/31/13 TO 8/31/23)
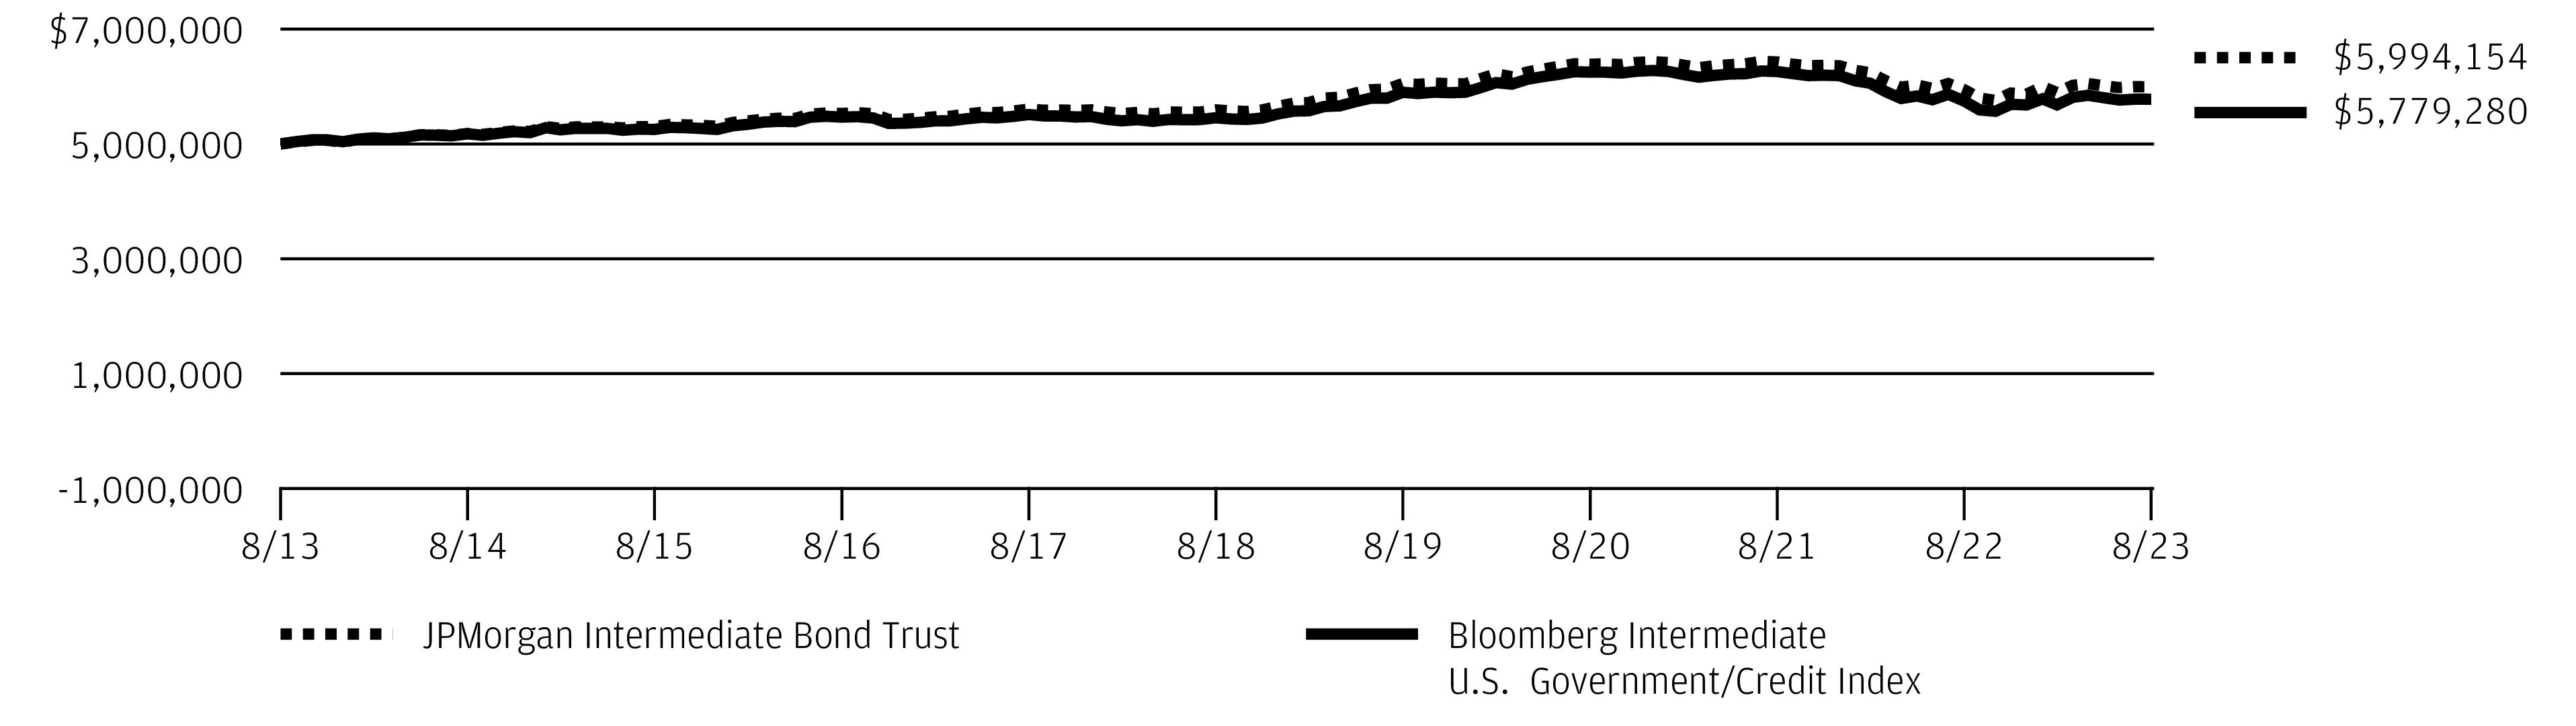
The performance quoted is past performance and is not a guarantee of future results. Mutual funds are subject to certain market risks. Investment returns and principal value of an investment will fluctuate so that an investor’s shares, when redeemed, may be worth more or less than their original cost. Current performance may be higher or lower than the performance data shown. Updated performance information is available by calling 1-800-480-7722.
The graph illustrates comparative performance for $5,000,000 invested in the JPMorgan Intermediate Bond Trust and the Bloomberg Intermediate U.S. Government/Credit Index from August 31, 2013 to August 31, 2023. The performance of the Fund assumes reinvestment of all dividends and capital gain distributions, if any, and does not include a sales charge. The performance of the Bloomberg Intermediate U.S. Government/Credit Index does not reflect the deduction of expenses associated with a mutual fund and has been adjusted to reflect reinvestment of all dividends and capital gain distributions of the securities included in the benchmark, if applicable. The Bloomberg
Intermediate U.S. Government/Credit Index is an unmanaged index comprised of intermediate maturity U.S. Treasury and agency securities and investment grade corporate securities. Investors cannot invest directly in an index.
The Fund’s shares have a $5,000,000 minimum investment.
Fund performance may reflect the waiver of the Fund’s fees and reimbursement of expenses for certain periods. Without these waivers and reimbursements, performance would have been lower. Also, performance shown in this section does not reflect the deduction of taxes that a shareholder would pay on Fund distributions or on gains resulting from redemptions of Fund shares.
The returns shown are based on net asset values calculated for shareholder transactions and may differ from the returns shown in the financial highlights, which reflect adjustments made to the net asset values in accordance with accounting principles generally accepted in the United States of America.
| JPMorgan Institutional Trust Funds | |
SCHEDULE OF PORTFOLIO INVESTMENTS
AS OF August 31, 2023 (Unaudited)
| | |
U.S. Treasury Obligations — 26.8% |
| | |
| | |
| | |
| | |
| | |
| | |
| | |
| | |
| | |
| | |
| | |
| | |
| | |
| | |
| | |
| | |
| | |
| | |
| | |
| | |
| | |
| | |
| | |
| | |
| | |
| | |
| | |
| | |
| | |
U.S. Treasury Inflation Indexed Bonds | | |
| | |
| | |
| | |
| | |
| | |
| | |
| | |
| | |
| | |
| | |
| | |
| | |
| | |
| | |
| | |
| | |
|
| | |
| | |
| | |
| | |
| | |
| | |
| | |
| | |
| | |
| | |
| | |
| | |
| | |
| | |
U.S. Treasury STRIPS Bonds | | |
| | |
| | |
| | |
| | |
Total U.S. Treasury Obligations
(Cost $652,663) | | |
|
Aerospace & Defense — 0.7% |
Airbus SE (France) 3.95%, 4/10/2047 (b) | | |
BAE Systems plc (United Kingdom) | | |
| | |
| | |
| | |
| | |
| | |
| | |
| | |
| | |
| | |
| | |
| | |
L3Harris Technologies, Inc. 5.40%, 7/31/2033 | | |
| | |
| | |
| | |
| | |
| | |
| | |
SEE NOTES TO FINANCIAL STATEMENTS.
| JPMorgan Institutional Trust Funds | |
SCHEDULE OF PORTFOLIO INVESTMENTS
AS OF August 31, 2023 (Unaudited) (continued)
| | |
Corporate Bonds — continued |
Aerospace & Defense — continued |
| | |
| | |
| | |
Automobile Components — 0.0% ^ |
Lear Corp. 2.60%, 1/15/2032 | | |
|
| | |
| | |
| | |
| | |
| | |
| | |
| | |
Stellantis Finance US, Inc. 2.69%, 9/15/2031 (b) | | |
Volkswagen Group of America Finance LLC (Germany) 1.63%, 11/24/2027 (b) | | |
| | |
|
ABN AMRO Bank NV (Netherlands) (US Treasury Yield Curve Rate T Note Constant Maturity 1 Year + 1.10%), 2.47%, 12/13/2029 (b) (c) | | |
AIB Group plc (Ireland) (SOFR + 3.46%), 7.58%, 10/14/2026 (b) (c) | | |
ANZ New Zealand Int'l Ltd. (New Zealand) | | |
| | |
| | |
Australia & New Zealand Banking Group Ltd. (Australia) 4.40%, 5/19/2026 (b) (d) | | |
Banco Nacional de Panama (Panama) 2.50%, 8/11/2030 (b) | | |
Banco Santander SA (Spain) | | |
| | |
| | |
(US Treasury Yield Curve Rate T Note Constant Maturity 1 Year + 0.90%), 1.72%, 9/14/2027 (c) | | |
| | |
| | |
(3-MONTH CME TERM SOFR + 1.77%), 3.71%, 4/24/2028 (c) | | |
(SOFR + 1.58%), 4.38%, 4/27/2028 (c) | | |
(3-MONTH CME TERM SOFR + 1.30%), 3.42%, 12/20/2028 (c) | | |
(SOFR + 1.63%), 5.20%, 4/25/2029 (c) | | |
| | |
|
|
(SOFR + 2.15%), 2.59%, 4/29/2031 (c) | | |
(SOFR + 1.21%), 2.57%, 10/20/2032 (c) | | |
(SOFR + 1.33%), 2.97%, 2/4/2033 (c) | | |
(SOFR + 1.91%), 5.29%, 4/25/2034 (c) | | |
(SOFR + 1.93%), 2.68%, 6/19/2041 (c) | | |
Bank of Ireland Group plc (Ireland) | | |
(US Treasury Yield Curve Rate T Note Constant Maturity 1 Year + 2.65%), 6.25%, 9/16/2026 (b) (c) | | |
(US Treasury Yield Curve Rate T Note Constant Maturity 1 Year + 1.10%), 2.03%, 9/30/2027 (b) (c) | | |
Bank of Nova Scotia (The) (Canada) 4.85%, 2/1/2030 | | |
Banque Federative du Credit Mutuel SA (France) | | |
| | |
| | |
| | |
Barclays plc (United Kingdom) | | |
(US Treasury Yield Curve Rate T Note Constant Maturity 1 Year + 0.80%), 1.01%, 12/10/2024 (c) | | |
(US Treasury Yield Curve Rate T Note Constant Maturity 1 Year + 1.30%), 2.89%, 11/24/2032 (c) | | |
| | |
(SOFR + 2.07%), 2.22%, 6/9/2026 (b) (c) | | |
(SOFR + 1.00%), 1.32%, 1/13/2027 (b) (c) | | |
(SOFR + 1.56%), 3.13%, 1/20/2033 (b) (c) | | |
| | |
| | |
| | |
(SOFR + 1.52%), 1.65%, 10/6/2026 (b) (c) | | |
| | |
(SOFR + 1.31%), 2.28%, 1/20/2032 (b) (c) | | |
(SOFR + 1.73%), 3.12%, 10/19/2032 (b) (c) | | |
| | |
| | |
| | |
| | |
(3-MONTH CME TERM SOFR + 1.65%), 3.67%, 7/24/2028 (c) | | |
(SOFR + 1.18%), 2.52%, 11/3/2032 (c) | | |
(SOFR + 1.35%), 3.06%, 1/25/2033 (c) | | |
(SOFR + 1.38%), 2.90%, 11/3/2042 (c) | | |
SEE NOTES TO FINANCIAL STATEMENTS.
| JPMorgan Institutional Trust Funds | |
| | |
Corporate Bonds — continued |
|
Commonwealth Bank of Australia (Australia) 3.31%, 3/11/2041 (b) (d) | | |
Cooperatieve Rabobank UA (Netherlands) | | |
| | |
| | |
Credit Agricole SA (France) | | |
| | |
(SOFR + 1.68%), 1.91%, 6/16/2026 (b) (c) | | |
(SOFR + 0.89%), 1.25%, 1/26/2027 (b) (c) | | |
| | |
Danske Bank A/S (Denmark) (US Treasury Yield Curve Rate T Note Constant Maturity 1 Year + 2.10%), 6.47%, 1/9/2026 (b) (c) | | |
Discover Bank 4.25%, 3/13/2026 | | |
Federation des Caisses Desjardins du Quebec (Canada) 5.70%, 3/14/2028 (b) | | |
HSBC Holdings plc (United Kingdom) | | |
| | |
(3-MONTH CME TERM SOFR + 1.61%), 4.29%, 9/12/2026 (c) | | |
(SOFR + 1.29%), 1.59%, 5/24/2027 (c) | | |
(3-MONTH CME TERM SOFR + 1.81%), 4.04%, 3/13/2028 (c) | | |
(SOFR + 1.73%), 2.01%, 9/22/2028 (c) | | |
(SOFR + 3.35%), 7.39%, 11/3/2028 (c) | | |
(SOFR + 1.29%), 2.21%, 8/17/2029 (c) | | |
(SOFR + 1.95%), 2.36%, 8/18/2031 (c) | | |
| | |
ING Groep NV (Netherlands) (SOFR + 1.01%), 1.73%, 4/1/2027 (c) | | |
Lloyds Banking Group plc (United Kingdom) | | |
| | |
(US Treasury Yield Curve Rate T Note Constant Maturity 1 Year + 1.60%), 3.51%, 3/18/2026 (c) | | |
(US Treasury Yield Curve Rate T Note Constant Maturity 1 Year + 0.85%), 1.63%, 5/11/2027 (c) | | |
| | |
Mitsubishi UFJ Financial Group, Inc. (Japan) | | |
(US Treasury Yield Curve Rate T Note Constant Maturity 1 Year + 0.75%), 1.54%, 7/20/2027 (c) | | |
(US Treasury Yield Curve Rate T Note Constant Maturity 1 Year + 1.70%), 5.24%, 4/19/2029 (c) | | |
| | |
|
|
(US Treasury Yield Curve Rate T Note Constant Maturity 1 Year + 1.63%), 5.44%, 2/22/2034 (c) | | |
| | |
Mizuho Financial Group, Inc. (Japan) | | |
(3-MONTH CME TERM SOFR + 1.09%), 2.23%, 5/25/2026 (c) | | |
(US Treasury Yield Curve Rate T Note Constant Maturity 1 Year + 0.67%), 1.23%, 5/22/2027 (c) | | |
(US Treasury Yield Curve Rate T Note Constant Maturity 1 Year + 1.65%), 5.78%, 7/6/2029 (c) | | |
(3-MONTH CME TERM SOFR + 1.57%), 2.87%, 9/13/2030 (c) | | |
National Australia Bank Ltd. (Australia) (US Treasury Yield Curve Rate T Note Constant Maturity 5 Year + 1.88%), 3.93%, 8/2/2034 (b) (c) (d) | | |
NatWest Group plc (United Kingdom) | | |
(ICE LIBOR USD 3 Month + 1.76%), 4.27%, 3/22/2025 (c) | | |
| | |
(US Treasury Yield Curve Rate T Note Constant Maturity 1 Year + 2.85%), 7.47%, 11/10/2026 (c) | | |
(ICE LIBOR USD 3 Month + 1.75%), 4.89%, 5/18/2029 (c) | | |
(US Treasury Yield Curve Rate T Note Constant Maturity 5 Year + 2.10%), 3.75%, 11/1/2029 (c) | | |
(ICE LIBOR USD 3 Month + 1.87%), 4.45%, 5/8/2030 (c) | | |
(US Treasury Yield Curve Rate T Note Constant Maturity 1 Year + 2.10%), 6.02%, 3/2/2034 (c) | | |
NatWest Markets plc (United Kingdom) 1.60%, 9/29/2026 (b) | | |
Nordea Bank Abp (Finland) 5.38%, 9/22/2027 (b) | | |
Santander UK Group Holdings plc (United Kingdom) | | |
(SOFR + 2.75%), 6.83%, 11/21/2026 (c) | | |
(SOFR + 2.60%), 6.53%, 1/10/2029 (c) | | |
Societe Generale SA (France) | | |
| | |
(US Treasury Yield Curve Rate T Note Constant Maturity 1 Year + 1.10%), 1.49%, 12/14/2026 (b) (c) | | |
SEE NOTES TO FINANCIAL STATEMENTS.
| JPMorgan Institutional Trust Funds | |
SCHEDULE OF PORTFOLIO INVESTMENTS
AS OF August 31, 2023 (Unaudited) (continued)
| | |
Corporate Bonds — continued |
|
(US Treasury Yield Curve Rate T Note Constant Maturity 1 Year + 1.00%), 1.79%, 6/9/2027 (b) (c) | | |
| | |
(US Treasury Yield Curve Rate T Note Constant Maturity 1 Year + 1.30%), 2.89%, 6/9/2032 (b) (c) | | |
(US Treasury Yield Curve Rate T Note Constant Maturity 1 Year + 1.90%), 4.03%, 1/21/2043 (b) (c) | | |
Standard Chartered plc (United Kingdom) | | |
(ICE LIBOR USD 3 Month + 1.21%), 2.82%, 1/30/2026 (b) (c) | | |
(US Treasury Yield Curve Rate T Note Constant Maturity 1 Year + 1.00%), 1.46%, 1/14/2027 (b) (c) | | |
(USD ICE Swap Rate 5 Year + 1.97%), 4.87%, 3/15/2033 (b) (c) | | |
Sumitomo Mitsui Financial Group, Inc. (Japan) | | |
| | |
| | |
| | |
| | |
Toronto-Dominion Bank (The) (Canada) | | |
| | |
| | |
| | |
| | |
| | |
(SOFR + 2.05%), 6.05%, 6/8/2027 (c) | | |
(SOFR + 1.85%), 5.12%, 1/26/2034 (c) | | |
| | |
(US Treasury Yield Curve Rate T Note Constant Maturity 1 Year + 2.30%), 2.57%, 9/22/2026 (b) (c) | | |
(US Treasury Yield Curve Rate T Note Constant Maturity 1 Year + 1.20%), 1.98%, 6/3/2027 (b) (c) | | |
(USD ICE Swap Rate 5 Year + 3.70%), 5.86%, 6/19/2032 (b) (c) | | |
(USD ICE Swap Rate 5 Year + 4.91%), 7.30%, 4/2/2034 (b) (c) | | |
| | |
(SOFR + 1.74%), 5.57%, 7/25/2029 (c) | | |
(SOFR + 1.99%), 5.56%, 7/25/2034 (c) | | |
| | |
| | |
|
|
| | |
Wells Fargo Bank NA 5.45%, 8/7/2026 | | |
Westpac Banking Corp. (Australia) 3.13%, 11/18/2041 (d) | | |
| | |
|
Anheuser-Busch Cos. LLC (Belgium) 4.70%, 2/1/2036 | | |
Anheuser-Busch InBev Finance, Inc. (Belgium) 4.63%, 2/1/2044 | | |
Anheuser-Busch InBev Worldwide, Inc. (Belgium) 4.44%, 10/6/2048 | | |
Coca-Cola Femsa SAB de CV (Mexico) | | |
| | |
| | |
Constellation Brands, Inc. | | |
| | |
| | |
Molson Coors Beverage Co. 4.20%, 7/15/2046 | | |
| | |
|
| | |
| | |
| | |
| | |
| | |
| | |
| | |
| | |
| | |
| | |
Gilead Sciences, Inc. 2.60%, 10/1/2040 | | |
Regeneron Pharmaceuticals, Inc. 1.75%, 9/15/2030 | | |
| | |
Broadline Retail — 0.0% ^ |
Amazon.com, Inc. 3.88%, 8/22/2037 | | |
|
| | |
| | |
SEE NOTES TO FINANCIAL STATEMENTS.
| JPMorgan Institutional Trust Funds | |
| | |
Corporate Bonds — continued |
Building Products — continued |
| | |
Trane Technologies Financing Ltd. 5.25%, 3/3/2033 | | |
| | |
|
Blackstone Holdings Finance Co. LLC 4.45%, 7/15/2045 (b) | | |
Brookfield Finance, Inc. (Canada) | | |
| | |
| | |
| | |
Credit Suisse AG (Switzerland) | | |
| | |
| | |
| | |
Deutsche Bank AG (Germany) | | |
(SOFR + 2.16%), 2.22%, 9/18/2024 (c) | | |
(SOFR + 1.87%), 2.13%, 11/24/2026 (c) | | |
(SOFR + 2.52%), 7.15%, 7/13/2027 (c) | | |
(SOFR + 1.32%), 2.55%, 1/7/2028 (c) | | |
(SOFR + 3.18%), 6.72%, 1/18/2029 (c) | | |
FMR LLC 6.45%, 11/15/2039 (b) | | |
Goldman Sachs Group, Inc. (The) | | |
| | |
(SOFR + 1.08%), 5.80%, 8/10/2026 (c) | | |
| | |
(SOFR + 0.80%), 1.43%, 3/9/2027 (c) | | |
(SOFR + 0.91%), 1.95%, 10/21/2027 (c) | | |
(SOFR + 1.11%), 2.64%, 2/24/2028 (c) | | |
(SOFR + 1.09%), 1.99%, 1/27/2032 (c) | | |
(SOFR + 1.28%), 2.62%, 4/22/2032 (c) | | |
(SOFR + 1.25%), 2.38%, 7/21/2032 (c) | | |
| | |
Jefferies Financial Group, Inc. 6.45%, 6/8/2027 | | |
Macquarie Bank Ltd. (Australia) (US Treasury Yield Curve Rate T Note Constant Maturity 5 Year + 1.70%), 3.05%, 3/3/2036 (b) (c) (d) | | |
Macquarie Group Ltd. (Australia) | | |
(SOFR + 1.07%), 1.34%, 1/12/2027 (b) (c) | | |
(ICE LIBOR USD 3 Month + 1.75%), 5.03%, 1/15/2030 (b) (c) | | |
| | |
| | |
(SOFR + 1.59%), 5.16%, 4/20/2029 (c) | | |
| | |
|
Capital Markets — continued |
(SOFR + 1.63%), 5.45%, 7/20/2029 (c) | | |
(SOFR + 1.03%), 1.79%, 2/13/2032 (c) | | |
(SOFR + 1.88%), 5.42%, 7/21/2034 (c) | | |
(3-MONTH CME TERM SOFR + 1.69%), 4.46%, 4/22/2039 (c) | | |
| | |
Nasdaq, Inc. 5.55%, 2/15/2034 | | |
Nomura Holdings, Inc. (Japan) | | |
| | |
| | |
UBS Group AG (Switzerland) | | |
(SOFR + 1.56%), 2.59%, 9/11/2025 (b) (c) | | |
(SOFR + 2.04%), 2.19%, 6/5/2026 (b) (c) | | |
(SOFR + 3.34%), 6.37%, 7/15/2026 (b) (c) | | |
| | |
(ICE LIBOR USD 3 Month + 1.41%), 3.87%, 1/12/2029 (b) (c) | | |
| | |
|
Albemarle Corp. 5.45%, 12/1/2044 | | |
DuPont de Nemours, Inc. 5.32%, 11/15/2038 | | |
International Flavors & Fragrances, Inc. 5.00%, 9/26/2048 | | |
| | |
| | |
| | |
| | |
Union Carbide Corp. 7.75%, 10/1/2096 | | |
| | |
Commercial Services & Supplies — 0.0% ^ |
Ford Foundation (The) Series 2020, 2.82%, 6/1/2070 | | |
Construction & Engineering — 0.1% |
| | |
| | |
| | |
| | |
Construction Materials — 0.1% |
CRH America, Inc. (Ireland) | | |
| | |
SEE NOTES TO FINANCIAL STATEMENTS.
| JPMorgan Institutional Trust Funds | |
SCHEDULE OF PORTFOLIO INVESTMENTS
AS OF August 31, 2023 (Unaudited) (continued)
| | |
Corporate Bonds — continued |
Construction Materials — continued |
| | |
Martin Marietta Materials, Inc. 3.45%, 6/1/2027 | | |
| | |
|
AerCap Ireland Capital DAC (Ireland) | | |
| | |
| | |
| | |
| | |
| | |
| | |
American Express Co. 5.85%, 11/5/2027 | | |
Avolon Holdings Funding Ltd. (Ireland) | | |
| | |
| | |
| | |
| | |
| | |
| | |
| | |
Capital One Financial Corp. | | |
| | |
(SOFR + 2.64%), 6.31%, 6/8/2029 (c) | | |
(SOFR + 1.27%), 2.62%, 11/2/2032 (c) | | |
General Motors Financial Co., Inc. | | |
| | |
| | |
| | |
| | |
| | |
Park Aerospace Holdings Ltd. (Ireland) 5.50%, 2/15/2024 (b) | | |
| | |
Consumer Staples Distribution & Retail — 0.2% |
| | |
| | |
| | |
Alimentation Couche-Tard, Inc. (Canada) 3.63%, 5/13/2051 (b) | | |
| | |
| | |
| | |
|
Consumer Staples Distribution & Retail — continued |
Series 2013, 4.70%, 1/10/2036 (b) | | |
Kroger Co. (The) 5.00%, 4/15/2042 | | |
| | |
Containers & Packaging — 0.1% |
Graphic Packaging International LLC 1.51%, 4/15/2026 (b) | | |
Packaging Corp. of America 4.05%, 12/15/2049 | | |
| | |
| | |
| | |
| | |
Diversified Consumer Services — 0.1% |
Pepperdine University Series 2020, 3.30%, 12/1/2059 | | |
University of Miami Series 2022, 4.06%, 4/1/2052 | | |
University of Southern California Series A, 3.23%, 10/1/2120 | | |
| | |
|
Safehold GL Holdings LLC 2.80%, 6/15/2031 | | |
| | |
| | |
| | |
| | |
Diversified Telecommunication Services — 0.4% |
| | |
| | |
| | |
| | |
| | |
Deutsche Telekom AG (Germany) 3.63%, 1/21/2050 (b) | | |
Deutsche Telekom International Finance BV (Germany) 4.88%, 3/6/2042 (b) | | |
Sprint Capital Corp. 6.88%, 11/15/2028 | | |
Verizon Communications, Inc. | | |
| | |
| | |
| | |
| | |
SEE NOTES TO FINANCIAL STATEMENTS.
| JPMorgan Institutional Trust Funds | |
| | |
Corporate Bonds — continued |
Electric Utilities — 2.3% |
Alabama Power Co. 6.13%, 5/15/2038 | | |
Arizona Public Service Co. 5.05%, 9/1/2041 | | |
Baltimore Gas and Electric Co. | | |
| | |
| | |
Duke Energy Carolinas LLC 4.25%, 12/15/2041 | | |
Duke Energy Corp. 3.75%, 9/1/2046 | | |
Duke Energy Florida LLC 5.95%, 11/15/2052 | | |
| | |
| | |
| | |
| | |
Duquesne Light Holdings, Inc. 3.62%, 8/1/2027 (b) | | |
Edison International 6.95%, 11/15/2029 | | |
Emera US Finance LP (Canada) 4.75%, 6/15/2046 | | |
Entergy Arkansas LLC 2.65%, 6/15/2051 | | |
Entergy Corp. 2.95%, 9/1/2026 | | |
| | |
| | |
| | |
Entergy Texas, Inc. 5.80%, 9/1/2053 | | |
Evergy Metro, Inc. 5.30%, 10/1/2041 | | |
Evergy, Inc. 2.90%, 9/15/2029 | | |
Exelon Corp. 5.30%, 3/15/2033 | | |
Fells Point Funding Trust 3.05%, 1/31/2027 (b) | | |
FirstEnergy Transmission LLC 4.55%, 4/1/2049 (b) | | |
Fortis, Inc. (Canada) 3.06%, 10/4/2026 | | |
| | |
| | |
| | |
Jersey Central Power & Light Co. 4.30%, 1/15/2026 (b) | | |
Mid-Atlantic Interstate Transmission LLC 4.10%, 5/15/2028 (b) | | |
| | |
Series N, 6.65%, 4/1/2036 | | |
| | |
NextEra Energy Capital Holdings, Inc. 5.75%, 9/1/2025 | | |
Niagara Mohawk Power Corp. | | |
| | |
| | |
| | |
|
Electric Utilities — continued |
| | |
| | |
| | |
| | |
Oncor Electric Delivery Co. LLC 5.75%, 3/15/2029 | | |
Pacific Gas and Electric Co. | | |
| | |
| | |
| | |
| | |
| | |
| | |
PacifiCorp 5.50%, 5/15/2054 | | |
PECO Energy Co. 2.80%, 6/15/2050 | | |
Pennsylvania Electric Co. 3.25%, 3/15/2028 (b) | | |
Pepco Holdings LLC 7.45%, 8/15/2032 | | |
PG&E Recovery Funding LLC Series A-3, 5.54%, 7/15/2047 | | |
PG&E Wildfire Recovery Funding LLC | | |
Series A-2, 4.26%, 6/1/2036 | | |
Series A-4, 5.21%, 12/1/2047 | | |
Series A-5, 5.10%, 6/1/2052 | | |
Potomac Electric Power Co. 6.50%, 11/15/2037 | | |
PPL Electric Utilities Corp. 5.25%, 5/15/2053 | | |
Progress Energy, Inc. 7.00%, 10/30/2031 | | |
Public Service Co. of Colorado 3.55%, 6/15/2046 | | |
Public Service Co. of Oklahoma | | |
| | |
Series G, 6.63%, 11/15/2037 | | |
Public Service Electric and Gas Co. 5.38%, 11/1/2039 | | |
| | |
Series A-1, 4.70%, 6/15/2040 | | |
Series A-2, 5.11%, 12/15/2047 | | |
Sigeco Securitization I LLC | | |
Series A1, 5.03%, 11/15/2036 | | |
Series A2, 5.17%, 5/15/2041 | | |
Southern California Edison Co. | | |
| | |
Series B, 3.65%, 3/1/2028 | | |
Series 08-A, 5.95%, 2/1/2038 | | |
| | |
| | |
SEE NOTES TO FINANCIAL STATEMENTS.
| JPMorgan Institutional Trust Funds | |
SCHEDULE OF PORTFOLIO INVESTMENTS
AS OF August 31, 2023 (Unaudited) (continued)
| | |
Corporate Bonds — continued |
Electric Utilities — continued |
Southwestern Public Service Co. 4.50%, 8/15/2041 | | |
Toledo Edison Co. (The) 6.15%, 5/15/2037 | | |
Virginia Electric and Power Co. 5.70%, 8/15/2053 | | |
| | |
Electrical Equipment — 0.0% ^ |
Eaton Corp. 4.15%, 3/15/2033 | | |
Electronic Equipment, Instruments & Components — 0.1% |
| | |
| | |
| | |
Corning, Inc. 3.90%, 11/15/2049 | | |
| | |
Energy Equipment & Services — 0.1% |
Halliburton Co. 4.75%, 8/1/2043 | | |
Schlumberger Holdings Corp. 3.90%, 5/17/2028 (b) | | |
| | |
|
Activision Blizzard, Inc. 1.35%, 9/15/2030 | | |
Walt Disney Co. (The) 6.20%, 12/15/2034 | | |
| | |
Financial Services — 0.2% |
Corebridge Financial, Inc. | | |
| | |
| | |
| | |
| | |
| | |
| | |
| | |
| | |
| | |
| | |
Nationwide Building Society (United Kingdom) 1.50%, 10/13/2026 (b) | | |
Siemens Financieringsmaatschappij NV (Germany) 4.40%, 5/27/2045 (b) | | |
| | |
|
Bunge Ltd. Finance Corp. 2.75%, 5/14/2031 | | |
| | |
|
Food Products — continued |
Campbell Soup Co. 3.13%, 4/24/2050 | | |
Conagra Brands, Inc. 5.30%, 11/1/2038 | | |
Kellogg Co. 5.25%, 3/1/2033 | | |
| | |
| | |
| | |
Smithfield Foods, Inc. 3.00%, 10/15/2030 (b) | | |
| | |
|
| | |
| | |
| | |
Boston Gas Co. 4.49%, 2/15/2042 (b) | | |
Brooklyn Union Gas Co. (The) 4.27%, 3/15/2048 (b) | | |
Southern California Gas Co. 6.35%, 11/15/2052 | | |
Southern Natural Gas Co. LLC | | |
| | |
| | |
| | |
Ground Transportation — 0.3% |
Burlington Northern Santa Fe LLC | | |
| | |
| | |
| | |
| | |
Canadian Pacific Railway Co. (Canada) 4.70%, 5/1/2048 | | |
| | |
| | |
| | |
Norfolk Southern Corp. 4.05%, 8/15/2052 | | |
Penske Truck Leasing Co. LP 6.05%, 8/1/2028 (b) | | |
Triton Container International Ltd. (Bermuda) 1.15%, 6/7/2024 (b) | | |
| | |
Health Care Equipment & Supplies — 0.1% |
Abbott Laboratories 4.75%, 11/30/2036 | | |
Becton Dickinson & Co. 4.67%, 6/6/2047 | | |
Boston Scientific Corp. 6.50%, 11/15/2035 (e) | | |
DH Europe Finance II SARL 3.25%, 11/15/2039 | | |
| | |
SEE NOTES TO FINANCIAL STATEMENTS.
| JPMorgan Institutional Trust Funds | |
| | |
Corporate Bonds — continued |
Health Care Providers & Services — 0.8% |
Advocate Health & Hospitals Corp. Series 2020, 2.21%, 6/15/2030 | | |
Aetna, Inc. 6.75%, 12/15/2037 | | |
Ascension Health Series B, 2.53%, 11/15/2029 | | |
Bon Secours Mercy Health, Inc. Series 20-2, 3.21%, 6/1/2050 | | |
Children's Hospital Series 2020, 2.93%, 7/15/2050 | | |
Children's Hospital Corp. (The) Series 2020, 2.59%, 2/1/2050 | | |
| | |
| | |
| | |
| | |
| | |
| | |
| | |
| | |
| | |
| | |
| | |
| | |
Hackensack Meridian Health, Inc. Series 2020, 2.68%, 9/1/2041 | | |
| | |
| | |
| | |
| | |
| | |
Mayo Clinic Series 2016, 4.13%, 11/15/2052 | | |
Memorial Health Services 3.45%, 11/1/2049 | | |
Memorial Sloan-Kettering Cancer Center Series 2015, 4.20%, 7/1/2055 | | |
MyMichigan Health Series 2020, 3.41%, 6/1/2050 | | |
Texas Health Resources 4.33%, 11/15/2055 | | |
| | |
| | |
| | |
| | |
Yale-New Haven Health Services Corp. Series 2020, 2.50%, 7/1/2050 | | |
| | |
| | |
|
|
Healthcare Realty Holdings LP | | |
| | |
| | |
| | |
| | |
| | |
Physicians Realty LP 2.63%, 11/1/2031 | | |
Sabra Health Care LP 3.20%, 12/1/2031 | | |
| | |
| | |
| | |
| | |
| | |
Welltower OP LLC 6.50%, 3/15/2041 | | |
| | |
Hotels, Restaurants & Leisure — 0.1% |
| | |
| | |
| | |
| | |
Household Durables — 0.0% ^ |
MDC Holdings, Inc. 3.97%, 8/6/2061 | | |
Independent Power and Renewable Electricity Producers — 0.2% |
Alexander Funding Trust 1.84%, 11/15/2023 (b) | | |
Alexander Funding Trust II 7.47%, 7/31/2028 (b) | | |
Constellation Energy Generation LLC | | |
| | |
| | |
| | |
Industrial REITs — 0.0% ^ |
| | |
| | |
| | |
| | |
|
AIA Group Ltd. (Hong Kong) | | |
| | |
| | |
AIG SunAmerica Global Financing X 6.90%, 3/15/2032 (b) | | |
SEE NOTES TO FINANCIAL STATEMENTS.
| JPMorgan Institutional Trust Funds | |
SCHEDULE OF PORTFOLIO INVESTMENTS
AS OF August 31, 2023 (Unaudited) (continued)
| | |
Corporate Bonds — continued |
|
| | |
| | |
| | |
| | |
Berkshire Hathaway Finance Corp. 3.85%, 3/15/2052 | | |
Brown & Brown, Inc. 2.38%, 3/15/2031 | | |
F&G Global Funding 1.75%, 6/30/2026 (b) | | |
Guardian Life Insurance Co. of America (The) 4.85%, 1/24/2077 (b) | | |
Hanover Insurance Group, Inc. (The) 2.50%, 9/1/2030 | | |
Hartford Financial Services Group, Inc. (The) 4.30%, 4/15/2043 | | |
Liberty Mutual Group, Inc. | | |
| | |
| | |
Liberty Mutual Insurance Co. 8.50%, 5/15/2025 (b) | | |
Northwestern Mutual Global Funding 1.70%, 6/1/2028 (b) | | |
Pacific Life Global Funding II 5.50%, 8/28/2026 (b) | | |
Pacific Life Insurance Co. (ICE LIBOR USD 3 Month + 2.80%), 4.30%, 10/24/2067 (b) (c) | | |
Pricoa Global Funding I 5.55%, 8/28/2026 (b) | | |
Prudential Financial, Inc. 3.91%, 12/7/2047 | | |
Prudential Insurance Co. of America (The) 8.30%, 7/1/2025 (b) | | |
Swiss Re Finance Luxembourg SA (Switzerland) (US Treasury Yield Curve Rate T Note Constant Maturity 5 Year + 3.58%), 5.00%, 4/2/2049 (b) (c) | | |
Teachers Insurance & Annuity Association of America 4.27%, 5/15/2047 (b) | | |
| | |
Interactive Media & Services — 0.1% |
Meta Platforms, Inc. 5.60%, 5/15/2053 | | |
|
| | |
| | |
| | |
| | |
| | |
|
|
nVent Finance SARL (United Kingdom) 4.55%, 4/15/2028 | | |
| | |
| | |
| | |
Parker-Hannifin Corp. 4.45%, 11/21/2044 | | |
| | |
|
Charter Communications Operating LLC | | |
| | |
| | |
| | |
| | |
| | |
| | |
| | |
| | |
| | |
| | |
| | |
Cox Communications, Inc. 2.95%, 10/1/2050 (b) | | |
Discovery Communications LLC | | |
| | |
| | |
| | |
| | |
| | |
Time Warner Cable Enterprises LLC 8.38%, 7/15/2033 | | |
| | |
| | |
| | |
| | |
|
Barrick Gold Corp. (Canada) 6.45%, 10/15/2035 | | |
Reliance Steel & Aluminum Co. 1.30%, 8/15/2025 | | |
Vale Overseas Ltd. (Brazil) 3.75%, 7/8/2030 | | |
| | |
|
CMS Energy Corp. 3.00%, 5/15/2026 | | |
Consolidated Edison Co. of New York, Inc. 6.15%, 11/15/2052 | | |
Delmarva Power & Light Co. 4.00%, 6/1/2042 | | |
SEE NOTES TO FINANCIAL STATEMENTS.
| JPMorgan Institutional Trust Funds | |
| | |
Corporate Bonds — continued |
Multi-Utilities — continued |
Dominion Energy, Inc. Series F, 5.25%, 8/1/2033 | | |
NiSource, Inc. 1.70%, 2/15/2031 | | |
San Diego Gas & Electric Co. | | |
| | |
| | |
Southern Co. Gas Capital Corp. | | |
| | |
Series 21A, 3.15%, 9/30/2051 | | |
| | |
|
Alexandria Real Estate Equities, Inc. | | |
| | |
| | |
| | |
Corporate Office Properties LP 2.00%, 1/15/2029 | | |
| | |
Oil, Gas & Consumable Fuels — 1.3% |
Aker BP ASA (Norway) 2.00%, 7/15/2026 (b) | | |
APA Infrastructure Ltd. (Australia) 4.25%, 7/15/2027 (b) | | |
BP Capital Markets America, Inc. 2.94%, 6/4/2051 | | |
Buckeye Partners LP 5.85%, 11/15/2043 | | |
Cameron LNG LLC 3.70%, 1/15/2039 (b) | | |
Coterra Energy, Inc. 3.90%, 5/15/2027 | | |
DT Midstream, Inc. 4.30%, 4/15/2032 (b) | | |
Eastern Gas Transmission & Storage, Inc. 3.90%, 11/15/2049 | | |
Ecopetrol SA (Colombia) 4.13%, 1/16/2025 | | |
Enbridge, Inc. (Canada) 5.70%, 3/8/2033 | | |
| | |
| | |
| | |
| | |
| | |
| | |
| | |
| | |
| | |
Eni SpA (Italy) 5.70%, 10/1/2040 (b) | | |
| | |
| | |
| | |
| | |
|
Oil, Gas & Consumable Fuels — continued |
Flex Intermediate Holdco LLC | | |
| | |
| | |
Galaxy Pipeline Assets Bidco Ltd. (United Arab Emirates) 2.94%, 9/30/2040 (b) | | |
Gray Oak Pipeline LLC 2.60%, 10/15/2025 (b) | | |
HF Sinclair Corp. 5.88%, 4/1/2026 | | |
Magellan Midstream Partners LP 3.20%, 3/15/2025 | | |
Marathon Petroleum Corp. 4.70%, 5/1/2025 | | |
| | |
ONEOK Partners LP 6.65%, 10/1/2036 | | |
| | |
| | |
| | |
Pioneer Natural Resources Co. 1.90%, 8/15/2030 | | |
Saudi Arabian Oil Co. (Saudi Arabia) 1.63%, 11/24/2025 (b) | | |
Suncor Energy, Inc. (Canada) 6.80%, 5/15/2038 | | |
TotalEnergies Capital International SA (France) | | |
| | |
| | |
| | |
| | |
| | |
| | |
| | |
Passenger Airlines — 0.1% |
Continental Airlines Pass-Through Trust Series 2012-2, Class A Shares, 4.00%, 10/29/2024 | | |
Personal Care Products — 0.0% ^ |
Haleon US Capital LLC 3.38%, 3/24/2029 | | |
|
AstraZeneca plc (United Kingdom) | | |
| | |
| | |
| | |
| | |
| | |
Mylan, Inc. 5.40%, 11/29/2043 | | |
Pfizer Investment Enterprises Pte. Ltd. 5.30%, 5/19/2053 | | |
Royalty Pharma plc 1.20%, 9/2/2025 | | |
SEE NOTES TO FINANCIAL STATEMENTS.
| JPMorgan Institutional Trust Funds | |
SCHEDULE OF PORTFOLIO INVESTMENTS
AS OF August 31, 2023 (Unaudited) (continued)
| | |
Corporate Bonds — continued |
Pharmaceuticals — continued |
Takeda Pharmaceutical Co. Ltd. (Japan) | | |
| | |
| | |
Viatris, Inc. 3.85%, 6/22/2040 | | |
Zoetis, Inc. 2.00%, 5/15/2030 | | |
| | |
|
Essex Portfolio LP 2.65%, 3/15/2032 | | |
Mid-America Apartments LP 3.95%, 3/15/2029 | | |
| | |
| | |
| | |
| | |
| | |
|
Brixmor Operating Partnership LP | | |
| | |
| | |
| | |
| | |
| | |
| | |
| | |
Realty Income Corp. 1.80%, 3/15/2033 | | |
Regency Centers LP 2.95%, 9/15/2029 | | |
Scentre Group Trust 1 (Australia) 3.50%, 2/12/2025 (b) | | |
Scentre Group Trust 2 (Australia) (US Treasury Yield Curve Rate T Note Constant Maturity 5 Year + 4.38%), 4.75%, 9/24/2080 (b) (c) | | |
SITE Centers Corp. 4.70%, 6/1/2027 | | |
| | |
Semiconductors & Semiconductor Equipment — 0.5% |
Analog Devices, Inc. 2.80%, 10/1/2041 | | |
| | |
| | |
| | |
| | |
| | |
| | |
KLA Corp. 3.30%, 3/1/2050 | | |
| | |
| | |
| | |
|
Semiconductors & Semiconductor Equipment — continued |
| | |
| | |
Texas Instruments, Inc. 5.05%, 5/18/2063 | | |
TSMC Global Ltd. (Taiwan) 4.63%, 7/22/2032 (b) | | |
Xilinx, Inc. 2.38%, 6/1/2030 | | |
| | |
|
| | |
| | |
| | |
| | |
| | |
| | |
| | |
| | |
VMware, Inc. 4.65%, 5/15/2027 | | |
| | |
|
| | |
| | |
| | |
| | |
| | |
| | |
| | |
| | |
| | |
Equinix, Inc. 2.90%, 11/18/2026 | | |
| | |
| | |
| | |
Public Storage Operating Co. | | |
| | |
| | |
| | |
|
AutoZone, Inc. 1.65%, 1/15/2031 | | |
Lowe's Cos., Inc. 2.63%, 4/1/2031 | | |
O'Reilly Automotive, Inc. 3.60%, 9/1/2027 | | |
| | |
SEE NOTES TO FINANCIAL STATEMENTS.
| JPMorgan Institutional Trust Funds | |
| | |
Corporate Bonds — continued |
Technology Hardware, Storage & Peripherals — 0.2% |
| | |
| | |
| | |
| | |
| | |
| | |
| | |
| | |
|
Altria Group, Inc. 2.45%, 2/4/2032 | | |
BAT Capital Corp. (United Kingdom) | | |
| | |
| | |
| | |
Reynolds American, Inc. (United Kingdom) 7.00%, 8/4/2041 | | |
| | |
Trading Companies & Distributors — 0.3% |
| | |
| | |
| | |
| | |
| | |
| | |
| | |
Aviation Capital Group LLC 5.50%, 12/15/2024 (b) | | |
| | |
|
American Water Capital Corp. 3.45%, 5/1/2050 | | |
Wireless Telecommunication Services — 0.3% |
Rogers Communications, Inc. (Canada) 4.55%, 3/15/2052 | | |
Sprint LLC 7.63%, 3/1/2026 | | |
| | |
| | |
| | |
| | |
|
Wireless Telecommunication Services — continued |
Vodafone Group plc (United Kingdom) | | |
| | |
| | |
| | |
Total Corporate Bonds
(Cost $551,598) | | |
Mortgage-Backed Securities — 21.3% |
| | |
Pool # 846812, ARM, 4.51%, 4/1/2030 (f) | | |
Pool # 781087, ARM, 4.35%, 12/1/2033 (f) | | |
Pool # 1B1665, ARM, 4.80%, 4/1/2034 (f) | | |
Pool # 847356, ARM, 4.69%, 12/1/2034 (f) | | |
Pool # 782979, ARM, 4.38%, 1/1/2035 (f) | | |
Pool # 1Q0025, ARM, 4.23%, 2/1/2036 (f) | | |
Pool # 848431, ARM, 4.36%, 2/1/2036 (f) | | |
Pool # 1L1286, ARM, 5.25%, 5/1/2036 (f) | | |
Pool # 848365, ARM, 5.30%, 7/1/2036 (f) | | |
Pool # 1G2539, ARM, 3.85%, 10/1/2036 (f) | | |
Pool # 1J1348, ARM, 4.44%, 10/1/2036 (f) | | |
Pool # 1A1096, ARM, 6.31%, 10/1/2036 (f) | | |
Pool # 1G2671, ARM, 3.97%, 11/1/2036 (f) | | |
Pool # 782760, ARM, 4.31%, 11/1/2036 (f) | | |
Pool # 1J1634, ARM, 3.92%, 12/1/2036 (f) | | |
Pool # 1Q0739, ARM, 6.26%, 3/1/2037 (f) | | |
Pool # 848699, ARM, 5.09%, 7/1/2040 (f) | | |
FHLMC Gold Pools, 20 Year Pool # C91403, 3.50%, 3/1/2032 | | |
FHLMC Gold Pools, 30 Year | | |
Pool # C68485, 7.00%, 7/1/2032 | | |
Pool # G01448, 7.00%, 8/1/2032 | | |
Pool # A13625, 5.50%, 10/1/2033 | | |
Pool # A16107, 6.00%, 12/1/2033 | | |
Pool # A17537, 6.00%, 1/1/2034 | | |
Pool # A61572, 5.00%, 9/1/2034 | | |
Pool # A28796, 6.50%, 11/1/2034 | | |
Pool # G03369, 6.50%, 1/1/2035 | | |
Pool # A46987, 5.50%, 7/1/2035 | | |
Pool # G01919, 4.00%, 9/1/2035 | | |
Pool # C02641, 7.00%, 10/1/2036 | | |
Pool # C02660, 6.50%, 11/1/2036 | | |
Pool # A93383, 5.00%, 8/1/2040 | | |
Pool # A93511, 5.00%, 8/1/2040 | | |
Pool # G06493, 4.50%, 5/1/2041 | | |
SEE NOTES TO FINANCIAL STATEMENTS.
| JPMorgan Institutional Trust Funds | |
SCHEDULE OF PORTFOLIO INVESTMENTS
AS OF August 31, 2023 (Unaudited) (continued)
| | |
Mortgage-Backed Securities — continued |
Pool # Z40179, 4.00%, 7/1/2048 | | |
| | |
Pool # P20570, 7.00%, 7/1/2029 | | |
Pool # G20027, 10.00%, 10/1/2030 | | |
Pool # U50105, 4.00%, 1/1/2032 | | |
Pool # U80254, 3.00%, 3/1/2033 | | |
Pool # P20409, 5.50%, 10/1/2033 | | |
Pool # U90975, 4.00%, 6/1/2042 | | |
Pool # U90673, 4.00%, 1/1/2043 | | |
Pool # U99134, 4.00%, 1/1/2046 | | |
Pool # U69030, 4.50%, 1/1/2046 | | |
FHLMC UMBS, 20 Year Pool # SC0104, 3.50%, 8/1/2035 | | |
| | |
Pool # RA6702, 3.00%, 2/1/2052 | | |
Pool # QF0379, 5.00%, 8/1/2052 | | |
Pool # SD1725, 4.00%, 10/1/2052 | | |
| | |
Pool # 54844, ARM, 3.98%, 9/1/2027 (f) | | |
Pool # 303532, ARM, 4.34%, 3/1/2029 (f) | | |
Pool # 555258, ARM, 4.65%, 1/1/2033 (f) | | |
Pool # 722985, ARM, 5.90%, 7/1/2033 (f) | | |
Pool # 686040, ARM, 5.96%, 7/1/2033 (f) | | |
Pool # 746299, ARM, 4.06%, 9/1/2033 (f) | | |
Pool # 766610, ARM, 3.93%, 1/1/2034 (f) | | |
Pool # 920467, ARM, 6.50%, 2/1/2034 (f) | | |
Pool # 770377, ARM, 4.39%, 4/1/2034 (f) | | |
Pool # 751531, ARM, 5.33%, 5/1/2034 (f) | | |
Pool # 782306, ARM, 4.17%, 7/1/2034 (f) | | |
Pool # 790235, ARM, 3.86%, 8/1/2034 (f) | | |
Pool # 735332, ARM, 4.86%, 8/1/2034 (f) | | |
Pool # 791961, ARM, 3.69%, 9/1/2034 (f) | | |
Pool # 803599, ARM, 3.83%, 10/1/2034 (f) | | |
Pool # 803594, ARM, 3.84%, 10/1/2034 (f) | | |
Pool # 896463, ARM, 5.10%, 10/1/2034 (f) | | |
Pool # 806778, ARM, 4.00%, 11/1/2034 (f) | | |
Pool # 806776, ARM, 6.77%, 11/1/2034 (f) | | |
Pool # 802692, ARM, 5.00%, 1/1/2035 (f) | | |
Pool # 810896, ARM, 6.62%, 1/1/2035 (f) | | |
Pool # 816597, ARM, 4.04%, 2/1/2035 (f) | | |
Pool # 735539, ARM, 4.62%, 4/1/2035 (f) | | |
Pool # 745862, ARM, 5.23%, 4/1/2035 (f) | | |
Pool # 821378, ARM, 5.04%, 5/1/2035 (f) | | |
Pool # 823660, ARM, 5.14%, 5/1/2035 (f) | | |
Pool # 745766, ARM, 4.37%, 6/1/2035 (f) | | |
| | |
|
Pool # 832801, ARM, 3.89%, 9/1/2035 (f) | | |
Pool # 843026, ARM, 5.96%, 9/1/2035 (f) | | |
Pool # 849251, ARM, 6.08%, 1/1/2036 (f) | | |
Pool # 895141, ARM, 6.94%, 7/1/2036 (f) | | |
Pool # 900197, ARM, 4.33%, 10/1/2036 (f) | | |
Pool # 966946, ARM, 4.29%, 1/1/2038 (f) | | |
| | |
Pool # 995381, 6.00%, 1/1/2024 | | |
Pool # 995425, 6.00%, 1/1/2024 | | |
Pool # AD0133, 5.00%, 8/1/2024 | | |
| | |
Pool # 255217, 4.50%, 4/1/2024 | | |
Pool # 888656, 6.50%, 4/1/2025 | | |
Pool # MA1138, 3.50%, 8/1/2032 | | |
| | |
Pool # 50966, 7.00%, 1/1/2024 | | |
Pool # 689977, 8.00%, 3/1/2027 | | |
Pool # 695533, 8.00%, 6/1/2027 | | |
Pool # 756024, 8.00%, 9/1/2028 | | |
Pool # 755973, 8.00%, 11/1/2028 | | |
Pool # 455759, 6.00%, 12/1/2028 | | |
Pool # 252211, 6.00%, 1/1/2029 | | |
Pool # 459097, 7.00%, 1/1/2029 | | |
Pool # 889020, 6.50%, 11/1/2029 | | |
Pool # 598559, 6.50%, 8/1/2031 | | |
Pool # 622542, 5.50%, 9/1/2031 | | |
Pool # 788150, 6.00%, 3/1/2032 | | |
Pool # 675555, 6.00%, 12/1/2032 | | |
Pool # AL0045, 6.00%, 12/1/2032 | | |
Pool # 674349, 6.00%, 3/1/2033 | | |
Pool # 688625, 6.00%, 3/1/2033 | | |
Pool # 688655, 6.00%, 3/1/2033 | | |
Pool # 695584, 6.00%, 3/1/2033 | | |
Pool # 702901, 6.00%, 5/1/2033 | | |
Pool # 723852, 5.00%, 7/1/2033 | | |
Pool # 729296, 5.00%, 7/1/2033 | | |
Pool # 729379, 6.00%, 8/1/2033 | | |
Pool # 737825, 6.00%, 9/1/2033 | | |
Pool # 750977, 4.50%, 11/1/2033 | | |
Pool # 725017, 5.50%, 12/1/2033 | | |
Pool # 751341, 5.50%, 3/1/2034 | | |
Pool # 888568, 5.00%, 12/1/2034 | | |
Pool # 815426, 4.50%, 2/1/2035 | | |
Pool # AD0755, 7.00%, 6/1/2035 | | |
Pool # 820347, 5.00%, 9/1/2035 | | |
SEE NOTES TO FINANCIAL STATEMENTS.
| JPMorgan Institutional Trust Funds | |
| | |
Mortgage-Backed Securities — continued |
Pool # 833657, 7.50%, 8/1/2036 | | |
Pool # 986648, 6.00%, 9/1/2037 | | |
Pool # 888892, 7.50%, 11/1/2037 | | |
Pool # 257510, 7.00%, 12/1/2038 | | |
Pool # AD0753, 7.00%, 1/1/2039 | | |
Pool # AT5891, 3.00%, 6/1/2043 | | |
Pool # AL7527, 4.50%, 9/1/2043 | | |
Pool # BM3500, 4.00%, 9/1/2047 | | |
Pool # BJ1778, 4.50%, 10/1/2047 | | |
Pool # BN9180, 4.00%, 6/1/2049 | | |
Pool # BK8753, 4.50%, 6/1/2049 | | |
Pool # BO1219, 4.50%, 6/1/2049 | | |
Pool # BO7077, 3.00%, 9/1/2049 | | |
Pool # CA5549, 3.00%, 4/1/2050 | | |
Pool # CA5702, 2.50%, 5/1/2050 | | |
Pool # CA6079, 2.50%, 6/1/2050 | | |
Pool # BP6439, 2.50%, 7/1/2050 | | |
Pool # CA6361, 2.50%, 7/1/2050 | | |
Pool # FS0730, 4.00%, 2/1/2051 | | |
Pool # BU0070, 2.50%, 10/1/2051 | | |
Pool # MA4466, 2.50%, 11/1/2051 | | |
Pool # CB2637, 2.50%, 1/1/2052 | | |
Pool # CB2670, 3.00%, 1/1/2052 | | |
Pool # FS3345, 3.00%, 2/1/2052 | | |
Pool # FS5446, 2.50%, 3/1/2052 | | |
Pool # CB3383, 4.00%, 4/1/2052 | | |
Pool # CB3679, 4.00%, 5/1/2052 | | |
Pool # CB3913, 4.00%, 5/1/2052 | | |
Pool # CB4124, 4.00%, 6/1/2052 | | |
Pool # CB4608, 4.00%, 9/1/2052 | | |
Pool # BW8524, 5.00%, 9/1/2052 | | |
Pool # BW9985, 5.00%, 9/1/2052 | | |
Pool # BV6789, 4.00%, 10/1/2052 | | |
Pool # BX0091, 5.00%, 10/1/2052 | | |
Pool # BV6794, 5.00%, 11/1/2052 | | |
Pool # CB5896, 5.00%, 3/1/2053 | | |
Pool # BY4714, 5.00%, 6/1/2053 | | |
Pool # BY7027, 5.00%, 8/1/2053 | | |
| | |
Pool # 535183, 8.00%, 6/1/2028 | | |
Pool # 252409, 6.50%, 3/1/2029 | | |
Pool # 653815, 7.00%, 2/1/2033 | | |
Pool # 752786, 6.00%, 9/1/2033 | | |
Pool # 931717, 6.50%, 8/1/2039 | | |
| | |
|
| | |
Pool # 470300, 3.64%, 1/1/2025 | | |
Pool # AM4991, 3.97%, 12/1/2025 | | |
Pool # AL6805, 3.81%, 1/1/2026 (f) | | |
Pool # 468645, 4.54%, 7/1/2026 | | |
Pool # AM7223, 3.11%, 12/1/2026 | | |
Pool # AM7515, 3.34%, 2/1/2027 | | |
Pool # AM8803, 2.78%, 6/1/2027 | | |
Pool # AM8987, 2.79%, 6/1/2027 | | |
Pool # BL9574, 1.00%, 12/1/2027 | | |
Pool # BL1040, 3.81%, 12/1/2028 | | |
Pool # BS8075, 5.00%, 9/1/2029 | | |
Pool # BL4364, 2.24%, 11/1/2029 | | |
Pool # BL4333, 2.52%, 11/1/2029 | | |
Pool # AM7785, 3.17%, 2/1/2030 | | |
Pool # AM7516, 3.55%, 2/1/2030 | | |
Pool # AM8544, 3.08%, 4/1/2030 | | |
Pool # AM8889, 2.92%, 5/1/2030 | | |
Pool # AM9020, 2.97%, 6/1/2030 | | |
Pool # BS7241, 5.05%, 9/1/2030 | | |
Pool # BL9251, 1.45%, 10/1/2030 | | |
Pool # BL4315, 2.39%, 9/1/2031 | | |
Pool # BS5153, 2.53%, 9/1/2031 | | |
Pool # BS5071, 2.63%, 9/1/2031 | | |
Pool # BS3637, 1.73%, 11/1/2031 | | |
Pool # BS4313, 1.98%, 1/1/2032 | | |
Pool # BS8294, 4.44%, 1/1/2032 | | |
Pool # BS8214, 4.62%, 1/1/2032 | | |
Pool # BM7037, 1.75%, 3/1/2032 (f) | | |
Pool # BS9519, IO, 5.44%, 4/1/2032 (g) | | |
Pool # BS5760, 2.43%, 5/1/2032 | | |
Pool # AN6149, 3.14%, 7/1/2032 | | |
Pool # BS6243, 3.87%, 8/1/2032 | | |
Pool # BS5887, 3.51%, 9/1/2032 | | |
Pool # BS6597, 3.67%, 9/1/2032 | | |
Pool # BS6339, 3.80%, 9/1/2032 | | |
Pool # BS6505, 3.54%, 10/1/2032 | | |
Pool # BS6822, 3.81%, 10/1/2032 | | |
Pool # BS6759, 3.97%, 10/1/2032 | | |
Pool # AP9632, 4.00%, 10/1/2032 | | |
Pool # AP9762, 4.00%, 10/1/2032 | | |
Pool # BS6926, 4.51%, 10/1/2032 | | |
Pool # BS6928, 4.55%, 10/1/2032 | | |
Pool # BS6601, 3.54%, 11/1/2032 | | |
Pool # BS7115, 3.81%, 11/1/2032 | | |
SEE NOTES TO FINANCIAL STATEMENTS.
| JPMorgan Institutional Trust Funds | |
SCHEDULE OF PORTFOLIO INVESTMENTS
AS OF August 31, 2023 (Unaudited) (continued)
| | |
Mortgage-Backed Securities — continued |
Pool # AQ7084, 3.50%, 12/1/2032 | | |
Pool # AT2703, 3.50%, 5/1/2033 | | |
Pool # AT2954, 3.50%, 5/1/2033 | | |
Pool # AT4180, 3.50%, 5/1/2033 | | |
Pool # AT4939, 3.50%, 5/1/2033 | | |
Pool # BS8470, 4.52%, 6/1/2033 | | |
Pool # BS9351, IO, 4.70%, 9/1/2033 (g) | | |
Pool # BS9384, 5.04%, 9/1/2033 (g) | | |
Pool # 754922, 5.50%, 9/1/2033 | | |
Pool # 762520, 4.00%, 11/1/2033 | | |
Pool # BS4198, 2.16%, 12/1/2033 | | |
Pool # BS4237, 2.16%, 12/1/2033 | | |
Pool # BS7097, 4.67%, 11/1/2034 | | |
Pool # AM8922, 3.03%, 6/1/2035 | | |
Pool # AM9188, 3.12%, 6/1/2035 | | |
Pool # BS7789, 4.62%, 1/1/2036 | | |
Pool # 849215, 6.50%, 1/1/2036 | | |
Pool # 872740, 6.50%, 6/1/2036 | | |
Pool # 886320, 6.50%, 7/1/2036 | | |
Pool # BS4368, 2.29%, 1/1/2037 | | |
Pool # 888796, 6.00%, 9/1/2037 | | |
Pool # AO7225, 4.00%, 7/1/2042 | | |
Pool # AO9352, 4.00%, 7/1/2042 | | |
Pool # MA1125, 4.00%, 7/1/2042 | | |
Pool # AR1397, 3.00%, 1/1/2043 | | |
Pool # MA1711, 4.50%, 12/1/2043 | | |
Pool # MA1828, 4.50%, 3/1/2044 | | |
Pool # BF0558, 5.00%, 12/1/2049 | | |
Pool # BF0091, 3.50%, 5/1/2056 | | |
Pool # BF0101, 3.50%, 6/1/2056 | | |
Pool # BF0300, 4.00%, 8/1/2058 (g) | | |
Pool # BF0464, 3.50%, 3/1/2060 | | |
Pool # BF0546, 2.50%, 7/1/2061 | | |
Pool # BF0560, 2.50%, 9/1/2061 | | |
Pool # BF0590, 2.50%, 12/1/2061 | | |
Pool # BF0579, 3.00%, 12/1/2061 | | |
Pool # BF0583, 4.00%, 12/1/2061 | | |
FNMA/FHLMC UMBS, Single Family, 30 Year TBA, 2.50%, 10/25/2053 (g) | | |
| | |
Pool # 554108, 6.50%, 3/15/2028 | | |
Pool # 468149, 8.00%, 8/15/2028 | | |
Pool # 486537, 7.50%, 9/15/2028 | | |
Pool # 486631, 6.50%, 10/15/2028 | | |
Pool # 591882, 6.50%, 7/15/2032 | | |
| | |
|
Pool # 607645, 6.50%, 2/15/2033 | | |
Pool # 607724, 7.00%, 2/15/2033 | | |
Pool # 604209, 6.50%, 4/15/2033 | | |
Pool # 781614, 7.00%, 6/15/2033 | | |
Pool # BM2141, 5.00%, 7/15/2049 | | |
Pool # CO1916, 5.00%, 9/15/2052 | | |
| | |
Pool # CE5524, ARM, 6.91%, 8/20/2071 (f) | | |
Pool # CE5546, ARM, 6.86%, 10/20/2071 (f) | | |
Pool # CK2783, ARM, 6.84%, 2/20/2072 (f) | | |
Pool # CK2799, ARM, 6.85%, 3/20/2072 (f) | | |
Pool # CK2810, ARM, 6.83%, 4/20/2072 (f) | | |
Pool # CP1819, ARM, 6.96%, 7/20/2072 (f) | | |
Pool # CG5357, ARM, 6.83%, 8/20/2072 (f) | | |
Pool # CP4923, ARM, 7.02%, 8/20/2072 (f) | | |
| | |
Pool # 2006, 8.50%, 5/20/2025 | | |
Pool # 2141, 8.00%, 12/20/2025 | | |
Pool # 2234, 8.00%, 6/20/2026 | | |
Pool # 2270, 8.00%, 8/20/2026 | | |
Pool # 2285, 8.00%, 9/20/2026 | | |
Pool # 2324, 8.00%, 11/20/2026 | | |
Pool # 2499, 8.00%, 10/20/2027 | | |
Pool # 2512, 8.00%, 11/20/2027 | | |
Pool # 2525, 8.00%, 12/20/2027 | | |
Pool # 2549, 7.50%, 2/20/2028 | | |
Pool # 2646, 7.50%, 9/20/2028 | | |
Pool # 2647, 8.00%, 9/20/2028 | | |
Pool # 3427, 4.50%, 8/20/2033 | | |
Pool # 4245, 6.00%, 9/20/2038 | | |
Pool # AK8806, 4.25%, 3/20/2045 | | |
Pool # BM2118, 4.50%, 6/20/2049 | | |
Pool # BO0535, 4.00%, 7/20/2049 | | |
Pool # BO8227, 5.00%, 7/20/2049 | | |
Pool # BO8229, 5.00%, 7/20/2049 | | |
Pool # BM9734, 4.00%, 10/20/2049 | | |
Pool # BQ4115, 3.00%, 3/20/2050 | | |
Pool # 785294, 3.50%, 1/20/2051 | | |
Pool # CB1543, 3.00%, 2/20/2051 | | |
Pool # CK2698, 3.00%, 2/20/2052 | | |
Pool # CK2716, 3.50%, 2/20/2052 | | |
Pool # CM2161, 3.00%, 3/20/2052 | | |
Pool # CM2213, 3.00%, 3/20/2052 | | |
Pool # CN2859, 4.50%, 6/20/2052 | | |
Pool # CO4824, 5.00%, 6/20/2052 | | |
SEE NOTES TO FINANCIAL STATEMENTS.
| JPMorgan Institutional Trust Funds | |
| | |
Mortgage-Backed Securities — continued |
Pool # CO4865, 5.00%, 7/20/2052 | | |
Pool # MA8200, 4.00%, 8/20/2052 | | |
Pool # CO8413, 4.50%, 9/20/2052 | | |
Pool # CT7445, 6.00%, 4/20/2053 | | |
Total Mortgage-Backed Securities
(Cost $478,726) | | |
Asset-Backed Securities — 14.6% |
Academic Loan Funding Trust Series 2013-1A, Class A, 6.20%, 12/26/2044 (b) (f) | | |
ACC Frn Series 2019-AA, 0.25%, 6/15/2025 ‡ | | |
Air Canada Pass-Through Trust (Canada) | | |
Series 2013-1, Class A, 4.13%, 5/15/2025 (b) | | |
Series 2015-2, Class AA, 3.75%, 12/15/2027 (b) | | |
Series 2017-1, Class AA, 3.30%, 1/15/2030 (b) | | |
Series 2017-1, Class A, 3.55%, 1/15/2030 (b) | | |
American Airlines Pass-Through Trust | | |
Series 2016-3, Class AA, 3.00%, 10/15/2028 | | |
Series 2019-1, Class A, 3.50%, 2/15/2032 | | |
American Homes 4 Rent Trust | | |
Series 2014-SFR2, Class A, 3.79%, 10/17/2036 (b) | | |
Series 2014-SFR2, Class D, 5.15%, 10/17/2036 (b) | | |
Series 2014-SFR2, Class E, 6.23%, 10/17/2036 (b) | | |
Series 2014-SFR3, Class A, 3.68%, 12/17/2036 (b) | | |
Series 2014-SFR3, Class C, 4.60%, 12/17/2036 (b) | | |
Series 2014-SFR3, Class E, 6.42%, 12/17/2036 (b) | | |
Series 2015-SFR1, Class A, 3.47%, 4/17/2052 (b) | | |
Series 2015-SFR1, Class E, 5.64%, 4/17/2052 (b) | | |
| | |
Series 2020-SFR2, Class C, 2.53%, 7/17/2037 (b) | | |
Series 2020-SFR4, Class C, 1.86%, 11/17/2037 (b) | | |
Series 2021-SFR3, Class C, 1.80%, 10/17/2038 (b) | | |
Series 2021-SFR3, Class E1, 2.33%, 10/17/2038 (b) | | |
Bedrock Abs I LLC, 7.95%, 12/27/2037 ‡ | | |
| | |
|
| | |
Series 2022-SFR1, Class A, 3.40%, 11/17/2037 (b) | | |
Series 2022-SFR1, Class C, 4.45%, 11/17/2037 (b) | | |
British Airways Pass-Through Trust (United Kingdom) | | |
Series 2013-1, Class A, 4.63%, 6/20/2024 (b) | | |
Series 2018-1, Class AA, 3.80%, 9/20/2031 (b) | | |
Series 2018-1, Class A, 4.13%, 9/20/2031 (b) | | |
Series 2019-1, Class AA, 3.30%, 12/15/2032 (b) | | |
Business Jet Securities LLC | | |
Series 2020-1A, Class A, 2.98%, 11/15/2035 ‡ (b) | | |
Series 2021-1A, Class A, 2.16%, 4/15/2036 ‡ (b) | | |
Cars Net Lease Mortgage Notes Series 2020-1A, Class A3, 3.10%, 12/15/2050 (b) | | |
Carvana Auto Receivables Trust Series 2023-P3, Class A3, 5.82%, 8/10/2028 (b) | | |
CFIN Issuer LLC Series 2022-RTL1, Class AA, 3.25%, 2/16/2026 ‡ (b) | | |
Chase Funding Trust Series 2003-6, Class 1A7, 4.83%, 11/25/2034 (e) | | |
Citibank Credit Card Issuance Trust Series 2007-A3, Class A3, 6.15%, 6/15/2039 | | |
Consumer Receivables Asset Investment Trust Series 2021-1, Class A1X, 9.11%, 12/15/2024 (b) (f) | | |
Continental Finance Credit Card ABS Master Trust | | |
Series 2020-1A, Class A, 2.24%, 12/15/2028 (b) | | |
Series 2022-A, Class A, 6.19%, 10/15/2030 (b) | | |
CoreVest American Finance Trust | | |
Series 2019-2, Class D, 4.22%, 6/15/2052 (b) | | |
Series 2020-3, Class B, 2.20%, 8/15/2053 (b) | | |
CPS Auto Receivables Trust Series 2022-D, Class C, 7.69%, 1/16/2029 (b) | | |
Credit Acceptance Auto Loan Trust | | |
Series 2021-2A, Class C, 1.64%, 6/17/2030 (b) | | |
Series 2022-3A, Class C, 8.45%, 2/15/2033 (b) | | |
Series 2023-1A, Class B, 7.02%, 5/16/2033 (b) | | |
SEE NOTES TO FINANCIAL STATEMENTS.
| JPMorgan Institutional Trust Funds | |
SCHEDULE OF PORTFOLIO INVESTMENTS
AS OF August 31, 2023 (Unaudited) (continued)
| | |
Asset-Backed Securities — continued |
Series 2023-3A, Class A, 6.39%, 8/15/2033 (b) | | |
Credit Suisse ABS Trust Series 2020-AT1, Class A, 2.61%, 10/15/2026 (b) | | |
CWABS, Inc. Asset-Backed Certificates Trust Series 2004-6, Class M1, 6.33%, 10/25/2034 (f) | | |
DataBank Issuer Series 2021-1A, Class A2, 2.06%, 2/27/2051 (b) | | |
Delta Air Lines Pass-Through Trust Series 2015-1, Class AA, 3.63%, 7/30/2027 | | |
Diamond Resorts Owner Trust Series 2019-1A, Class A, 2.89%, 2/20/2032 (b) | | |
Diversified Abs Phase III LLC Series 2022-1, 4.88%, 4/28/2039 ‡ (b) | | |
Diversified Abs Phase LLC Series VI, Class A, 7.50%, 11/28/2039 ‡ | | |
DT Auto Owner Trust Series 2022-3A, Class D, 8.14%, 7/17/2028 (b) | | |
Exeter Automobile Receivables Trust Series 2019-3A, Class D, 3.11%, 8/15/2025 (b) | | |
| | |
Series 2020-SFR2, Class E, 2.67%, 10/19/2037 (b) | | |
Series 2022-SFR3, Class C, 4.50%, 7/17/2038 (b) | | |
Series 2021-SFR1, Class D, 2.19%, 8/17/2038 (b) | | |
Series 2022-SFR2, Class E1, 4.50%, 7/17/2039 (b) | | |
Flagship Credit Auto Trust Series 2022-4, Class C, 7.71%, 10/16/2028 (b) | | |
| | |
Series 2021-SAT1, 3.65%, 2/25/2024 ‡ (b) (f) | | |
Series 2020-GT1, Class A, 4.45%, 1/25/2026 (b) (f) | | |
Series 2021-GT1, Class A, 3.62%, 7/25/2026 (b) (f) | | |
Series 2021-GT2, Class A, 3.85%, 10/25/2026 (b) (f) | | |
Series 2022-GT1, Class A, 6.19%, 4/25/2027 (b) | | |
FNMA, Grantor Trust Series 2017-T1, Class A, 2.90%, 6/25/2027 | | |
Foundation Finance Trust Series 2019-1A, Class A, 3.86%, 11/15/2034 (b) | | |
FREED ABS Trust Series 2022-3FP, Class B, 5.79%, 8/20/2029 (b) | | |
| | |
|
GE Capital Mortgage Services, Inc. Trust Series 1999-HE1, Class M, 6.71%, 4/25/2029 (f) | | |
GLS Auto Receivables Issuer Trust | | |
Series 2022-3A, Class C, 5.34%, 6/15/2028 (b) | | |
Series 2022-3A, Class D, 6.42%, 6/15/2028 (b) | | |
Series 2023-3A, Class C, 6.01%, 5/15/2029 (b) | | |
Gold Key Resorts LLC Series 2014-A, Class A, 3.22%, 3/17/2031 (b) | | |
| | |
Series 2019-2A, Class A, 2.76%, 4/15/2055 ‡ (b) | | |
Series 2023-1A, Class A, 5.90%, 1/17/2061 ‡ (b) | | |
Goodgreen Trust Series 2017-1A, Class A, 3.74%, 10/15/2052 ‡ (b) | | |
GTP Acquisition Partners I LLC, 3.48%, 6/16/2025 (b) | | |
HERO Funding (Cayman Islands) Series 2017-3A, Class A2, 3.95%, 9/20/2048 ‡ (b) | | |
| | |
Series 2016-3A, Class A1, 3.08%, 9/20/2042 ‡ (b) | | |
Series 2017-1A, Class A2, 4.46%, 9/20/2047 ‡ (b) | | |
HGI CRE CLO Ltd. (Cayman Islands) Series 2022-FL3, Class B, 7.81%, 4/20/2037 (b) (f) | | |
Hilton Grand Vacations Trust Series 2017-AA, Class A, 2.66%, 12/26/2028 (b) | | |
Jonah, 7.80%, 11/10/2037 ‡ (b) | | |
Jonah Energy Abs LLC Series 2022-1, Class A1, 7.20%, 12/10/2037 ‡ (b) | | |
| | |
Series 2012-2, Class A, IO, 0.87%, 8/25/2038 (b) (f) | | |
Series 2013-2, Class A, IO, 1.89%, 3/25/2039 (b) (f) | | |
Series 2015-2, Class A, IO, 2.94%, 7/25/2041 (b) (f) | | |
Lending Funding Trust Series 2020-2A, Class C, 4.30%, 4/21/2031 (b) | | |
Lendingpoint Asset Securitization Trust | | |
Series 2022-B, Class B, 5.99%, 10/15/2029 (b) | | |
Series 2022-C, Class B, 7.46%, 2/15/2030 (b) | | |
SEE NOTES TO FINANCIAL STATEMENTS.
| JPMorgan Institutional Trust Funds | |
| | |
Asset-Backed Securities — continued |
LendingPoint Asset Securitization Trust Series 2020-REV1, Class A, 2.73%, 10/15/2028 (b) | | |
LL ABS Trust Series 2022-1A, Class B, 5.05%, 11/15/2029 (b) | | |
LP LMS Asset Securitization Trust, 3.23%, 10/15/2028 ‡ | | |
Mariner Finance Issuance Trust Series 2022-AA, Class C, 7.90%, 10/20/2037 (b) | | |
Mid-State Capital Corp. Trust Series 2006-1, Class M1, 6.08%, 10/15/2040 (b) | | |
MVW LLC Series 2019-2A, Class B, 2.44%, 10/20/2038 (b) | | |
New Century Home Equity Loan Trust Series 2003-5, Class AI6, 4.80%, 11/25/2033 (e) | | |
NRZ Excess Spread-Collateralized Notes | | |
Series 2020-PLS1, Class A, 3.84%, 12/25/2025 (b) | | |
Series 2021-FHT1, Class A, 3.10%, 7/25/2026 (b) | | |
Series 2021-GNT1, Class A, 3.47%, 11/25/2026 (b) | | |
OneMain Direct Auto Receivables Trust Series 2019-1A, Class B, 3.95%, 11/14/2028 (b) | | |
Oportun Funding XIII LLC Series 2019-A, Class A, 3.08%, 8/8/2025 (b) | | |
Pagaya AI Technology in Housing Trust Series 2022-1, Class A, 4.25%, 8/25/2025 (b) | | |
Pendoor Proper, Zero Coupon, 2/15/2026 ‡ | | |
PNMAC GMSR Issuer Trust Series 2022-GT1, Class A, 9.54%, 5/25/2027 (b) (f) | | |
Prestige Auto Receivables Trust Series 2022-1A, Class C, 7.09%, 8/15/2028 (b) | | |
| | |
Series 2021-NPL6, Class A1, 2.49%, 7/25/2051 (b) (e) | | |
Series 2021-RN3, Class A1, 1.84%, 9/25/2051 (b) (e) | | |
Series 2021-RN4, Class A1, 2.49%, 10/25/2051 (b) (f) | | |
Pretium Mortgage Credit Partners I LLC Series 2021-NPL1, Class A1, 2.24%, 9/27/2060 (b) (e) | | |
Progress Residential Trust | | |
Series 2022-SFR2, Class E1, 4.55%, 4/17/2027 (b) | | |
Series 2020-SFR3, Class C, 1.70%, 10/17/2027 (b) | | |
| | |
|
Series 2019-SFR4, Class D, 3.14%, 10/17/2036 (b) | | |
Series 2021-SFR6, Class E1, 2.43%, 7/17/2038 (b) | | |
Series 2022-SFR3, Class E2, 5.60%, 4/17/2039 (b) | | |
Series 2022-SFR5, Class E1, 6.62%, 6/17/2039 (b) | | |
PRPM LLC Series 2021-1, Class A1, 2.12%, 1/25/2026 (b) (f) | | |
Renaissance Home Equity Loan Trust Series 2007-2, Class AF2, 5.68%, 6/25/2037 (e) | | |
Renew (Cayman Islands) Series 2017-1A, Class A, 3.67%, 9/20/2052 ‡ (b) | | |
Santander Drive Auto Receivables Trust Series 2022-4, Class A3, 4.14%, 2/16/2027 | | |
SART Series 2018-1, 4.76%, 6/15/2025 ‡ | | |
SCF Equipment Leasing LLC Series 2022-2A, Class C, 6.50%, 8/20/2032 (b) | | |
Securitized Asset-Backed Receivables LLC Trust Series 2006-CB1, Class AF2, 2.85%, 1/25/2036 (e) | | |
Sierra Timeshare Receivables Funding LLC Series 2019-2A, Class C, 3.12%, 5/20/2036 (b) | | |
Spirit Airlines Pass-Through Trust Series 2017-1, Class AA, 3.38%, 2/15/2030 | | |
Tricon Residential Trust Series 2022-SFR1, Class D, 4.75%, 4/17/2039 (b) | | |
United Airlines Pass-Through Trust | | |
Series 2016-2, Class B, 3.65%, 10/7/2025 | | |
Series 2018-1, Class B, 4.60%, 3/1/2026 | | |
Series 2016-1, Class A, 3.45%, 7/7/2028 | | |
Series 2016-2, Class A, 3.10%, 10/7/2028 | | |
Series 2018-1, Class AA, 3.50%, 3/1/2030 | | |
Series 2018-1, Class A, 3.70%, 3/1/2030 | | |
Series 2019-1, Class AA, 4.15%, 8/25/2031 | | |
Series 2019-1, Class A, 4.55%, 8/25/2031 | | |
Series 2019-2, Class AA, 2.70%, 5/1/2032 | | |
UOG ABS Issuer I LLC Series 2023-1, Class A1, 8.35%, 6/5/2040 ‡ (b) | | |
Upstart Structured Pass-Through Trust Series 2022-4A, Class A, 7.01%, 11/15/2030 (b) | | |
US Airways Pass-Through Trust Series 2011-1, Class A, 7.13%, 10/22/2023 | | |
US Auto Funding Trust Series 2022-1A, Class B, 5.13%, 12/15/2025 (b) | | |
vMobo, Inc., 7.46%, 7/18/2027 ‡ | | |
SEE NOTES TO FINANCIAL STATEMENTS.
| JPMorgan Institutional Trust Funds | |
SCHEDULE OF PORTFOLIO INVESTMENTS
AS OF August 31, 2023 (Unaudited) (continued)
| | |
Asset-Backed Securities — continued |
VOLT CI LLC Series 2021-NP10, Class A1, 1.99%, 5/25/2051 (b) (e) | | |
VOLT XCIII LLC Series 2021-NPL2, Class A1, 1.89%, 2/27/2051 (b) (e) | | |
VOLT XCIV LLC Series 2021-NPL3, Class A1, 2.24%, 2/27/2051 (b) (e) | | |
VOLT XCVI LLC Series 2021-NPL5, Class A1, 2.12%, 3/27/2051 (b) (e) | | |
VOLT XCVII LLC Series 2021-NPL6, Class A1, 2.24%, 4/25/2051 (b) (e) | | |
Westlake Automobile Receivables Trust | | |
Series 2022-2A, Class D, 5.48%, 9/15/2027 (b) | | |
Series 2023-3A, Class C, 6.02%, 9/15/2028 (b) | | |
Series 2023-2A, Class D, 7.01%, 11/15/2028 (b) | | |
Total Asset-Backed Securities
(Cost $321,528) | | |
Collateralized Mortgage Obligations — 5.9% |
| | |
Series 2004-2CB, Class 1A9, 5.75%, 3/25/2034 | | |
Series 2005-1CB, Class 1A6, IF, IO, 1.67%, 3/25/2035 (f) | | |
Series 2005-22T1, Class A2, IF, IO, 4.40%, 6/25/2035 (f) | | |
Series 2005-20CB, Class 3A8, IF, IO, 4.08%, 7/25/2035 (f) | | |
Series 2005-28CB, Class 1A4, 5.50%, 8/25/2035 | | |
Series 2005-28CB, Class 3A5, 6.00%, 8/25/2035 | | |
Series 2005-37T1, Class A2, IF, IO, 4.59%, 9/25/2035 (f) | | |
Series 2005-54CB, Class 1A2, IF, IO, 4.18%, 11/25/2035 (f) | | |
Series 2005-54CB, Class 1A11, 5.50%, 11/25/2035 | | |
Series 2005-57CB, Class 3A2, IF, IO, 4.43%, 12/25/2035 (f) | | |
Series 2005-64CB, Class 1A9, 5.50%, 12/25/2035 | | |
Series 2006-26CB, Class A9, 6.50%, 9/25/2036 | | |
Banc of America Alternative Loan Trust | | |
Series 2004-6, Class 15, PO, 7/25/2019 | | |
Series 2006-4, Class 1A4, 6.00%, 5/25/2046 | | |
| | |
|
Banc of America Funding Trust | | |
Series 2004-1, PO, 3/25/2034 | | |
Series 2004-2, Class 30, PO, 9/20/2034 | | |
Series 2005-6, Class 2A7, 5.50%, 10/25/2035 | | |
Series 2005-7, Class 30, PO, 11/25/2035 | | |
Series 2005-8, Class 30, PO, 1/25/2036 | | |
Series 2006-A, Class 3A2, 4.39%, 2/20/2036 (f) | | |
Banc of America Mortgage Trust Series 2004-A, Class 2A2, 4.17%, 2/25/2034 (f) | | |
| | |
Series 2003-7, Class 3A, 4.66%, 10/25/2033 (f) | | |
Series 2004-1, Class 12A1, 4.09%, 4/25/2034 (f) | | |
Series 2004-2, Class 14A, 3.86%, 5/25/2034 (f) | | |
Series 2006-1, Class A1, 6.80%, 2/25/2036 (f) | | |
CHL Mortgage Pass-Through Trust | | |
Series 2004-8, Class 2A1, 4.50%, 6/25/2019 ‡ | | |
Series 2004-HYB1, Class 2A, 4.70%, 5/20/2034 (f) | | |
Series 2004-HYB3, Class 2A, 3.91%, 6/20/2034 (f) | | |
Series 2004-7, Class 2A1, 2.52%, 6/25/2034 (f) | | |
Series 2004-HYB6, Class A3, 4.41%, 11/20/2034 (f) | | |
Series 2005-16, Class A23, 5.50%, 9/25/2035 | | |
Series 2005-22, Class 2A1, 3.65%, 11/25/2035 (f) | | |
Citicorp Mortgage Securities REMIC Pass-Through Certificates Trust | | |
Series 2005-5, Class APO, PO, 8/25/2035 | | |
Series 2005-8, Class A, PO, 11/25/2035 | | |
Citigroup Global Markets Mortgage Securities VII, Inc. | | |
Series 2003-UP2, Class 1, PO, 6/25/2033 | | |
Series 2003-HYB1, Class A, 4.24%, 9/25/2033 (f) | | |
Citigroup Mortgage Loan Trust | | |
Series 2004-UST1, Class A6, 5.91%, 8/25/2034 (f) | | |
Series 2015-A, Class B2, 4.50%, 6/25/2058 (b) (f) | | |
Citigroup Mortgage Loan Trust, Inc. | | |
Series 2003-1, Class 3, PO, 9/25/2033 | | |
SEE NOTES TO FINANCIAL STATEMENTS.
| JPMorgan Institutional Trust Funds | |
| | |
Collateralized Mortgage Obligations — continued |
Series 2003-UP3, Class A3, 7.00%, 9/25/2033 | | |
Series 2003-1, Class 2, PO, 10/25/2033 | | |
Series 2003-1, Class 2A6, PO, 10/25/2033 | | |
Series 2003-1, Class 2A5, 5.25%, 10/25/2033 | | |
Series 2005-1, Class 2A1A, 3.14%, 2/25/2035 (f) | | |
Series 2005-2, Class 2A11, 5.50%, 5/25/2035 | | |
Series 2005-5, Class 1A2, 4.60%, 8/25/2035 (f) | | |
Credit Suisse First Boston Mortgage Securities Corp. (Switzerland) | | |
Series 2003-1, Class DB1, 6.65%, 2/25/2033 (f) | | |
Series 2003-21, Class 1A4, 5.25%, 9/25/2033 | | |
Series 2003-25, Class 1P, PO, 10/25/2033 | | |
CSFB Mortgage-Backed Pass-Through Certificates | | |
Series 2005-4, Class 3A18, 5.50%, 6/25/2035 | | |
Series 2005-4, Class 3A23, 5.50%, 6/25/2035 | | |
CSMC Trust Series 2021-RPL1, Class A1, 1.67%, 9/27/2060 (b) (f) | | |
| | |
Series 1608, Class L, 6.50%, 9/15/2023 | | |
Series 1573, Class PZ, 7.00%, 9/15/2023 | | |
Series 2571, Class SK, IF, 11.63%, 9/15/2023 (f) | | |
Series 1602, Class SA, IF, 5.52%, 10/15/2023 (f) | | |
Series 1591, Class PV, 6.25%, 10/15/2023 | | |
Series 2710, Class HB, 5.50%, 11/15/2023 | | |
Series 1642, Class PJ, 6.00%, 11/15/2023 | | |
Series 2716, Class UN, 4.50%, 12/15/2023 | | |
Series 1638, Class H, 6.50%, 12/15/2023 | | |
Series 2283, Class K, 6.50%, 12/15/2023 | | |
Series 1865, Class D, PO, 2/15/2024 | | |
Series 1760, Class ZD, 3.31%, 2/15/2024 (f) | | |
Series 1686, Class SH, IF, 7.31%, 2/15/2024 (f) | | |
Series 1671, Class QC, IF, 10.00%, 2/15/2024 (f) | | |
Series 1709, Class FA, 2.96%, 3/15/2024 (f) | | |
Series 1699, Class FC, 5.90%, 3/15/2024 (f) | | |
Series 1695, Class EB, 7.00%, 3/15/2024 | | |
Series 1706, Class K, 7.00%, 3/15/2024 | | |
Series 2033, Class SN, IF, IO, 18.79%, 3/15/2024 (f) | | |
Series 2306, Class K, PO, 5/15/2024 | | |
| | |
|
Series 2306, Class SE, IF, IO, 6.79%, 5/15/2024 (f) | | |
Series 1745, Class D, 7.50%, 8/15/2024 | | |
Series 3720, Class A, 4.50%, 9/15/2025 | | |
Series 3131, Class BK, 5.50%, 3/15/2026 | | |
Series 1829, Class ZB, 6.50%, 3/15/2026 | | |
Series 1863, Class Z, 6.50%, 7/15/2026 | | |
Series 1890, Class H, 7.50%, 9/15/2026 | | |
Series 1899, Class ZE, 8.00%, 9/15/2026 | | |
Series 3229, Class HE, 5.00%, 10/15/2026 | | |
Series 1963, Class Z, 7.50%, 1/15/2027 | | |
Series 1935, Class FL, 6.00%, 2/15/2027 (f) | | |
Series 1981, Class Z, 6.00%, 5/15/2027 | | |
Series 1970, Class PG, 7.25%, 7/15/2027 | | |
Series 1987, Class PE, 7.50%, 9/15/2027 | | |
Series 2019, Class Z, 6.50%, 12/15/2027 | | |
Series 2038, Class PN, IO, 7.00%, 3/15/2028 | | |
Series 2040, Class PE, 7.50%, 3/15/2028 | | |
Series 4251, Class KW, 2.50%, 4/15/2028 | | |
Series 2043, Class CJ, 6.50%, 4/15/2028 | | |
Series 2054, Class PV, 7.50%, 5/15/2028 | | |
Series 2075, Class PM, 6.25%, 8/15/2028 | | |
Series 2075, Class PH, 6.50%, 8/15/2028 | | |
Series 2086, Class GB, 6.00%, 9/15/2028 | | |
Series 2089, Class PJ, IO, 7.00%, 10/15/2028 | | |
Series 2095, Class PE, 6.00%, 11/15/2028 | | |
Series 2125, Class JZ, 6.00%, 2/15/2029 | | |
Series 2136, Class PG, 6.00%, 3/15/2029 | | |
Series 2132, Class SB, IF, 8.05%, 3/15/2029 (f) | | |
Series 2141, IO, 7.00%, 4/15/2029 | | |
Series 2169, Class TB, 7.00%, 6/15/2029 | | |
Series 2163, Class PC, IO, 7.50%, 6/15/2029 | | |
Series 2172, Class QC, 7.00%, 7/15/2029 | | |
Series 2176, Class OJ, 7.00%, 8/15/2029 | | |
Series 2201, Class C, 8.00%, 11/15/2029 | | |
Series 2209, Class TC, 8.00%, 1/15/2030 | | |
Series 2210, Class Z, 8.00%, 1/15/2030 | | |
Series 2224, Class CB, 8.00%, 3/15/2030 | | |
Series 2230, Class Z, 8.00%, 4/15/2030 | | |
Series 2234, Class PZ, 7.50%, 5/15/2030 | | |
Series 2247, Class Z, 7.50%, 8/15/2030 | | |
Series 2256, Class MC, 7.25%, 9/15/2030 | | |
Series 2259, Class ZM, 7.00%, 10/15/2030 | | |
Series 2262, Class Z, 7.50%, 10/15/2030 | | |
SEE NOTES TO FINANCIAL STATEMENTS.
| JPMorgan Institutional Trust Funds | |
SCHEDULE OF PORTFOLIO INVESTMENTS
AS OF August 31, 2023 (Unaudited) (continued)
| | |
Collateralized Mortgage Obligations — continued |
Series 2271, Class PC, 7.25%, 12/15/2030 | | |
Series 2296, Class PD, 7.00%, 3/15/2031 | | |
Series 2313, Class LA, 6.50%, 5/15/2031 | | |
Series 2325, Class PM, 7.00%, 6/15/2031 | | |
Series 2359, Class ZB, 8.50%, 6/15/2031 | | |
Series 2344, Class ZD, 6.50%, 8/15/2031 | | |
Series 2344, Class ZJ, 6.50%, 8/15/2031 | | |
Series 2345, Class NE, 6.50%, 8/15/2031 | | |
Series 2351, Class PZ, 6.50%, 8/15/2031 | | |
Series 2353, Class AZ, 6.00%, 9/15/2031 | | |
Series 2367, Class ME, 6.50%, 10/15/2031 | | |
Series 2396, Class FM, 5.75%, 12/15/2031 (f) | | |
Series 2399, Class OH, 6.50%, 1/15/2032 | | |
Series 2399, Class TH, 6.50%, 1/15/2032 | | |
Series 2464, Class SI, IF, IO, 2.70%, 2/15/2032 (f) | | |
Series 2410, Class QX, IF, IO, 3.35%, 2/15/2032 (f) | | |
Series 2412, Class SP, IF, 5.49%, 2/15/2032 (f) | | |
Series 2410, Class QS, IF, 5.71%, 2/15/2032 (f) | | |
Series 2410, Class OE, 6.38%, 2/15/2032 | | |
Series 2410, Class NG, 6.50%, 2/15/2032 | | |
Series 2420, Class XK, 6.50%, 2/15/2032 | | |
Series 2444, Class ES, IF, IO, 2.65%, 3/15/2032 (f) | | |
Series 2450, Class SW, IF, IO, 2.70%, 3/15/2032 (f) | | |
Series 2430, Class WF, 6.50%, 3/15/2032 | | |
Series 2423, Class MC, 7.00%, 3/15/2032 | | |
Series 2423, Class MT, 7.00%, 3/15/2032 | | |
Series 2435, Class CJ, 6.50%, 4/15/2032 | | |
Series 2434, Class TC, 7.00%, 4/15/2032 | | |
Series 2436, Class MC, 7.00%, 4/15/2032 | | |
Series 2455, Class GK, 6.50%, 5/15/2032 | | |
Series 2450, Class GZ, 7.00%, 5/15/2032 | | |
Series 2462, Class JG, 6.50%, 6/15/2032 | | |
Series 2466, Class PH, 6.50%, 6/15/2032 | | |
Series 2474, Class NR, 6.50%, 7/15/2032 | | |
Series 2484, Class LZ, 6.50%, 7/15/2032 | | |
Series 2500, Class MC, 6.00%, 9/15/2032 | | |
Series 2835, Class QO, PO, 12/15/2032 | | |
Series 2543, Class YX, 6.00%, 12/15/2032 | | |
Series 2544, Class HC, 6.00%, 12/15/2032 | | |
Series 2552, Class ME, 6.00%, 1/15/2033 | | |
| | |
|
Series 2567, Class QD, 6.00%, 2/15/2033 | | |
Series 2575, Class ME, 6.00%, 2/15/2033 | | |
Series 2596, Class QG, 6.00%, 3/15/2033 | | |
Series 2586, Class WI, IO, 6.50%, 3/15/2033 | | |
Series 2692, Class SC, IF, 2.68%, 7/15/2033 (f) | | |
Series 4240, Class B, 3.00%, 8/15/2033 | | |
Series 3920, Class LP, 5.00%, 1/15/2034 | | |
Series 2744, Class PE, 5.50%, 2/15/2034 | | |
Series 3611, PO, 7/15/2034 | | |
Series 2990, Class UZ, 5.75%, 6/15/2035 | | |
Series 3004, Class EK, 5.50%, 7/15/2035 | | |
Series 3014, Class OD, PO, 8/15/2035 | | |
Series 3085, Class WF, 6.10%, 8/15/2035 (f) | | |
Series 3047, Class OD, 5.50%, 10/15/2035 | | |
Series 3074, Class BH, 5.00%, 11/15/2035 | | |
Series 3064, Class MC, 5.50%, 11/15/2035 | | |
Series 3102, Class HS, IF, 5.12%, 1/15/2036 (f) | | |
Series 3102, Class FB, 5.60%, 1/15/2036 (f) | | |
Series 3117, Class EO, PO, 2/15/2036 | | |
Series 3117, Class OK, PO, 2/15/2036 | | |
Series 3134, PO, 3/15/2036 | | |
Series 3152, Class MO, PO, 3/15/2036 | | |
Series 3122, Class ZB, 6.00%, 3/15/2036 | | |
Series 3138, PO, 4/15/2036 | | |
Series 3607, Class BO, PO, 4/15/2036 | | |
Series 3219, Class DI, IO, 6.00%, 4/15/2036 | | |
Series 3819, Class ZQ, 6.00%, 4/15/2036 | | |
Series 3149, Class SO, PO, 5/15/2036 | | |
Series 3233, Class OP, PO, 5/15/2036 | | |
Series 3171, Class MO, PO, 6/15/2036 | | |
Series 3179, Class OA, PO, 7/15/2036 | | |
Series 3194, Class SA, IF, IO, 1.80%, 7/15/2036 (f) | | |
Series 3211, Class SO, PO, 9/15/2036 | | |
Series 3218, Class AO, PO, 9/15/2036 | | |
Series 3232, Class ST, IF, IO, 1.40%, 10/15/2036 (f) | | |
Series 3256, PO, 12/15/2036 | | |
Series 3261, Class OA, PO, 1/15/2037 | | |
Series 3260, Class CS, IF, IO, 0.84%, 1/15/2037 (f) | | |
Series 3274, Class JO, PO, 2/15/2037 | | |
Series 3275, Class FL, 5.74%, 2/15/2037 (f) | | |
SEE NOTES TO FINANCIAL STATEMENTS.
| JPMorgan Institutional Trust Funds | |
| | |
Collateralized Mortgage Obligations — continued |
Series 3290, Class SB, IF, IO, 1.15%, 3/15/2037 (f) | | |
Series 3318, Class AO, PO, 5/15/2037 | | |
Series 3607, PO, 5/15/2037 | | |
Series 3315, Class HZ, 6.00%, 5/15/2037 | | |
Series 3326, Class JO, PO, 6/15/2037 | | |
Series 3331, PO, 6/15/2037 | | |
Series 3607, Class OP, PO, 7/15/2037 | | |
Series 4048, Class FJ, 4.40%, 7/15/2037 (f) | | |
Series 3385, Class SN, IF, IO, 0.70%, 11/15/2037 (f) | | |
Series 3387, Class SA, IF, IO, 1.12%, 11/15/2037 (f) | | |
Series 3422, Class AI, IO, 0.25%, 1/15/2038 (e) | | |
Series 3404, Class SC, IF, IO, 0.70%, 1/15/2038 (f) | | |
Series 3424, Class PI, IF, IO, 1.50%, 4/15/2038 (f) | | |
Series 3481, Class SJ, IF, IO, 0.55%, 8/15/2038 (f) | | |
Series 3511, Class SA, IF, IO, 0.70%, 2/15/2039 (f) | | |
Series 3549, Class FA, 6.50%, 7/15/2039 (f) | | |
Series 3621, Class BO, PO, 1/15/2040 | | |
Series 3747, Class PY, 4.00%, 10/15/2040 | | |
Series 3925, Class FL, 5.75%, 1/15/2041 (f) | | |
Series 3852, Class QN, IF, 5.50%, 5/15/2041 (f) | | |
Series 3852, Class TP, IF, 5.50%, 5/15/2041 (f) | | |
Series 3957, Class B, 4.00%, 11/15/2041 | | |
Series 3966, Class NA, 4.00%, 12/15/2041 | | |
Series 4217, Class KY, 3.00%, 6/15/2043 | | |
Series 4928, Class PB, 2.50%, 9/25/2048 | | |
| | |
Series 233, Class 11, IO, 5.00%, 9/15/2035 | | |
Series 233, Class 13, IO, 5.00%, 9/15/2035 | | |
Series 299, Class 300, 3.00%, 1/15/2043 | | |
Series 310, PO, 9/15/2043 | | |
Series 323, Class 300, 3.00%, 1/15/2044 | | |
FHLMC, Structured Pass-Through Certificates, Whole Loan | | |
Series T-41, Class 3A, 4.35%, 7/25/2032 (f) | | |
Series T-76, Class 2A, 2.26%, 10/25/2037 (f) | | |
Series T-51, Class 2A, 7.50%, 8/25/2042 (f) | | |
Series T-54, Class 2A, 6.50%, 2/25/2043 | | |
| | |
|
Series T-54, Class 3A, 7.00%, 2/25/2043 | | |
Series T-58, Class A, PO, 9/25/2043 | | |
Series T-59, Class 1AP, PO, 10/25/2043 | | |
First Horizon Alternative Mortgage Securities Trust | | |
Series 2004-AA4, Class A1, 5.39%, 10/25/2034 (f) | | |
Series 2005-FA8, Class 1A19, 5.50%, 11/25/2035 | | |
Series 2007-FA4, Class 1A2, IF, IO, 0.22%, 8/25/2037 (f) | | |
| | |
Series 2004-W1, Class 2A2, 7.00%, 12/25/2033 | | |
Series 2004-W2, Class 2A2, 7.00%, 2/25/2044 | | |
Series 2004-W15, Class 2AF, 5.65%, 8/25/2044 (f) | | |
Series 2005-W3, Class 2AF, 5.62%, 3/25/2045 (f) | | |
Series 2006-W2, Class 1AF1, 5.62%, 2/25/2046 (f) | | |
FNMA, Grantor Trust, Whole Loan | | |
Series 2002-T19, Class A2, 7.00%, 7/25/2042 | | |
Series 2004-T3, Class 1A3, 7.00%, 2/25/2044 | | |
| | |
Series 1993-205, Class H, PO, 9/25/2023 | | |
Series 1993-165, Class SD, IF, 2.56%, 9/25/2023 (f) | | |
Series 1993-165, Class SK, IF, 12.50%, 9/25/2023 (f) | | |
Series 1993-179, Class SB, IF, 4.40%, 10/25/2023 (f) | | |
Series 1999-52, Class NS, IF, 8.25%, 10/25/2023 (f) | | |
Series 1993-179, Class SC, IF, 10.50%, 10/25/2023 (f) | | |
Series 1995-19, Class Z, 6.50%, 11/25/2023 | | |
Series 2002-1, Class UD, IF, 5.59%, 12/25/2023 (f) | | |
Series 1993-230, Class FA, 6.00%, 12/25/2023 (f) | | |
Series 1993-247, Class FE, 6.40%, 12/25/2023 (f) | | |
Series 1993-225, Class UB, 6.50%, 12/25/2023 | | |
Series 1993-247, Class SU, IF, 7.16%, 12/25/2023 (f) | | |
Series 1994-37, Class L, 6.50%, 3/25/2024 | | |
SEE NOTES TO FINANCIAL STATEMENTS.
| JPMorgan Institutional Trust Funds | |
SCHEDULE OF PORTFOLIO INVESTMENTS
AS OF August 31, 2023 (Unaudited) (continued)
| | |
Collateralized Mortgage Obligations — continued |
Series 1994-40, Class Z, 6.50%, 3/25/2024 | | |
Series 2004-53, Class NC, 5.50%, 7/25/2024 | | |
Series 1995-2, Class Z, 8.50%, 1/25/2025 | | |
Series G95-1, Class C, 8.80%, 1/25/2025 | | |
Series 1997-20, IO, 1.84%, 3/25/2027 (f) | | |
Series 1997-27, Class J, 7.50%, 4/18/2027 | | |
Series 1997-29, Class J, 7.50%, 4/20/2027 | | |
Series 1997-39, Class PD, 7.50%, 5/20/2027 | | |
Series 1997-42, Class ZC, 6.50%, 7/18/2027 | | |
Series 1997-81, Class PI, IO, 7.00%, 12/18/2027 | | |
Series 1998-36, Class ZB, 6.00%, 7/18/2028 | | |
Series 1999-18, Class Z, 5.50%, 4/18/2029 | | |
Series 1999-17, Class C, 6.35%, 4/25/2029 | | |
Series 1999-62, Class PB, 7.50%, 12/18/2029 | | |
Series 2000-2, Class ZE, 7.50%, 2/25/2030 | | |
Series 2000-20, Class SA, IF, IO, 3.70%, 7/25/2030 (f) | | |
Series 2000-52, IO, 8.50%, 1/25/2031 | | |
Series 2001-7, Class PF, 7.00%, 3/25/2031 | | |
Series 2011-31, Class DB, 3.50%, 4/25/2031 | | |
Series 2001-33, Class ID, IO, 6.00%, 7/25/2031 | | |
Series 2001-30, Class PM, 7.00%, 7/25/2031 | | |
Series 2001-36, Class DE, 7.00%, 8/25/2031 | | |
Series 2001-49, Class Z, 6.50%, 9/25/2031 | | |
Series 2001-44, Class MY, 7.00%, 9/25/2031 | | |
Series 2001-44, Class PD, 7.00%, 9/25/2031 | | |
Series 2001-44, Class PU, 7.00%, 9/25/2031 | | |
Series 2001-52, Class KB, 6.50%, 10/25/2031 | | |
Series 2003-52, Class SX, IF, 6.74%, 10/25/2031 (f) | | |
Series 2001-61, Class Z, 7.00%, 11/25/2031 | | |
Series 2001-72, Class SX, IF, 4.89%, 12/25/2031 (f) | | |
Series 2002-1, Class SA, IF, 7.63%, 2/25/2032 (f) | | |
Series 2002-13, Class SJ, IF, IO, 1.60%, 3/25/2032 (f) | | |
Series 2002-13, Class ST, IF, 10.00%, 3/25/2032 (f) | | |
Series 2002-21, Class LO, PO, 4/25/2032 | | |
Series 2002-21, Class PE, 6.50%, 4/25/2032 | | |
Series 2002-28, Class PK, 6.50%, 5/25/2032 | | |
Series 2012-66, Class CB, 3.00%, 6/25/2032 | | |
Series 2002-37, Class Z, 6.50%, 6/25/2032 | | |
| | |
|
Series 2006-130, Class GI, IO, 6.50%, 7/25/2032 | | |
Series 2002-48, Class GH, 6.50%, 8/25/2032 | | |
Series 2004-61, Class SK, IF, 8.50%, 11/25/2032 (f) | | |
Series 2004-59, Class BG, PO, 12/25/2032 | | |
Series 2002-77, Class S, IF, 4.58%, 12/25/2032 (f) | | |
Series 2003-22, Class UD, 4.00%, 4/25/2033 | | |
Series 2003-35, Class UC, 3.75%, 5/25/2033 | | |
Series 2003-42, Class GB, 4.00%, 5/25/2033 | | |
Series 2003-34, Class AX, 6.00%, 5/25/2033 | | |
Series 2003-34, Class ED, 6.00%, 5/25/2033 | | |
Series 2003-39, IO, 6.00%, 5/25/2033 (f) | | |
Series 2003-33, Class IA, IO, 6.50%, 5/25/2033 | | |
Series 2007-97, Class KI, IO, 7.00%, 5/25/2033 | | |
Series 2003-47, Class PE, 5.75%, 6/25/2033 | | |
Series 2003-64, Class SX, IF, 0.77%, 7/25/2033 (f) | | |
Series 2003-132, Class OA, PO, 8/25/2033 | | |
Series 2003-74, Class SH, IF, 0.45%, 8/25/2033 (f) | | |
Series 2003-71, Class DS, IF, 0.54%, 8/25/2033 (f) | | |
Series 2003-72, Class IE, IO, 5.50%, 8/25/2033 | | |
Series 2003-91, Class SD, IF, 3.50%, 9/25/2033 (f) | | |
Series 2013-101, Class AE, 3.00%, 10/25/2033 | | |
Series 2013-101, Class E, 3.00%, 10/25/2033 | | |
Series 2013-108, Class GU, 3.00%, 10/25/2033 | | |
Series 2003-116, Class SB, IF, IO, 2.20%, 11/25/2033 (f) | | |
Series 2006-44, Class P, PO, 12/25/2033 | | |
Series 2003-130, Class SX, IF, 3.42%, 1/25/2034 (f) | | |
Series 2004-25, Class SA, IF, 4.67%, 4/25/2034 (f) | | |
Series 2004-46, Class SK, IF, 1.64%, 5/25/2034 (f) | | |
Series 2004-46, Class QB, IF, 2.39%, 5/25/2034 (f) | | |
Series 2004-36, Class SA, IF, 4.67%, 5/25/2034 (f) | | |
SEE NOTES TO FINANCIAL STATEMENTS.
| JPMorgan Institutional Trust Funds | |
| | |
Collateralized Mortgage Obligations — continued |
Series 2004-51, Class SY, IF, 3.44%, 7/25/2034 (f) | | |
Series 2005-74, Class CS, IF, 5.16%, 5/25/2035 (f) | | |
Series 2005-56, Class S, IF, IO, 1.31%, 7/25/2035 (f) | | |
Series 2005-66, Class SG, IF, 3.87%, 7/25/2035 (f) | | |
Series 2005-68, Class PG, 5.50%, 8/25/2035 | | |
Series 2005-84, Class XM, 5.75%, 10/25/2035 | | |
Series 2005-110, Class GL, 5.50%, 12/25/2035 | | |
Series 2006-46, Class UC, 5.50%, 12/25/2035 | | |
Series 2005-109, Class PC, 6.00%, 12/25/2035 | | |
Series 2006-39, Class WC, 5.50%, 1/25/2036 | | |
Series 2006-16, Class OA, PO, 3/25/2036 | | |
Series 2006-22, Class AO, PO, 4/25/2036 | | |
Series 2006-23, Class KO, PO, 4/25/2036 | | |
Series 2006-44, Class GO, PO, 6/25/2036 | | |
Series 2006-53, Class US, IF, IO, 1.18%, 6/25/2036 (f) | | |
Series 2006-56, PO, 7/25/2036 | | |
Series 2006-58, PO, 7/25/2036 | | |
Series 2006-58, Class AP, PO, 7/25/2036 | | |
Series 2006-65, Class QO, PO, 7/25/2036 | | |
Series 2006-56, Class FC, 5.69%, 7/25/2036 (f) | | |
Series 2006-58, Class FL, 5.86%, 7/25/2036 (f) | | |
Series 2006-60, Class DZ, 6.50%, 7/25/2036 | | |
Series 2006-72, Class TO, PO, 8/25/2036 | | |
Series 2006-79, Class DO, PO, 8/25/2036 | | |
Series 2007-7, Class SG, IF, IO, 1.10%, 8/25/2036 (f) | | |
Series 2006-77, Class PC, 6.50%, 8/25/2036 | | |
Series 2006-90, Class AO, PO, 9/25/2036 | | |
Series 2008-42, Class AO, PO, 9/25/2036 | | |
Series 2009-19, Class IP, IO, 5.50%, 10/25/2036 | | |
Series 2006-109, PO, 11/25/2036 | | |
Series 2006-110, PO, 11/25/2036 | | |
Series 2006-111, Class EO, PO, 11/25/2036 | | |
Series 2006-124, Class HB, 3.95%, 11/25/2036 (f) | | |
Series 2006-119, PO, 12/25/2036 | | |
| | |
|
Series 2006-118, Class A2, 5.57%, 12/25/2036 (f) | | |
Series 2009-70, Class CO, PO, 1/25/2037 | | |
Series 2006-128, Class BP, 5.50%, 1/25/2037 | | |
Series 2007-14, Class ES, IF, IO, 1.04%, 3/25/2037 (f) | | |
Series 2007-77, Class FG, 5.90%, 3/25/2037 (f) | | |
Series 2007-16, Class FC, 6.15%, 3/25/2037 (f) | | |
Series 2007-42, Class AO, PO, 5/25/2037 | | |
Series 2007-48, PO, 5/25/2037 | | |
Series 2007-60, Class AX, IF, IO, 1.75%, 7/25/2037 (f) | | |
Series 2007-81, Class GE, 6.00%, 8/25/2037 | | |
Series 2007-88, Class VI, IF, IO, 1.14%, 9/25/2037 (f) | | |
Series 2007-91, Class ES, IF, IO, 1.06%, 10/25/2037 (f) | | |
Series 2007-116, Class HI, IO, 0.17%, 1/25/2038 (f) | | |
Series 2008-1, Class BI, IF, IO, 0.51%, 2/25/2038 (f) | | |
Series 2008-16, Class IS, IF, IO, 0.80%, 3/25/2038 (f) | | |
Series 2008-10, Class XI, IF, IO, 0.83%, 3/25/2038 (f) | | |
Series 2008-27, Class SN, IF, IO, 1.50%, 4/25/2038 (f) | | |
Series 2008-44, PO, 5/25/2038 | | |
Series 2008-53, Class CI, IF, IO, 1.80%, 7/25/2038 (f) | | |
Series 2008-80, Class SA, IF, IO, 0.45%, 9/25/2038 (f) | | |
Series 2008-81, Class SB, IF, IO, 0.45%, 9/25/2038 (f) | | |
Series 2009-6, Class GS, IF, IO, 1.15%, 2/25/2039 (f) | | |
Series 2009-60, Class HT, 6.00%, 8/25/2039 | | |
Series 2009-99, Class SC, IF, IO, 0.78%, 12/25/2039 (f) | | |
Series 2009-103, Class MB, 4.89%, 12/25/2039 (f) | | |
Series 2010-49, Class SC, IF, 1.86%, 3/25/2040 (f) | | |
Series 2010-64, Class DM, 5.00%, 6/25/2040 | | |
Series 2010-71, Class HJ, 5.50%, 7/25/2040 | | |
SEE NOTES TO FINANCIAL STATEMENTS.
| JPMorgan Institutional Trust Funds | |
SCHEDULE OF PORTFOLIO INVESTMENTS
AS OF August 31, 2023 (Unaudited) (continued)
| | |
Collateralized Mortgage Obligations — continued |
Series 2010-147, Class SA, IF, IO, 1.13%, 1/25/2041 (f) | | |
Series 2011-30, Class LS, IO, 1.56%, 4/25/2041 (f) | | |
Series 2011-75, Class FA, 5.95%, 8/25/2041 (f) | | |
Series 2011-118, Class MT, 7.00%, 11/25/2041 | | |
Series 2011-130, Class CA, 6.00%, 12/25/2041 | | |
Series 2013-81, Class TA, 3.00%, 2/25/2043 | | |
Series 2013-92, PO, 9/25/2043 | | |
Series 2013-90, Class PM, 3.50%, 9/25/2043 | | |
Series 2013-101, Class DO, PO, 10/25/2043 | | |
Series 2013-128, PO, 12/25/2043 | | |
Series 2011-2, Class WA, 5.86%, 2/25/2051 (f) | | |
FNMA, REMIC Trust, Whole Loan | | |
Series 2007-W7, Class 1A4, IF, 6.77%, 7/25/2037 (f) | | |
Series 2003-W4, Class 2A, 5.10%, 10/25/2042 (f) | | |
Series 2003-W1, Class 1A1, 4.80%, 12/25/2042 (f) | | |
Series 2003-W1, Class 2A, 5.21%, 12/25/2042 (f) | | |
Series 2009-W1, Class A, 6.00%, 12/25/2049 | | |
| | |
Series 2007-101, Class A2, 4.61%, 6/27/2036 (f) | | |
Series 2007-54, Class FA, 5.80%, 6/25/2037 (f) | | |
Series 2007-106, Class A7, 6.04%, 10/25/2037 (f) | | |
| | |
Series 265, Class 2, 9.00%, 3/25/2024 | | |
Series 329, Class 1, PO, 1/25/2033 | | |
Series 345, Class 6, IO, 5.00%, 12/25/2033 (f) | | |
Series 351, Class 7, IO, 5.00%, 4/25/2034 (f) | | |
Series 355, Class 11, IO, 6.00%, 7/25/2034 | | |
Series 365, Class 8, IO, 5.50%, 5/25/2036 | | |
Series 374, Class 5, IO, 5.50%, 8/25/2036 | | |
Series 393, Class 6, IO, 5.50%, 4/25/2037 | | |
Series 383, Class 32, IO, 6.00%, 1/25/2038 | | |
Series 383, Class 33, IO, 6.00%, 1/25/2038 | | |
GMACM Mortgage Loan Trust Series 2005-AR3, Class 3A4, 3.87%, 6/19/2035 (f) | | |
| | |
|
| | |
Series 2001-35, Class SA, IF, IO, 2.82%, 8/16/2031 (f) | | |
Series 2002-52, Class GH, 6.50%, 7/20/2032 | | |
Series 2003-58, Class BE, 6.50%, 1/20/2033 | | |
Series 2003-12, Class SP, IF, IO, 2.27%, 2/20/2033 (f) | | |
Series 2003-46, Class MG, 6.50%, 5/20/2033 | | |
Series 2003-52, Class AP, PO, 6/16/2033 | | |
Series 2003-112, Class SA, IF, IO, 1.12%, 12/16/2033 (f) | | |
Series 2004-28, Class S, IF, 4.74%, 4/16/2034 (f) | | |
Series 2004-90, Class SI, IF, IO, 0.67%, 10/20/2034 (f) | | |
Series 2005-68, Class DP, IF, 3.36%, 6/17/2035 (f) | | |
Series 2010-14, Class CO, PO, 8/20/2035 | | |
Series 2005-58, Class NI, IO, 5.50%, 8/20/2035 (f) | | |
Series 2005-68, Class KI, IF, IO, 0.87%, 9/20/2035 (f) | | |
Series 2005-91, Class PI, IO, 6.00%, 12/20/2035 | | |
Series 2006-16, Class OP, PO, 3/20/2036 | | |
Series 2006-38, Class ZK, 6.50%, 8/20/2036 | | |
Series 2006-59, Class SD, IF, IO, 1.27%, 10/20/2036 (f) | | |
Series 2006-65, Class SA, IF, IO, 1.37%, 11/20/2036 (f) | | |
Series 2011-22, Class WA, 5.87%, 2/20/2037 (f) | | |
Series 2007-57, PO, 3/20/2037 | | |
Series 2007-17, Class JO, PO, 4/16/2037 | | |
Series 2007-17, Class JI, IF, IO, 1.38%, 4/16/2037 (f) | | |
Series 2007-19, Class SD, IF, IO, 0.77%, 4/20/2037 (f) | | |
Series 2007-28, Class BO, PO, 5/20/2037 | | |
Series 2007-26, Class SC, IF, IO, 0.77%, 5/20/2037 (f) | | |
Series 2007-27, Class SA, IF, IO, 0.77%, 5/20/2037 (f) | | |
Series 2007-36, Class SE, IF, IO, 1.04%, 6/16/2037 (f) | | |
Series 2007-47, Class PH, 6.00%, 7/16/2037 | | |
Series 2007-40, Class SB, IF, IO, 1.32%, 7/20/2037 (f) | | |
SEE NOTES TO FINANCIAL STATEMENTS.
| JPMorgan Institutional Trust Funds | |
| | |
Collateralized Mortgage Obligations — continued |
Series 2007-42, Class SB, IF, IO, 1.32%, 7/20/2037 (f) | | |
Series 2007-53, Class SW, IF, 3.92%, 9/20/2037 (f) | | |
Series 2009-79, Class OK, PO, 11/16/2037 | | |
Series 2007-73, Class MI, IF, IO, 0.57%, 11/20/2037 (f) | | |
Series 2007-76, Class SA, IF, IO, 1.10%, 11/20/2037 (f) | | |
Series 2007-72, Class US, IF, IO, 1.12%, 11/20/2037 (f) | | |
Series 2007-79, Class SY, IF, IO, 1.12%, 12/20/2037 (f) | | |
Series 2008-2, Class NS, IF, IO, 1.11%, 1/16/2038 (f) | | |
Series 2008-2, Class MS, IF, IO, 1.73%, 1/16/2038 (f) | | |
Series 2008-10, Class S, IF, IO, 0.40%, 2/20/2038 (f) | | |
Series 2008-36, Class SH, IF, IO, 0.87%, 4/20/2038 (f) | | |
Series 2008-40, Class SA, IF, IO, 0.97%, 5/16/2038 (f) | | |
Series 2008-55, Class SA, IF, IO, 0.77%, 6/20/2038 (f) | | |
Series 2008-71, Class SC, IF, IO, 0.57%, 8/20/2038 (f) | | |
Series 2009-25, Class SE, IF, IO, 2.17%, 9/20/2038 (f) | | |
Series 2008-93, Class AS, IF, IO, 0.27%, 12/20/2038 (f) | | |
Series 2009-6, Class SA, IF, IO, 0.67%, 2/16/2039 (f) | | |
Series 2009-12, Class IE, IO, 5.50%, 3/20/2039 | | |
Series 2009-14, Class KI, IO, 6.50%, 3/20/2039 | | |
Series 2009-14, Class NI, IO, 6.50%, 3/20/2039 | | |
Series 2009-22, Class SA, IF, IO, 0.84%, 4/20/2039 (f) | | |
Series 2009-33, Class CI, IO, 5.50%, 5/20/2039 | | |
Series 2009-33, Class TI, IO, 6.00%, 5/20/2039 | | |
Series 2009-43, Class SA, IF, IO, 0.52%, 6/20/2039 (f) | | |
Series 2009-72, Class SM, IF, IO, 0.82%, 8/16/2039 (f) | | |
| | |
|
Series 2010-31, Class NO, PO, 3/20/2040 | | |
Series 2013-75, Class WA, 5.11%, 6/20/2040 (f) | | |
Series 2010-130, Class CP, 7.00%, 10/16/2040 | | |
Series 2010-157, Class OP, PO, 12/20/2040 | | |
Series 2011-75, Class SM, IF, IO, 1.17%, 5/20/2041 (f) | | |
Series 2014-188, Class W, 4.56%, 10/20/2041 (f) | | |
Series 2012-141, Class WC, 3.71%, 1/20/2042 (f) | | |
Series 2013-54, Class WA, 4.90%, 11/20/2042 (f) | | |
Series 2013-91, Class WA, 4.44%, 4/20/2043 (f) | | |
Series 2013-116, Class JY, 4.00%, 8/16/2043 | | |
Series 2018-160, Class PA, 3.50%, 7/20/2046 | | |
Series 2012-H24, Class FG, 5.59%, 4/20/2060 (f) | | |
Series 2013-H03, Class FA, 5.56%, 8/20/2060 (f) | | |
Series 2012-H21, Class CF, 4.87%, 5/20/2061 (f) | | |
Series 2013-H05, Class FB, 4.96%, 2/20/2062 (f) | | |
Series 2012-H15, Class FA, 5.50%, 5/20/2062 (f) | | |
Series 2012-H26, Class MA, 4.88%, 7/20/2062 (f) | | |
Series 2012-H28, Class FA, 4.97%, 9/20/2062 (f) | | |
Series 2012-H29, Class FA, 5.77%, 10/20/2062 (f) | | |
Series 2012-H31, Class FD, 5.60%, 12/20/2062 (f) | | |
Series 2013-H01, Class FA, 1.65%, 1/20/2063 | | |
Series 2013-H04, Class BA, 1.65%, 2/20/2063 | | |
Series 2013-H08, Class FC, 5.71%, 2/20/2063 (f) | | |
Series 2013-H07, Class HA, 5.67%, 3/20/2063 (f) | | |
Series 2013-H09, Class HA, 1.65%, 4/20/2063 | | |
Series 2013-H18, Class JA, 5.86%, 8/20/2063 (f) | | |
Series 2014-H01, Class FD, 5.87%, 1/20/2064 (f) | | |
SEE NOTES TO FINANCIAL STATEMENTS.
| JPMorgan Institutional Trust Funds | |
SCHEDULE OF PORTFOLIO INVESTMENTS
AS OF August 31, 2023 (Unaudited) (continued)
| | |
Collateralized Mortgage Obligations — continued |
Series 2014-H09, Class TA, 5.82%, 4/20/2064 (f) | | |
Series 2015-H15, Class FD, 5.66%, 6/20/2065 (f) | | |
Series 2015-H15, Class FJ, 5.66%, 6/20/2065 (f) | | |
Series 2015-H16, Class FG, 5.66%, 7/20/2065 (f) | | |
Series 2015-H23, Class FB, 5.74%, 9/20/2065 (f) | | |
Series 2015-H32, Class FH, 5.88%, 12/20/2065 (f) | | |
Series 2017-H08, Class XI, IO, 0.07%, 3/20/2067 (f) | | |
Series 2021-H14, Class CF, 6.64%, 9/20/2071 (f) | | |
GSMPS Mortgage Loan Trust | | |
Series 2001-2, Class A, 7.50%, 6/19/2032 (b) (f) | | |
Series 2005-RP3, Class 1AS, IO, 3.73%, 9/25/2035 (b) (f) | | |
Series 2005-RP3, Class 1AF, 5.78%, 9/25/2035 (b) (f) | | |
Series 2006-RP2, Class 1AS2, IF, IO, 0.61%, 4/25/2036 ‡ (b) (f) | | |
| | |
Series 2004-6F, Class 3A4, 6.50%, 5/25/2034 | | |
Series 2004-8F, Class 2A3, 6.00%, 9/25/2034 | | |
Series 2004-13F, Class 3A3, 6.00%, 11/25/2034 | | |
Series 2005-4F, Class AP, PO, 5/25/2035 | | |
Series 2005-7F, Class 3A9, 6.00%, 9/25/2035 | | |
Series 2006-1F, Class 2A4, 6.00%, 2/25/2036 | | |
| | |
Series 2004-7, Class 1A1, 6.17%, 11/25/2034 (f) | | |
Series 2005-4, Class 2A1, 6.03%, 5/25/2035 (f) | | |
Impac Secured Assets Trust Series 2006-1, Class 2A1, 6.13%, 5/25/2036 (f) | | |
| | |
Series 2006-A2, Class 5A3, 4.59%, 11/25/2033 (f) | | |
Series 2006-A3, Class 6A1, 4.73%, 8/25/2034 (f) | | |
Series 2006-A2, Class 4A1, 5.59%, 8/25/2034 (f) | | |
| | |
|
| | |
Series 2006-2, Class 1A1, 5.88%, 4/25/2036 (f) | | |
Series 2008-2, Class 1A6, 6.00%, 3/25/2038 | | |
LHOME Mortgage Trust Series 2021-RTL1, Class A1, 2.09%, 2/25/2026 (b) (f) | | |
MASTR Adjustable Rate Mortgages Trust | | |
Series 2004-13, Class 2A1, 4.71%, 4/21/2034 (f) | | |
Series 2004-4, Class 2A1, 3.81%, 5/25/2034 (f) | | |
Series 2004-13, Class 3A7, 5.21%, 11/21/2034 (f) | | |
Series 2004-15, Class 3A1, 4.44%, 12/25/2034 (f) | | |
MASTR Alternative Loan Trust | | |
Series 2004-10, Class 1A1, 4.50%, 9/25/2019 | | |
Series 2004-8, Class 6A1, 5.50%, 9/25/2019 | | |
Series 2004-4, Class 10A1, 5.00%, 5/25/2024 | | |
Series 2003-3, Class 1A1, 6.50%, 5/25/2033 | | |
Series 2003-9, Class 8A1, 6.00%, 1/25/2034 | | |
Series 2004-3, Class 2A1, 6.25%, 4/25/2034 | | |
Series 2004-6, Class 30, PO, 7/25/2034 | | |
Series 2004-6, Class 7A1, 6.00%, 7/25/2034 | | |
Series 2004-7, Class 30, PO, 8/25/2034 | | |
MASTR Asset Securitization Trust | | |
Series 2004-6, Class 15, PO, 7/25/2019 ‡ | | |
Series 2003-12, Class 30, PO, 12/25/2033 | | |
Series 2004-1, Class 30, PO, 2/25/2034 | | |
MASTR Reperforming Loan Trust Series 2005-2, Class 1A1F, 5.78%, 5/25/2035 (b) (f) | | |
MASTR Resecuritization Trust Series 2005-PO, Class 3, PO, 5/28/2035 (b) | | |
Merrill Lynch Mortgage Investors Trust | | |
Series 2003-E, Class A1, 6.05%, 10/25/2028 (f) | | |
Series 2003-F, Class A1, 6.07%, 10/25/2028 (f) | | |
Series 2004-A, Class A1, 5.89%, 4/25/2029 (f) | | |
Series 2004-1, Class 2A1, 4.39%, 12/25/2034 (f) | | |
NACC Reperforming Loan REMIC Trust Series 2004-R2, Class A1, 6.50%, 10/25/2034 (b) (f) | | |
Nomura Asset Acceptance Corp. Alternative Loan Trust | | |
Series 2003-A1, Class A5, 7.00%, 4/25/2033 | | |
Series 2003-A1, Class A1, 5.50%, 5/25/2033 | | |
SEE NOTES TO FINANCIAL STATEMENTS.
| JPMorgan Institutional Trust Funds | |
| | |
Collateralized Mortgage Obligations — continued |
Series 2003-A1, Class A2, 6.00%, 5/25/2033 | | |
| | |
Series 2002-QS16, Class A3, IF, 5.27%, 10/25/2017 ‡ (f) | | |
Series 2003-QS9, Class A3, IF, IO, 2.12%, 5/25/2018 ‡ (f) | | |
Series 2003-QS12, Class A2A, IF, IO, 2.17%, 6/25/2018 ‡ (f) | | |
Series 2003-QS12, Class A5, IO, 5.00%, 6/25/2018 ‡ (h) | | |
Series 2004-QA6, Class NB2, 3.98%, 12/26/2034 (f) | | |
SART Series 2017-1, 4.75%, 7/15/2024 ‡ | | |
Seasoned Credit Risk Transfer Trust | | |
Series 2019-1, Class MT, 3.50%, 7/25/2058 | | |
Series 2019-3, Class MB, 3.50%, 10/25/2058 | | |
Series 2022-1, Class MTU, 3.25%, 11/25/2061 | | |
Series 2023-1, Class MT, 3.00%, 10/25/2062 | | |
Structured Asset Mortgage Investments II Trust Series 2004-AR5, Class 1A1, 6.09%, 10/19/2034 (f) | | |
Thornburg Mortgage Securities Trust | | |
Series 2003-4, Class A1, 6.07%, 9/25/2043 (f) | | |
Series 2004-4, Class 3A, 3.75%, 12/25/2044 (f) | | |
Towd Point Mortgage Trust Series 2021-R1, Class A1, 2.92%, 11/30/2060 (b) (f) | | |
| | |
Series 1994-1, Class 1, 4.43%, 2/15/2024 (f) | | |
Series 1994-1, Class 2ZB, 6.50%, 2/15/2024 | | |
Series 1996-1, Class 1Z, 6.75%, 2/15/2026 | | |
Series 1996-2, Class 1Z, 6.75%, 6/15/2026 | | |
Series 1997-1, Class 2Z, 7.50%, 2/15/2027 | | |
Series 1998-1, Class 2E, 7.00%, 3/15/2028 | | |
Series 1999-1, Class 2Z, 6.50%, 1/15/2029 | | |
Series 2003-2, Class Z, 5.00%, 5/15/2033 | | |
VM Master Issuer LLC Series 2022-1, Class A1, 5.16%, 5/24/2025 ‡ (b) (f) | | |
WaMu Mortgage Pass-Through Certificates Series 2004-RS2, Class A4, 5.00%, 11/25/2033 | | |
WaMu Mortgage Pass-Through Certificates Trust | | |
Series 2003-AR8, Class A, 5.63%, 8/25/2033 (f) | | |
Series 2003-AR9, Class 1A6, 4.85%, 9/25/2033 (f) | | |
Series 2003-AR9, Class 2A, 5.91%, 9/25/2033 (f) | | |
| | |
|
Series 2003-S9, Class P, PO, 10/25/2033 | | |
Series 2003-S9, Class A8, 5.25%, 10/25/2033 | | |
Series 2004-AR3, Class A1, 4.52%, 6/25/2034 (f) | | |
Series 2004-AR3, Class A2, 4.52%, 6/25/2034 (f) | | |
Series 2006-AR10, Class 2P, 4.04%, 9/25/2036 (f) | | |
Series 2006-AR12, Class 2P, 3.38%, 10/25/2036 (f) | | |
Washington Mutual Mortgage Pass-Through Certificates WMALT Trust | | |
Series 2005-2, Class 2A3, IF, IO, 4.54%, 4/25/2035 (f) | | |
Series 2005-2, Class 1A4, IF, IO, 4.59%, 4/25/2035 (f) | | |
Series 2005-3, Class CX, IO, 5.50%, 5/25/2035 | | |
Series 2005-4, Class CB7, 5.50%, 6/25/2035 | | |
Series 2005-4, Class CX, IO, 5.50%, 6/25/2035 | | |
Series 2005-6, Class 2A4, 5.50%, 8/25/2035 | | |
Series 2005-6, Class 2A9, 5.50%, 8/25/2035 | | |
Wells Fargo Mortgage-Backed Securities Trust Series 2007-7, Class A7, 6.00%, 6/25/2037 | | |
Total Collateralized Mortgage Obligations
(Cost $129,848) | | |
Commercial Mortgage-Backed Securities — 4.3% |
BAMLL Commercial Mortgage Securities Trust Series 2014-520M, Class C, 4.35%, 8/15/2046 (b) (f) | | |
BB-UBS Trust Series 2012-SHOW, Class A, 3.43%, 11/5/2036 (b) | | |
Bear Stearns Commercial Mortgage Securities Trust Series 2005-PWR8, Class X1, IO, 0.72%, 6/11/2041 (b) (f) | | |
Commercial Mortgage Trust Series 2013-300P, Class A1, 4.35%, 8/10/2030 (b) | | |
FHLMC, Multi-Family Structured Credit Risk Series 2021-MN2, Class M1, 7.09%, 7/25/2041 (b) (f) | | |
FHLMC, Multi-Family Structured Pass-Through Certificates | | |
Series K065, Class A2, 3.24%, 4/25/2027 | | |
Series K065, Class AM, 3.33%, 5/25/2027 | | |
Series K070, Class A2, 3.30%, 11/25/2027 (f) | | |
Series K138, Class AM, 1.89%, 1/25/2032 | | |
Series K146, Class A2, 2.92%, 6/25/2032 | | |
Series K-150, Class A2, 3.71%, 9/25/2032 (f) | | |
SEE NOTES TO FINANCIAL STATEMENTS.
| JPMorgan Institutional Trust Funds | |
SCHEDULE OF PORTFOLIO INVESTMENTS
AS OF August 31, 2023 (Unaudited) (continued)
| | |
Commercial Mortgage-Backed Securities — continued |
Series K-151, Class A2, 3.80%, 10/25/2032 (f) | | |
Series K-153, Class A2, 3.82%, 12/25/2032 (f) | | |
| | |
Series 2014-M3, Class A2, 3.50%, 1/25/2024 (f) | | |
Series 2017-M3, Class A2, 2.55%, 12/25/2026 (f) | | |
Series 2015-M10, Class A2, 3.09%, 4/25/2027 (f) | | |
Series 2017-M8, Class A2, 3.06%, 5/25/2027 (f) | | |
Series 2018-M8, Class A2, 3.41%, 6/25/2028 (f) | | |
Series 2018-M10, Class A2, 3.47%, 7/25/2028 (f) | | |
Series 2017-M5, Class A2, 3.17%, 4/25/2029 (f) | | |
Series 2020-M50, Class A2, 1.20%, 10/25/2030 | | |
Series 2020-M50, Class X1, IO, 1.93%, 10/25/2030 (f) | | |
Series 2022-M1S, Class A2, 2.15%, 4/25/2032 (f) | | |
Series 2022-M13, Class A2, 2.68%, 6/25/2032 (f) | | |
Series 2022-M2S, Class A2, 3.88%, 8/25/2032 (f) | | |
Series 2021-M3, Class 1A1, 1.00%, 11/25/2033 | | |
Series 2021-M3, Class X1, IO, 2.05%, 11/25/2033 (f) | | |
| | |
Series 2019-KBF3, Class B, 7.72%, 1/25/2029 (b) (f) | | |
Series 2014-K39, Class C, 4.28%, 8/25/2047 (b) (f) | | |
Series 2020-K737, Class B, 3.42%, 1/25/2053 (b) (f) | | |
Ladder Capital Commercial Mortgage Trust Series 2013-GCP, Class A2, 3.99%, 2/15/2036 (b) | | |
| | |
Series 2019-PARK, Class A, 2.72%, 12/15/2036 (b) | | |
Series 2019-PARK, Class D, 2.72%, 12/15/2036 (b) | | |
P4 SFR Series 2019-STl A7.25%, 10/11/2026 ‡ | | |
RBS Commercial Funding, Inc. Trust Series 2013-SMV, Class A, 3.26%, 3/11/2031 (b) | | |
| | |
|
SLG Office Trust Series 2021-OVA, Class A, 2.59%, 7/15/2041 (b) | | |
UBS-BAMLL Trust Series 2012-WRM, Class A, 3.66%, 6/10/2030 (b) | | |
UBS-Barclays Commercial Mortgage Trust Series 2012-C2, Class XA, IO, 0.71%, 5/10/2063 (b) (f) | | |
WFRBS Commercial Mortgage Trust Series 2013-C11, Class D, 4.13%, 3/15/2045 (b) (f) | | |
Total Commercial Mortgage-Backed Securities
(Cost $96,976) | | |
Municipal Bonds — 0.5% (i) |
|
City of Los Angeles Department of Airports, Federally Taxable Build America Bonds Direct Payment to Issuer Series 2009C, Rev., 6.58%, 5/15/2039 | | |
State of California, Various Purpose GO, 7.30%, 10/1/2039 | | |
| | |
|
New York State Dormitory Authority, State Personal Income Tax, General Purpose Series 2010D, Rev., 5.60%, 3/15/2040 | | |
Port Authority of New York and New Jersey, Consolidated | | |
Series 164, Rev., 5.65%, 11/1/2040 | | |
Series 165, Rev., 5.65%, 11/1/2040 | | |
Series 174, Rev., 4.46%, 10/1/2062 | | |
| | |
|
American Municipal Power, Inc., Meldahl Hydroelectric Project Series 2010B, Rev., 7.50%, 2/15/2050 | | |
Ohio State University (The), General Receipts | | |
Series 2016A, Rev., 4.05%, 12/1/2056 | | |
Series 2011A, Rev., 4.80%, 6/1/2111 | | |
Ohio University, General Receipts, Federally Taxable Rev., 5.59%, 12/1/2114 | | |
| | |
|
Oklahoma Development Finance Authority, Natural Gas Co. Series 2022, Rev., 4.71%, 5/1/2052 | | |
SEE NOTES TO FINANCIAL STATEMENTS.
| JPMorgan Institutional Trust Funds | |
| | |
Municipal Bonds — continued |
|
Texas Natural Gas Securitization Finance Corp., Winter Storm URI | | |
Series 2023A-1, Rev., 5.10%, 4/1/2035 | | |
Series 2023A-2, Rev., 5.17%, 4/1/2041 | | |
| | |
Total Municipal Bonds
(Cost $11,493) | | |
U.S. Government Agency Securities — 0.4% |
Tennessee Valley Authority | | |
| | |
| | |
Tennessee Valley Authority STRIPS
DN, 5.55%, 6/15/2035 (a) | | |
Total U.S. Government Agency Securities
(Cost $9,329) | | |
Foreign Government Securities — 0.3% |
| | |
| | |
| | |
Republic of Chile 2.55%, 1/27/2032 | | |
Republic of Panama 4.50%, 4/16/2050 | | |
Republic of Peru 5.63%, 11/18/2050 | | |
| | |
| | |
| | |
| | |
| | |
| | |
| | |
Total Foreign Government Securities
(Cost $8,947) | | |
Loan Assignments — 0.1% (c) (j) |
|
OneSky Loan Trust, 1st Lien Term Loan (3-MONTH SOFR + 3.00%), 3.88%, 1/15/2031
(Cost $2,999) | | |
| | |
Short-Term Investments — 2.8% |
Investment Companies — 2.8% |
JPMorgan Prime Money Market Fund Class Institutional Shares, 5.38% (k) (l)
(Cost $58,285) | | |
Total Investments — 100.4%
(Cost $2,322,392) | | |
Liabilities in Excess of Other Assets — (0.4)% | | |
| | |
Percentages indicated are based on net assets. |
Amounts presented as a dash ("-") represent amounts that round to less than a thousand. |
| |
| |
| Alternative Credit Enhancement Securities |
| Adjustable Rate Mortgage. The interest rate shown is the rate in effect as of August 31, 2023. |
| Collateralized Loan Obligations |
| Chicago Mercantile Exchange |
| Credit Suisse Mortgage Trust |
| |
| Federal Home Loan Mortgage Corp. |
| Federal National Mortgage Association |
| |
| Government National Mortgage Association |
| |
| Intercontinental Exchange |
| Inverse Floaters represent securities that pay interest at a rate that increases (decreases) with a decline (incline) in a specified index or have an interest rate that adjusts periodically based on changes in current interest rates and prepayments on the underlying pool of assets. The interest rate shown is the rate in effect as of August 31, 2023. The rate may be subject to a cap and floor. |
| Interest Only represents the right to receive the monthly interest payments on an underlying pool of mortgage loans. The principal amount shown represents the par value on the underlying pool. The yields on these securities are subject to accelerated principal paydowns as a result of prepayment or refinancing of the underlying pool of mortgage instruments. As a result, interest income may be reduced considerably. |
| London Interbank Offered Rate |
| Principal Only represents the right to receive the principal portion only on an underlying pool of mortgage loans. The market value of these securities is extremely volatile in response to changes in market interest rates. As prepayments on the underlying mortgages of these securities increase, the yield on these securities increases. |
| Real Estate Investment Trust |
SEE NOTES TO FINANCIAL STATEMENTS.
| JPMorgan Institutional Trust Funds | |
SCHEDULE OF PORTFOLIO INVESTMENTS
AS OF August 31, 2023 (Unaudited) (continued)
| Real Estate Mortgage Investment Conduit |
| |
| Secured Overnight Financing Rate |
| Separate Trading of Registered Interest and Principal of Securities. The STRIPS Program lets investors hold and trade individual interest and principal components of eligible notes and bonds as separate securities. |
| To Be Announced; Security is subject to delayed delivery. |
| Uniform Mortgage-Backed Securities |
| |
| Amount rounds to less than 0.1% of net assets. |
| Value determined using significant unobservable inputs. | |
| The rate shown is the effective yield as of August 31, 2023. | |
| Securities exempt from registration under Rule 144A or section 4(a)(2), of the Securities Act of 1933, as amended. | |
| Variable or floating rate security, linked to the referenced benchmark. The interest rate shown is the current rate as of August 31, 2023. | |
| Contingent Capital security (“CoCo”). CoCos are hybrid debt securities that may be convertible into equity or may be written down if a pre-specified trigger event occurs. The total value of aggregate CoCo holdings at August 31, 2023 is $2,512 or 0.12% of the Fund’s net assets as of August 31, 2023. | |
| Step bond. Interest rate is a fixed rate for an initial period that either resets at a specific date or may reset in the future contingent upon a predetermined trigger. The interest rate shown is the current rate as of August 31, 2023. | |
| Variable or floating rate security, the interest rate of which adjusts periodically based on changes in current interest rates and prepayments on the underlying pool of assets. The interest rate shown is the current rate as of August 31, 2023. | |
| All or a portion of the security is a when-issued security, delayed delivery security, or forward commitment. | |
| | |
| The date shown represents the earliest of the prerefunded date, next put date or final maturity date. | |
| Loan assignments are presented by obligor. Each series or loan tranche underlying each obligor may have varying terms. | |
| Investment in an affiliated fund, which is registered under the Investment Company Act of 1940, as amended, and is advised by J.P. Morgan Investment Management Inc. | |
| The rate shown is the current yield as of August 31, 2023. | |
SEE NOTES TO FINANCIAL STATEMENTS.
| JPMorgan Institutional Trust Funds | |
Futures contracts outstanding as of August 31, 2023 (amounts in thousands, except number of contracts):
| | | | | VALUE AND
UNREALIZED
APPRECIATION
(DEPRECIATION) ($) |
| | | | | |
U.S. Treasury 10 Year Note | | | | | |
U.S. Treasury 10 Year Ultra Note | | | | | |
| | | | | |
U.S. Treasury 2 Year Note | | | | | |
U.S. Treasury 5 Year Note | | | | | |
| | | | | |
| | | | | |
| | | | | |
| | | | | |
SEE NOTES TO FINANCIAL STATEMENTS.
| JPMorgan Institutional Trust Funds | |
JPMorgan Intermediate Bond Trust
SCHEDULE OF PORTFOLIO INVESTMENTS
AS OF August 31, 2023 (Unaudited)
| | |
U.S. Treasury Obligations — 33.9% |
| | |
| | |
| | |
| | |
| | |
| | |
| | |
| | |
| | |
| | |
| | |
| | |
| | |
| | |
| | |
| | |
| | |
| | |
| | |
| | |
U.S. Treasury STRIPS Bonds | | |
| | |
| | |
| | |
| | |
| | |
| | |
| | |
| | |
| | |
| | |
| | |
| | |
Total U.S. Treasury Obligations
(Cost $29,719) | | |
|
Aerospace & Defense — 0.8% |
| | |
| | |
| | |
| | |
L3Harris Technologies, Inc. 3.85%, 12/15/2026 | | |
Leidos, Inc. 2.30%, 2/15/2031 | | |
Northrop Grumman Corp. 2.93%, 1/15/2025 | | |
| | |
|
Aerospace & Defense — continued |
RTX Corp. 4.13%, 11/16/2028 | | |
Textron, Inc. 3.00%, 6/1/2030 | | |
| | |
Automobile Components — 0.0% ^ |
Lear Corp. 2.60%, 1/15/2032 | | |
|
General Motors Co. 6.13%, 10/1/2025 | | |
Mercedes-Benz Finance North America LLC (Germany) 2.13%, 3/10/2025 (b) | | |
Nissan Motor Co. Ltd. (Japan) 4.35%, 9/17/2027 (b) | | |
| | |
|
| | |
(SOFR + 0.67%), 1.84%, 2/4/2025 (c) | | |
(SOFR + 1.15%), 1.32%, 6/19/2026 (c) | | |
(SOFR + 1.29%), 5.08%, 1/20/2027 (c) | | |
(3-MONTH CME TERM SOFR + 1.30%), 3.42%, 12/20/2028 (c) | | |
(SOFR + 1.63%), 5.20%, 4/25/2029 (c) | | |
Series N, (SOFR + 1.22%), 2.65%, 3/11/2032 (c) | | |
Canadian Imperial Bank of Commerce (Canada) 3.10%, 4/2/2024 | | |
| | |
| | |
| | |
(SOFR + 1.15%), 2.67%, 1/29/2031 (c) | | |
Fifth Third Bancorp 2.38%, 1/28/2025 | | |
HSBC Holdings plc (United Kingdom) | | |
(SOFR + 0.71%), 0.98%, 5/24/2025 (c) | | |
(SOFR + 1.29%), 1.59%, 5/24/2027 (c) | | |
Lloyds Banking Group plc (United Kingdom) 3.75%, 1/11/2027 | | |
Mitsubishi UFJ Financial Group, Inc. (Japan) 2.19%, 2/25/2025 | | |
Morgan Stanley Bank NA 5.48%, 7/16/2025 | | |
PNC Financial Services Group, Inc. (The) (SOFR + 1.09%), 4.76%, 1/26/2027 (c) | | |
Santander UK Group Holdings plc (United Kingdom) (SOFR + 2.60%), 6.53%, 1/10/2029 (c) | | |
Societe Generale SA (France) 4.25%, 4/14/2025 (b) | | |
Toronto-Dominion Bank (The) (Canada) 5.53%, 7/17/2026 | | |
| | |
| | |
SEE NOTES TO FINANCIAL STATEMENTS.
| JPMorgan Institutional Trust Funds | |
| | |
Corporate Bonds — continued |
|
| | |
| | |
(3-MONTH CME TERM SOFR + 1.57%), 3.58%, 5/22/2028 (c) | | |
(SOFR + 1.74%), 5.57%, 7/25/2029 (c) | | |
| | |
|
Anheuser-Busch InBev Worldwide, Inc. (Belgium) 4.75%, 1/23/2029 | | |
Constellation Brands, Inc. 2.88%, 5/1/2030 | | |
Keurig Dr Pepper, Inc. 4.42%, 5/25/2025 | | |
PepsiCo, Inc. 1.63%, 5/1/2030 | | |
| | |
|
AbbVie, Inc. 4.25%, 11/14/2028 | | |
| | |
| | |
| | |
| | |
| | |
| | |
| | |
Regeneron Pharmaceuticals, Inc. 1.75%, 9/15/2030 | | |
| | |
|
Amazon.com, Inc. 3.60%, 4/13/2032 | | |
eBay, Inc. 2.60%, 5/10/2031 | | |
| | |
|
Brookfield Finance, Inc. (Canada) 4.85%, 3/29/2029 | | |
Deutsche Bank AG (Germany) (SOFR + 1.72%), 3.04%, 5/28/2032 (c) | | |
Goldman Sachs Group, Inc. (The) | | |
(SOFR + 0.82%), 1.54%, 9/10/2027 (c) | | |
(SOFR + 1.11%), 2.64%, 2/24/2028 (c) | | |
(3-MONTH CME TERM SOFR + 1.77%), 3.69%, 6/5/2028 (c) | | |
Invesco Finance plc 3.75%, 1/15/2026 | | |
Macquarie Bank Ltd. (Australia) 4.00%, 7/29/2025 (b) | | |
| | |
(SOFR + 0.47%), 5.79%, 11/10/2023 (c) | | |
| | |
|
Capital Markets — continued |
(SOFR + 0.88%), 1.59%, 5/4/2027 (c) | | |
| | |
(SOFR + 1.03%), 1.79%, 2/13/2032 (c) | | |
Nasdaq, Inc. 5.55%, 2/15/2034 | | |
Northern Trust Corp. (ICE LIBOR USD 3 Month + 1.13%), 3.38%, 5/8/2032 (c) | | |
S&P Global, Inc. 2.90%, 3/1/2032 | | |
UBS Group AG (Switzerland) (US Treasury Yield Curve Rate T Note Constant Maturity 1 Year + 1.10%), 2.75%, 2/11/2033 (b) (c) | | |
| | |
|
Albemarle Corp. 5.05%, 6/1/2032 | | |
EIDP, Inc. 4.50%, 5/15/2026 | | |
International Flavors & Fragrances, Inc. 1.83%, 10/15/2027 (b) | | |
PPG Industries, Inc. 1.20%, 3/15/2026 | | |
RPM International, Inc. 2.95%, 1/15/2032 | | |
Sherwin-Williams Co. (The) 3.30%, 2/1/2025 | | |
| | |
Commercial Services & Supplies — 0.2% |
Republic Services, Inc. 3.38%, 11/15/2027 | | |
Construction & Engineering — 0.1% |
| | |
| | |
| | |
| | |
Construction Materials — 0.1% |
Martin Marietta Materials, Inc. 3.45%, 6/1/2027 | | |
|
AerCap Ireland Capital DAC (Ireland) 5.75%, 6/6/2028 | | |
Avolon Holdings Funding Ltd. (Ireland) | | |
| | |
| | |
| | |
Capital One Financial Corp. (SOFR + 1.37%), 4.17%, 5/9/2025 (c) | | |
General Motors Financial Co., Inc. 2.35%, 1/8/2031 | | |
| | |
Consumer Staples Distribution & Retail — 0.4% |
7-Eleven, Inc. 1.80%, 2/10/2031 (b) | | |
SEE NOTES TO FINANCIAL STATEMENTS.
| JPMorgan Institutional Trust Funds | |
JPMorgan Intermediate Bond Trust
SCHEDULE OF PORTFOLIO INVESTMENTS
AS OF August 31, 2023 (Unaudited) (continued)
| | |
Corporate Bonds — continued |
Consumer Staples Distribution & Retail — continued |
Alimentation Couche-Tard, Inc. (Canada) 3.55%, 7/26/2027 (b) | | |
CVS Pass-Through Trust 5.93%, 1/10/2034 (b) | | |
Dollar General Corp. 4.13%, 5/1/2028 | | |
Walmart, Inc. 4.10%, 4/15/2033 | | |
| | |
Containers & Packaging — 0.2% |
Graphic Packaging International LLC 1.51%, 4/15/2026 (b) | | |
Packaging Corp. of America 3.00%, 12/15/2029 | | |
WRKCo, Inc. 3.00%, 9/15/2024 | | |
| | |
|
Goodman US Finance Three LLC (Australia) 3.70%, 3/15/2028 (b) | | |
Safehold GL Holdings LLC 2.80%, 6/15/2031 | | |
| | |
| | |
| | |
| | |
Diversified Telecommunication Services — 0.2% |
AT&T, Inc. 2.75%, 6/1/2031 | | |
Verizon Communications, Inc. 2.10%, 3/22/2028 | | |
| | |
Electric Utilities — 2.2% |
American Electric Power Co., Inc. 2.30%, 3/1/2030 | | |
Commonwealth Edison Co. Series 122, 2.95%, 8/15/2027 | | |
Duke Energy Corp. 3.75%, 4/15/2024 | | |
Duquesne Light Holdings, Inc. | | |
| | |
| | |
Edison International 4.13%, 3/15/2028 | | |
Entergy Mississippi LLC 2.85%, 6/1/2028 | | |
Fells Point Funding Trust 3.05%, 1/31/2027 (b) | | |
ITC Holdings Corp. 2.95%, 5/14/2030 (b) | | |
NextEra Energy Capital Holdings, Inc. 3.55%, 5/1/2027 | | |
Niagara Mohawk Power Corp. | | |
| | |
| | |
NRG Energy, Inc. 2.45%, 12/2/2027 (b) | | |
| | |
|
Electric Utilities — continued |
Pacific Gas and Electric Co. | | |
| | |
| | |
| | |
| | |
Pennsylvania Electric Co. 3.25%, 3/15/2028 (b) | | |
PG&E Recovery Funding LLC Series A-1, 5.05%, 7/15/2032 | | |
PG&E Wildfire Recovery Funding LLC Series A-2, 4.26%, 6/1/2036 | | |
SCE Recovery Funding LLC Series A-2, 1.94%, 5/15/2038 | | |
Southern Co. (The) Series 21-B, 1.75%, 3/15/2028 | | |
Virginia Electric and Power Co. 3.45%, 2/15/2024 | | |
Vistra Operations Co. LLC 4.88%, 5/13/2024 (b) | | |
| | |
Electrical Equipment — 0.2% |
Eaton Corp. 3.10%, 9/15/2027 | | |
Electronic Equipment, Instruments & Components — 0.1% |
Arrow Electronics, Inc. 3.88%, 1/12/2028 | | |
Energy Equipment & Services — 0.1% |
Schlumberger Holdings Corp. 4.30%, 5/1/2029 (b) | | |
|
Take-Two Interactive Software, Inc. 3.70%, 4/14/2027 | | |
Walt Disney Co. (The) 7.70%, 10/30/2025 | | |
| | |
Financial Services — 0.4% |
Corebridge Financial, Inc. 3.65%, 4/5/2027 | | |
Element Fleet Management Corp. (Canada) 1.60%, 4/6/2024 (b) | | |
| | |
| | |
| | |
Private Export Funding Corp. Series KK, 3.55%, 1/15/2024 | | |
| | |
|
Archer-Daniels-Midland Co. 3.25%, 3/27/2030 | | |
Bunge Ltd. Finance Corp. 1.63%, 8/17/2025 | | |
| | |
| | |
SEE NOTES TO FINANCIAL STATEMENTS.
| JPMorgan Institutional Trust Funds | |
| | |
Corporate Bonds — continued |
Food Products — continued |
| | |
Cargill, Inc. 1.70%, 2/2/2031 (b) | | |
General Mills, Inc. 4.95%, 3/29/2033 | | |
Kellogg Co. 3.40%, 11/15/2027 | | |
| | |
| | |
| | |
| | |
|
Atmos Energy Corp. 2.63%, 9/15/2029 | | |
ONE Gas, Inc. 2.00%, 5/15/2030 | | |
| | |
Ground Transportation — 0.6% |
CSX Corp. 3.25%, 6/1/2027 | | |
JB Hunt Transport Services, Inc. 3.88%, 3/1/2026 | | |
Norfolk Southern Corp. 2.55%, 11/1/2029 | | |
Penske Truck Leasing Co. LP 5.75%, 5/24/2026 (b) | | |
Triton Container International Ltd. (Bermuda) | | |
| | |
| | |
| | |
Health Care Equipment & Supplies — 0.1% |
Becton Dickinson & Co. 1.96%, 2/11/2031 | | |
Health Care Providers & Services — 0.5% |
Cigna Group (The) 3.50%, 6/15/2024 | | |
CommonSpirit Health 2.78%, 10/1/2030 | | |
CVS Health Corp. 5.25%, 1/30/2031 | | |
HCA, Inc. 4.13%, 6/15/2029 | | |
Humana, Inc. 3.95%, 3/15/2027 | | |
UnitedHealth Group, Inc. 2.30%, 5/15/2031 | | |
| | |
|
Healthcare Realty Holdings LP | | |
| | |
| | |
| | |
| | |
| | |
Physicians Realty LP 2.63%, 11/1/2031 | | |
Sabra Health Care LP 3.20%, 12/1/2031 | | |
| | |
|
Health Care REITs — continued |
| | |
| | |
| | |
| | |
| | |
Welltower OP LLC 4.50%, 1/15/2024 | | |
| | |
Hotels, Restaurants & Leisure — 0.2% |
Expedia Group, Inc. 3.25%, 2/15/2030 | | |
McDonald's Corp. 2.13%, 3/1/2030 | | |
| | |
Household Durables — 0.2% |
Lennar Corp. 5.25%, 6/1/2026 | | |
|
Prologis LP 4.75%, 6/15/2033 | | |
|
Aon Global Ltd. 3.88%, 12/15/2025 | | |
Assurant, Inc. 4.20%, 9/27/2023 | | |
| | |
| | |
| | |
Brighthouse Financial Global Funding 1.00%, 4/12/2024 (b) | | |
| | |
| | |
| | |
F&G Global Funding 2.30%, 4/11/2027 (b) | | |
Principal Financial Group, Inc. 3.10%, 11/15/2026 | | |
Prudential Insurance Co. of America (The) 8.30%, 7/1/2025 (b) | | |
| | |
|
Hasbro, Inc. 3.90%, 11/19/2029 | | |
|
Otis Worldwide Corp. 2.57%, 2/15/2030 | | |
|
Charter Communications Operating LLC | | |
| | |
| | |
| | |
| | |
SEE NOTES TO FINANCIAL STATEMENTS.
| JPMorgan Institutional Trust Funds | |
JPMorgan Intermediate Bond Trust
SCHEDULE OF PORTFOLIO INVESTMENTS
AS OF August 31, 2023 (Unaudited) (continued)
| | |
Corporate Bonds — continued |
|
| | |
Cox Communications, Inc. 1.80%, 10/1/2030 (b) | | |
Fox Corp. 4.71%, 1/25/2029 | | |
Paramount Global 2.90%, 1/15/2027 | | |
| | |
|
Glencore Funding LLC (Australia) 2.50%, 9/1/2030 (b) | | |
Steel Dynamics, Inc. 1.65%, 10/15/2027 | | |
| | |
|
CenterPoint Energy, Inc. 1.45%, 6/1/2026 | | |
Consolidated Edison Co. of New York, Inc. 3.80%, 5/15/2028 | | |
NiSource, Inc. 5.25%, 3/30/2028 | | |
PG&E Energy Recovery Funding LLC Series A-2, 2.28%, 1/15/2036 | | |
Public Service Enterprise Group, Inc. 2.88%, 6/15/2024 | | |
Puget Energy, Inc. 2.38%, 6/15/2028 | | |
WEC Energy Group, Inc. 3.55%, 6/15/2025 | | |
| | |
|
Alexandria Real Estate Equities, Inc. | | |
| | |
| | |
Corporate Office Properties LP 2.00%, 1/15/2029 | | |
Kilroy Realty LP 2.65%, 11/15/2033 | | |
| | |
Oil, Gas & Consumable Fuels — 1.5% |
APA Infrastructure Ltd. (Australia) 4.25%, 7/15/2027 (b) | | |
BP Capital Markets America, Inc. 2.72%, 1/12/2032 | | |
Cameron LNG LLC 2.90%, 7/15/2031 (b) | | |
Cheniere Corpus Christi Holdings LLC 5.88%, 3/31/2025 | | |
Coterra Energy, Inc. 3.90%, 5/15/2027 | | |
Ecopetrol SA (Colombia) 4.13%, 1/16/2025 | | |
Enbridge, Inc. (Canada) 5.70%, 3/8/2033 | | |
| | |
| | |
| | |
Flex Intermediate Holdco LLC 3.36%, 6/30/2031 (b) | | |
| | |
|
Oil, Gas & Consumable Fuels — continued |
| | |
| | |
| | |
| | |
| | |
| | |
Marathon Petroleum Corp. 4.70%, 5/1/2025 | | |
| | |
NGPL PipeCo LLC 3.25%, 7/15/2031 (b) | | |
Ovintiv, Inc. 5.38%, 1/1/2026 | | |
Phillips 66 1.30%, 2/15/2026 | | |
Pioneer Natural Resources Co. | | |
| | |
| | |
Plains All American Pipeline LP 4.65%, 10/15/2025 | | |
Sabine Pass Liquefaction LLC 4.50%, 5/15/2030 | | |
Targa Resources Partners LP 4.00%, 1/15/2032 | | |
Williams Cos., Inc. (The) 2.60%, 3/15/2031 | | |
| | |
Personal Care Products — 0.1% |
Kenvue, Inc. 5.00%, 3/22/2030 (b) | | |
|
AstraZeneca plc (United Kingdom) 1.38%, 8/6/2030 | | |
| | |
| | |
| | |
Merck & Co., Inc. 4.50%, 5/17/2033 | | |
Mylan, Inc. 4.55%, 4/15/2028 | | |
Pfizer Investment Enterprises Pte. Ltd. 4.75%, 5/19/2033 | | |
Takeda Pharmaceutical Co. Ltd. (Japan) 2.05%, 3/31/2030 | | |
Zoetis, Inc. 2.00%, 5/15/2030 | | |
| | |
|
AvalonBay Communities, Inc. | | |
| | |
| | |
Essex Portfolio LP 1.65%, 1/15/2031 | | |
Mid-America Apartments LP | | |
| | |
SEE NOTES TO FINANCIAL STATEMENTS.
| JPMorgan Institutional Trust Funds | |
| | |
Corporate Bonds — continued |
Residential REITs — continued |
| | |
UDR, Inc. 2.10%, 8/1/2032 | | |
| | |
|
Brixmor Operating Partnership LP | | |
| | |
| | |
Realty Income Corp. 3.65%, 1/15/2028 | | |
Scentre Group Trust 1 (Australia) 3.50%, 2/12/2025 (b) | | |
SITE Centers Corp. 3.63%, 2/1/2025 | | |
| | |
Semiconductors & Semiconductor Equipment — 0.6% |
Broadcom, Inc. 3.19%, 11/15/2036 (b) | | |
Intel Corp. 4.88%, 2/10/2028 | | |
Marvell Technology, Inc. 2.95%, 4/15/2031 | | |
Microchip Technology, Inc. | | |
| | |
| | |
NXP BV (China) 2.50%, 5/11/2031 | | |
QUALCOMM, Inc. 4.25%, 5/20/2032 | | |
| | |
| | |
| | |
Xilinx, Inc. 2.38%, 6/1/2030 | | |
| | |
|
Intuit, Inc. 1.65%, 7/15/2030 | | |
| | |
| | |
| | |
| | |
| | |
| | |
| | |
| | |
| | |
Workday, Inc. 3.50%, 4/1/2027 | | |
| | |
|
| | |
| | |
| | |
|
Specialized REITs — continued |
| | |
| | |
Crown Castle, Inc. 2.25%, 1/15/2031 | | |
Equinix, Inc. 2.00%, 5/15/2028 | | |
| | |
| | |
| | |
Public Storage Operating Co. 2.25%, 11/9/2031 | | |
| | |
|
Advance Auto Parts, Inc. 3.50%, 3/15/2032 | | |
AutoZone, Inc. 1.65%, 1/15/2031 | | |
O'Reilly Automotive, Inc. 3.60%, 9/1/2027 | | |
| | |
Technology Hardware, Storage & Peripherals — 0.2% |
Apple, Inc. 4.30%, 5/10/2033 | | |
Dell International LLC 5.30%, 10/1/2029 | | |
| | |
|
Altria Group, Inc. 2.45%, 2/4/2032 | | |
BAT Capital Corp. (United Kingdom) 3.22%, 8/15/2024 | | |
| | |
Trading Companies & Distributors — 0.4% |
| | |
| | |
| | |
| | |
Wireless Telecommunication Services — 0.4% |
Rogers Communications, Inc. (Canada) 3.80%, 3/15/2032 | | |
| | |
| | |
| | |
| | |
Total Corporate Bonds
(Cost $22,929) | | |
Collateralized Mortgage Obligations — 11.9% |
| | |
Series 2004-2CB, Class 1A9, 5.75%, 3/25/2034 | | |
SEE NOTES TO FINANCIAL STATEMENTS.
| JPMorgan Institutional Trust Funds | |
JPMorgan Intermediate Bond Trust
SCHEDULE OF PORTFOLIO INVESTMENTS
AS OF August 31, 2023 (Unaudited) (continued)
| | |
Collateralized Mortgage Obligations — continued |
Series 2005-54CB, Class 1A11, 5.50%, 11/25/2035 | | |
Banc of America Funding Trust Series 2004-1, PO, 3/25/2034 | | |
CHL Mortgage Pass-Through Trust | | |
Series 2004-HYB3, Class 2A, 3.91%, 6/20/2034 (d) | | |
Series 2004-5, Class 1A4, 5.50%, 6/25/2034 | | |
Series 2005-22, Class 2A1, 3.65%, 11/25/2035 (d) | | |
Citigroup Global Markets Mortgage Securities VII, Inc. | | |
Series 2003-UP2, Class 1, PO, 6/25/2033 | | |
Series 2003-HYB1, Class A, 4.24%, 9/25/2033 (d) | | |
Citigroup Mortgage Loan Trust, Inc. Series 2003-UP3, Class A3, 7.00%, 9/25/2033 | | |
FHLMC - GNMA Series 24, Class ZE, 6.25%, 11/25/2023 | | |
| | |
Series 1608, Class L, 6.50%, 9/15/2023 | | |
Series 1602, Class SA, IF, 5.52%, 10/15/2023 (d) | | |
Series 2283, Class K, 6.50%, 12/15/2023 | | |
Series 1671, Class L, 7.00%, 2/15/2024 | | |
Series 1706, Class K, 7.00%, 3/15/2024 | | |
Series 2033, Class SN, IF, IO, 18.79%, 3/15/2024 (d) | | |
Series 1720, Class PL, 7.50%, 4/15/2024 | | |
Series 2306, Class K, PO, 5/15/2024 | | |
Series 2306, Class SE, IF, IO, 6.79%, 5/15/2024 (d) | | |
Series 1745, Class D, 7.50%, 8/15/2024 | | |
Series 1927, Class PH, 7.50%, 1/15/2027 | | |
Series 1981, Class Z, 6.00%, 5/15/2027 | | |
Series 1987, Class PE, 7.50%, 9/15/2027 | | |
Series 2038, Class PN, IO, 7.00%, 3/15/2028 | | |
Series 2040, Class PE, 7.50%, 3/15/2028 | | |
Series 2063, Class PG, 6.50%, 6/15/2028 | | |
Series 2064, Class TE, 7.00%, 6/15/2028 | | |
Series 2075, Class PM, 6.25%, 8/15/2028 | | |
Series 2075, Class PH, 6.50%, 8/15/2028 | | |
Series 2089, Class PJ, IO, 7.00%, 10/15/2028 | | |
Series 2125, Class JZ, 6.00%, 2/15/2029 | | |
Series 2169, Class TB, 7.00%, 6/15/2029 | | |
Series 2163, Class PC, IO, 7.50%, 6/15/2029 | | |
Series 2172, Class QC, 7.00%, 7/15/2029 | | |
Series 2196, Class TL, 7.50%, 11/15/2029 | | |
Series 2201, Class C, 8.00%, 11/15/2029 | | |
| | |
|
Series 2210, Class Z, 8.00%, 1/15/2030 | | |
Series 2224, Class CB, 8.00%, 3/15/2030 | | |
Series 2256, Class MC, 7.25%, 9/15/2030 | | |
Series 2259, Class ZM, 7.00%, 10/15/2030 | | |
Series 2271, Class PC, 7.25%, 12/15/2030 | | |
Series 2296, Class PD, 7.00%, 3/15/2031 | | |
Series 2344, Class ZD, 6.50%, 8/15/2031 | | |
Series 2344, Class ZJ, 6.50%, 8/15/2031 | | |
Series 2345, Class NE, 6.50%, 8/15/2031 | | |
Series 2351, Class PZ, 6.50%, 8/15/2031 | | |
Series 2410, Class QX, IF, IO, 3.35%, 2/15/2032 (d) | | |
Series 2412, Class SP, IF, 5.49%, 2/15/2032 (d) | | |
Series 2410, Class OE, 6.38%, 2/15/2032 | | |
Series 2410, Class NG, 6.50%, 2/15/2032 | | |
Series 2444, Class ES, IF, IO, 2.65%, 3/15/2032 (d) | | |
Series 2450, Class SW, IF, IO, 2.70%, 3/15/2032 (d) | | |
Series 2423, Class MC, 7.00%, 3/15/2032 | | |
Series 2423, Class MT, 7.00%, 3/15/2032 | | |
Series 2435, Class CJ, 6.50%, 4/15/2032 | | |
Series 2441, Class GF, 6.50%, 4/15/2032 | | |
Series 2455, Class GK, 6.50%, 5/15/2032 | | |
Series 2450, Class GZ, 7.00%, 5/15/2032 | | |
Series 2466, Class DH, 6.50%, 6/15/2032 | | |
Series 2474, Class NR, 6.50%, 7/15/2032 | | |
Series 2484, Class LZ, 6.50%, 7/15/2032 | | |
Series 2500, Class MC, 6.00%, 9/15/2032 | | |
Series 2543, Class YX, 6.00%, 12/15/2032 | | |
Series 2575, Class ME, 6.00%, 2/15/2033 | | |
Series 2586, Class WI, IO, 6.50%, 3/15/2033 | | |
Series 3611, PO, 7/15/2034 | | |
Series 2990, Class UZ, 5.75%, 6/15/2035 | | |
Series 3117, Class EO, PO, 2/15/2036 | | |
Series 3117, Class OK, PO, 2/15/2036 | | |
Series 3122, Class OH, PO, 3/15/2036 | | |
Series 3152, Class MO, PO, 3/15/2036 | | |
Series 3607, Class AO, PO, 4/15/2036 | | |
Series 3137, Class XP, 6.00%, 4/15/2036 | | |
Series 3819, Class ZQ, 6.00%, 4/15/2036 | | |
Series 3149, Class SO, PO, 5/15/2036 | | |
Series 3171, Class MO, PO, 6/15/2036 | | |
Series 3179, Class OA, PO, 7/15/2036 | | |
Series 3202, Class HI, IF, IO, 1.35%, 8/15/2036 (d) | | |
SEE NOTES TO FINANCIAL STATEMENTS.
| JPMorgan Institutional Trust Funds | |
| | |
Collateralized Mortgage Obligations — continued |
Series 3232, Class ST, IF, IO, 1.40%, 10/15/2036 (d) | | |
Series 3417, Class EO, PO, 11/15/2036 | | |
Series 3316, Class JO, PO, 5/15/2037 | | |
Series 3607, Class OP, PO, 7/15/2037 | | |
Series 3481, Class SJ, IF, IO, 0.55%, 8/15/2038 (d) | | |
Series 4096, Class HA, 2.00%, 12/15/2041 | | |
Series 5008, Class LB, 1.50%, 8/25/2050 | | |
Series 5028, Class JG, 1.50%, 8/25/2050 | | |
Series 5190, Class PH, 2.50%, 2/25/2052 | | |
FHLMC, STRIPS Series 262, Class 35, 3.50%, 7/15/2042 | | |
FHLMC, Structured Pass-Through Certificates, Whole Loan | | |
Series T-41, Class 3A, 4.35%, 7/25/2032 (d) | | |
Series T-76, Class 2A, 2.26%, 10/25/2037 (d) | | |
Series T-51, Class 2A, 7.50%, 8/25/2042 (d) | | |
Series T-54, Class 2A, 6.50%, 2/25/2043 | | |
Series T-54, Class 3A, 7.00%, 2/25/2043 | | |
Series T-56, Class A5, 5.23%, 5/25/2043 | | |
Series T-58, Class A, PO, 9/25/2043 | | |
| | |
Series 2004-W2, Class 2A2, 7.00%, 2/25/2044 | | |
Series 2005-W3, Class 2AF, 5.62%, 3/25/2045 (d) | | |
| | |
Series 1993-165, Class SD, IF, 2.56%, 9/25/2023 (d) | | |
Series 1993-178, Class PK, 6.50%, 9/25/2023 | | |
Series 1993-183, Class KA, 6.50%, 10/25/2023 | | |
Series 1993-189, Class PL, 6.50%, 10/25/2023 | | |
Series 1993-247, Class SA, IF, 5.35%, 12/25/2023 (d) | | |
Series G95-1, Class C, 8.80%, 1/25/2025 | | |
Series 2005-121, Class DX, 5.50%, 1/25/2026 | | |
Series 1997-20, IO, 1.84%, 3/25/2027 (d) | | |
Series 1997-20, Class IB, IO, 1.84%, 3/25/2027 (d) | | |
Series 1997-27, Class J, 7.50%, 4/18/2027 | | |
Series 1997-29, Class J, 7.50%, 4/20/2027 | | |
Series 1997-39, Class PD, 7.50%, 5/20/2027 | | |
Series 2012-47, Class HF, 5.80%, 5/25/2027 (d) | | |
Series 1997-81, Class PI, IO, 7.00%, 12/18/2027 | | |
Series 1998-36, Class ZB, 6.00%, 7/18/2028 | | |
Series 2000-2, Class ZE, 7.50%, 2/25/2030 | | |
Series 2001-33, Class ID, IO, 6.00%, 7/25/2031 | | |
Series 2001-36, Class DE, 7.00%, 8/25/2031 | | |
| | |
|
Series 2001-49, Class Z, 6.50%, 9/25/2031 | | |
Series 2001-44, Class PD, 7.00%, 9/25/2031 | | |
Series 2003-52, Class SX, IF, 6.74%, 10/25/2031 (d) | | |
Series 2004-74, Class SW, IF, 4.81%, 11/25/2031 (d) | | |
Series 2001-81, Class LO, PO, 1/25/2032 | | |
Series 2002-1, Class SA, IF, 7.63%, 2/25/2032 (d) | | |
Series 2002-21, Class PE, 6.50%, 4/25/2032 | | |
Series 2002-28, Class PK, 6.50%, 5/25/2032 | | |
Series 2002-37, Class Z, 6.50%, 6/25/2032 | | |
Series 2004-61, Class SH, IF, 2.39%, 11/25/2032 (d) | | |
Series 2003-22, Class UD, 4.00%, 4/25/2033 | | |
Series 2003-34, Class GE, 6.00%, 5/25/2033 | | |
Series 2003-39, IO, 6.00%, 5/25/2033 (d) | | |
Series 2003-47, Class PE, 5.75%, 6/25/2033 | | |
Series 2003-64, Class SX, IF, 0.77%, 7/25/2033 (d) | | |
Series 2003-71, Class DS, IF, 0.54%, 8/25/2033 (d) | | |
Series 2005-56, Class TP, IF, 1.94%, 8/25/2033 (d) | | |
Series 2003-91, Class SD, IF, 3.50%, 9/25/2033 (d) | | |
Series 2003-116, Class SB, IF, IO, 2.20%, 11/25/2033 (d) | | |
Series 2006-44, Class P, PO, 12/25/2033 | | |
Series 2003-130, Class SX, IF, 3.42%, 1/25/2034 (d) | | |
Series 2004-25, Class SA, IF, 4.67%, 4/25/2034 (d) | | |
Series 2004-46, Class SK, IF, 1.64%, 5/25/2034 (d) | | |
Series 2004-36, Class SA, IF, 4.67%, 5/25/2034 (d) | | |
Series 2004-50, Class VZ, 5.50%, 7/25/2034 | | |
Series 2005-74, Class CS, IF, 5.16%, 5/25/2035 (d) | | |
Series 2005-45, Class DC, IF, 4.50%, 6/25/2035 (d) | | |
Series 2005-56, Class S, IF, IO, 1.31%, 7/25/2035 (d) | | |
Series 2005-73, Class PS, IF, 3.19%, 8/25/2035 (d) | | |
Series 2005-68, Class PG, 5.50%, 8/25/2035 | | |
SEE NOTES TO FINANCIAL STATEMENTS.
| JPMorgan Institutional Trust Funds | |
JPMorgan Intermediate Bond Trust
SCHEDULE OF PORTFOLIO INVESTMENTS
AS OF August 31, 2023 (Unaudited) (continued)
| | |
Collateralized Mortgage Obligations — continued |
Series 2005-106, Class US, IF, 4.76%, 11/25/2035 (d) | | |
Series 2006-27, Class OH, PO, 4/25/2036 | | |
Series 2006-65, Class QO, PO, 7/25/2036 | | |
Series 2006-56, Class FC, 5.69%, 7/25/2036 (d) | | |
Series 2006-72, Class GO, PO, 8/25/2036 | | |
Series 2006-79, Class DO, PO, 8/25/2036 | | |
Series 2006-77, Class PC, 6.50%, 8/25/2036 | | |
Series 2006-110, PO, 11/25/2036 | | |
Series 2006-124, Class HB, 3.95%, 11/25/2036 (d) | | |
Series 2007-14, Class ES, IF, IO, 1.04%, 3/25/2037 (d) | | |
Series 2007-79, Class SB, IF, 4.21%, 8/25/2037 (d) | | |
Series 2007-81, Class GE, 6.00%, 8/25/2037 | | |
Series 2007-88, Class VI, IF, IO, 1.14%, 9/25/2037 (d) | | |
Series 2007-91, Class ES, IF, IO, 1.06%, 10/25/2037 (d) | | |
Series 2007-116, Class HI, IO, 0.17%, 1/25/2038 (d) | | |
Series 2008-16, Class IS, IF, IO, 0.80%, 3/25/2038 (d) | | |
Series 2008-10, Class XI, IF, IO, 0.83%, 3/25/2038 (d) | | |
Series 2008-28, Class QS, IF, 4.49%, 4/25/2038 (d) | | |
Series 2008-46, Class HI, IO, 1.65%, 6/25/2038 (d) | | |
Series 2013-25, Class DC, 2.50%, 6/25/2039 | | |
Series 2009-69, PO, 9/25/2039 | | |
Series 2009-103, Class MB, 4.89%, 12/25/2039 (d) | | |
Series 2010-71, Class HJ, 5.50%, 7/25/2040 | | |
Series 2011-118, Class MT, 7.00%, 11/25/2041 | | |
Series 2011-118, Class NT, 7.00%, 11/25/2041 | | |
Series 2013-101, Class DO, PO, 10/25/2043 | | |
Series 2013-128, PO, 12/25/2043 | | |
Series 2019-65, Class PA, 2.50%, 5/25/2048 | | |
FNMA, REMIC Trust, Whole Loan | | |
Series 2007-W7, Class 1A4, IF, 6.77%, 7/25/2037 (d) | | |
Series 2003-W4, Class 2A, 5.10%, 10/25/2042 (d) | | |
Series 2003-W1, Class 1A1, 4.80%, 12/25/2042 (d) | | |
| | |
|
FNMA, REMIC, Whole Loan Series 2007-106, Class A7, 6.04%, 10/25/2037 (d) | | |
| | |
Series 300, Class 1, PO, 9/25/2024 | | |
Series 329, Class 1, PO, 1/25/2033 | | |
| | |
Series 2003-52, Class AP, PO, 6/16/2033 | | |
Series 2004-28, Class S, IF, 4.74%, 4/16/2034 (d) | | |
Series 2004-71, Class SB, IF, 2.81%, 9/20/2034 (d) | | |
Series 2004-90, Class SI, IF, IO, 0.67%, 10/20/2034 (d) | | |
Series 2005-68, Class DP, IF, 3.36%, 6/17/2035 (d) | | |
Series 2005-68, Class KI, IF, IO, 0.87%, 9/20/2035 (d) | | |
Series 2006-38, Class ZK, 6.50%, 8/20/2036 | | |
Series 2006-59, Class SD, IF, IO, 1.27%, 10/20/2036 (d) | | |
Series 2007-17, Class JI, IF, IO, 1.38%, 4/16/2037 (d) | | |
Series 2007-27, Class SA, IF, IO, 0.77%, 5/20/2037 (d) | | |
Series 2007-45, Class QA, IF, IO, 1.21%, 7/20/2037 (d) | | |
Series 2007-40, Class SB, IF, IO, 1.32%, 7/20/2037 (d) | | |
Series 2007-53, Class ES, IF, IO, 1.12%, 9/20/2037 (d) | | |
Series 2007-53, Class SW, IF, 3.92%, 9/20/2037 (d) | | |
Series 2009-79, Class OK, PO, 11/16/2037 | | |
Series 2007-76, Class SA, IF, IO, 1.10%, 11/20/2037 (d) | | |
Series 2007-72, Class US, IF, IO, 1.12%, 11/20/2037 (d) | | |
Series 2009-106, Class ST, IF, IO, 0.57%, 2/20/2038 (d) | | |
Series 2008-33, Class XS, IF, IO, 2.27%, 4/16/2038 (d) | | |
Series 2008-40, Class SA, IF, IO, 0.97%, 5/16/2038 (d) | | |
Series 2008-55, Class SA, IF, IO, 0.77%, 6/20/2038 (d) | | |
Series 2008-50, Class KB, 6.00%, 6/20/2038 | | |
Series 2008-93, Class AS, IF, IO, 0.27%, 12/20/2038 (d) | | |
SEE NOTES TO FINANCIAL STATEMENTS.
| JPMorgan Institutional Trust Funds | |
| | |
Collateralized Mortgage Obligations — continued |
Series 2009-6, Class SA, IF, IO, 0.67%, 2/16/2039 (d) | | |
Series 2009-31, Class TS, IF, IO, 0.87%, 3/20/2039 (d) | | |
Series 2009-14, Class NI, IO, 6.50%, 3/20/2039 | | |
Series 2009-22, Class SA, IF, IO, 0.84%, 4/20/2039 (d) | | |
Series 2009-92, Class ZC, 5.00%, 10/20/2039 | | |
Series 2011-137, Class WA, 5.59%, 7/20/2040 (d) | | |
Series 2010-105, Class B, 5.00%, 8/20/2040 | | |
Series 2010-130, Class CP, 7.00%, 10/16/2040 | | |
Series 2013-91, Class WA, 4.44%, 4/20/2043 (d) | | |
Series 2012-H24, Class FA, 5.50%, 3/20/2060 (d) | | |
Series 2013-H03, Class FA, 5.56%, 8/20/2060 (d) | | |
Series 2012-H21, Class DF, 4.87%, 5/20/2061 (d) | | |
Series 2012-H26, Class MA, 4.88%, 7/20/2062 (d) | | |
Series 2012-H29, Class FA, 5.77%, 10/20/2062 (d) | | |
Series 2014-H15, Class FA, 5.72%, 7/20/2064 (d) | | |
Series 2015-H15, Class FJ, 5.66%, 6/20/2065 (d) | | |
Series 2015-H18, Class FA, 5.67%, 6/20/2065 (d) | | |
Series 2015-H20, Class FA, 5.69%, 8/20/2065 (d) | | |
Series 2015-H26, Class FG, 5.74%, 10/20/2065 (d) | | |
GSR Mortgage Loan Trust Series 2006-1F, Class 1A3, 5.50%, 2/25/2036 | | |
Impac Secured Assets CMN Owner Trust Series 2002-2, Class A, PO, 4/25/2033 | | |
| | |
Series 2003-A1, Class 1A1, 3.90%, 10/25/2033 (d) | | |
Series 2006-A2, Class 5A3, 4.59%, 11/25/2033 (d) | | |
Series 2006-A2, Class 4A1, 5.59%, 8/25/2034 (d) | | |
MASTR Adjustable Rate Mortgages Trust | | |
Series 2004-13, Class 2A1, 4.71%, 4/21/2034 (d) | | |
Series 2004-3, Class 4A2, 3.65%, 4/25/2034 (d) | | |
MASTR Alternative Loan Trust | | |
Series 2004-10, Class 1A1, 4.50%, 9/25/2019 | | |
Series 2004-4, Class 10A1, 5.00%, 5/25/2024 | | |
Series 2003-9, Class 8A1, 6.00%, 1/25/2034 | | |
Series 2004-7, Class 30, PO, 8/25/2034 | | |
Series 2005-6, Class 3A1, 5.50%, 12/25/2035 | | |
MASTR Resecuritization Trust Series 2005-PO, Class 3, PO, 5/28/2035 (b) | | |
| | |
|
Merrill Lynch Mortgage Investors Trust | | |
Series 2003-E, Class A1, 6.05%, 10/25/2028 (d) | | |
Series 2004-A, Class A1, 5.89%, 4/25/2029 (d) | | |
NACC Reperforming Loan REMIC Trust Series 2004-R2, Class A1, 6.50%, 10/25/2034 (b) (d) | | |
Nomura Asset Acceptance Corp. Alternative Loan Trust | | |
Series 2003-A1, Class A5, 7.00%, 4/25/2033 | | |
Series 2003-A1, Class A1, 5.50%, 5/25/2033 | | |
Series 2003-A1, Class A2, 6.00%, 5/25/2033 | | |
| | |
Series 2002-QS16, Class A3, IF, 5.27%, 10/25/2017 ‡ (d) | | |
Series 2003-QS9, Class A3, IF, IO, 2.12%, 5/25/2018 ‡ (d) | | |
Reperforming Loan REMIC Trust Series 2005-R1, Class 2A, PO, 3/25/2035 (b) | | |
Seasoned Credit Risk Transfer Trust | | |
Series 2018-1, Class M60C, 3.50%, 5/25/2057 | | |
Series 2017-4, Class M60C, 3.50%, 6/25/2057 | | |
Series 2018-2, Class M55D, 4.00%, 11/25/2057 | | |
Series 2019-1, Class MT, 3.50%, 7/25/2058 | | |
Series 2019-3, Class M55D, 4.00%, 10/25/2058 | | |
Series 2019-4, Class M55D, 4.00%, 2/25/2059 | | |
Seasoned Loans Structured Transaction Series 2018-2, Class A1, 3.50%, 11/25/2028 | | |
| | |
Series 1994-1, Class 1, 4.43%, 2/15/2024 (d) | | |
Series 1996-1, Class 1Z, 6.75%, 2/15/2026 | | |
Series 1996-2, Class 1Z, 6.75%, 6/15/2026 | | |
Series 1997-1, Class 2Z, 7.50%, 2/15/2027 | | |
Series 1998-1, Class 2E, 7.00%, 3/15/2028 | | |
WaMu Mortgage Pass-Through Certificates Trust | | |
Series 2003-AR5, Class A7, 4.83%, 6/25/2033 (d) | | |
Series 2004-AR3, Class A2, 4.52%, 6/25/2034 (d) | | |
Washington Mutual Mortgage Pass-Through Certificates WMALT Trust Series 2005-4, Class CB7, 5.50%, 6/25/2035 | | |
Washington Mutual MSC Mortgage Pass-Through Certificates Trust Series 2003-MS7, Class P, PO, 3/25/2033 | | |
Total Collateralized Mortgage Obligations
(Cost $10,456) | | |
Mortgage-Backed Securities — 10.1% |
| | |
Pool # 785618, ARM, 5.87%, 7/1/2026 (d) | | |
Pool # 611141, ARM, 4.30%, 1/1/2027 (d) | | |
SEE NOTES TO FINANCIAL STATEMENTS.
| JPMorgan Institutional Trust Funds | |
JPMorgan Intermediate Bond Trust
SCHEDULE OF PORTFOLIO INVESTMENTS
AS OF August 31, 2023 (Unaudited) (continued)
| | |
Mortgage-Backed Securities — continued |
Pool # 1G2557, ARM, 5.48%, 6/1/2036 (d) | | |
Pool # 1A1085, ARM, 6.11%, 8/1/2036 (d) | | |
Pool # 1B7242, ARM, 5.10%, 9/1/2036 (d) | | |
Pool # 1Q0105, ARM, 5.33%, 9/1/2036 (d) | | |
Pool # 1Q0737, ARM, 3.99%, 11/1/2036 (d) | | |
Pool # 1N1511, ARM, 6.41%, 1/1/2037 (d) | | |
Pool # 1Q0739, ARM, 6.26%, 3/1/2037 (d) | | |
Pool # 1Q0722, ARM, 4.63%, 4/1/2038 (d) | | |
FHLMC Gold Pools, 20 Year Pool # C90985, 6.50%, 8/1/2026 | | |
FHLMC Gold Pools, 30 Year | | |
Pool # G00245, 8.00%, 8/1/2024 | | |
Pool # C00376, 8.00%, 11/1/2024 | | |
Pool # C00414, 7.50%, 8/1/2025 | | |
Pool # C00452, 7.00%, 4/1/2026 | | |
Pool # G00981, 8.50%, 7/1/2028 | | |
Pool # A17537, 6.00%, 1/1/2034 | | |
Pool # G02682, 7.00%, 2/1/2037 | | |
Pool # Q58054, 4.50%, 11/1/2046 | | |
| | |
Pool # WN1157, 1.80%, 11/1/2028 | | |
Pool # G20027, 10.00%, 10/1/2030 | | |
Pool # U80336, 3.50%, 5/1/2033 | | |
Pool # U90690, 3.50%, 6/1/2042 | | |
Pool # U90975, 4.00%, 6/1/2042 | | |
Pool # U91427, 3.50%, 5/1/2043 | | |
FHLMC UMBS, 30 Year Pool # RA7937, 5.00%, 9/1/2052 | | |
| | |
Pool # 54844, ARM, 3.98%, 9/1/2027 (d) | | |
Pool # 303532, ARM, 4.34%, 3/1/2029 (d) | | |
Pool # 745446, ARM, 4.93%, 4/1/2033 (d) | | |
Pool # 746299, ARM, 4.06%, 9/1/2033 (d) | | |
Pool # 743546, ARM, 3.73%, 11/1/2033 (d) | | |
Pool # 735332, ARM, 4.86%, 8/1/2034 (d) | | |
Pool # 790964, ARM, 3.90%, 9/1/2034 (d) | | |
Pool # 896463, ARM, 5.10%, 10/1/2034 (d) | | |
Pool # 816361, ARM, 3.70%, 1/1/2035 (d) | | |
Pool # 810896, ARM, 6.62%, 1/1/2035 (d) | | |
Pool # 816597, ARM, 4.04%, 2/1/2035 (d) | | |
Pool # 816594, ARM, 6.64%, 2/1/2035 (d) | | |
Pool # 745862, ARM, 5.23%, 4/1/2035 (d) | | |
Pool # 832801, ARM, 3.89%, 9/1/2035 (d) | | |
Pool # 843026, ARM, 5.96%, 9/1/2035 (d) | | |
Pool # 920340, ARM, 5.25%, 2/1/2036 (d) | | |
| | |
|
Pool # 886558, ARM, 4.02%, 8/1/2036 (d) | | |
Pool # 893424, ARM, 3.83%, 9/1/2036 (d) | | |
Pool # 915645, ARM, 4.93%, 2/1/2037 (d) | | |
Pool # 913984, ARM, 6.72%, 2/1/2037 (d) | | |
Pool # 887094, ARM, 5.54%, 7/1/2046 (d) | | |
FNMA UMBS, 15 Year Pool # 995381, 6.00%, 1/1/2024 | | |
| | |
Pool # 250066, 8.00%, 5/1/2024 | | |
Pool # 250103, 8.50%, 7/1/2024 | | |
Pool # 303031, 7.50%, 10/1/2024 | | |
Pool # 308499, 8.50%, 5/1/2025 | | |
Pool # 695533, 8.00%, 6/1/2027 | | |
Pool # 313687, 7.00%, 9/1/2027 | | |
Pool # 755973, 8.00%, 11/1/2028 | | |
Pool # 598559, 6.50%, 8/1/2031 | | |
Pool # 995409, 8.00%, 11/1/2032 | | |
Pool # 675555, 6.00%, 12/1/2032 | | |
Pool # 674349, 6.00%, 3/1/2033 | | |
Pool # 702901, 6.00%, 5/1/2033 | | |
Pool # 721535, 5.00%, 7/1/2033 | | |
Pool # 723852, 5.00%, 7/1/2033 | | |
Pool # 729296, 5.00%, 7/1/2033 | | |
Pool # 713700, 4.50%, 8/1/2033 | | |
Pool # 737825, 6.00%, 9/1/2033 | | |
Pool # 725027, 5.00%, 11/1/2033 | | |
Pool # 725017, 5.50%, 12/1/2033 | | |
Pool # AA0922, 6.00%, 9/1/2036 | | |
Pool # 986648, 6.00%, 9/1/2037 | | |
Pool # AD9151, 5.00%, 8/1/2040 | | |
Pool # BM3375, 4.00%, 1/1/2048 | | |
Pool # BK8753, 4.50%, 6/1/2049 | | |
Pool # BP6363, 3.00%, 4/1/2050 | | |
Pool # CB2637, 2.50%, 1/1/2052 | | |
Pool # FS0882, 2.50%, 3/1/2052 | | |
| | |
Pool # 252409, 6.50%, 3/1/2029 | | |
Pool # 752786, 6.00%, 9/1/2033 | | |
| | |
Pool # AM8317, 2.96%, 3/1/2025 | | |
Pool # AN2309, 2.21%, 7/1/2026 | | |
Pool # AM7515, 3.34%, 2/1/2027 | | |
Pool # BS8224, 4.10%, 5/1/2028 | | |
Pool # BL1040, 3.81%, 12/1/2028 | | |
Pool # BL0907, 3.88%, 12/1/2028 | | |
SEE NOTES TO FINANCIAL STATEMENTS.
| JPMorgan Institutional Trust Funds | |
| | |
Mortgage-Backed Securities — continued |
Pool # BS4956, 2.27%, 4/1/2029 | | |
Pool # AM6892, 3.76%, 9/1/2029 | | |
Pool # BM4162, 3.12%, 10/1/2029 (d) | | |
Pool # BL4333, 2.52%, 11/1/2029 | | |
Pool # BS8252, 4.36%, 4/1/2030 | | |
Pool # BS8846, 4.09%, 7/1/2030 | | |
Pool # BS4030, 1.96%, 1/1/2032 | | |
Pool # BS5117, 2.58%, 3/1/2032 | | |
Pool # 888408, 6.00%, 3/1/2037 | | |
Pool # 257172, 5.50%, 4/1/2038 | | |
Pool # MA1125, 4.00%, 7/1/2042 | | |
Pool # BM6734, 4.00%, 8/1/2059 | | |
Pool # BF0617, 2.50%, 3/1/2062 | | |
| | |
Pool # 352022, 7.00%, 11/15/2023 | | |
Pool # 366706, 6.50%, 1/15/2024 | | |
Pool # 442119, 7.50%, 11/15/2026 | | |
Pool # 411829, 7.50%, 7/15/2027 | | |
Pool # 468149, 8.00%, 8/15/2028 | | |
Pool # 468236, 6.50%, 9/15/2028 | | |
Pool # 486537, 7.50%, 9/15/2028 | | |
Pool # 466406, 6.00%, 11/15/2028 | | |
Pool # 607645, 6.50%, 2/15/2033 | | |
Pool # 781614, 7.00%, 6/15/2033 | | |
Pool # 782615, 7.00%, 6/15/2035 | | |
Pool # 782025, 6.50%, 12/15/2035 | | |
Pool # 681638, 6.00%, 12/15/2038 | | |
| | |
Pool # 1974, 8.50%, 3/20/2025 | | |
Pool # 1989, 8.50%, 4/20/2025 | | |
Pool # 2006, 8.50%, 5/20/2025 | | |
Pool # 2141, 8.00%, 12/20/2025 | | |
Pool # 2234, 8.00%, 6/20/2026 | | |
Pool # 2270, 8.00%, 8/20/2026 | | |
Pool # 2285, 8.00%, 9/20/2026 | | |
Pool # 2324, 8.00%, 11/20/2026 | | |
Pool # 2499, 8.00%, 10/20/2027 | | |
Pool # 2512, 8.00%, 11/20/2027 | | |
Pool # 2525, 8.00%, 12/20/2027 | | |
Pool # 2549, 7.50%, 2/20/2028 | | |
Pool # 2562, 6.00%, 3/20/2028 | | |
Pool # 2646, 7.50%, 9/20/2028 | | |
Pool # 4245, 6.00%, 9/20/2038 | | |
Pool # BA7567, 4.50%, 5/20/2048 | | |
Pool # BI0416, 4.50%, 11/20/2048 | | |
| | |
|
Pool # BM9692, 4.50%, 7/20/2049 | | |
Pool # BQ3224, 4.50%, 9/20/2049 | | |
Pool # MA7534, 2.50%, 8/20/2051 | | |
Pool # MA7649, 2.50%, 10/20/2051 | | |
GNMA II, Other Pool # AD0860, 3.50%, 11/20/2033 | | |
Total Mortgage-Backed Securities
(Cost $8,981) | | |
Asset-Backed Securities — 9.2% |
Air Canada Pass-Through Trust (Canada) Series 2017-1, Class AA, 3.30%, 1/15/2030 (b) | | |
Ally Auto Receivables Trust Series 2023-1, Class A3, 5.46%, 5/15/2028 | | |
American Airlines Pass-Through Trust | | |
Series 2016-3, Class AA, 3.00%, 10/15/2028 | | |
Series 2021-1, Class B, 3.95%, 7/11/2030 | | |
American Credit Acceptance Receivables Trust | | |
Series 2023-2, Class A, 5.89%, 10/13/2026 (b) | | |
Series 2023-1, Class C, 5.59%, 4/12/2029 (b) | | |
AmeriCredit Automobile Receivables Trust | | |
Series 2021-1, Class A3, 0.37%, 8/18/2025 | | |
Series 2020-3, Class B, 0.76%, 12/18/2025 | | |
Series 2021-2, Class B, 0.69%, 1/19/2027 | | |
Series 2022-2, Class A3, 4.38%, 4/18/2028 | | |
AMSR Trust Series 2020-SFR5, Class A, 1.38%, 11/17/2037 (b) | | |
Amur Equipment Finance Receivables X LLC Series 2022-1A, Class A2, 1.64%, 10/20/2027 (b) | | |
Avis Budget Rental Car Funding AESOP LLC Series 2020-1A, Class A, 2.33%, 8/20/2026 (b) | | |
BA Credit Card Trust Series 2020-A1, Class A1, 0.34%, 5/15/2026 | | |
BMW Vehicle Lease Trust Series 2023-1, Class A3, 5.16%, 11/25/2025 | | |
BMW Vehicle Owner Trust Series 2023-A, Class A3, 5.47%, 2/25/2028 | | |
British Airways Pass-Through Trust (United Kingdom) Series 2018-1, Class AA, 3.80%, 9/20/2031 (b) | | |
| | |
Series 2020-1, Class A3, 1.89%, 12/16/2024 | | |
Series 2020-3, Class A3, 0.62%, 3/17/2025 | | |
Series 2021-1, Class A3, 0.34%, 12/15/2025 | | |
Series 2022-2, Class A3, 3.49%, 2/16/2027 | | |
Carvana Auto Receivables Trust | | |
Series 2021-P3, Class A3, 0.70%, 11/10/2026 | | |
Series 2023-N1, Class A, 6.36%, 4/12/2027 (b) | | |
Series 2022-P3, Class A3, 4.61%, 11/10/2027 | | |
SEE NOTES TO FINANCIAL STATEMENTS.
| JPMorgan Institutional Trust Funds | |
JPMorgan Intermediate Bond Trust
SCHEDULE OF PORTFOLIO INVESTMENTS
AS OF August 31, 2023 (Unaudited) (continued)
| | |
Asset-Backed Securities — continued |
Series 2021-P4, Class A4, 1.64%, 12/10/2027 | | |
CIG Auto Receivables Trust Series 2021-1A, Class A, 0.69%, 4/14/2025 (b) | | |
CoreVest American Finance Trust | | |
Series 2019-3, Class A, 2.71%, 10/15/2052 (b) | | |
Series 2022-1, Class A, 4.74%, 6/17/2055 (b) (d) | | |
CPS Auto Receivables Trust Series 2022-C, Class B, 4.88%, 4/15/2030 (b) | | |
Credit Acceptance Auto Loan Trust | | |
Series 2021-2A, Class A, 0.96%, 2/15/2030 (b) | | |
Series 2023-1A, Class B, 7.02%, 5/16/2033 (b) | | |
Drive Auto Receivables Trust Series 2021-3, Class B, 1.11%, 5/15/2026 | | |
| | |
Series 2022-1A, Class A, 1.58%, 4/15/2026 (b) | | |
Series 2022-2A, Class A, 2.88%, 6/15/2026 (b) | | |
Series 2021-3A, Class C, 0.87%, 5/17/2027 (b) | | |
Series 2021-4A, Class D, 1.99%, 9/15/2027 (b) | | |
Series 2023-1A, Class C, 5.55%, 10/16/2028 (b) | | |
Series 2023-2A, Class B, 5.41%, 2/15/2029 (b) | | |
Exeter Automobile Receivables Trust | | |
Series 2022-3A, Class A3, 4.21%, 1/15/2026 | | |
Series 2021-4A, Class B, 1.05%, 5/15/2026 | | |
Series 2022-5A, Class B, 5.97%, 3/15/2027 | | |
Series 2023-2A, Class B, 5.61%, 9/15/2027 | | |
Series 2022-2A, Class D, 4.56%, 7/17/2028 | | |
Series 2022-4A, Class C, 4.92%, 12/15/2028 | | |
Series 2023-1A, Class D, 6.69%, 6/15/2029 | | |
FHF Trust Series 2023-1A, Class A2, 6.57%, 6/15/2028 (b) | | |
Flagship Credit Auto Trust | | |
Series 2019-4, Class C, 2.77%, 12/15/2025 (b) | | |
Series 2021-4, Class A, 0.81%, 7/17/2026 (b) | | |
Series 2022-1, Class A, 1.79%, 10/15/2026 (b) | | |
Series 2022-2, Class A3, 4.03%, 12/15/2026 (b) | | |
Series 2023-1, Class A2, 5.38%, 12/15/2026 (b) | | |
Series 2023-2, Class A2, 5.76%, 4/15/2027 (b) | | |
Series 2021-3, Class A, 0.36%, 7/15/2027 (b) | | |
Series 2023-1, Class C, 5.43%, 5/15/2029 (b) | | |
Ford Credit Auto Owner Trust Series 2023-A, Class A3, 4.65%, 2/15/2028 | | |
FRTKL Series 2021-SFR1, Class A, 1.57%, 9/17/2038 (b) | | |
GE Capital Mortgage Services, Inc. Trust Series 1999-HE1, Class M, 6.71%, 4/25/2029 (d) | | |
| | |
|
GLS Auto Receivables Issuer Trust | | |
Series 2021-4A, Class A, 0.84%, 7/15/2025 (b) | | |
Series 2021-3A, Class C, 1.11%, 9/15/2026 (b) | | |
Series 2023-2A, Class A2, 5.70%, 1/15/2027 (b) | | |
Series 2023-3A, Class B, 5.89%, 1/18/2028 (b) | | |
GM Financial Automobile Leasing Trust | | |
Series 2022-2, Class A3, 3.42%, 6/20/2025 | | |
Series 2023-1, Class A3, 5.16%, 4/20/2026 | | |
GM Financial Consumer Automobile Receivables Trust | | |
Series 2021-1, Class A3, 0.35%, 10/16/2025 | | |
Series 2023-3, Class A3, 5.45%, 6/16/2028 | | |
Gold Key Resorts LLC Series 2014-A, Class A, 3.22%, 3/17/2031 (b) | | |
Home Partners of America Trust Series 2022-1, Class D, 4.73%, 4/17/2039 (b) | | |
Honda Auto Receivables Owner Trust Series 2023-1, Class A3, 5.04%, 4/21/2027 | | |
Hyundai Auto Receivables Trust Series 2023-B, Class A3, 5.48%, 4/17/2028 | | |
Kubota Credit Owner Trust Series 2023-1A, Class A3, 5.02%, 6/15/2027 (b) | | |
Mercedes-Benz Auto Receivables Trust Series 2023-1, Class A3, 4.51%, 11/15/2027 | | |
MVW LLC Series 2021-2A, Class A, 1.43%, 5/20/2039 (b) | | |
Nissan Auto Lease Trust Series 2023-A, Class A3, 4.91%, 1/15/2026 | | |
OneMain Direct Auto Receivables Trust Series 2023-1A, Class A, 5.41%, 11/14/2029 (b) | | |
Progress Residential Trust | | |
Series 2021-SFR8, Class E1, 2.38%, 10/17/2038 (b) | | |
Series 2022-SFR3, Class A, 3.20%, 4/17/2039 (b) | | |
Santander Consumer Auto Receivables Trust Series 2021-AA, Class A3, 0.33%, 10/15/2025 (b) | | |
Santander Drive Auto Receivables Trust | | |
Series 2020-4, Class C, 1.01%, 1/15/2026 | | |
Series 2021-2, Class C, 0.90%, 6/15/2026 | | |
Series 2022-3, Class A3, 3.40%, 12/15/2026 | | |
Series 2022-4, Class A3, 4.14%, 2/16/2027 | | |
Series 2022-5, Class B, 4.43%, 3/15/2027 | | |
Series 2023-2, Class A3, 5.21%, 7/15/2027 | | |
Series 2023-3, Class A3, 5.61%, 10/15/2027 | | |
Series 2023-1, Class B, 4.98%, 2/15/2028 | | |
Santander Retail Auto Lease Trust Series 2022-A, Class A3, 1.34%, 7/21/2025 (b) | | |
SEE NOTES TO FINANCIAL STATEMENTS.
| JPMorgan Institutional Trust Funds | |
| | |
Asset-Backed Securities — continued |
SCF Equipment Leasing LLC Series 2022-2A, Class A3, 6.50%, 10/21/2030 (b) | | |
Securitized Asset-Backed Receivables LLC Trust Series 2006-CB1, Class AF2, 2.85%, 1/25/2036 (f) | | |
Spirit Airlines Pass-Through Trust Series 2017-1, Class AA, 3.38%, 2/15/2030 | | |
SpringCastle America Funding LLC Series 2020-AA, Class A, 1.97%, 9/25/2037 (b) | | |
Tesla Auto Lease Trust Series 2021-B, Class A4, 0.63%, 9/22/2025 (b) | | |
Toyota Auto Receivables Owner Trust | | |
Series 2021-A, Class A3, 0.26%, 5/15/2025 | | |
Series 2020-C, Class A4, 0.57%, 10/15/2025 | | |
Toyota Lease Owner Trust Series 2023-A, Class A3, 4.93%, 4/20/2026 (b) | | |
United Airlines Pass-Through Trust | | |
Series 2016-2, Class AA, 2.88%, 10/7/2028 | | |
Series 2018-1, Class A, 3.70%, 3/1/2030 | | |
US Auto Funding Trust Series 2022-1A, Class A, 3.98%, 4/15/2025 (b) | | |
VOLT C LLC Series 2021-NPL9, Class A1, 1.99%, 5/25/2051 (b) (f) | | |
VOLT CI LLC Series 2021-NP10, Class A1, 1.99%, 5/25/2051 (b) (f) | | |
VOLT XCIII LLC Series 2021-NPL2, Class A1, 1.89%, 2/27/2051 (b) (f) | | |
VOLT XCIV LLC Series 2021-NPL3, Class A1, 2.24%, 2/27/2051 (b) (f) | | |
VOLT XCIX LLC Series 2021-NPL8, Class A1, 2.12%, 4/25/2051 (b) (f) | | |
VOLT XCVI LLC Series 2021-NPL5, Class A1, 2.12%, 3/27/2051 (b) (f) | | |
VOLT XCVII LLC Series 2021-NPL6, Class A1, 2.24%, 4/25/2051 (b) (f) | | |
Westlake Automobile Receivables Trust | | |
Series 2022-3A, Class A3, 5.49%, 7/15/2026 (b) | | |
Series 2021-3A, Class D, 2.12%, 1/15/2027 (b) | | |
Series 2023-3A, Class A3, 5.82%, 5/17/2027 (b) | | |
Series 2023-1A, Class A3, 5.21%, 1/18/2028 (b) | | |
World Omni Auto Receivables Trust | | |
Series 2021-A, Class A3, 0.30%, 1/15/2026 | | |
Series 2022-B, Class A3, 3.25%, 7/15/2027 | | |
Series 2023-A, Class A3, 4.83%, 5/15/2028 | | |
World Omni Automobile Lease Securitization Trust Series 2021-A, Class A3, 0.42%, 8/15/2024 | | |
Total Asset-Backed Securities
(Cost $7,897) | | |
| | |
Commercial Mortgage-Backed Securities — 6.3% |
20 Times Square Trust Series 2018-20TS, Class A, 3.20%, 5/15/2035 (b) (d) | | |
BXP Trust Series 2017-GM, Class A, 3.38%, 6/13/2039 (b) | | |
Commercial Mortgage Trust Series 2015-CR25, Class A4, 3.76%, 8/10/2048 | | |
FHLMC, Multi-Family Structured Pass-Through Certificates | | |
Series KL3L, Class ALNZ, 3.46%, 4/25/2025 (d) | | |
Series KLU2, Class A7, 2.23%, 9/25/2025 (d) | | |
Series K737, Class AM, 2.10%, 10/25/2026 | | |
Series K069, Class A2, 3.19%, 9/25/2027 (d) | | |
Series K081, Class A1, 3.88%, 2/25/2028 | | |
Series K083, Class A2, 4.05%, 9/25/2028 (d) | | |
Series K088, Class A2, 3.69%, 1/25/2029 | | |
Series K-151, Class A2, 3.80%, 10/25/2032 (d) | | |
| | |
Series 2014-M2, Class A2, 3.51%, 12/25/2023 (d) | | |
Series 2014-M13, Class A2, 3.02%, 8/25/2024 (d) | | |
Series 2015-M7, Class A2, 2.59%, 12/25/2024 | | |
Series 2018-M2, Class A2, 3.00%, 1/25/2028 (d) | | |
Series 2020-M50, Class A2, 1.20%, 10/25/2030 | | |
Series 2020-M50, Class X1, IO, 1.93%, 10/25/2030 (d) | | |
Series 2021-M11, Class A2, 1.51%, 3/25/2031 (d) | | |
Series 2021-M3, Class 1A1, 1.00%, 11/25/2033 | | |
Series 2021-M3, Class X1, IO, 2.05%, 11/25/2033 (d) | | |
Morgan Stanley Capital I Trust Series 2021-PLZA, Class A, 2.57%, 11/9/2043 ‡ (b) | | |
MRCD MARK Mortgage Trust Series 2019-PARK, Class A, 2.72%, 12/15/2036 (b) | | |
SLG Office Trust Series 2021-OVA, Class A, 2.59%, 7/15/2041 (b) | | |
UBS-BAMLL Trust Series 2012-WRM, Class A, 3.66%, 6/10/2030 (b) | | |
Total Commercial Mortgage-Backed Securities
(Cost $5,615) | | |
Foreign Government Securities — 0.2% |
United Mexican States 2.66%, 5/24/2031
(Cost $199) | | |
U.S. Government Agency Securities — 0.1% |
Resolution Funding Corp. STRIPS
DN, 3.36%, 1/15/2026 (a) (Cost $56) | | |
SEE NOTES TO FINANCIAL STATEMENTS.
| JPMorgan Institutional Trust Funds | |
JPMorgan Intermediate Bond Trust
SCHEDULE OF PORTFOLIO INVESTMENTS
AS OF August 31, 2023 (Unaudited) (continued)
| | |
Short-Term Investments — 2.6% |
Investment Companies — 2.6% |
JPMorgan Prime Money Market Fund Class Institutional Shares, 5.38% (g) (h)
(Cost $2,171) | | |
Total Investments — 99.5%
(Cost $88,023) | | |
Other Assets Less Liabilities — 0.5% | | |
| | |
Percentages indicated are based on net assets. |
Amounts presented as a dash ("-") represent amounts that round to less than a thousand. |
| |
| Alternative Credit Enhancement Securities |
| Adjustable Rate Mortgage. The interest rate shown is the rate in effect as of August 31, 2023. |
| Chicago Mercantile Exchange |
| |
| Federal Home Loan Mortgage Corp. |
| Federal National Mortgage Association |
| Government National Mortgage Association |
| Intercontinental Exchange |
| Inverse Floaters represent securities that pay interest at a rate that increases (decreases) with a decline (incline) in a specified index or have an interest rate that adjusts periodically based on changes in current interest rates and prepayments on the underlying pool of assets. The interest rate shown is the rate in effect as of August 31, 2023. The rate may be subject to a cap and floor. |
| Interest Only represents the right to receive the monthly interest payments on an underlying pool of mortgage loans. The principal amount shown represents the par value on the underlying pool. The yields on these securities are subject to accelerated principal paydowns as a result of prepayment or refinancing of the underlying pool of mortgage instruments. As a result, interest income may be reduced considerably. |
| London Interbank Offered Rate |
| Principal Only represents the right to receive the principal portion only on an underlying pool of mortgage loans. The market value of these securities is extremely volatile in response to changes in market interest rates. As prepayments on the underlying mortgages of these securities increase, the yield on these securities increases. |
| Real Estate Investment Trust |
| Real Estate Mortgage Investment Conduit |
| Secured Overnight Financing Rate |
| Separate Trading of Registered Interest and Principal of Securities. The STRIPS Program lets investors hold and trade individual interest and principal components of eligible notes and bonds as separate securities. |
| Uniform Mortgage-Backed Securities |
| |
| Amount rounds to less than 0.1% of net assets. |
| Value determined using significant unobservable inputs. | |
| The rate shown is the effective yield as of August 31, 2023. | |
| Securities exempt from registration under Rule 144A or section 4(a)(2), of the Securities Act of 1933, as amended. | |
| Variable or floating rate security, linked to the referenced benchmark. The interest rate shown is the current rate as of August 31, 2023. | |
| Variable or floating rate security, the interest rate of which adjusts periodically based on changes in current interest rates and prepayments on the underlying pool of assets. The interest rate shown is the current rate as of August 31, 2023. | |
| | |
| Step bond. Interest rate is a fixed rate for an initial period that either resets at a specific date or may reset in the future contingent upon a predetermined trigger. The interest rate shown is the current rate as of August 31, 2023. | |
| Investment in an affiliated fund, which is registered under the Investment Company Act of 1940, as amended, and is advised by J.P. Morgan Investment Management Inc. | |
| The rate shown is the current yield as of August 31, 2023. | |
SEE NOTES TO FINANCIAL STATEMENTS.
| JPMorgan Institutional Trust Funds | |
STATEMENTS OF ASSETS AND LIABILITIES
AS OF August 31, 2023 (Unaudited)
(Amounts in thousands, except per share amounts)
| | |
| | |
Investments in non-affiliates, at value | | |
Investments in affiliates, at value | | |
Deposits at broker for futures contracts | | |
| | |
Investment securities sold | | |
Interest from non-affiliates | | |
Dividends from affiliates | | |
Variation margin on futures contracts | | |
| | |
| | |
| | |
| | |
| | |
Investment securities purchased — delayed delivery securities | | |
| | |
| | |
Custodian and accounting fees | | |
Trustees’ and Chief Compliance Officer’s fees | | |
| | |
| | |
| | |
| | |
| | |
Total distributable earnings (loss) | | |
| | |
| | |
Outstanding units of beneficial interest (shares)
($0.0001 par value; unlimited number of shares authorized): | | |
Net asset value, offering and redemption price per share (a) | | |
Cost of investments in non-affiliates | | |
Cost of investments in affiliates | | |
(a)
Per share amounts may not recalculate due to rounding of net assets and/or shares outstanding.
SEE NOTES TO FINANCIAL STATEMENTS.
| JPMorgan Institutional Trust Funds | |
STATEMENTS OF OPERATIONS
FOR THE SIX MONTHS ENDED August 31, 2023 (Unaudited)
(Amounts in thousands)
| | |
| | |
Interest income from non-affiliates | | |
Interest income from affiliates | | |
Dividend income from affiliates | | |
| | |
| | |
| | |
| | |
Custodian and accounting fees | | |
Interest expense to affiliates | | |
| | |
Trustees’ and Chief Compliance Officer’s fees | | |
Printing and mailing costs | | |
| | |
| | |
| | |
| | |
Less expense reimbursements | | |
| | |
Net investment income (loss) | | |
REALIZED/UNREALIZED GAINS (LOSSES): | | |
Net realized gain (loss) on transactions from: | | |
Investments in non-affiliates | | |
Investments in affiliates | | |
| | |
| | |
Change in net unrealized appreciation/depreciation on: | | |
Investments in non-affiliates | | |
Investments in affiliates | | |
| | |
Change in net unrealized appreciation/depreciation | | |
Net realized/unrealized gains (losses) | | |
Change in net assets resulting from operations | | |
(a)
Amount rounds to less than one thousand.
SEE NOTES TO FINANCIAL STATEMENTS.
| JPMorgan Institutional Trust Funds | |
STATEMENTS OF CHANGES IN NET ASSETS
FOR THE PERIODS INDICATED
(Amounts in thousands)
| | JPMorgan Intermediate Bond Trust |
| Six Months Ended
August 31, 2023
(Unaudited) | Year Ended
February 28, 2023 | Six Months Ended
August 31, 2023
(Unaudited) | Year Ended
February 28, 2023 |
CHANGE IN NET ASSETS RESULTING FROM OPERATIONS: | | | | |
Net investment income (loss) | | | | |
| | | | |
Change in net unrealized appreciation/depreciation | | | | |
Change in net assets resulting from operations | | | | |
DISTRIBUTIONS TO SHAREHOLDERS: | | | | |
Total distributions to shareholders | | | | |
| | | | |
Change in net assets resulting from capital transactions | | | | |
| | | | |
| | | | |
| | | | |
| | | | |
| | | | |
Proceeds from shares issued | | | | |
| | | | |
| | | | |
Change in net assets resulting from capital transactions | | | | |
| | | | |
| | | | |
| | | | |
| | | | |
| | | | |
SEE NOTES TO FINANCIAL STATEMENTS.
| JPMorgan Institutional Trust Funds | |
FINANCIAL HIGHLIGHTS
FOR THE PERIODS INDICATED
| Per share operating performance |
| | | |
| Net asset
value,
beginning
of period | Net
investment
income
(loss)(b) | Net realized
and unrealized
gains
(losses) on
investments | Total from
investment
operations | | | |
| | | | | | | |
Six Months Ended August 31, 2023 (Unaudited) | | | | | | | |
Year Ended February 28, 2023 | | | | | | | |
Year Ended February 28, 2022 | | | | | | | |
Year Ended February 28, 2021 | | | | | | | |
Year Ended February 29, 2020 | | | | | | | |
Year Ended February 28, 2019 | | | | | | | |
|
| Annualized for periods less than one year, unless otherwise noted. |
| Calculated based upon average shares outstanding. |
| Not annualized for periods less than one year. |
| Includes adjustments in accordance with accounting principles generally accepted in the United States of America and as such, the net asset values for financial reporting purposes and the returns based upon those net asset values may differ from the net asset values and returns for shareholder transactions. |
| Includes interest expense, if applicable, each of which is less than 0.005% unless otherwise noted. |
SEE NOTES TO FINANCIAL STATEMENTS.
| JPMorgan Institutional Trust Funds | |
| |
| | | Ratios to average net assets(a) |
Net asset
value,
end of
period | | Net assets,
end of
period
(000's) | | Net
investment
income
(loss) | Expenses without
waivers and reimbursements | |
| | | | | | |
| | | | | | |
| | | | | | |
| | | | | | |
| | | | | | |
| | | | | | |
| | | | | | |
SEE NOTES TO FINANCIAL STATEMENTS.
| JPMorgan Institutional Trust Funds | |
FINANCIAL HIGHLIGHTS
FOR THE PERIODS INDICATED
| Per share operating performance |
| | | |
| Net asset
value,
beginning
of period | Net
investment
income
(loss)(b) | Net realized
and unrealized
gains
(losses) on
investments | Total from
investment
operations | | | |
JPMorgan Intermediate Bond Trust | | | | | | | |
Six Months Ended August 31, 2023 (Unaudited) | | | | | | | |
Year Ended February 28, 2023 | | | | | | | |
Year Ended February 28, 2022 | | | | | | | |
Year Ended February 28, 2021 | | | | | | | |
Year Ended February 29, 2020 | | | | | | | |
Year Ended February 28, 2019 | | | | | | | |
|
| Annualized for periods less than one year, unless otherwise noted. |
| Calculated based upon average shares outstanding. |
| Not annualized for periods less than one year. |
| Includes adjustments in accordance with accounting principles generally accepted in the United States of America and as such, the net asset values for financial reporting purposes and the returns based upon those net asset values may differ from the net asset values and returns for shareholder transactions. |
| Includes interest expense, if applicable, each of which is less than 0.005% unless otherwise noted. |
| Amount rounds to less than $0.005. |
| Calculation of the net realized and unrealized gains (losses) per share does not correlate with the Fund’s net realized and unrealized gains (losses) presented in the Statement of Operations due to the timing of capital transactions in relation to the fluctuating market values of the Fund’s investments. |
SEE NOTES TO FINANCIAL STATEMENTS.
| JPMorgan Institutional Trust Funds | |
| |
| | | Ratios to average net assets(a) |
Net asset
value,
end of
period | | Net assets,
end of
period
(000's) | | Net
investment
income
(loss) | Expenses without
waivers and reimbursements | |
| | | | | | |
| | | | | | |
| | | | | | |
| | | | | | |
| | | | | | |
| | | | | | |
| | | | | | |
SEE NOTES TO FINANCIAL STATEMENTS.
| JPMorgan Institutional Trust Funds | |
NOTES TO FINANCIAL STATEMENTS
AS OF August 31, 2023 (Unaudited)
(Dollar values in thousands)
1. Organization
JPMorgan Institutional Trust (the “Trust”) was organized on September 14, 2004 as a Delaware statutory trust, pursuant to a Declaration of Trust dated September 14, 2004 and is registered under the Investment Company Act of 1940, as amended (the “1940 Act”), as an open-end management investment company. The following are two separate diversified series of the Trust (each, a “Fund” and collectively, the “Funds”) covered by this report: JPMorgan Core Bond Trust and JPMorgan Intermediate Bond Trust.
The investment objective of JPMorgan Core Bond Trust (“Core Bond Trust”) is to seek to maximize total return by investing primarily in a diversified portfolio of intermediate- and long-term debt securities.
The investment objective of JPMorgan Intermediate Bond Trust (“Intermediate Bond Trust”) is to seek current income consistent with the preservation of capital by investing in high- and medium-grade fixed income securities with intermediate maturities.
J.P. Morgan Investment Management Inc. (“JPMIM”), an indirect, wholly-owned subsidiary of JPMorgan Chase & Co. (“JPMorgan”), acts as adviser (the “Adviser”) and administrator (the “Administrator”) to the Funds.
2. Significant Accounting Policies
The following is a summary of significant accounting policies followed by the Funds in the preparation of their financial statements. The Funds are investment companies and, accordingly, follow the investment company accounting and reporting guidance of the Financial Accounting Standards Board (“FASB”) Accounting Standards Codification Topic 946 — Investment Companies, which is part of U.S. generally accepted accounting principles (“GAAP”). The preparation of financial statements in conformity with GAAP requires management to make estimates and assumptions that affect (i) the reported amounts of assets and liabilities, (ii) disclosure of contingent assets and liabilities at the date of the financial statements, and (iii) the reported amounts of increases and decreases in net assets from operations during the reporting period. Actual results could differ from those estimates.
A. Valuation of Investments — Investments are valued in accordance with GAAP and the Funds' valuation policies set forth by, and under the supervision and responsibility of, the Board of Trustees of the Trust (the "Board"), which established the following approach to valuation, as described more fully below: (i) investments for which market quotations are readily available shall be valued at their market value and (ii) all other investments for which market quotations are not readily available shall be valued at their fair value as determined in good faith by the Board.
Under Section 2(a)(41) of the 1940 Act, the Board are required to determine fair value for securities that do not have readily available market quotations. Under SEC Rule 2a-5 (Good Faith Determinations of Fair Value), the Board may designate the performance of these fair valuation determinations to a valuation designee. The Board have designated the Adviser as the “Valuation Designee” to perform fair valuation determinations for the Funds on behalf of the Board subject to appropriate oversight by the Board. The Adviser, as Valuation Designee, leverages the J.P. Morgan Asset Management Americas Valuation Committee (“AVC”) to help oversee and carry out the policies for the valuation of investments held in the Funds. The Adviser, as Valuation Designee, remains responsible for the valuation determinations.
This oversight by the AVC includes monitoring the appropriateness of fair values based on results of ongoing valuation oversight including, but not limited to, consideration of macro or security specific events, market events, and pricing vendor and broker due diligence. The Administrator is responsible for discussing and assessing the potential impacts to the fair values on an ongoing basis, and, at least on a quarterly basis, with the AVC and the Board.
A market-based approach is primarily used to value the Funds' investments. Investments for which market quotations are not readily available are fair valued using prices supplied by approved affiliated and/or unaffiliated pricing vendors or third party broker-dealers (collectively referred to as “Pricing Services”) or may be internally fair valued using methods set forth by the valuation policies approved by the Board. This may include the use of related or comparable assets or liabilities, recent transactions, market multiples, book values and other relevant information for the investment. An income-based valuation approach may be used in which the anticipated future cash flows of the investment are discounted to calculate the fair value. Discounts may also be applied due to the nature or duration of any restrictions on the disposition of the investments. Valuations may be based upon current market prices of securities that are comparable in coupon, rating, maturity and industry. It is possible that the estimated values may differ significantly from the values that would have been used had a ready market for the investments existed, and such differences could be material.
Fixed income instruments are valued based on prices received from Pricing Services. The Pricing Services use multiple valuation techniques to determine the valuation of fixed income instruments. In instances where sufficient market activity exists, the Pricing Services may utilize a market-based approach through which trades or quotes from market makers are used to determine the valuation of these instruments. In instances where sufficient market activity may not exist, the Pricing Services also utilize proprietary valuation models which may consider market transactions in comparable securities and the various relationships between securities in determining fair value and/or market characteristics in order to estimate the relevant cash flows, which are then discounted to calculate the fair values.
Investments in open-end investment companies (“Underlying Funds”) are valued at each Underlying Fund’s net asset values ("NAV") per share as of the report date.
| JPMorgan Institutional Trust Funds | |
See the table on “Quantitative Information about Level 3 Fair Value Measurements” for information on the valuation techniques and inputs used to value level 3 securities held by Core Bond Trust at August 31, 2023.
Valuations reflected in this report are as of the report date. As a result, changes in valuation due to market events and/or issuer-related events after the report date and prior to issuance of the report are not reflected herein.
The various inputs that are used in determining the valuation of the Funds' investments are summarized into the three broad levels listed below.
•
Level 1 — Unadjusted inputs using quoted prices in active markets for identical investments.
•
Level 2 — Other significant observable inputs including, but not limited to, quoted prices for similar investments, inputs other than quoted prices that are observable for investments (such as interest rates, prepayment speeds, credit risk, etc.) or other market corroborated inputs.
•
Level 3 — Significant inputs based on the best information available in the circumstances, to the extent observable inputs are not available (including the Funds' assumptions in determining the fair value of investments).
A financial instrument’s level within the fair value hierarchy is based on the lowest level of any input, both individually and in the aggregate, that is significant to the fair value measurement. The inputs or methodology used for valuing instruments are not necessarily an indication of the risk associated with investing in those instruments.
The following tables represent each valuation input as presented on the Schedules of Portfolio Investments ("SOIs"):
| | | | |
| | Level 2
Other significant
observable inputs | Level 3
Significant
unobservable inputs | |
Investments in Securities | | | | |
| | | | |
Collateralized Mortgage Obligations | | | | |
Commercial Mortgage-Backed Securities | | | | |
| | | | |
Foreign Government Securities | | | | |
| | | | |
Mortgage-Backed Securities | | | | |
| | | | |
U.S. Government Agency Securities | | | | |
U.S. Treasury Obligations | | | | |
| | | | |
| | | | |
Total Investments in Securities | | | | |
Appreciation in Other Financial Instruments | | | | |
| | | | |
Depreciation in Other Financial Instruments | | | | |
| | | | |
Total Net Appreciation/ Depreciation in Other Financial Instruments | | | | |
| | | | |
| | Level 2
Other significant
observable inputs | Level 3
Significant
unobservable inputs | |
Investments in Securities | | | | |
| | | | |
Collateralized Mortgage Obligations | | | | |
Commercial Mortgage-Backed Securities | | | | |
| | | | |
Foreign Government Securities | | | | |
Mortgage-Backed Securities | | | | |
| JPMorgan Institutional Trust Funds | |
NOTES TO FINANCIAL STATEMENTS
AS OF August 31, 2023 (Unaudited) (continued)
(Dollar values in thousands)
Intermediate Bond Trust (continued) | | | | |
| | Level 2 Other significant observable inputs | Level 3 Significant unobservable inputs | |
U.S. Government Agency Securities | | | | |
U.S. Treasury Obligations | | | | |
| | | | |
| | | | |
Total Investments in Securities | | | | |
The following is a summary of investments for which significant unobservable inputs (level 3) were used in determining fair value:
| Balance as of
February 28,
2023 | | Change in net
unrealized
appreciation
(depreciation) | Net
accretion
(amortization) | | | | | Balance as of
August 31,
2023 |
Investments in Securities: | | | | | | | | | |
| | | | | | | | | |
Collateralized Mortgage Obligations | | | | | | | | | |
Commercial Mortgage-Backed Securities | | | | | | | | | |
| | | | | | | | | |
|
| Purchases include all purchases of securities and securities received in corporate actions. |
| Sales include all sales of securities, maturities, paydowns and securities tendered in corporate actions. |
| Amount rounds to less than one thousand. |
The changes in net unrealized appreciation (depreciation) attributable to securities owned at August 31, 2023, which were valued using significant unobservable inputs (level 3), amounted to $(1,231). This amount is included in Change in net unrealized appreciation/depreciation on investments in non-affiliates on the Statements of Operations.
For the six months ended August 31, 2023, transfers in and out of level 3 were the result of decreased or increased transparency of market activity and observability of certain inputs used in determining fair value. This change in observability and resulting changes in levels does not impact liquidity or fair value of the Fund's investments or reflect any change in the investment strategy of the Fund.
The significant unobservable inputs used in the fair value measurement of the Funds' investments are listed below. Generally, a change in the assumptions used in any input in isolation may be accompanied by a change in another input. Significant changes in any of the unobservable inputs may significantly impact the fair value measurement. The impact is based on the relationship between each unobservable input and the fair value measurement. Significant increases (decreases) in enterprise multiples may increase (decrease) the fair value measurement. Significant increases (decreases) in the discount for lack of marketability, liquidity discount, probability of default, yield and default rate may decrease (increase) the fair value measurement. A significant change in the discount rate or prepayment rate (Constant Prepayment Rate or PSA Prepayment Model) may decrease or increase the fair value measurement.
Core Bond Trust
Quantitative Information about Level 3 Fair Value Measurements #
| Fair Value at August 31, 2023 | | | Range (Weighted Average) (a) |
| | | | |
| | | Yield (Discount Rate of Cash Flows) | |
| | | | |
| JPMorgan Institutional Trust Funds | |
| Fair Value at August 31, 2023 | | | Range (Weighted Average) (a) |
| | | | |
| | | | |
| | | | |
| | | Yield (Discount Rate of Cash Flows) | |
Collateralized Mortgage Obligations | | | | |
| | | | |
| The table above does not include certain level 3 investments that are valued by brokers and Pricing Services. At August 31, 2023, the value of these investments was $39,869. The inputs for these investments are not readily available or cannot be reasonably estimated and are generally those inputs described in Note 2.A. |
| Unobservable inputs were weighted by the relative fair value of the instruments. |
B. Restricted Securities — Certain securities held by the Funds may be subject to legal or contractual restrictions on resale. Restricted securities generally are resold in transactions exempt from registration under the Securities Act of 1933, as amended (the “Securities Act”). Disposal of these securities may involve time-consuming negotiations and expense. Prompt sale at the current valuation may be difficult and could adversely affect the NAVs of the Funds.
As of August 31, 2023, the Funds had no investments in restricted securities other than securities sold to the Funds under Rule 144A and/or Regulation S under the Securities Act.
C. Loan Assignments — Core Bond Trust invested in debt instruments that are interests in amounts owed to lenders or lending syndicates (a “Lender”) by corporate, governmental or other borrowers (a “Borrower”). A loan is often administered by a bank or other financial institution (the “Agent”) that acts as Agent for all holders. The Agent administers the terms of the loan, as specified in the loan agreement. The above Fund invested in loan assignments of all or a portion of the loans. When a Fund purchases a loan assignment, the Fund has direct rights against the Borrower on a loan, provided, however, the Fund's rights may be more limited than the Lender from which it acquired the assignment and the Fund may be able to enforce its rights only through the Agent. As a result, a Fund assumes the credit risk of the Borrower as well as any other persons interpositioned between the Fund and the Borrower (“Intermediate Participants”). A Fund may incur certain costs and delays in realizing payment on a loan assignment or suffer a loss of principal and/or interest if assets or interests held by the Agent or other Intermediate Participants are determined to be subject to the claims by their creditors. In addition, it is unclear whether loan assignments and other forms of direct indebtedness offer securities law protections against fraud and misrepresentation. Also, because JPMIM may wish to invest in publicly traded securities of a Borrower, it may not have access to material non-public information regarding the Borrower to which other investors have access. Although certain loan assignments are secured by collateral, a Fund could experience delays or limitations in realizing the value on such collateral or have its interest subordinated to other indebtedness of the Borrower.
Loan assignments are vulnerable to market conditions such that economic conditions or other events may reduce the demand for assignments and certain assignments which were liquid when purchased, may become illiquid and difficult to value. In addition, the settlement period for loans is uncertain as there is no standardized settlement schedule applicable to such investments. Therefore, the Fund may not receive the proceeds from a sale of such investments for a period after the sale.
Certain loan assignments are also subject to the risks associated with high yield securities described under Note 7.
D. When-Issued Securities, Delayed Delivery Securities and Forward Commitments — The Funds purchased when-issued securities, including To Be Announced (“TBA”) securities, and entered into contracts to purchase or sell securities for a fixed price that may be settled a month or more after the trade date, or purchased delayed delivery securities which generally settle seven days after the trade date. When-issued securities are securities that have been authorized, but not issued in the market. A forward commitment involves entering into a contract to purchase or sell securities for a fixed price at a future date that may be settled a month or more after the trade date. A delayed delivery security is agreed upon in advance between the buyer and the seller of the security and is generally delivered beyond seven days of the agreed upon date. The purchase of securities on a when-issued, delayed delivery or forward commitment basis involves the risk that the value of the security to be purchased declines before the settlement date. The sale of securities on a forward commitment basis involves the risk that the value of the securities sold may increase before the settlement date. The Funds may be exposed to credit risk if the counterparty fails to perform under the terms of the transaction. Interest income for securities purchased on a when-issued, delayed delivery or forward commitment basis is not accrued until the settlement date.
The Funds may be required to post or receive collateral for delayed delivery securities in the form of cash or securities under a Master Securities Forward Transaction Agreement with the counterparties (each, an “MSFTA”). The collateral requirements are generally calculated by netting the mark-to-market amount for a Fund's transactions under the MSFTA and comparing that amount to the value of the collateral pledged by fund and the counterparty. Daily movement of cash collateral is subject to minimum threshold amounts. Collateral posted by a Fund is held in a segregated account at the Fund's custodian bank and is included on the Statements of Assets and Liabilities as Restricted cash. Collateral received by the Funds
| JPMorgan Institutional Trust Funds | |
NOTES TO FINANCIAL STATEMENTS
AS OF August 31, 2023 (Unaudited) (continued)
(Dollar values in thousands)
is held in a separate segregated account maintained by JPMorgan Chase Bank, N.A. ("JPMCB"), a wholly-owned subsidiary of JPMorgan. These amounts are not reflected on the Funds' Statements of Assets and Liabilities .
The Funds had when-issued securities, delayed delivery securities or forward commitments outstanding as of August 31, 2023, which are shown as a Receivable for Investment securities sold — delayed delivery securities and a Payable for Investment securities purchased — delayed delivery securities, respectively, on the Statements of Assets and Liabilities. The values of these securities held at August 31, 2023 are detailed on the SOIs, if any.
E. Securities Lending — The Funds are authorized to engage in securities lending in order to generate additional income. The Funds are able to lend to approved borrowers. Citibank N.A. (“Citibank”) serves as lending agent for the Funds, pursuant to a Securities Lending Agency Agreement (the “Securities Lending Agency Agreement”). Securities loaned are collateralized by cash equal to at least 100% of the market value plus accrued interest on the securities lent, which is invested in an affiliated money market fund. The Funds retain the interest earned on cash collateral investments but are required to pay the borrower a rebate for the use of the cash collateral. In cases where the lent security is of high value to borrowers, there may be a negative rebate (i.e., a net payment from the borrower to the Funds). Upon termination of a loan, the Funds are required to return to the borrower an amount equal to the cash collateral, plus any rebate owed to the borrowers. The remaining maturities of the securities lending transactions are considered overnight and continuous. Loans are subject to termination by the Funds or the borrower at any time.
The net income earned on the securities lending (after payment of rebates and Citibank’s fee) is included on the Statements of Operations as Income from securities lending (net). The Funds also receive payments from the borrower during the period of the loan, equivalent to dividends and interest earned on the securities loaned, which are recorded as Dividend or Interest income, respectively, on the Statements of Operations.
Under the Securities Lending Agency Agreement, Citibank marks to market the loaned securities on a daily basis. In the event the cash received from the borrower is less than 102% of the value of the loaned securities (105% for loans of non-U.S. securities), Citibank requests additional cash from the borrower so as to maintain a collateralization level of at least 102% of the value of the loaned securities plus accrued interest (105% for loans of non-U.S. securities), subject to certain de minimis amounts.
The value of securities out on loan is recorded as an asset on the Statements of Assets and Liabilities. The value of the cash collateral received is recorded as a liability on the Statements of Assets and Liabilities and details of collateral investments are disclosed on the SOIs.
The Funds bear the risk of loss associated with the collateral investments and are not entitled to additional collateral from the borrower to cover any such losses. To the extent that the value of the collateral investments declines below the amount owed to a borrower, the Funds may incur losses that exceed the amount they earned on lending the security. Upon termination of a loan, the Funds may use leverage (borrow money) to repay the borrower for cash collateral posted if the Adviser does not believe that it is prudent to sell the collateral investments to fund the payment of this liability. Securities lending activity is subject to master netting arrangements.
Securities lending also involves counterparty risks, including the risk that the loaned securities may not be returned in a timely manner or at all. Subject to certain conditions, Citibank has agreed to indemnify the Funds from losses resulting from a borrower’s failure to return a loaned security.
The Funds did not have any securities out on loan at August 31, 2023.
F. Investment Transactions with Affiliates — The Funds invested in Underlying Funds advised by the Adviser. An issuer which is under common control with a Fund may be considered an affiliate. For the purposes of the financial statements, the Funds assume the issuers listed in the tables below to be affiliated issuers. The Underlying Funds’ distributions may be reinvested into such Underlying Funds. Reinvestment amounts are included in the purchases at cost amounts in the tables below.
|
For the six months ended August 31, 2023 |
| | | | | Change in
Unrealized
Appreciation/
(Depreciation) | | | | Capital Gain
Distributions |
JPMorgan Prime Money Market Fund Class Institutional Shares, 5.38% (a) (b) | | | | | | | | | |
|
| Investment in an affiliated fund, which is registered under the Investment Company Act of 1940, as amended, and is advised by J.P. Morgan Investment Management Inc. |
| The rate shown is the current yield as of August 31, 2023. |
| JPMorgan Institutional Trust Funds | |
|
For the six months ended August 31, 2023 |
| | | | | Change in
Unrealized
Appreciation/
(Depreciation) | | | | Capital Gain
Distributions |
JPMorgan Prime Money Market Fund Class Institutional Shares, 5.38% (a) (b) | | | | | | | | | |
|
| Investment in an affiliated fund, which is registered under the Investment Company Act of 1940, as amended, and is advised by J.P. Morgan Investment Management Inc. |
| The rate shown is the current yield as of August 31, 2023. |
| Amount rounds to less than one thousand. |
G. Futures Contracts — Core Bond Trust used treasury futures contracts to manage and hedge interest rate risk associated with portfolio investments. The Fund also used futures contracts to lengthen or shorten the duration of the overall investment portfolio.
Futures contracts provide for the delayed delivery of the underlying instrument at a fixed price or are settled for a cash amount based on the change in the value of the underlying instrument at a specific date in the future. Upon entering into a futures contract, the Fund is required to deposit with the broker, cash or securities in an amount equal to a certain percentage of the contract amount, which is referred to as the initial margin deposit. Subsequent payments, referred to as variation margin, are made or received by the Fund periodically and are based on changes in the market value of open futures contracts. Changes in the market value of open futures contracts are recorded as Change in net unrealized appreciation/depreciation on futures contracts on the Statements of Operations. Realized gains or losses, representing the difference between the value of the contract at the time it was opened and the value at the time it was closed, are reported on the Statements of Operations at the closing or expiration of the futures contract. Securities deposited as initial margin are designated on the SOI, while cash deposited, which is considered restricted, is recorded on the Statements of Assets and Liabilities. A receivable from and/or a payable to brokers for the daily variation margin is also recorded on the Statements of Assets and Liabilities.
The use of futures contracts exposes the Fund to interest rate risk. The Fund may be subject to the risk that the change in the value of the futures contract may not correlate perfectly with the underlying instrument. Use of long futures contracts subjects the Fund to risk of loss in excess of the amounts shown on the Statements of Assets and Liabilities, up to the notional amount of the futures contracts. Use of short futures contracts subjects the Fund to unlimited risk of loss. The Fund may enter into futures contracts only on exchanges or boards of trade. The exchange or board of trade acts as the counterparty to each futures transaction; therefore, the Fund's credit risk is limited to failure of the exchange or board of trade. Under some circumstances, futures exchanges may establish daily limits on the amount that the price of a futures contract can vary from the previous day’s settlement price, which could effectively prevent liquidation of positions.
The Fund's futures contracts are not subject to master netting arrangements (the right to close out all transactions traded with a counterparty and net amounts owed or due across transactions).
The table below discloses the volume of the Fund's futures contracts activity during the six months ended August 31, 2023:
| |
| |
Average Notional Balance Long | |
Average Notional Balance Short | |
Ending Notional Balance Long | |
Ending Notional Balance Short | |
H. Security Transactions and Investment Income — Investment transactions are accounted for on the trade date (the date the order to buy or sell is executed). Securities gains and losses are calculated on a specifically identified cost basis.
Interest income is determined on the basis of coupon interest accrued using the effective interest method, which adjusts for amortization of premiums and accretion of discounts.
Dividend income, net of foreign taxes withheld, if any, is recorded on the ex-dividend date or when the Funds first learn of the dividend.
Core Bond Trust invests in treasury inflation protected securities (TIPS). The principal amount of TIPS is adjusted periodically and is increased for inflation or decreased for deflation based on a monthly published index. These adjustments are recorded as increases or decreases to interest income on the Statements of Operations. Coupon payments are based on the adjusted principal at the time the interest is paid.
| JPMorgan Institutional Trust Funds | |
NOTES TO FINANCIAL STATEMENTS
AS OF August 31, 2023 (Unaudited) (continued)
(Dollar values in thousands)
To the extent such information is publicly available, the Funds record distributions received in excess of income earned from underlying investments as a reduction of cost of investments and/or realized gain. Such amounts are based on estimates if actual amounts are not available and actual amounts of income, realized gain and return of capital may differ from the estimated amounts. The Funds adjust the estimated amounts of the components of distributions (and consequently their net investment income) as necessary, once the issuers provide information about the actual composition of the distributions.
I. Allocation of Expenses — Expenses directly attributable to a Fund are charged directly to that Fund, while the expenses attributable to more than one fund of the Trust are allocated among the applicable funds.
J. Federal Income Taxes — Each Fund is treated as a separate taxable entity for Federal income tax purposes. Each Fund's policy is to comply with the provisions of the Internal Revenue Code (the “Code”) applicable to regulated investment companies and to distribute to shareholders all of its distributable net investment income and net realized capital gains on investments. Accordingly, no provision for Federal income tax is necessary. Management has reviewed the Funds' tax positions for all open tax years and has determined that as of August 31, 2023, no liability for Federal income tax is required in the Funds' financial statements for net unrecognized tax benefits. However, management’s conclusions may be subject to future review based on changes in, or the interpretation of, the accounting standards or tax laws and regulations. Each Fund's Federal tax returns for the prior three fiscal years remain subject to examination by the Internal Revenue Service.
K. Distributions to Shareholders — Distributions from net investment income, if any, are generally declared and paid at least monthly and are declared separately for each class. Net realized capital gains, if any, are distributed by each Fund at least annually. The amount of distributions from net investment income and net realized capital gains is determined in accordance with Federal income tax regulations, which may differ from GAAP. To the extent these “book/tax” differences are permanent in nature (i.e., that they result from other than timing of recognition — “temporary differences”), such amounts are reclassified within the capital accounts based on their Federal tax basis treatment.
3. Fees and Other Transactions with Affiliates
A. Investment Advisory Fee — Pursuant to an Investment Advisory Agreement, the Adviser manages the investments of each Fund and for such services is paid a fee. The investment advisory fee is accrued daily and paid monthly at an annual rate of 0.28% of each Fund’s respective average daily net assets.
The Adviser waived investment advisory fees and/or reimbursed expenses as outlined in Note 3.E.
B. Administration Fee — Pursuant to an Administration Agreement, the Administrator provides certain administration services to each Fund. In consideration of these services, the Administrator receives a fee accrued daily and paid monthly at a rate of 0.10% of the Funds' average daily net assets, notwithstanding any fee waivers and/or expense reimbursements.
The Administrator waived administration fees as outlined in Note 3.E.
JPMCB serves as the Funds' sub-administrator (the “Sub-administrator”). For its services as Sub-administrator, JPMCB receives a portion of the fees payable to the Administrator.
C. Custodian and Accounting Fees — JPMCB provides portfolio custody and accounting services to the Funds. For performing these services, the Funds pay JPMCB transaction and asset-based fees that vary according to the number of transactions and positions, plus out-of-pocket expenses. The amounts paid directly to JPMCB by the Funds for custody and accounting services are included in Custodian and accounting fees on the Statements of Operations.
Interest income earned on cash balances at the custodian, if any, is included in Interest income from affiliates on the Statements of Operations.
Interest expense paid to the custodian related to cash overdrafts, if any, is included in Interest expense to affiliates on the Statements of Operations.
D. Placement Agent— J.P. Morgan Institutional Investments, Inc. (the “Placement Agent”), a registered broker-dealer affiliated with the Adviser, serves as the Funds’ Placement Agent. The Placement Agent processes subscriptions for shares and provides various sales support activities in connection with the Funds’ private placement of its shares.
E. Waivers and Reimbursements — The Adviser and Administrator have contractually agreed to waive fees and/or reimburse the Funds to the extent that total annual operating expenses (excluding acquired fund fees and expenses other than certain money market fund fees as described below, dividend and interest expenses related to short sales, interest, taxes, expenses related to litigation and potential litigation, expenses related to trustee elections and extraordinary expenses) exceed the percentages of the Funds' respective average daily net assets as shown in the table below:
| JPMorgan Institutional Trust Funds | |
The expense limitation agreements were in effect for the six months ended August 31, 2023 and the contractual expense limitation percentages in the table above are in place until at least June 30, 2024.
For the six months ended August 31, 2023, the Funds' service providers waived fees and/or reimbursed expenses for each of the Funds as follows. None of these parties expect the Funds to repay any such waived fees and/or reimbursed expenses in future years.
| | |
| | | | Contractual
Reimbursements |
| | | | |
| | | | |
Additionally, the Funds may invest in one or more money market funds advised by the Adviser (affiliated money market funds). The Adviser and Administrator as shareholder servicing agent, have contractually agreed to waive fees and/or reimburse expenses in an amount sufficient to offset the respective net fees each collects from the affiliated money market fund on the applicable Fund's investment in such affiliated money market fund, except for investments of securities lending cash collateral. None of these parties expect the Funds to repay any such waived fees and/or reimbursed expenses in future years.
The amounts of these waivers resulting from investments in these money market funds for the six months ended August 31, 2023 were as follows:
JPMIM voluntarily agreed to reimburse the Funds for the Trustee Fees paid to one of the interested Trustees. For the six months ended August 31, 2023 the amount of these reimbursements were as follows:
F. Other — Certain officers of the Trust are affiliated with the Adviser and the Administrator. Such officers, with the exception of the Chief Compliance Officer, receive no compensation from the Funds for serving in their respective roles.
The Board designated and appointed a Chief Compliance Officer to the Funds pursuant to Rule 38a-1 under the 1940 Act. Each Fund, along with affiliated funds, makes reimbursement payments, on a pro-rata basis, to the Administrator for a portion of the fees associated with the office of the Chief Compliance Officer. Such fees are included in Trustees’ and Chief Compliance Officer’s fees on the Statements of Operations.
The Trust adopted a Trustee Deferred Compensation Plan (the “Plan”) which allows the independent Trustees to defer the receipt of all or a portion of compensation related to performance of their duties as Trustees. The deferred fees are invested in various J.P. Morgan Funds until distribution in accordance with the Plan.
During the six months ended August 31, 2023, the Funds purchased securities from an underwriting syndicate in which the principal underwriter or members of the syndicate were affiliated with the Adviser.
The Securities and Exchange Commission ("SEC") has granted an exemptive order permitting the Funds to engage in principal transactions with J.P. Morgan Securities LLC, an affiliated broker, involving taxable money market instruments, subject to certain conditions.
4. Investment Transactions
During the six months ended August 31, 2023, purchases and sales of investments (excluding short-term investments) were as follows:
| Purchases
(excluding
U.S. Government) | Sales
(excluding
U.S. Government) | Purchases
of U.S.
Government | |
| | | | |
| | | | |
| JPMorgan Institutional Trust Funds | |
NOTES TO FINANCIAL STATEMENTS
AS OF August 31, 2023 (Unaudited) (continued)
(Dollar values in thousands)
5. Federal Income Tax Matters
For Federal income tax purposes, the estimated cost and unrealized appreciation (depreciation) in value of investments held at August 31, 2023 were as follows:
| | Gross
Unrealized
Appreciation | Gross
Unrealized
Depreciation | Net Unrealized
Appreciation
(Depreciation) |
| | | | |
| | | | |
At February 28, 2023, the following Funds had net capital loss carryforwards which are available to offset future realized gains as follows:
| Capital Loss Carryforward Character |
| | |
| | |
| | |
Net capital losses (gains) incurred after October 31, and within the taxable year are deemed to arise on the first business day of the Funds' next taxable year. For the year ended February 28, 2023, the Funds deferred to March 1, 2023 the following net capital losses (gains):
| Net Capital Losses (Gains) |
| | |
| | |
| | |
6. Borrowings
The Funds rely upon an exemptive order granted by the SEC (the “Order”) permitting the establishment and operation of an Interfund Lending Facility (the “Facility”). The Facility allows the Funds to directly lend and borrow money to or from any other fund relying upon the Order at rates beneficial to both the borrowing and lending funds. Advances under the Facility are taken primarily for temporary or emergency purposes, including the meeting of redemption requests that otherwise might require the untimely disposition of securities, and are subject to each Fund's borrowing restrictions. The interfund loan rate is determined, as specified in the Order, by averaging the current repurchase agreement rate and the current bank loan rate. The Order was granted to JPMorgan Trust II and may be relied upon by the Funds because the Funds and the series of JPMorgan Trust II are all investment companies in the same “group of investment companies” (as defined in Section 12(d)(1)(G) of the 1940 Act).
The Funds had no borrowings outstanding from another fund, or loans outstanding to another fund, during the six months ended August 31, 2023.
The Trust and JPMCB have entered into a financing arrangement. Under this arrangement, JPMCB provides an unsecured, uncommitted credit facility in the aggregate amount of $100 million to certain of the J.P. Morgan Funds, including the Funds. Advances under the arrangement are taken primarily for temporary or emergency purposes, including the meeting of redemption requests that otherwise might require the untimely disposition of securities, and are subject to each Fund's borrowing restrictions. Interest on borrowings is payable at a rate determined by JPMCB at the time of borrowing. This agreement has been extended until October 30, 2023.
The Funds had no borrowings outstanding from the unsecured, uncommitted credit facility during the six months ended August 31, 2023.
The Trust, along with certain other trusts for J.P. Morgan Funds (“Borrowers”), has entered into a joint syndicated senior unsecured revolving credit facility totaling $1.5 billion (“Credit Facility”) with various lenders and The Bank of New York Mellon, as administrative agent for the lenders. This Credit Facility provides a source of funds to the Borrowers for temporary and emergency purposes, including the meeting of redemption requests that otherwise might require the untimely disposition of securities. Under the terms of the Credit Facility, a borrowing fund must have a minimum of $25 million in adjusted net asset value and not exceed certain adjusted net asset coverage ratios prior to and during the time in which any borrowings are outstanding. If a fund does not comply with the aforementioned requirements, the fund must remediate within three business days with respect to the $25 million minimum adjusted net asset value or within one business day with respect to certain asset coverage ratios or the administrative agent at the request of, or with the consent of, the lenders may terminate the Credit Facility and declare any outstanding borrowings to be due and payable immediately.
Interest associated with any borrowing under the Credit Facility is charged to the borrowing fund at a rate of interest equal to 1.00% (the "Applicable Margin"), plus the greater on the day of the borrowing, of the federal funds effective rate, or the Adjusted Daily Simple SOFR Rate. Effective August 8, 2023, the Credit Facility was amended and restated for a term of 364 days, unless extended.
| JPMorgan Institutional Trust Funds | |
The Funds did not utilize the Credit Facility during the six months ended August 31, 2023.
7. Risks, Concentrations and Indemnifications
In the normal course of business, the Funds enter into contracts that contain a variety of representations which provide general indemnifications. Each Fund's maximum exposure under these arrangements is unknown. The amount of exposure would depend on future claims that may be brought against each Fund. However, based on experience, the Funds expect the risk of loss to be remote.
As of August 31, 2023, the following Funds had individual shareholder and/or omnibus accounts each owning more than 10% of the respective Fund's outstanding shares as follows:
| Number of
Individual Shareholder
and/or Non-Affiliated
Omnibus Accounts | |
| | |
| | |
Significant shareholder transactions by these shareholders may impact the Funds' performance and liquidity.
The Funds are subject to interest rate risk. Investments in bonds and other debt securities will change in value based on changes in interest rates. If rates increase, the value of these investments generally declines. Securities with greater interest rate sensitivity and longer maturities generally are subject to greater fluctuations in value. The Funds may face a heightened level of interest rate risk due to certain changes in monetary policy. It is difficult to predict the pace at which central banks or monetary authorities may increase interest rates or the timing, frequency, or magnitude of such increases. Any such changes could be sudden and could expose debt markets to significant volatility and reduced liquidity for Fund investments.
The Funds are subject to credit risk. The Funds' investments are subject to the risk that an issuer and/or a counterparty will fail to make payments when due or default completely. Prices of the Funds' investments may be adversely affected if any of the issuers or counterparties it is invested in are subject to an actual or perceived deterioration in their credit quality. Credit spreads may increase, which may reduce the market values of the Funds' securities. Credit spread risk is the risk that economic and market conditions or any actual or perceived credit deterioration may lead to an increase in the credit spreads (i.e., the difference in yield between two securities of similar maturity but different credit quality) and a decline in price of the issuer’s securities.
The Funds are subject to risks associated with securities with contractual cash flows including asset-backed and mortgage-related securities such as collateralized mortgage obligations, mortgage pass-through securities and commercial mortgage-backed securities, including securities backed by sub-prime mortgage loans. The value, liquidity and related income of these securities are sensitive to changes in economic conditions, including real estate value, pre-payments, delinquencies and/or defaults, and may be adversely affected by shifts in the market’s perception of the issuers and changes in interest rates.
The Funds deem subject to the risk that, should the Funds decide to sell an illiquid investment when a ready buyer is not available at a price the Funds deem to be representative of its value, the value of the Funds' net assets could be adversely affected.
LIBOR was a leading floating rate benchmark used in loans, notes, derivatives and other instruments or investments. As a result of benchmark reforms, publication of most LIBOR settings has ceased. Some LIBOR settings continue to be published but only on a temporary, synthetic and non-representative basis. Regulated entities have generally ceased entering into new LIBOR contracts in connection with regulatory guidance or prohibitions. Public and private sector actors have worked to establish alternative reference rates to be used in place of LIBOR. There is no assurance that any such alternative reference rate will be similar to or produce the same value or economic equivalence as LIBOR or that it will have the same volume or liquidity as did LIBOR which may affect the value, volatility, liquidity or return on certain of the Funds' loans, notes, derivatives and other instruments or investments comprising some or all of the Funds' investments and result in costs incurred in connection with changing reference rates used for positions, closing out positions and entering into new trades. Certain of the Funds' investments may have transitioned from LIBOR or will transition from LIBOR in the future. The transition from LIBOR to alternative reference rates may result in operational issues for the Funds or their investments. No assurances can be given as to the impact of the LIBOR transition (and the timing of any such impact) on the Funds and their investments.
The Funds are subject to infectious disease epidemics/pandemics risk. For example, the outbreak of COVID-19 negatively affected economies, markets and individual companies throughout the world, including those in which the Funds invest. The effects of this, or any future, pandemic to public health and business and market conditions may have a significant negative impact on the performance of a Fund's investments, increase a Fund's volatility, exacerbate other pre-existing political, social and economic risks to the Funds and negatively impact broad segments of businesses and populations. In addition, governments, their regulatory agencies, or self-regulatory organizations have taken or may take actions in response to a pandemic that affect the instruments in which the Funds invest, or the issuers of such instruments, in ways that could have a significant negative impact on a Fund’s investment performance. The ultimate impact of any pandemic and the extent to which the associated conditions
| JPMorgan Institutional Trust Funds | |
NOTES TO FINANCIAL STATEMENTS
AS OF August 31, 2023 (Unaudited) (continued)
(Dollar values in thousands)
and governmental responses impact a Fund will also depend on future developments, which are highly uncertain, difficult to accurately predict and subject to frequent changes.
| JPMorgan Institutional Trust Funds | |
SCHEDULE OF SHAREHOLDER EXPENSES
(Unaudited)
Hypothetical $1,000 Investment
As a shareholder of the Funds, you incur ongoing costs, including investment advisory fees, administration fees, and other Fund expenses. The examples below are intended to help you understand your ongoing costs (in dollars) of investing in the Funds and to compare these ongoing costs with the ongoing costs of investing in other mutual funds. The examples assume that you had a $1,000 investment in the Funds at the beginning of the reporting period, March 1, 2023, and continued to hold your shares at the end of the reporting period, August 31, 2023.
Actual Expenses
For each Fund in the table below, the first line provides information about actual account values and actual expenses. You may use the information in this line, together with the amount you invested, to estimate the expenses that you paid over the period. Simply divide your account value by $1,000 (for example, an $8,600 account value divided by $1,000 = 8.6), then multiply the result by the number in the first line of each Fund under the heading titled “Expenses Paid During the Period” to estimate the expenses you paid on your account during this period.
Hypothetical Example for Comparison Purposes
The second line of each Fund in the table below provides information about hypothetical account values and hypothetical expenses based on the actual expense ratio and an assumed
rate of return of 5% per year before expenses, which is not the Funds’ actual return. The hypothetical account values and expenses may not be used to estimate the actual ending account balance or expenses you paid for the period. You may use this information to compare the ongoing costs of investing in the Fund and other funds. To do so, compare this 5% hypothetical example with the 5% hypothetical examples that appear in the shareholder reports of the other funds. Please note that the expenses shown in the table are meant to highlight your ongoing costs only and do not reflect any transaction costs or the costs associated with the investment advisory accounts through which the Fund is held. Therefore, the second line in the table is useful in comparing ongoing costs only, and will not help you determine the relative total costs of owning different funds. In addition, if these transaction costs were included, your costs would have been higher. The examples also assume all dividends and distributions have been reinvested.
| Beginning
Account Value
March 1, 2023 | Ending
Account Value
August 31, 2023 | Expenses
Paid During
the Period* | |
| | | | |
| | | | |
| | | | |
JPMorgan Intermediate Bond Trust | | | | |
| | | | |
| | | | |
|
| Expenses are equal to each Fund’s respective annualized net expense ratio, multiplied by the average account value over the period, multiplied by 184/366 (to reflect the one-half year period). |
| JPMorgan Institutional Trust Funds | |
LIQUIDITY RISK MANAGEMENT PROGRAM
(Unaudited)
Each of the Funds covered in this report has adopted the J.P. Morgan Funds and J.P. Morgan Exchange-Traded Funds Amended and Restated Liquidity Risk Management Program (the “Program”) under Rule 22e-4 under the Investment Company Act of 1940, as amended (the “Liquidity Rule”). The Program seeks to assess, manage and review each Fund’s Liquidity Risk. “Liquidity Risk” is defined as the risk that a fund could not meet requests to redeem shares issued by the fund without significant dilution of remaining investors’ interests in the fund. Pursuant to an exemptive order (the “Exemptive Order”) from the Securities and Exchange Commission, the Program permits the Funds use liquidity definitions and classification methodologies that differ from the requirements under the Liquidity Rule in some respects. Among other things, the Liquidity Rule requires that a written report be provided to the Board of Trustees (the “Board”) on an annual basis that addresses the operation of the Program and assesses the adequacy and effectiveness of its implementation, including the operation of any Highly Liquid Investment Minimum (“HLIM”), where applicable, and any material changes to the Program.
The Board has appointed J.P. Morgan Asset Management’s Liquidity Risk Forum to be the program administrator for the Program (the “Program Administrator”). In addition to regular reporting at each of its quarterly meetings, on February 7, 2023, the Board reviewed the Program Administrator’s annual written report (the “Report”) concerning the operation of the Program for the period from January 1, 2022 through December 31, 2022 (the “Program Reporting Period”). The Report addressed the operation of the Program and assessed its adequacy and effectiveness of implementation, including, where applicable, the operation of a Fund’s HLIM. There were no material changes to the Program during the Reporting Period.
The Report summarized the operation of the Program and the information and factors considered by the Program Administrator in assessing whether the Program has been adequately and effectively implemented with respect to each Fund. Such information and factors included, among other things: (1) the liquidity risk framework used to assess, manage, and periodically review each Fund’s Liquidity Risk and the results of this assessment; (2) the methodology and inputs for classifying the investments of a Fund into one of the required liquidity categories that reflect an estimate of the liquidity of those investments under current market conditions; (3) whether a Fund invested primarily in “Highly Liquid Investments” (as defined or modified under the Program), as well as whether an HLIM should be established for a Fund (and, for Funds that have adopted an HLIM, whether the HLIM continues to be appropriate or whether a Fund has invested below its HLIM) and the procedures for monitoring for any HLIM; (4) whether a Fund invested more than 15% of its assets in “Illiquid Investments” (as defined or modified under the Program) and the procedures for monitoring for this limit; and (5) specific liquidity events arising during the Program Reporting Period. The Report further summarized the conditions of the Exemptive Order and whether all applicable Funds were in compliance with the terms of the Exemptive Order.
Based on this review, the Report concluded that: (1) the Program continues to be reasonably designed to effectively assess and manage each Fund’s Liquidity Risk; and (2) the Program has been adequately and effectively implemented with respect to each Fund during the Program Reporting Period.
| JPMorgan Institutional Trust Funds | |
BOARD APPROVAL OF INVESTMENT ADVISORY AGREEMENTS
(Unaudited)
The Board of Trustees (the “Board” or the “Trustees”) has established various standing committees composed of Trustees with diverse backgrounds, to which the Board has assigned specific subject matter responsibilities to further enhance the effectiveness of the Board’s oversight and decision making. The Board and its investment committees (Money Market and Alternative Products Committee, Equity Committee, and Fixed Income Committee) met regularly throughout the year and, at each meeting, considered factors that are relevant to their annual consideration of the continuation of the investment advisory agreements. The Board also met for the specific purpose of considering investment advisory agreement annual renewals. The Board held meetings June 20-21, 2023 and August 8-10, 2023, at which the Trustees considered the continuation of the investment advisory agreements for each Fund whose semi-annual report is contained herein (each an “Advisory Agreement” and collectively, the “Advisory Agreements”). At the June meeting, the Board’s investment committees met to review and consider performance, expense and related information for the J.P. Morgan Funds. Each investment committee reported to the full Board, which then considered each investment committee’s preliminary findings. At the August meeting, the Trustees continued their review and consideration. The Trustees, including a majority of the Trustees who are not parties to an Advisory Agreement or “interested persons” (as defined in the Investment Company Act of 1940) of any party to an Advisory Agreement or any of their affiliates, approved the continuation of each Advisory Agreement on August 10, 2023.
As part of their review of the Advisory Agreements, the Trustees considered and reviewed performance and other information about the Funds received from J.P. Morgan Investment Management Inc. (the “Adviser”). This information includes the Funds’ performance as compared to the performance of their peers and benchmarks and analyses by the Adviser of the Funds’ performance. In addition, at each of their regular meetings throughout the year, the Trustees considered reports on the performance of certain J.P. Morgan Funds, provided by an independent investment consulting firm (the “independent consultant”). In addition, in preparation for the June and August meetings, the Trustees requested, received and evaluated extensive materials from the Adviser, including performance and expense information compiled by Broadridge using data from Lipper Inc. and/or Morningstar Inc., independent providers of investment company data (together, “Broadridge”). Before voting on the Advisory Agreements, the Trustees reviewed the Advisory Agreements with representatives of the Adviser, counsel to the Funds and independent legal counsel to the Trustees and received a memorandum from independent legal counsel to the Trustees discussing the legal standards for their consideration of the Advisory Agreements.
The Trustees also discussed the Advisory Agreements with independent legal counsel in executive sessions at which no representatives of the Adviser were present.
A summary of the material factors evaluated by the Trustees in determining whether to approve each Advisory Agreement is provided below. Each Trustee attributed different weights to the various factors and no factor alone was considered determinative. The Trustees considered information provided with respect to the Funds throughout the year, as well as materials furnished specifically in connection with the annual review process. From year to year, the Trustees consider and place emphasis on relevant information in light of changing circumstances in market and economic conditions.
After considering and weighing the factors and information they had received, the Trustees found that the compensation to be received by the Adviser from each Fund under the applicable Advisory Agreement was fair and reasonable under the circumstances and determined that the continuance of each Advisory Agreement was in the best interests of each Fund and its shareholders.
Nature, Extent and Quality of Services Provided by the Adviser
The Trustees received and considered information regarding the nature, extent and quality of services provided to each Fund under the applicable Advisory Agreement. The Trustees took into account information furnished throughout the year at Trustee meetings, as well as the materials furnished specifically in connection with this annual review process. Among other things, the Trustees considered:
• The background and experience of the Adviser’s senior management and investment personnel, including personnel changes, if any;
• The qualifications, backgrounds and responsibilities of the portfolio management team primarily responsible for the day-to-day management of each Fund, including personnel changes, if any;
• The investment strategy for each Fund, and the infrastructure supporting the portfolio management teams;
• Information about the structure and distribution strategy for each Fund and how it fits with the Adviser’s other fund offerings within the J.P. Morgan Funds complex;
• The administration services provided by the Adviser in its role as Administrator;
• Their knowledge of the nature and quality of the services provided by the Adviser and its affiliates gained from their experience as Trustees of the Funds and in the financial industry generally;
| JPMorgan Institutional Trust Funds | |
BOARD APPROVAL OF INVESTMENT ADVISORY AGREEMENTS
(Unaudited) (continued)
• The overall reputation and capabilities of the Adviser and its affiliates;
• The commitment of the Adviser to provide high quality service to the Funds;
• Their overall confidence in the Adviser’s integrity; and
• The Adviser’s responsiveness to requests for additional information, questions or concerns raised by them, including the Adviser’s willingness to consider and implement organizational and operational changes designed to improve investment results and the services provided to each Fund.
Based upon these considerations and other factors, the Trustees concluded that they were satisfied with the nature, extent and quality of the services provided to the Funds by the Adviser.
Costs of Services Provided and Profitability to the Adviser and its Affiliates
The Trustees received and considered information regarding the profitability to the Adviser and its affiliates from providing services to each Fund. The Trustees reviewed and discussed this information. The Trustees recognized that this information is not audited and represents the Adviser’s determination of its and its affiliates’ revenues from the contractual services provided to the Funds, less expenses of providing such services. Expenses include direct and indirect costs and are calculated using an allocation methodology developed by the Adviser and reviewed with the Board. The Trustees also recognized that it is difficult to make comparisons of profitability from fund investment advisory contracts because comparative information is not generally publicly available and is affected by numerous factors, including the structure of the particular adviser, the types of funds it manages, its business mix, numerous assumptions regarding allocations and the fact that publicly-traded fund managers’ operating profits and net income are net of distribution and marketing expenses. Based upon their review, and taking into consideration the factors noted above, the Trustees concluded that the profitability to the Adviser under each Advisory Agreement was not unreasonable in light of the services and benefits provided to each Fund.
The Trustees also considered that the Adviser earns fees from the Funds for providing administration services. These fees were shown separately in the profitability analysis presented to the Trustees. The Trustees also considered the fees earned by JPMorgan Chase Bank, N.A. (“JPMCB”), an affiliate of the Adviser, for custody, fund accounting and other related services for each Fund, and the profitability of the arrangements to JPMCB.
Fall-Out Benefits
The Trustees reviewed information regarding potential “fall-out” or ancillary benefits received by the Adviser and its affiliates as a result of their relationship with the Funds. The Trustees considered that the J.P. Morgan Funds' operating accounts are held at JPMCB, which, as a result, will receive float benefits for certain J.P. Morgan Funds, as applicable. The Trustees also noted that the Adviser supports a diverse set of products and services, which benefits the Adviser by allowing it to leverage its infrastructure to serve additional clients, including benefits that may be received by the Adviser and its affiliates in connection with the Fund’s potential investments in other funds advised by the Adviser. The Trustees also reviewed the Adviser’s allocation of fund brokerage for the J.P. Morgan Funds complex, including allocations to brokers who provide research to the Adviser, as well as the Adviser’s use of affiliates to provide other services and the benefits to such affiliates of doing so. The Trustees also considered the benefit to the Adviser and its affiliates from allocating client assets to the Funds.
Economies of Scale
The Trustees considered the extent to which the Funds may benefit from potential economies of scale. The Trustees considered that there may not be a direct relationship between economies of scale realized by the Funds and those realized by the Adviser as assets increase. The Trustees considered the extent to which the Funds were priced to scale and whether it would be appropriate to add advisory fee breakpoints. The Trustees noted certain Funds with fee waivers and contractual expense limitations (“Fee Caps”) which allow a Fund’s shareholders to share potential economies of scale from a Fund’s inception, prior to reaching scale. The Trustees also noted that certain other Funds that had achieved scale as asset levels had increased no longer had Fee Caps in place, and shared economies of scale through lower average expenses. The Trustees noted that the fees remain fair and reasonable relative to peer funds. The Trustees considered the benefits to the Funds of the use of an affiliated distributor and custodian, including the ability to rely on existing infrastructure supporting distribution, custodial and transfer agent services and the ability to negotiate competitive fees for the Funds. The Trustees further considered the Adviser's ongoing investments in its business in support of the Funds, including the Adviser's investments in trading systems, technology (including improvements to the J.P. Morgan Funds’ website, and cybersecurity improvements), retention of key talent, and regulatory support enhancements. The Trustees concluded that the current fee structure for each Fund, including any Fee Caps the Adviser has in place that serve to limit the overall net expense ratios of each Fund at competitive levels was reasonable. The Trustees concluded that, for Funds with Fee Caps in place, the relevant
| JPMorgan Institutional Trust Funds | |
Funds’ shareholders received the benefits of potential economies of scale through the Fee Caps and, for Funds that achieved scale and no longer had Fee Caps in place, the relevant Funds’ shareholders benefited from lower average expenses resulting from increased assets. The Trustees also concluded that all Funds benefited from the Adviser’s reinvestment in its operations to serve the Funds and their shareholders. The Trustees noted that, the Adviser’s reinvestment ensures sufficient resources in terms of personnel and infrastructure to support the Funds.
Fees Relative to Adviser’s Other Clients
The Trustees received and considered information about the nature and extent of investment advisory services and fee rates offered to other clients of the Adviser, including, to the extent applicable, institutional separate accounts, collective investment trusts, other registered investment companies and/or private funds sub-advised by the Adviser, for investment management styles substantially similar to that of each Fund. The Trustees considered the complexity of investment management for registered investment companies relative to the Adviser’s other clients and noted differences, as applicable, in the fee structure and the regulatory, legal and other risks and responsibilities of providing services to the different clients. The Trustees considered that serving as an adviser to a registered investment company involves greater responsibilities and risks than acting as a sub-adviser and observed that sub-advisory fees may be lower than those charged by the Adviser to each Fund. The Trustees also noted that the adviser, not the applicable registered investment company, typically bears the sub-advisory fee and that many responsibilities related to the advisory function are typically retained by the primary adviser. The Trustees concluded that the fee rates charged to each Fund in comparison to those charged to the Adviser’s other clients were reasonable.
Investment Performance
The Trustees receive and consider information about the Funds’ performance throughout the year. In addition, the Trustees received and considered absolute and/or relative performance information for the Funds in a report prepared by Broadridge. The Trustees considered the total return performance information, which included the ranking of the Funds within a performance universe comprised of funds’ selected share classes with the same Broadridge investment classification and objective (the “Universe”), by total return for applicable one-, three- and five-year periods. The Trustees reviewed a description of Broadridge’s methodology for selecting mutual funds in each Fund’s Universe and noted that Universe quintile rankings were not calculated if the number of funds in the Universe did not meet a predetermined minimum. As part of this review, the Trustees also reviewed each Fund’s performance against its benchmark and considered the performance information provided for the Funds at regular Board meetings by the
Adviser. The Trustees also engaged with the Adviser to consider what steps might be taken to improve performance, as applicable. The Broadridge performance data noted by the Trustees as part of their review and the determinations made by the Trustees with respect to each Fund’s performance is summarized below:
The Trustees noted that the Core Bond Trust’s performance was in the first quintile of the Universe for each of the one-, three- and five-year periods ended December 31, 2022. The Trustees discussed the performance and investment strategy of the Fund with the Adviser and, based upon this discussion and various other factors, the Trustees concluded that the Fund’s performance was satisfactory.
The Trustees noted that the Intermediate Bond Trust’s performance was in the first quintile of the Universe for each of the one-, three- and five-year periods ended December 31, 2022. The Trustees discussed the performance and investment strategy of the Fund with the Adviser and, based upon this discussion and various other factors, the Trustees concluded that the Fund’s performance was satisfactory.
Advisory Fees and Expense Ratios
The Trustees considered the contractual advisory fee rate and administration fee rate paid by each Fund to the Adviser and compared the combined rate to the information prepared by Broadridge concerning management fee rates paid by other funds’ selected share classes in the same Broadridge category as each Fund, the Universe, as well as a subset of funds within the Universe (the “Peer Group”). The Trustees recognized that Broadridge reported each Fund’s management fee rate as the combined contractual advisory fee and the administration fee rates, and that changes made to the administration fee in January 2019, if applicable, were reflected in such rate. The Trustees also reviewed information about other expenses and the expense ratios for each Fund and noted that Universe and Peer Group quintile rankings were not calculated if the number of funds in the Universe and/or Peer Group did not meet a predetermined minimum. For each Fund that had a Fee Cap in place, the Trustees considered the net advisory fee rate and net expense ratio for each class, as applicable, taking into account any waivers and/or reimbursements. The Trustees also considered any proposed changes to a Fee Cap, and, where deemed appropriate by the Trustee, additional waivers and/or reimbursements. The Trustees recognized that it can be difficult to make comparisons of advisory fees because there are variations in the services that are included in the fees paid by other funds. The Trustees’ determinations as a result of the review of each Fund’s advisory fees and expense ratios are summarized below:
The Trustees noted that the Core Bond Trust’s net advisory fee and actual total expenses were in the first quintile of both the Peer Group and Universe. After considering the factors
| JPMorgan Institutional Trust Funds | |
BOARD APPROVAL OF INVESTMENT ADVISORY AGREEMENTS
(Unaudited) (continued)
identified above, in light of this information, the Trustees concluded that the advisory fee was fair and reasonable in light of the services provided to the Fund.
The Trustees noted that the Intermediate Bond Trust’s net advisory fee and actual total expenses were in the first quintile of both the Peer Group and Universe. After considering the
factors identified above, in light of this information, the Trustees concluded that the advisory fee was fair and reasonable in light of the services provided to the Fund.
| JPMorgan Institutional Trust Funds | |
THIS PAGE IS INTENTIONALLY LEFT BLANK
THIS PAGE IS INTENTIONALLY LEFT BLANK
FOR MORE INFORMATION:
INVESTMENT ADVISER
J.P. Morgan Investment Management Inc.
277 Park Avenue
New York, New York 10172
PLACEMENT AGENT
JPMorgan Institutional Investments, Inc.
277 Park Avenue
New York, New York 10172
This report is open and authorized for distribution only to qualified and accredited investors who have received a copy of the Fund’s Confidential Offering Memorandum. This document may not be copied, faxed or otherwise distributed to the generalpublic.
Investors may obtain information about the Securities Investor Protection Corporation (SIPC), including the SIPC brochure, by visiting www.sipc.org or by calling SIPC at 202-371-8300.
Each Fund files a complete schedule of its fund holdings for the first and third quarters of its fiscal year with the SEC as an exhibit to its report on Form N-PORT. Each Fund’s Form N-PORT reports are available on the SEC’s website at http://www.sec.gov.
A copy of proxy policies and procedures is available without charge upon request by calling 1-800-343-1113 and a description of such policies and procedures is on the SEC’s website at www.sec.gov. The Trustees have delegated the authority to vote proxies for securities owned by the Fund to the Adviser. A copy of the Fund’s voting record is available on the SEC’s website at www.sec.gov. The Fund’s proxy voting record will include, among other things, a brief description of the matter voted on for each portfolio security, and will state how each vote was cast, for example, for or against the proposal.
J.P. Morgan Asset Management is the brand name for the asset management business of JPMorgan Chase & Co. and its affiliates worldwide.
© JPMorgan Chase & Co., 2023. All rights reserved. August 2023.
SAN-INSTT-823
ITEM 2. CODE OF ETHICS.
Not applicable to a semi-annual report.
ITEM 3. AUDIT COMMITTEE FINANCIAL EXPERT.
Not applicable to a semi-annual report.
ITEM 4. PRINCIPAL ACCOUNTANT FEES AND SERVICES.
Not applicable to a semi-annual report.
ITEM 5. AUDIT COMMITTEE OF LISTED REGISTRANTS.
Not applicable to a semi-annual report.
ITEM 6. INVESTMENTS.
File Schedule I – Investments in securities of unaffiliated issuers as of the close of the reporting period as set forth in Section 210.12-12 of Regulation S-X, unless the schedule is included as part of the report to shareholders filed under Item 1 of this Form.
Included in Item 1.
ITEM 7. DISCLOSURE OF PROXY VOTING POLICIES AND PROCEDURES FOR CLOSED-END MANAGEMENT INVESTMENT COMPANIES.
Not applicable.
ITEM 8. PORTFOLIO MANAGERS OF CLOSED-END MANAGEMENT INVESTMENT COMPANIES.
Not applicable.
ITEM 9. PURCHASE OF EQUITY SECURITIES BY CLOSED-END MANAGEMENT INVESTMENT COMPANY AND AFFILIATED PURCHASERS.
Not applicable.
ITEM 10. SUBMISSION OF MATTERS TO A VOTE OF SECURITY HOLDERS.
Describe any material changes to the procedures by which shareholders may recommend nominees to the registrant’s board of directors, where those changes were implemented after the registrant last provided disclosure in response to the requirements of Item 7(d)(2)(ii)(G) of Schedule 14A (17 CFR 240.14a-101), or this Item.
No material changes to report.
ITEM 11. CONTROLS AND PROCEDURES.
(a) Disclose the conclusions of the registrant’s principal executive and principal financial officers, or persons performing similar functions, regarding the effectiveness of the registrant’s disclosure controls and procedures (as defined in Rule 30a-3(c) under the Act (17 CFR 270.30a-3(c))) as of a date within 90 days of the filing date of the report that includes the disclosure required by this paragraph, based on the evaluation of these controls and procedures required by Rule 30a-3(b) under the Act (17 CFR 270.30a-3(b)) and Rules 13a-15(b) or 15d-15(b) under the Exchange Act (17 CFR 240.13a-15(b) or 240.15d-15(b)).
The Registrant’s principal executive and principal financial officers have concluded, based on their evaluation of the Registrant’s disclosure controls and procedures as of a date within 90 days of the filing date of this report, that the Registrant’s disclosure controls and procedures are reasonably designed to ensure that information required to be disclosed by the Registrant on Form N-CSR is recorded, processed, summarized and reported within the required time periods and that information required to be disclosed by the Registrant in the reports that it files or submits on Form N-CSR is accumulated and communicated to the Registrant’s management, including its principal executive and principal financial officers, as appropriate to allow timely decisions regarding required disclosure.
(b) Disclose any change in the registrant’s internal control over financial reporting (as defined in Rule 30a-3(d) under the Act (17 CFR 270.30a-3(d)) that occurred during the period covered by this report that has materially affected, or is reasonably likely to materially affect, the registrant’s internal control over financial reporting.
There were no changes in the Registrant’s internal control over financial reporting that occurred during period covered by this report that have materially affected, or are reasonably likely to materially affect, the Registrant’s internal control over financial reporting.
ITEM 12. DISCLOSURE OF SECURITIES LENDING ACTIVITIES FOR CLOSED-END MANAGEMENT INVESTMENT COMPANIES.
Not applicable.
ITEM 13. EXHIBITS.
| | (a) | File the exhibits listed below as part of this Form. Letter or number the exhibits in the sequence indicated. |
(1) Any code of ethics, or amendment thereto, that is the subject of the disclosure required by Item 2, to the extent that the registrant intends to satisfy the Item 2 requirements through filing of an exhibit.
Not applicable.
(2) A separate certification for each principal executive officer and principal financial officer of the registrant as required by Rule 30a-2(a) under the Act (17 CFR 270.30a-2), exactly as set forth below:
Certifications pursuant to Rule 30a-2(a) under the Investment Company Act of 1940 are attached hereto.
(1) Any written solicitation to purchase securities under Rule 23c-1 under the Act (17 CFR 270.23c-1) sent or given during the period covered by the report by or on behalf of the registrant to 10 or more persons.
Not applicable.
(2) Change in the registrant’s independent public accountant. Provide the information called for by Item 4 of Form 8-K under the Exchange Act (17 CFR 249.308). Unless otherwise specified by Item 4, or related to and necessary for a complete understanding of information not previously disclosed, the information should relate to events occurring during the reporting period.
Not applicable.
| | (b) | A separate or combined certification for each principal executive officer and principal officer of the registrant as required by Rule 30a-2(b) under the Act of 1940. |
Certifications pursuant to Rule 30a-2(b) under the Investment Company Act of 1940 are attached hereto.
SIGNATURES
Pursuant to the requirements of the Securities Exchange Act of 1934 and the Investment Company Act of 1940, the registrant has duly caused this report to be signed on its behalf by the undersigned, thereunto duly authorized.
JPMorgan Institutional Trust
| | |
| By: | | /s/ Brian S. Shlissel |
| | Brian S. Shlissel |
| | President and Principal Executive Officer |
| | November 2, 2023 |
Pursuant to the requirements of the Securities Exchange Act of 1934 and the Investment Company Act of 1940, this report has been signed below by the following persons on behalf of the registrant and in the capacities and on the dates indicated.
| | |
| By: | | /s/ Brian S. Shlissel |
| | Brian S. Shlissel |
| | President and Principal Executive Officer |
| | November 2, 2023 |
| | |
| By: | | /s/ Timothy J. Clemens |
| | Timothy J. Clemens |
| | Treasurer and Principal Financial Officer |
| | November 2, 2023 |