2020 Corporate Profile
Forward Looking Statements This Presentation contains, and the periodic and current reports we file with the SEC, press releases and other public stockholder communications of BankFinancial Corporation may contain forward-looking statements within the meaning of Section 21E of the Securities Exchange Act of 1934, as amended, which involve significant risks and uncertainties. Forward-looking statements may include statements relating to our future plans, strategies and expectations, as well as our future revenues, earnings, losses, financial performance, financial condition, asset quality metrics and future prospects. Forward looking statements are generally identifiable by use of the words “believe,” “may,” “will,” “should,” “could,” “expect,” “estimate,” “intend,” “anticipate,” “project,” “plan,” or similar expressions. They are frequently based on assumptions that may or may not materialize, and are subject to numerous uncertainties that could cause actual results to differ materially from those anticipated in the forward looking statements. We intend all forward-looking statements, including the financial projections contained herein, to be covered by the safe harbor provisions for forward-looking statements contained in the Private Securities Litigation Reform Act of 1995, and are including this statement for the purpose of invoking these safe harbor provisions. Forward looking statements speak only as of the date they are made. We do not undertake any obligation to update any forward- looking statement in the future, or to reflect circumstances and events that occur after the date on which the forward-looking statement was made. Factors that could cause actual results to differ materially from the results anticipated or projected and which could materially and adversely affect our operating results, financial condition or future prospects include, but are not limited to: (i) less than anticipated loan growth due to intense competition for loans and leases, particularly in terms of pricing and credit underwriting, or a dearth of borrowers who meet our underwriting standards; (ii) the impact of re-pricing and competitors' pricing initiatives on loan and deposit products; (iii) interest rate movements and their impact on the economy, customer behavior and our net interest margin; (iv) adverse economic conditions in general, or specific events such as a pandemic or terrorism, and in the markets in which we lend that could result in increased delinquencies in our loan portfolio or a decline in the value of our investment securities and the collateral for our loans; (v) declines in real estate values that adversely impact the value of our loan collateral, OREO, asset dispositions and the level of borrower equity in their investments; (vi) borrowers that experience legal or financial difficulties that we do not currently foresee; (vii) results of supervisory monitoring or examinations by regulatory authorities, including the possibility that a regulatory authority could, among other things, require us to increase our allowance for loan losses or adversely change our Joan classifications, write-down assets, reduce credit concentrations or maintain specific capital levels; (viii) changes, disruptions or illiquidity in national or global financial markets; {ix) the credit risks of lending activities, including risks that could cause changes in the level and direction of loan delinquencies and charge-offs or changes in estimates relating to the computation of our allowance for loan losses; (x) monetary and fiscal policies of the U.S. Government, including policies of the U.S. Treasury and the Federal Reserve Board; (xi) factors affecting our ability to access deposits or cost-effective funding, and the impact of competitors' pricing initiatives on our deposit products; (xii) legislative or regulatory changes, that have an adverse impact on our products, services, operations and operating expenses; (xiii) higher federal deposit insurance premiums; (xiv) higher than expected overhead, infrastructure and compliance costs; (xv) changes in accounting or tax principles, policies or guidelines; (xvi) the effects of any federal government shutdown; and (xvii) privacy and cybersecurity risks, including the risks of business interruption and the compromise of confidential customer information resulting from intrusions. These risks and uncertainties, as well as the Risk Factors set forth in Item 1A of our Annual Report on Form 10-K, should be considered in evaluating forward-looking statements and undue reliance should not be placed on such statements. 2
Corporate Overview 1 Focus on Diversified Commercial Lending 2 Retail & Commercial Deposit Base 3 National Bank Charter 4 NASDAQ Global Markets: BFIN 3
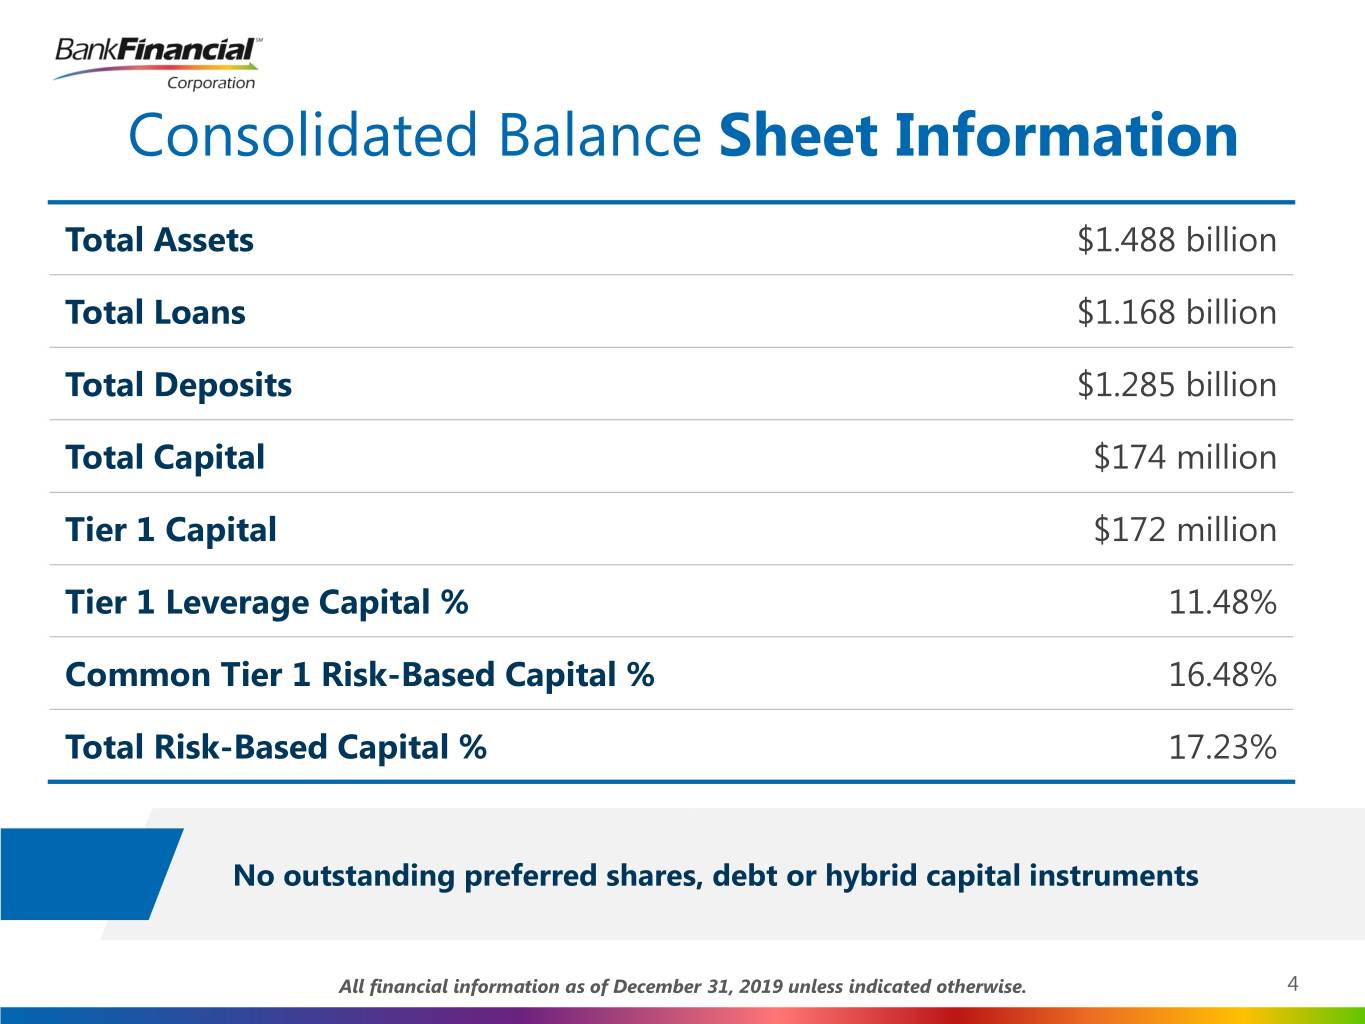
Consolidated Balance Sheet Information Total Assets $1.488 billion Total Loans $1.168 billion Total Deposits $1.285 billion Total Capital $174 million Tier 1 Capital $172 million Tier 1 Leverage Capital % 11.48% Common Tier 1 Risk-Based Capital % 16.48% Total Risk-Based Capital % 17.23% No outstanding preferred shares, debt or hybrid capital instruments All financial information as of December 31, 2019 unless indicated otherwise. 4

Branch Network North Libertyville South Libertyville Lincolnshire Deerfield Northbrook Banking Offices in Cook, Schaumburg Lake, DuPage, and Lincolnwood 19 Will Counties Lincoln Park Hyde Park Downers Grove Consecutive “Outstanding” Westmont Naperville 9 CRA Ratings Burr Ridge Chicago Ridge Calumet Park Orland Park Calumet City Hazel Crest Joliet Olympia Fields 5
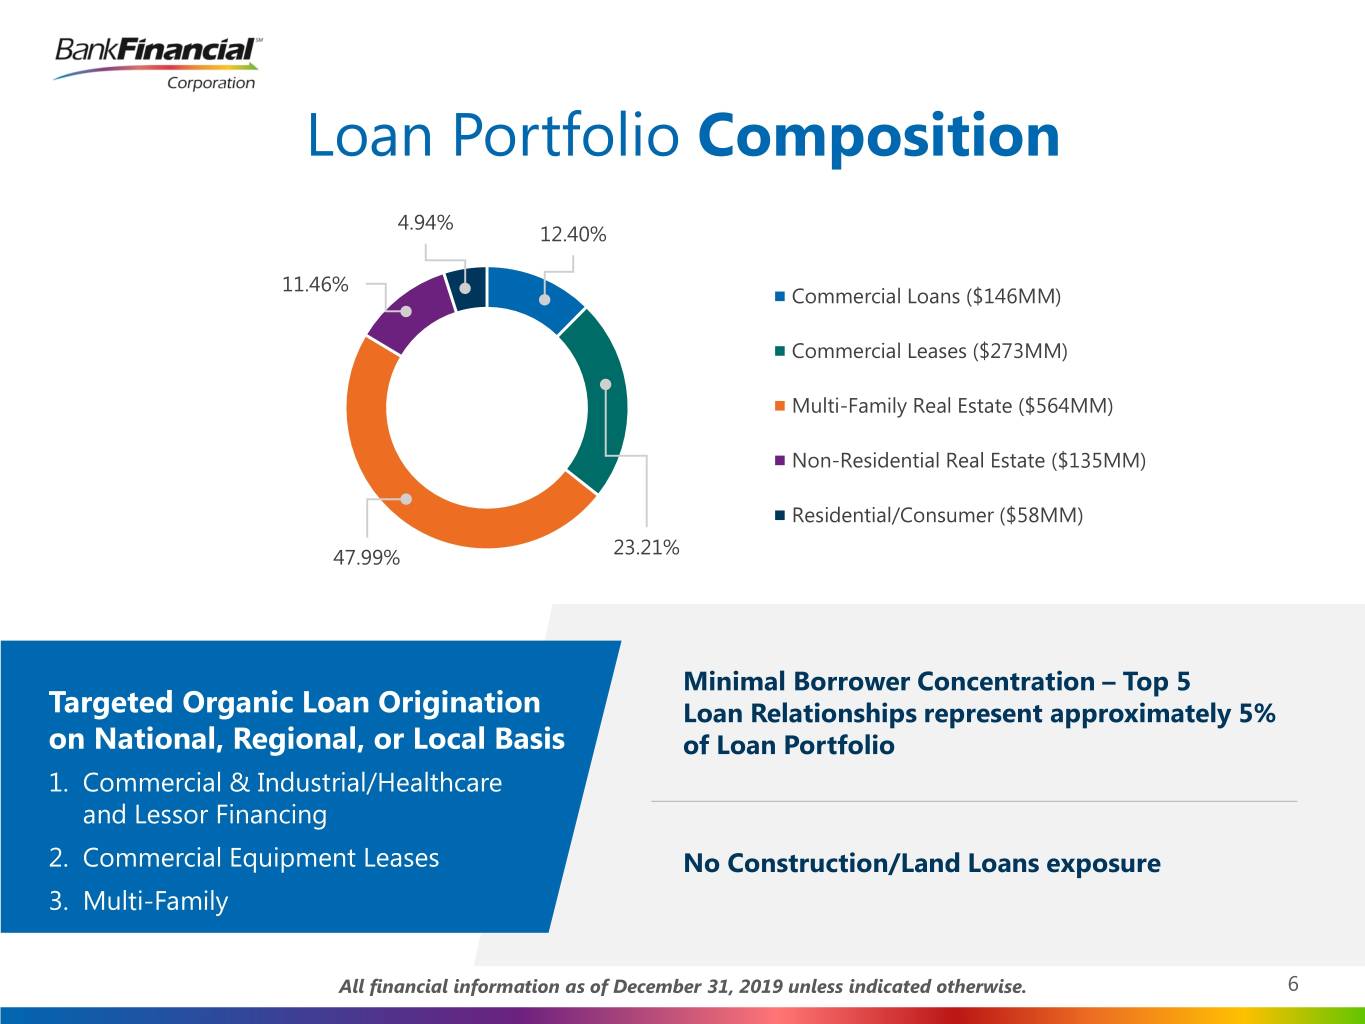
Loan Portfolio Composition 4.94% 12.40% 11.46% Commercial Loans ($146MM) Commercial Leases ($273MM) Multi-Family Real Estate ($564MM) Non-Residential Real Estate ($135MM) Residential/Consumer ($58MM) 47.99% 23.21% Minimal Borrower Concentration – Top 5 Targeted Organic Loan Origination Loan Relationships represent approximately 5% on National, Regional, or Local Basis of Loan Portfolio 1. Commercial & Industrial/Healthcare and Lessor Financing 2. Commercial Equipment Leases No Construction/Land Loans exposure 3. Multi-Family All financial information as of December 31, 2019 unless indicated otherwise. 6
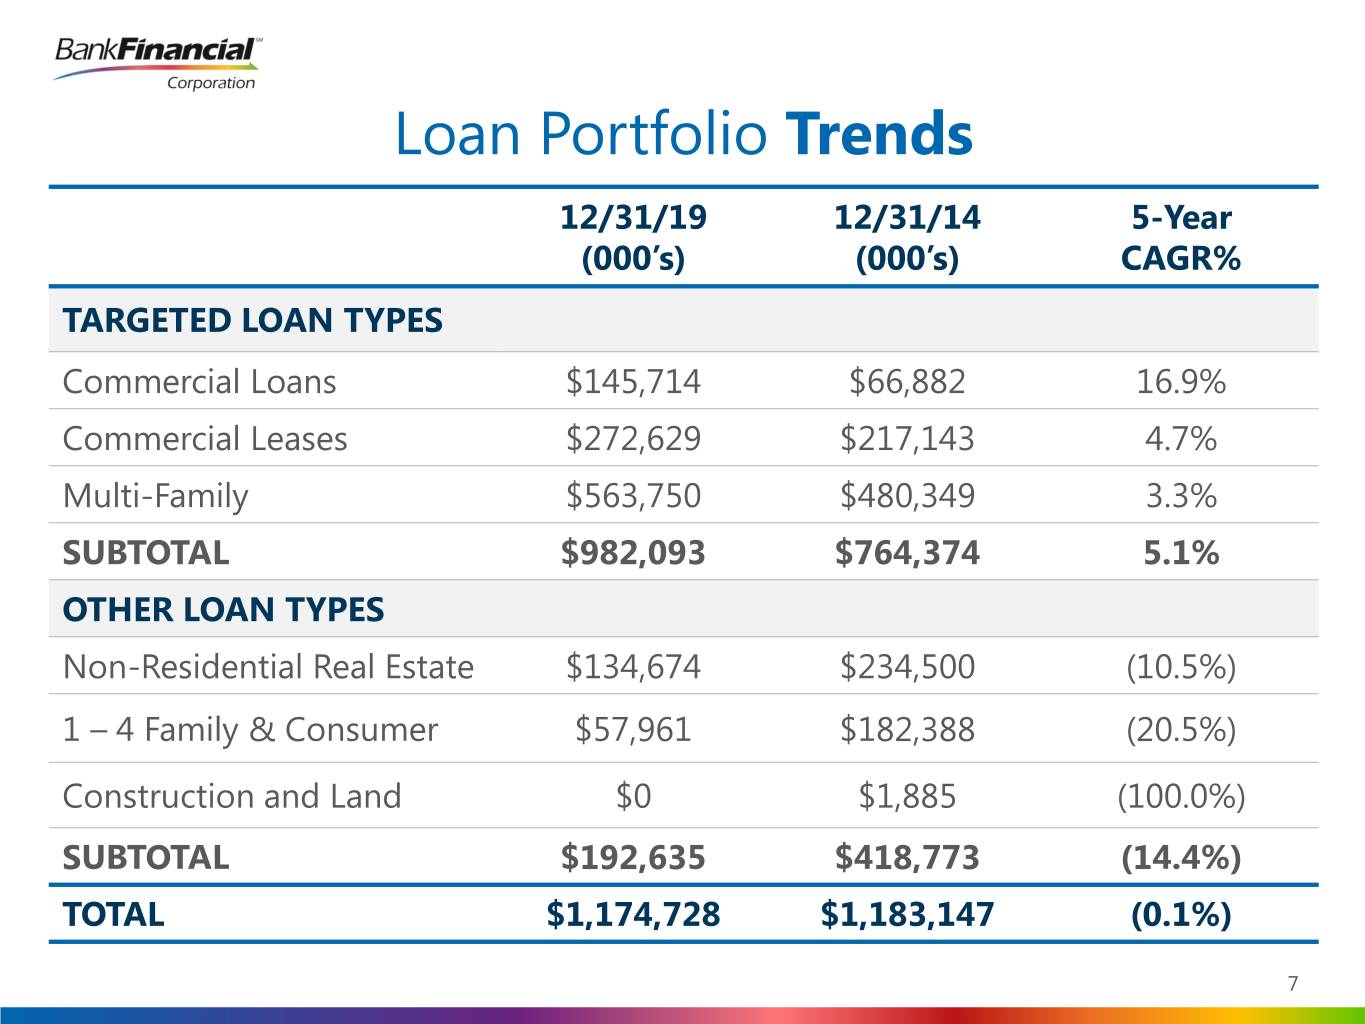
Loan Portfolio Trends 12/31/19 12/31/14 5-Year (000’s) (000’s) CAGR% TARGETED LOAN TYPES Commercial Loans $145,714 $66,882 16.9% Commercial Leases $272,629 $217,143 4.7% Multi-Family $563,750 $480,349 3.3% SUBTOTAL $982,093 $764,374 5.1% OTHER LOAN TYPES Non-Residential Real Estate $134,674 $234,500 (10.5%) 1 – 4 Family & Consumer $57,961 $182,388 (20.5%) Construction and Land $0 $1,885 (100.0%) SUBTOTAL $192,635 $418,773 (14.4%) TOTAL $1,174,728 $1,183,147 (0.1%) 7
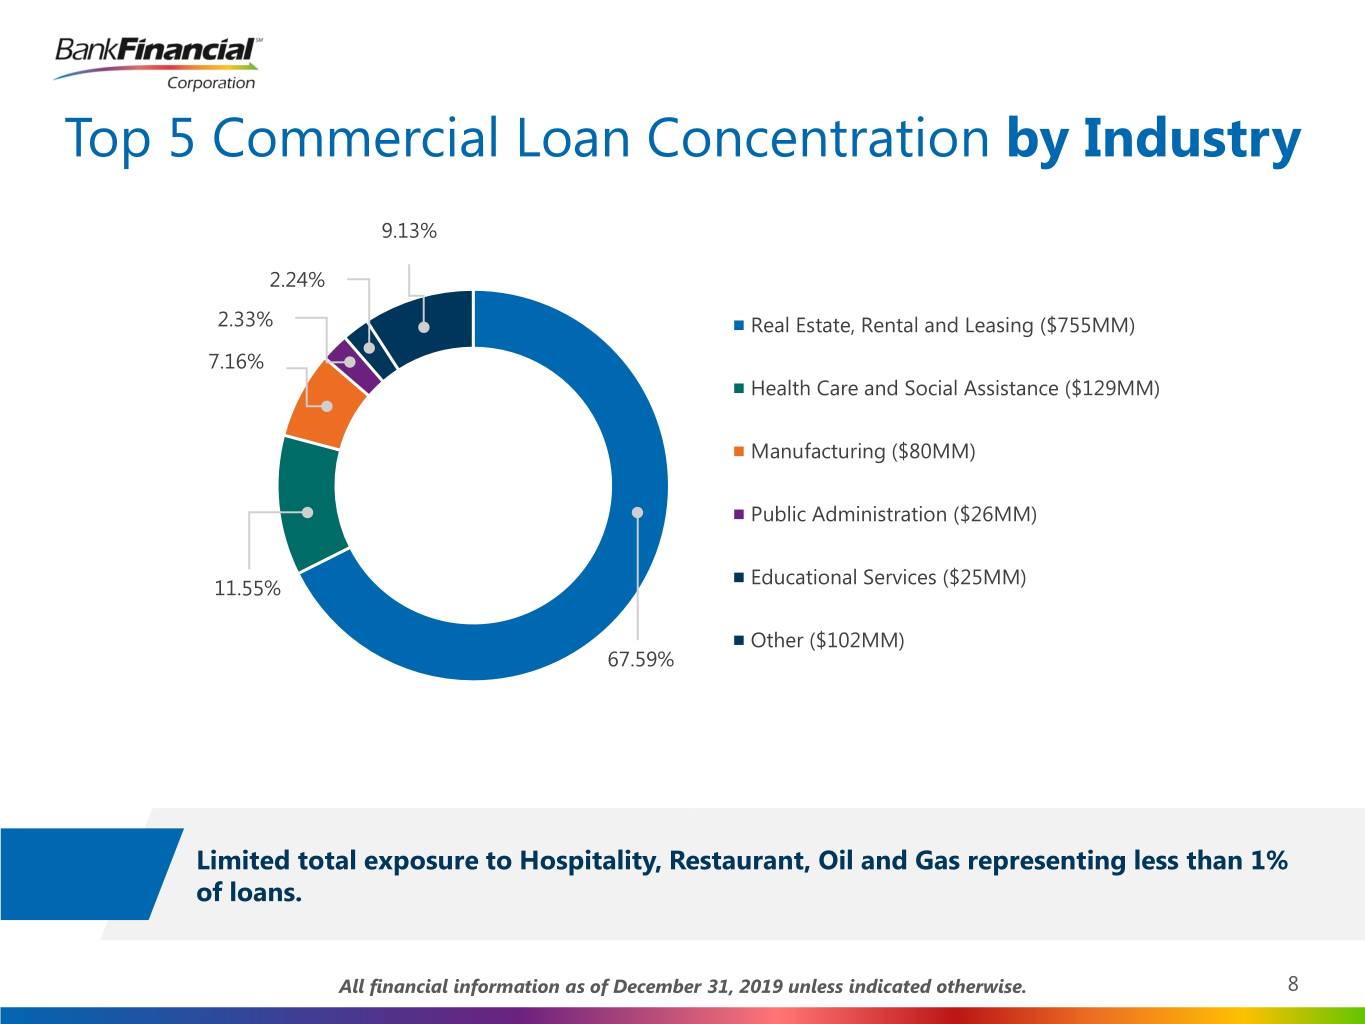
Top 5 Commercial Loan Concentration by Industry 9.13% 2.24% 2.33% Real Estate, Rental and Leasing ($755MM) 7.16% Health Care and Social Assistance ($129MM) Manufacturing ($80MM) Public Administration ($26MM) Educational Services ($25MM) 11.55% Other ($102MM) 67.59% Limited total exposure to Hospitality, Restaurant, Oil and Gas representing less than 1% of loans. All financial information as of December 31, 2019 unless indicated otherwise. 8
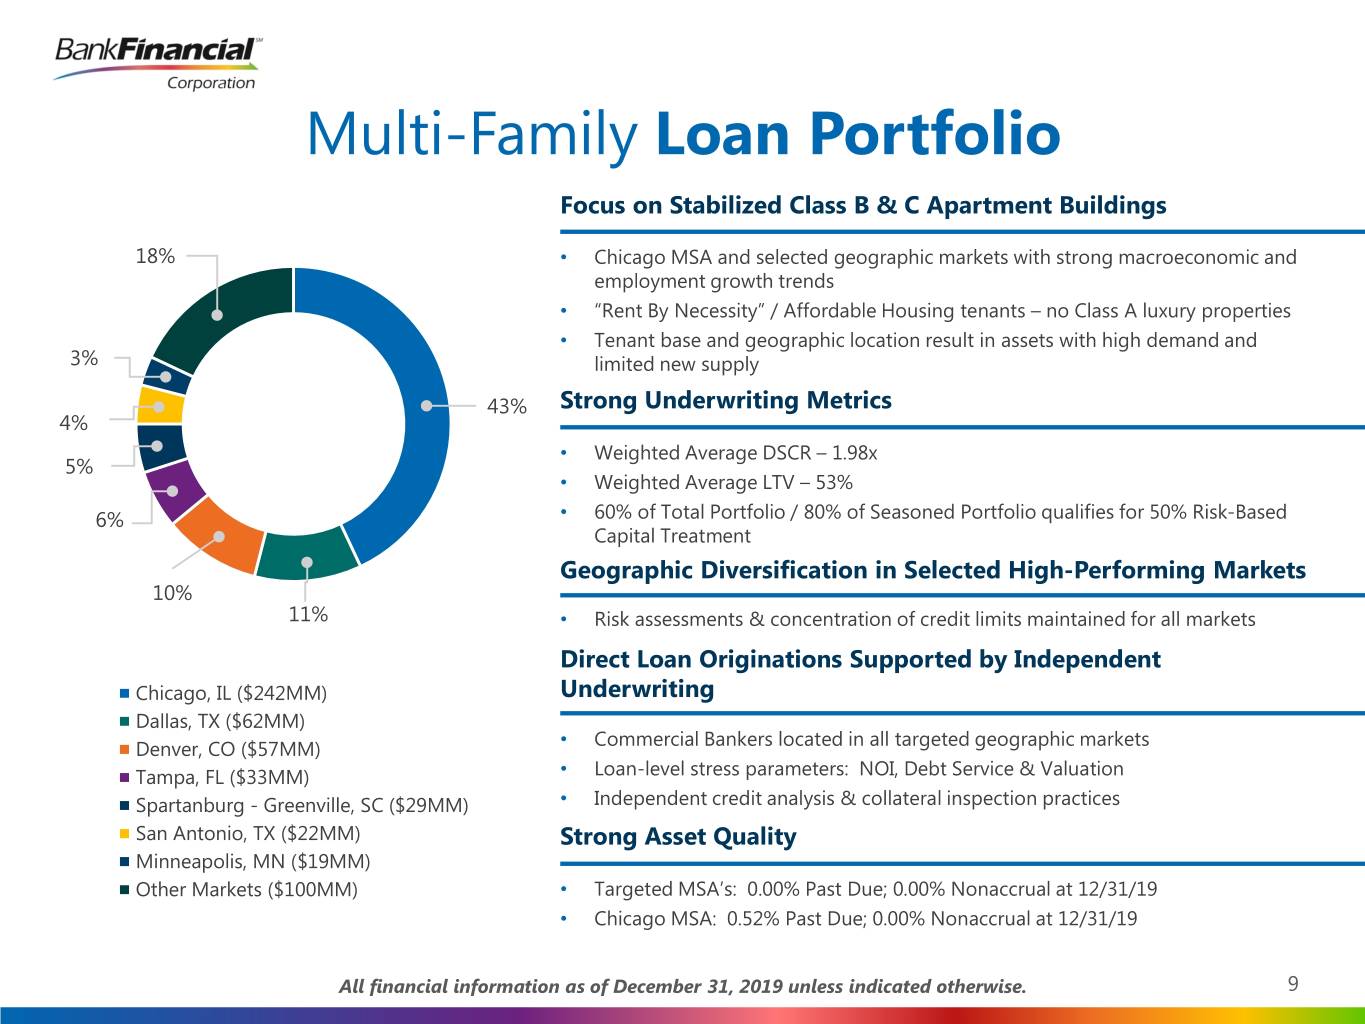
Multi-Family Loan Portfolio Focus on Stabilized Class B & C Apartment Buildings 18% • Chicago MSA and selected geographic markets with strong macroeconomic and employment growth trends • “Rent By Necessity” / Affordable Housing tenants – no Class A luxury properties • Tenant base and geographic location result in assets with high demand and 3% limited new supply 43% Strong Underwriting Metrics 4% • Weighted Average DSCR – 1.98x 5% • Weighted Average LTV – 53% 6% • 60% of Total Portfolio / 80% of Seasoned Portfolio qualifies for 50% Risk-Based Capital Treatment Geographic Diversification in Selected High-Performing Markets 10% 11% • Risk assessments & concentration of credit limits maintained for all markets Direct Loan Originations Supported by Independent Chicago, IL ($242MM) Underwriting Dallas, TX ($62MM) Commercial Bankers located in all targeted geographic markets Denver, CO ($57MM) • Tampa, FL ($33MM) • Loan-level stress parameters: NOI, Debt Service & Valuation Spartanburg - Greenville, SC ($29MM) • Independent credit analysis & collateral inspection practices San Antonio, TX ($22MM) Strong Asset Quality Minneapolis, MN ($19MM) Other Markets ($100MM) • Targeted MSA’s: 0.00% Past Due; 0.00% Nonaccrual at 12/31/19 • Chicago MSA: 0.52% Past Due; 0.00% Nonaccrual at 12/31/19 All financial information as of December 31, 2019 unless indicated otherwise. 9
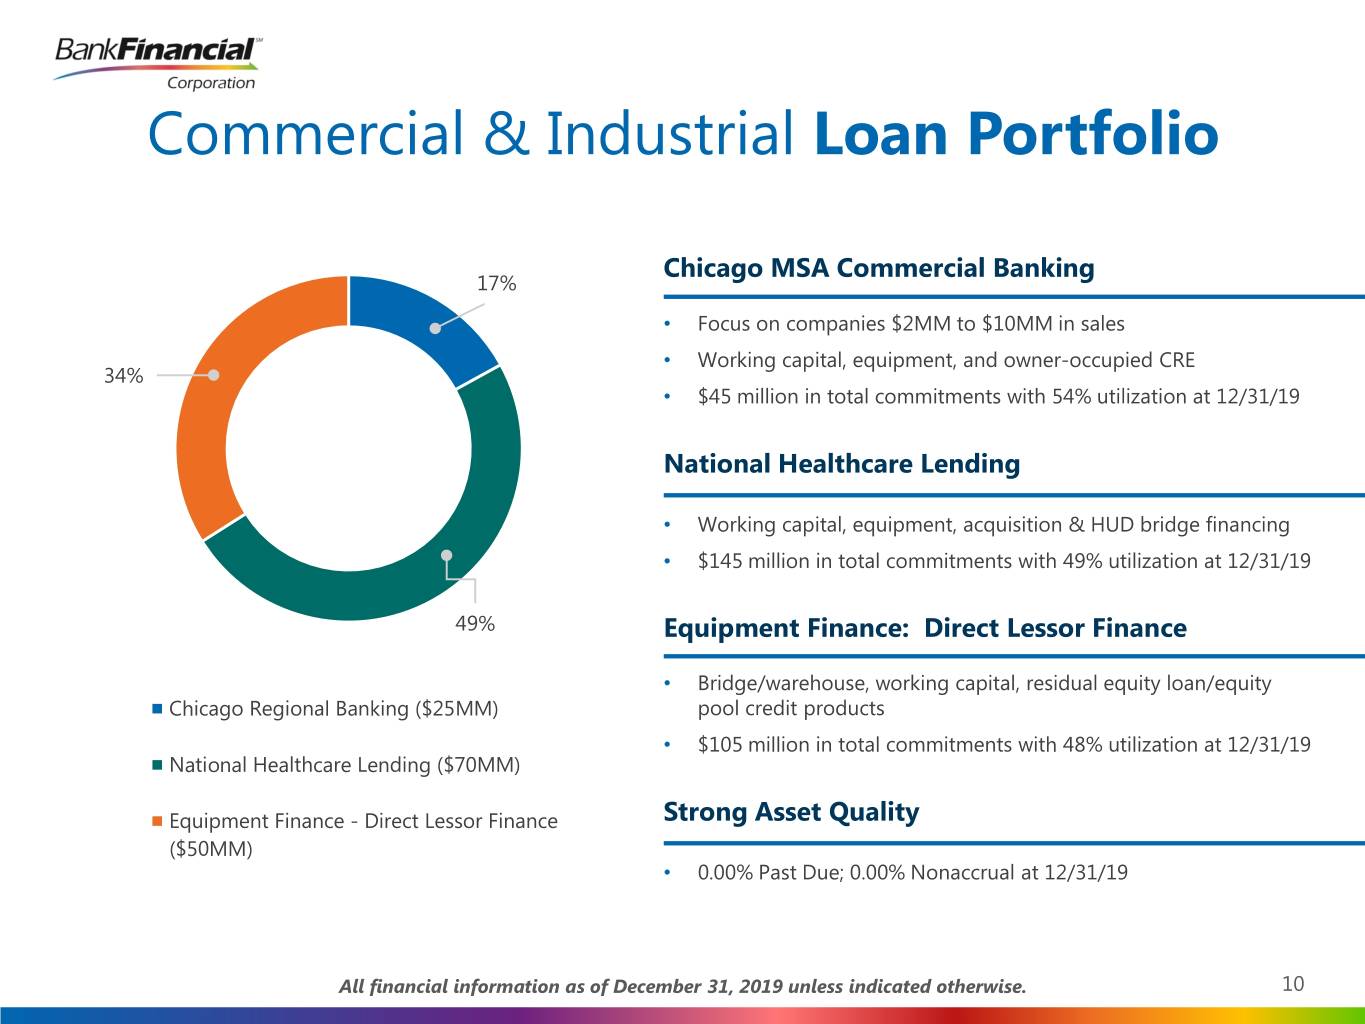
Commercial & Industrial Loan Portfolio Chicago MSA Commercial Banking 17% • Focus on companies $2MM to $10MM in sales • Working capital, equipment, and owner-occupied CRE 34% • $45 million in total commitments with 54% utilization at 12/31/19 National Healthcare Lending • Working capital, equipment, acquisition & HUD bridge financing • $145 million in total commitments with 49% utilization at 12/31/19 49% Equipment Finance: Direct Lessor Finance • Bridge/warehouse, working capital, residual equity loan/equity Chicago Regional Banking ($25MM) pool credit products • $105 million in total commitments with 48% utilization at 12/31/19 National Healthcare Lending ($70MM) Equipment Finance - Direct Lessor Finance Strong Asset Quality ($50MM) • 0.00% Past Due; 0.00% Nonaccrual at 12/31/19 All financial information as of December 31, 2019 unless indicated otherwise. 10
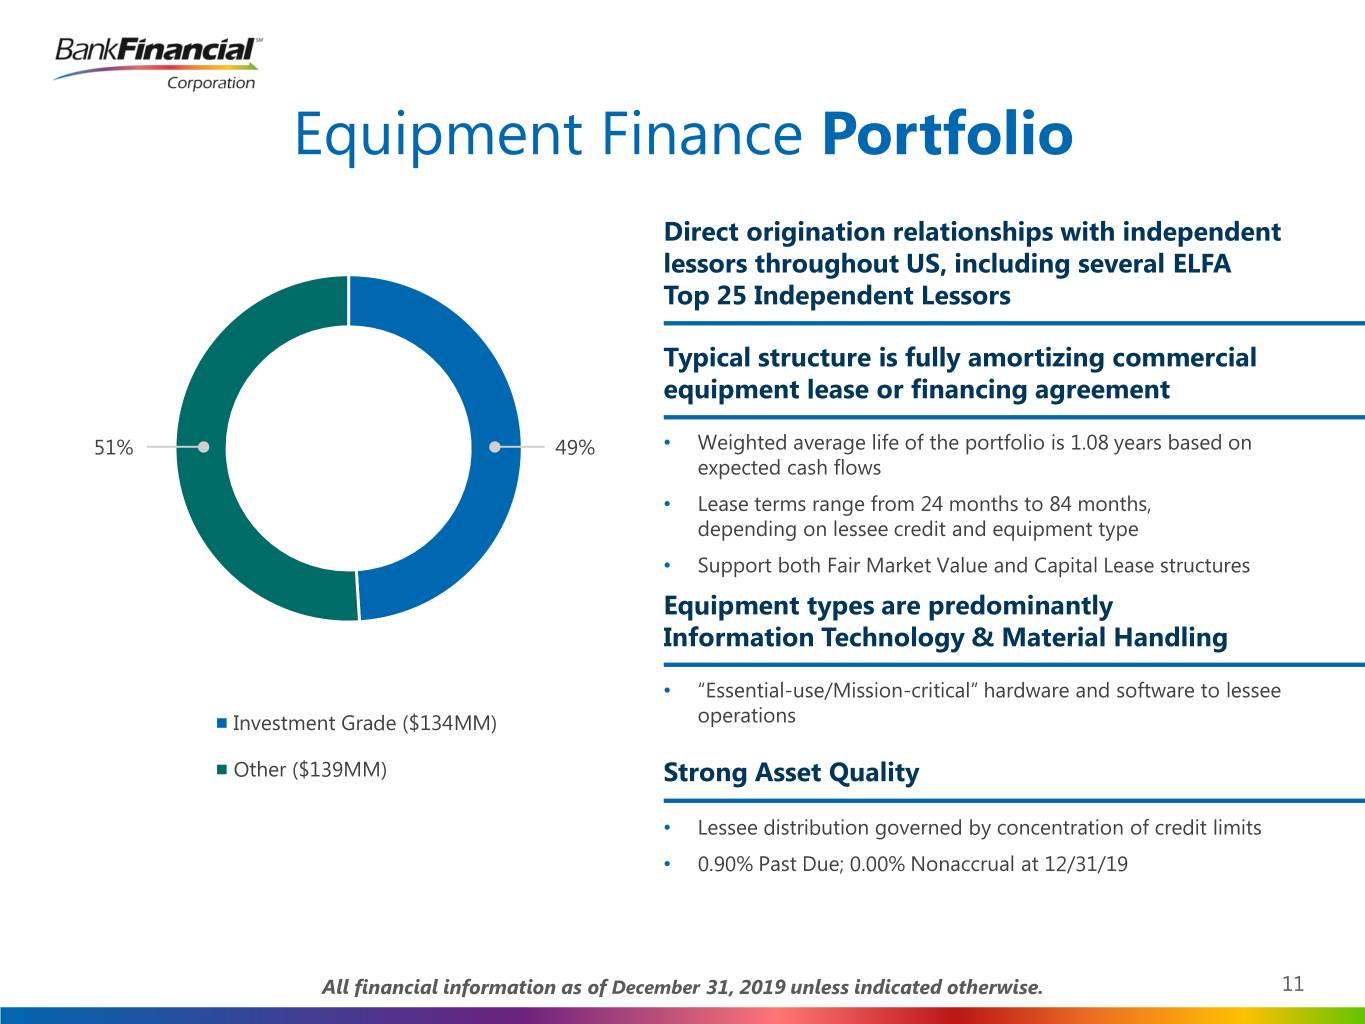
Equipment Finance Portfolio Direct origination relationships with independent lessors throughout US, including several ELFA Top 25 Independent Lessors Typical structure is fully amortizing commercial equipment lease or financing agreement 51% 49% • Weighted average life of the portfolio is 1.08 years based on expected cash flows • Lease terms range from 24 months to 84 months, depending on lessee credit and equipment type • Support both Fair Market Value and Capital Lease structures Equipment types are predominantly Information Technology & Material Handling • “Essential-use/Mission-critical” hardware and software to lessee Investment Grade ($134MM) operations Other ($139MM) Strong Asset Quality • Lessee distribution governed by concentration of credit limits • 0.90% Past Due; 0.00% Nonaccrual at 12/31/19 All financial information as of December 31, 2019 unless indicated otherwise. 11
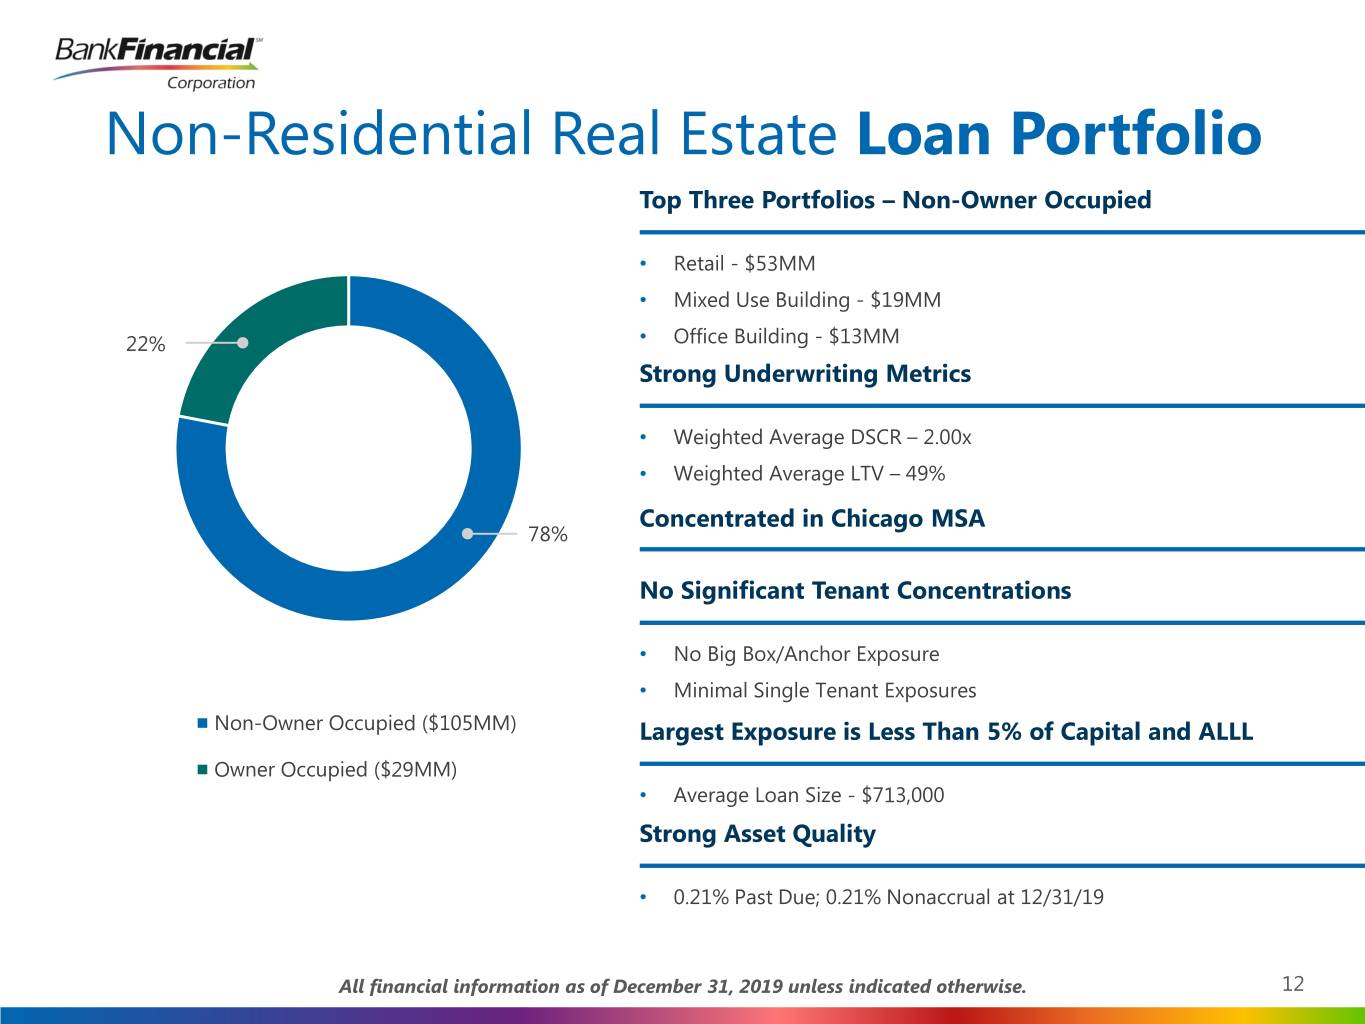
Non-Residential Real Estate Loan Portfolio Top Three Portfolios – Non-Owner Occupied • Retail - $53MM • Mixed Use Building - $19MM 22% • Office Building - $13MM Strong Underwriting Metrics • Weighted Average DSCR – 2.00x • Weighted Average LTV – 49% Concentrated in Chicago MSA 78% No Significant Tenant Concentrations • No Big Box/Anchor Exposure • Minimal Single Tenant Exposures Non-Owner Occupied ($105MM) Largest Exposure is Less Than 5% of Capital and ALLL Owner Occupied ($29MM) • Average Loan Size - $713,000 Strong Asset Quality • 0.21% Past Due; 0.21% Nonaccrual at 12/31/19 All financial information as of December 31, 2019 unless indicated otherwise. 12
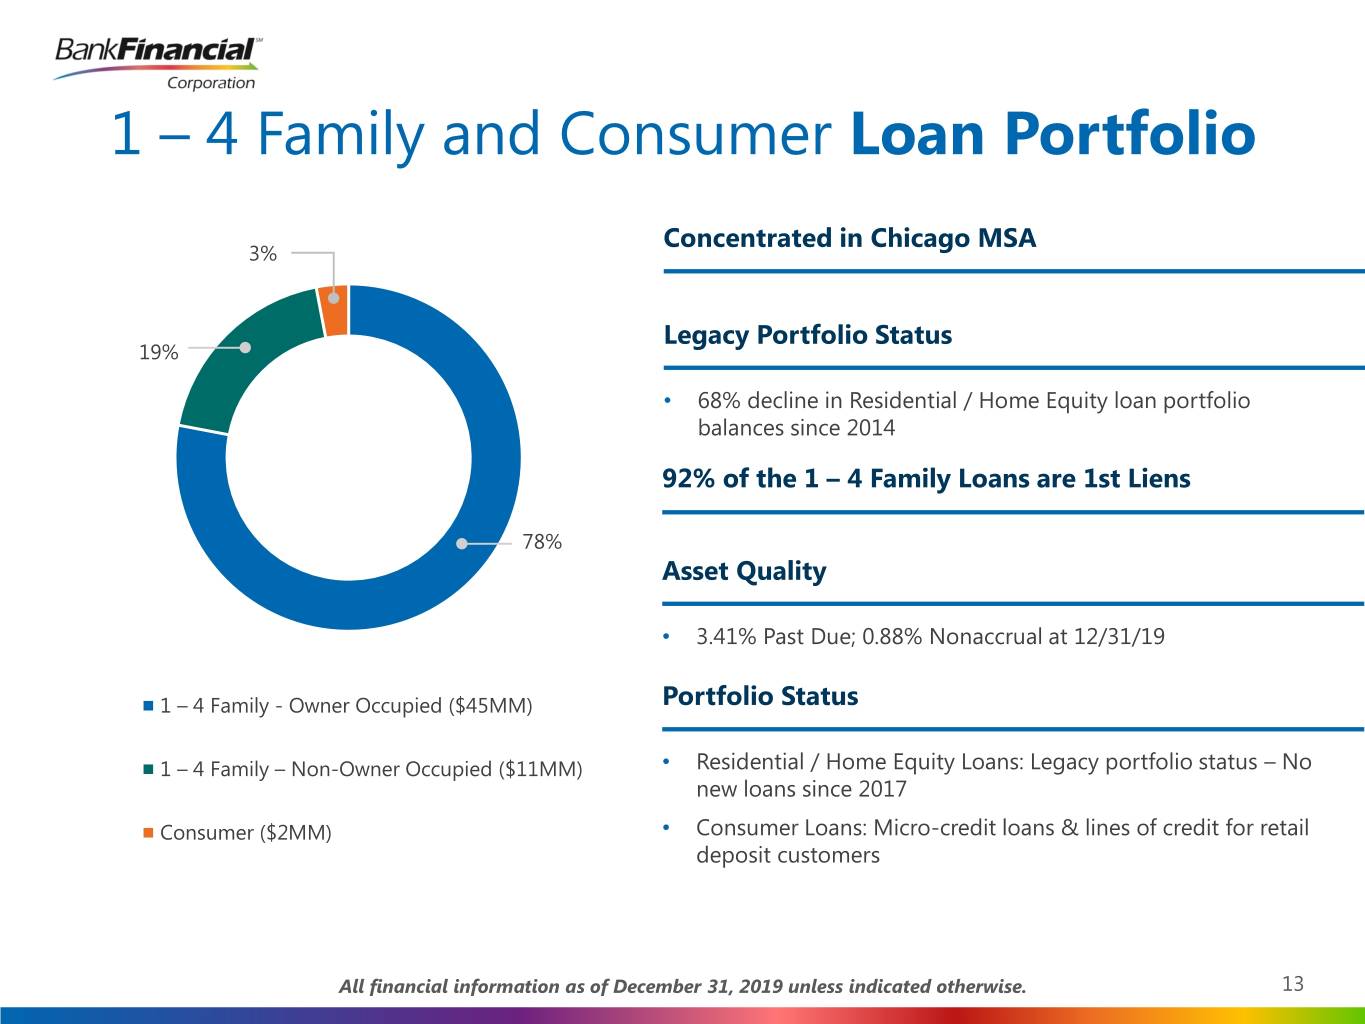
1 – 4 Family and Consumer Loan Portfolio Concentrated in Chicago MSA 3% Legacy Portfolio Status 19% • 68% decline in Residential / Home Equity loan portfolio balances since 2014 92% of the 1 – 4 Family Loans are 1st Liens 78% Asset Quality • 3.41% Past Due; 0.88% Nonaccrual at 12/31/19 1 – 4 Family - Owner Occupied ($45MM) Portfolio Status 1 – 4 Family – Non-Owner Occupied ($11MM) • Residential / Home Equity Loans: Legacy portfolio status – No new loans since 2017 Consumer ($2MM) • Consumer Loans: Micro-credit loans & lines of credit for retail deposit customers All financial information as of December 31, 2019 unless indicated otherwise. 13
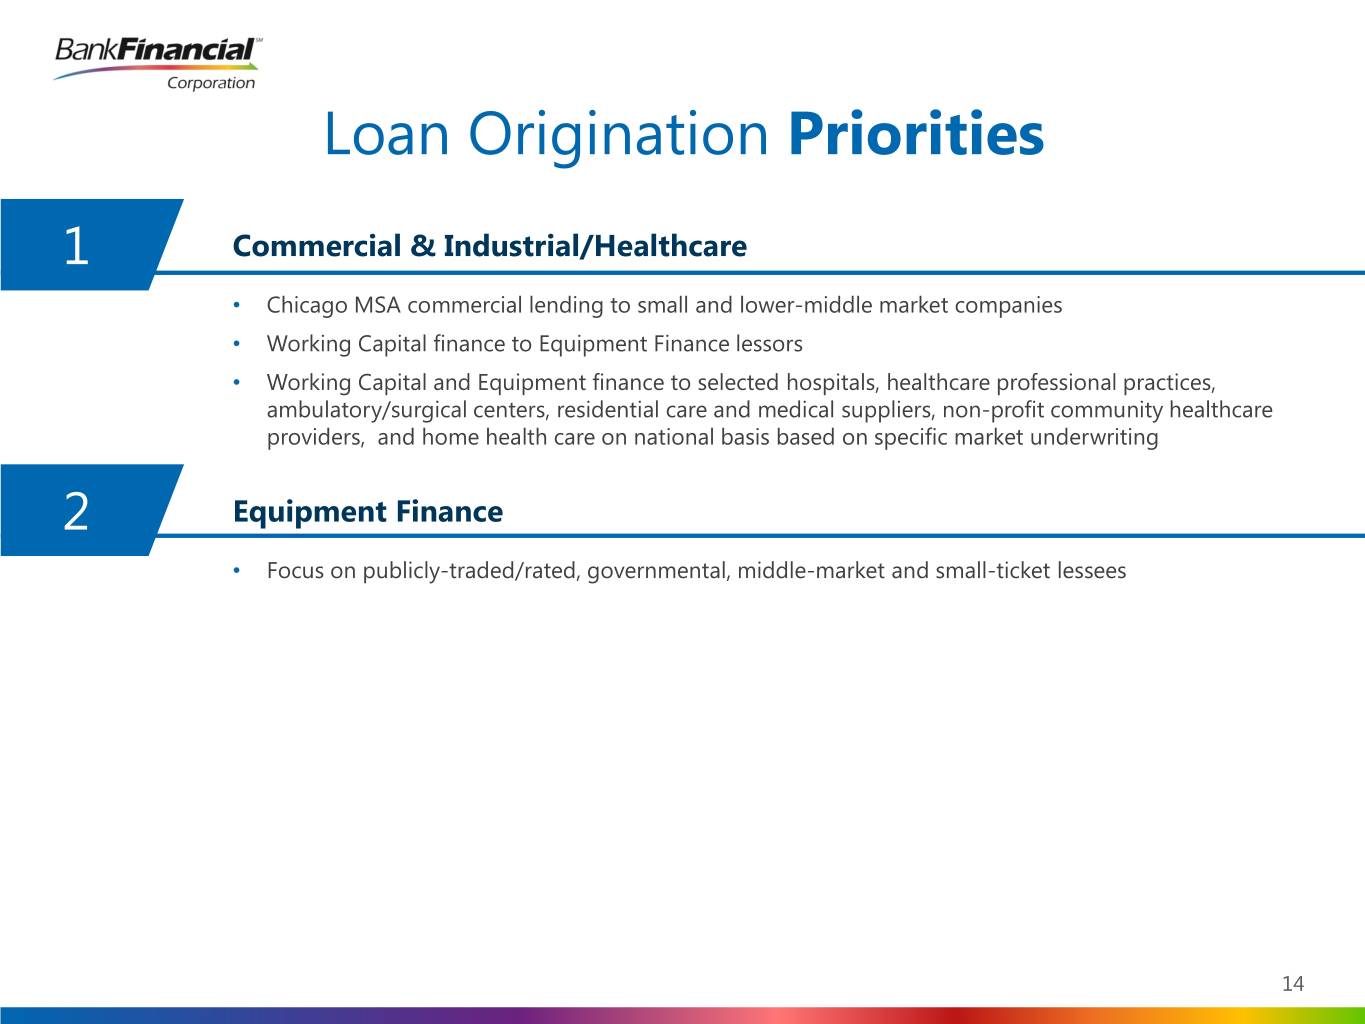
Loan Origination Priorities 1 Commercial & Industrial/Healthcare • Chicago MSA commercial lending to small and lower-middle market companies • Working Capital finance to Equipment Finance lessors • Working Capital and Equipment finance to selected hospitals, healthcare professional practices, ambulatory/surgical centers, residential care and medical suppliers, non-profit community healthcare providers, and home health care on national basis based on specific market underwriting 2 Equipment Finance • Focus on publicly-traded/rated, governmental, middle-market and small-ticket lessees 14
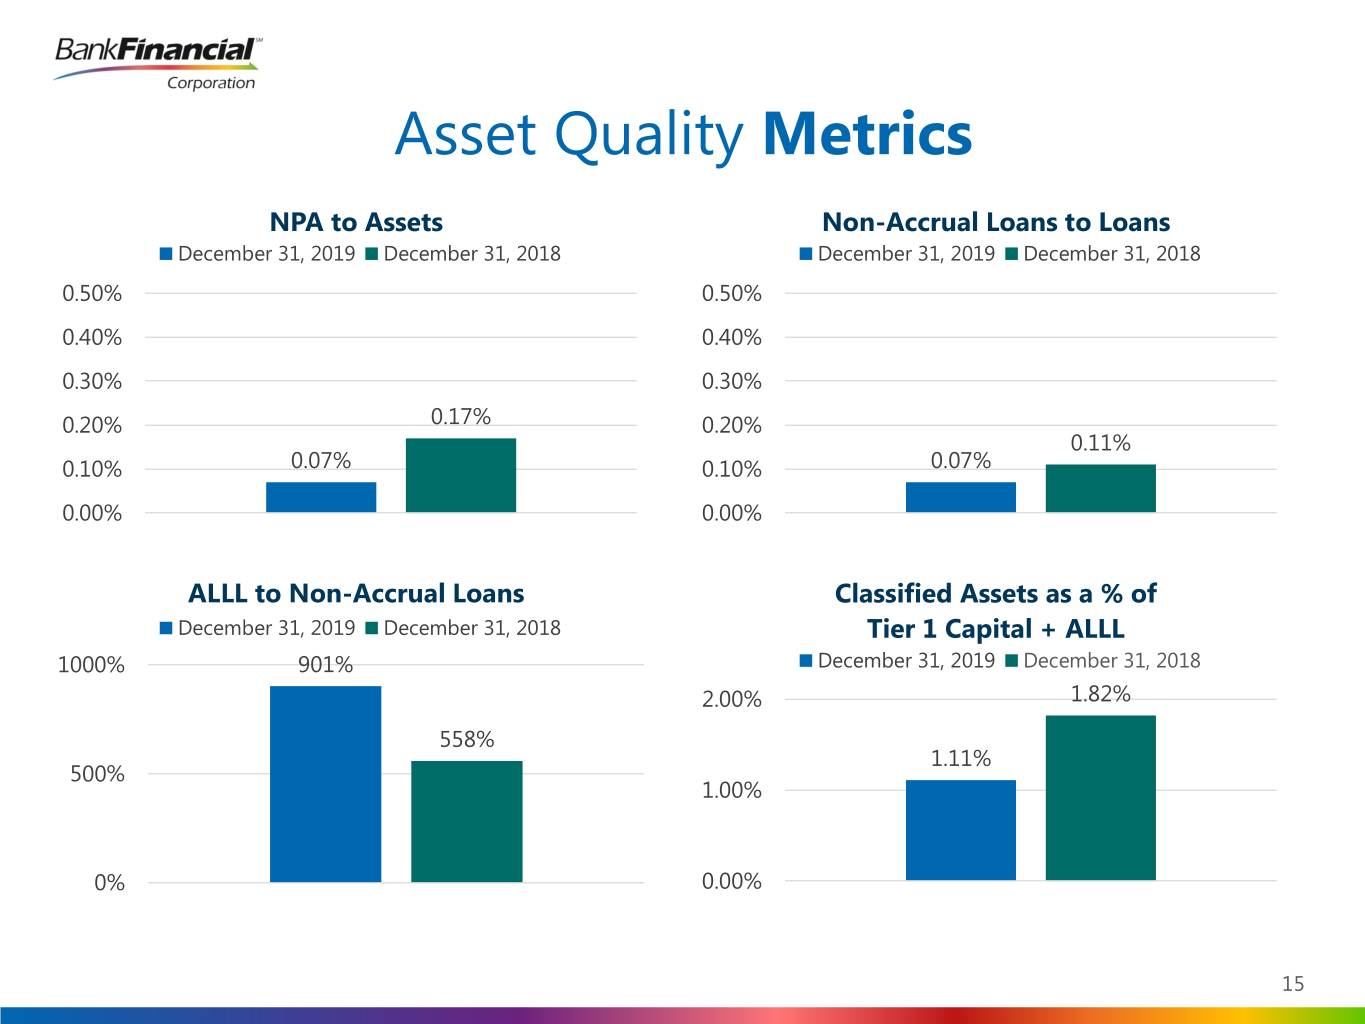
Asset Quality Metrics NPA to Assets Non-Accrual Loans to Loans December 31, 2019 December 31, 2018 December 31, 2019 December 31, 2018 0.50% 0.50% 0.40% 0.40% 0.30% 0.30% 0.20% 0.17% 0.20% 0.11% 0.10% 0.07% 0.10% 0.07% 0.00% 0.00% ALLL to Non-Accrual Loans Classified Assets as a % of December 31, 2019 December 31, 2018 Tier 1 Capital + ALLL 1000% 901% December 31, 2019 December 31, 2018 2.00% 1.82% 558% 1.11% 500% 1.00% 0% 0.00% 15
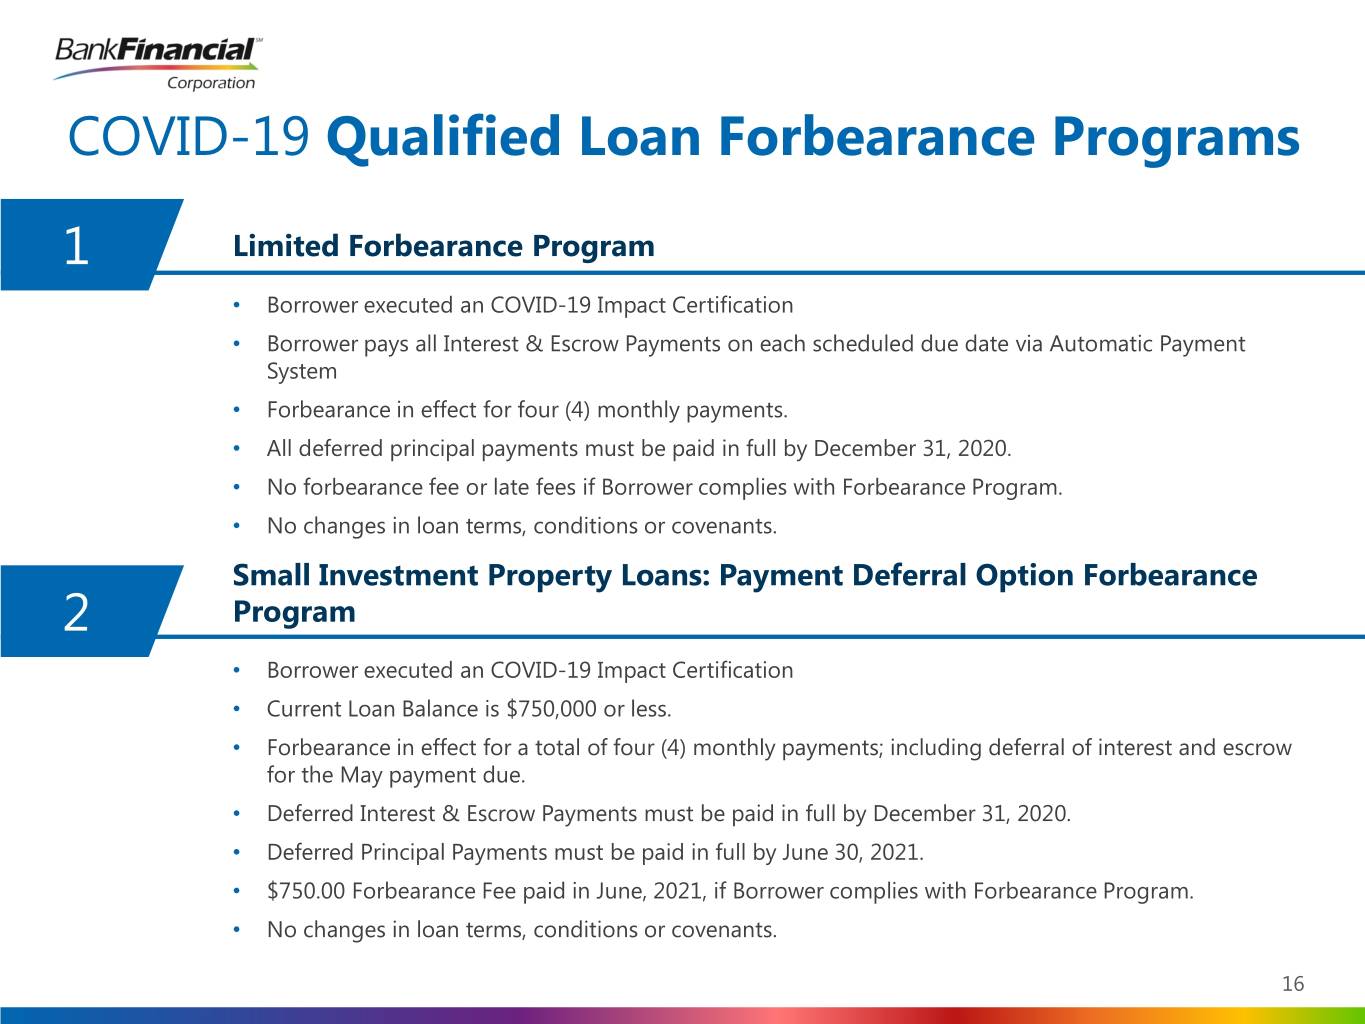
COVID-19 Qualified Loan Forbearance Programs 1 Limited Forbearance Program • Borrower executed an COVID-19 Impact Certification • Borrower pays all Interest & Escrow Payments on each scheduled due date via Automatic Payment System • Forbearance in effect for four (4) monthly payments. • All deferred principal payments must be paid in full by December 31, 2020. • No forbearance fee or late fees if Borrower complies with Forbearance Program. • No changes in loan terms, conditions or covenants. Small Investment Property Loans: Payment Deferral Option Forbearance 2 Program • Borrower executed an COVID-19 Impact Certification • Current Loan Balance is $750,000 or less. • Forbearance in effect for a total of four (4) monthly payments; including deferral of interest and escrow for the May payment due. • Deferred Interest & Escrow Payments must be paid in full by December 31, 2020. • Deferred Principal Payments must be paid in full by June 30, 2021. • $750.00 Forbearance Fee paid in June, 2021, if Borrower complies with Forbearance Program. • No changes in loan terms, conditions or covenants. 16
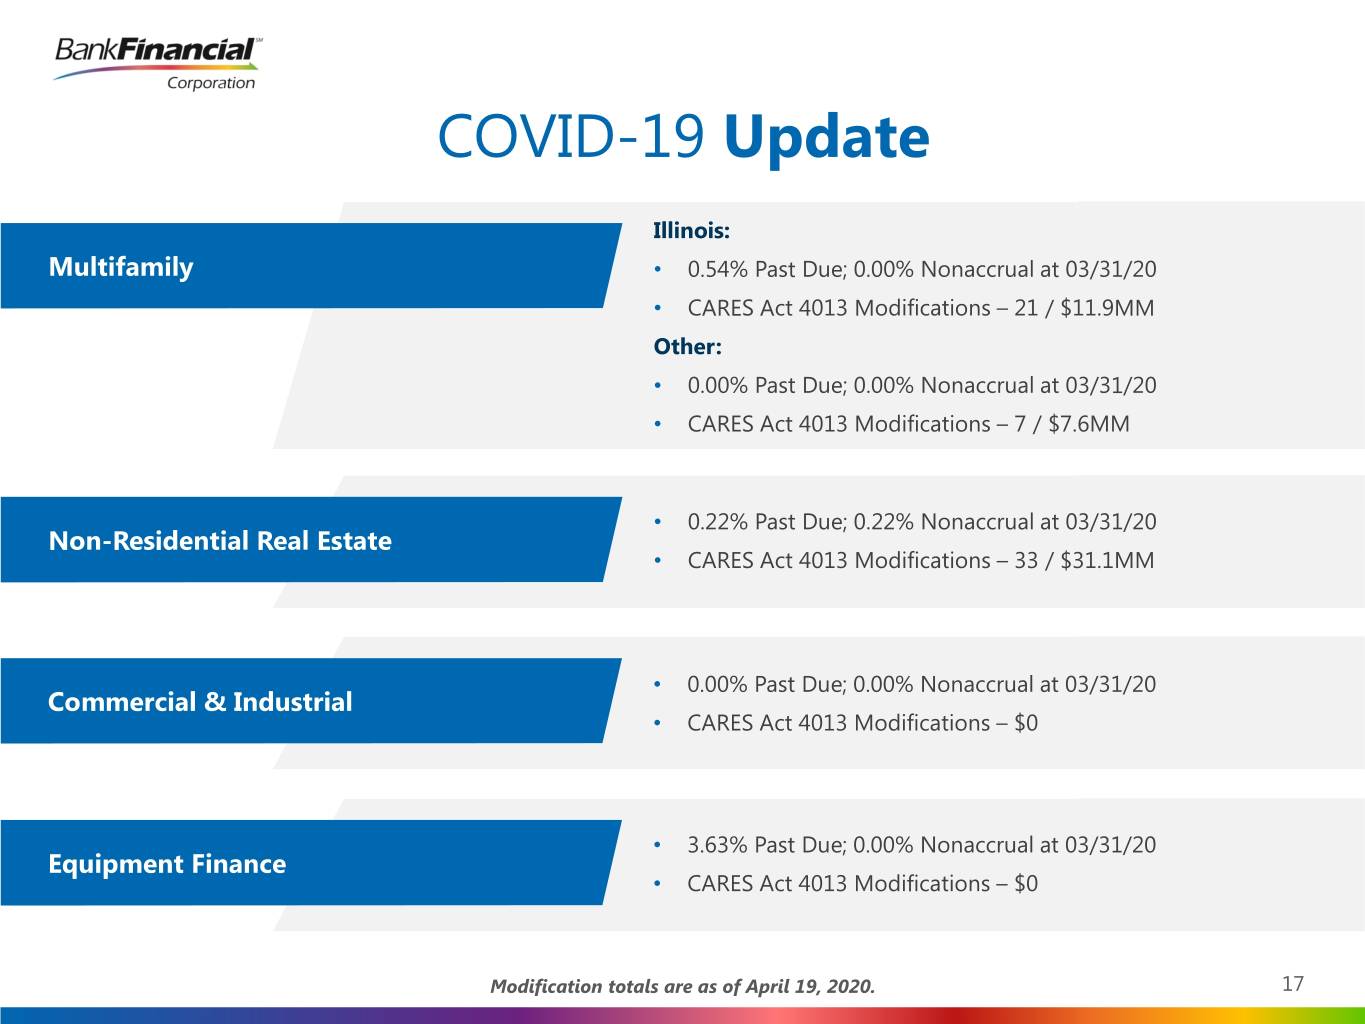
COVID-19 Update Illinois: Multifamily • 0.54% Past Due; 0.00% Nonaccrual at 03/31/20 • CARES Act 4013 Modifications – 21 / $11.9MM Other: • 0.00% Past Due; 0.00% Nonaccrual at 03/31/20 • CARES Act 4013 Modifications – 7 / $7.6MM • 0.22% Past Due; 0.22% Nonaccrual at 03/31/20 Non-Residential Real Estate • CARES Act 4013 Modifications – 33 / $31.1MM • 0.00% Past Due; 0.00% Nonaccrual at 03/31/20 Commercial & Industrial • CARES Act 4013 Modifications – $0 • 3.63% Past Due; 0.00% Nonaccrual at 03/31/20 Equipment Finance • CARES Act 4013 Modifications – $0 Modification totals are as of April 19, 2020. 17
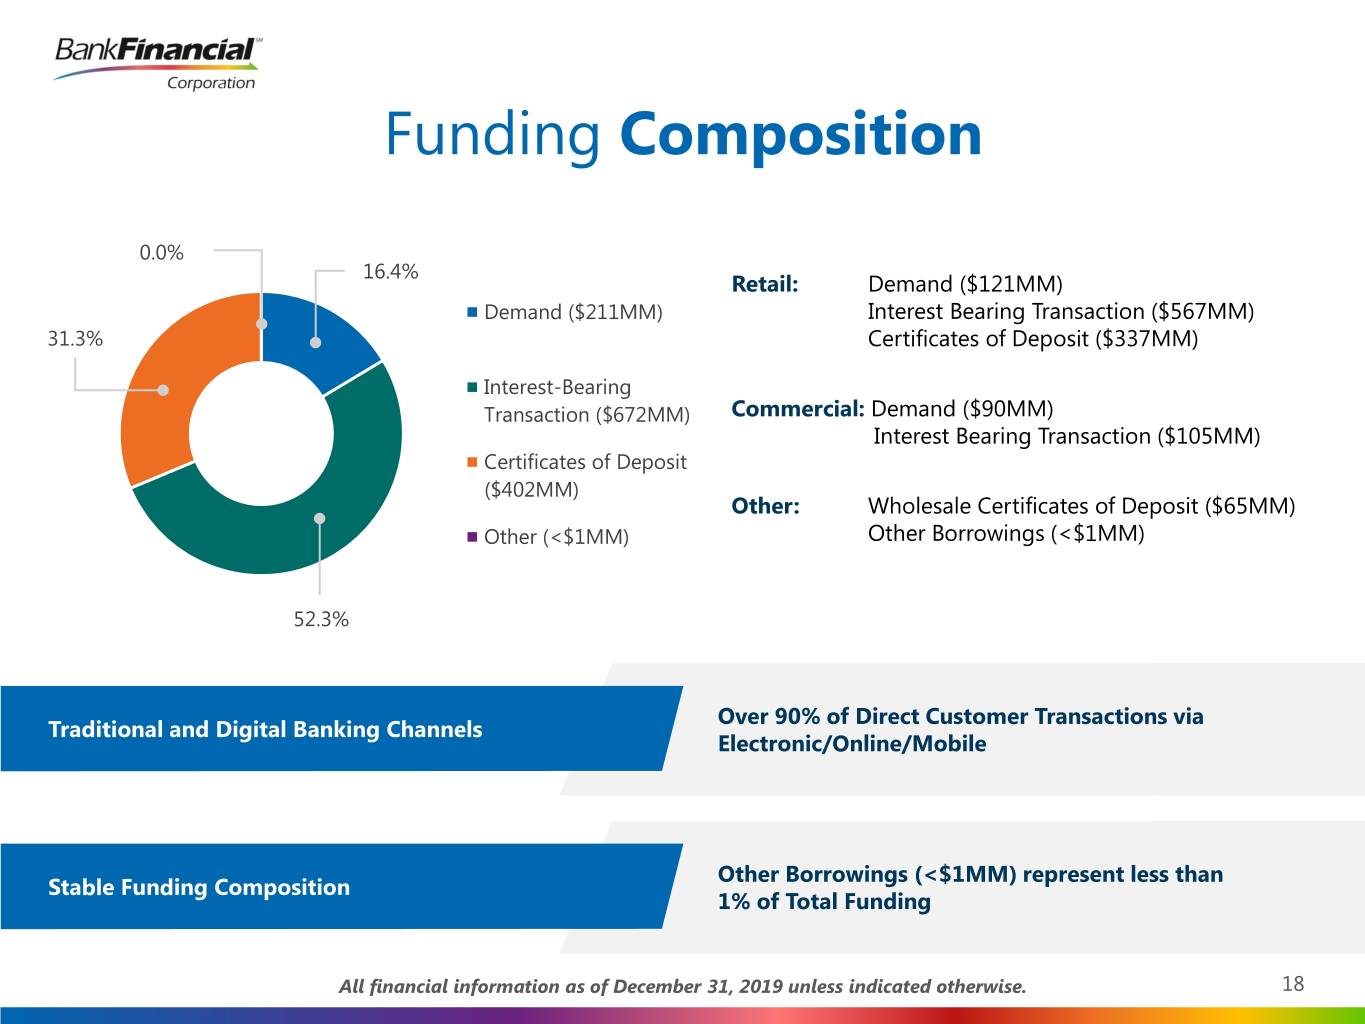
Funding Composition 0.0% 16.4% Retail: Demand ($121MM) Demand ($211MM) Interest Bearing Transaction ($567MM) 31.3% Certificates of Deposit ($337MM) Interest-Bearing Transaction ($672MM) Commercial: Demand ($90MM) Interest Bearing Transaction ($105MM) Certificates of Deposit ($402MM) Other: Wholesale Certificates of Deposit ($65MM) Other (<$1MM) Other Borrowings (<$1MM) 52.3% Over 90% of Direct Customer Transactions via Traditional and Digital Banking Channels Electronic/Online/Mobile Other Borrowings (<$1MM) represent less than Stable Funding Composition 1% of Total Funding All financial information as of December 31, 2019 unless indicated otherwise. 18
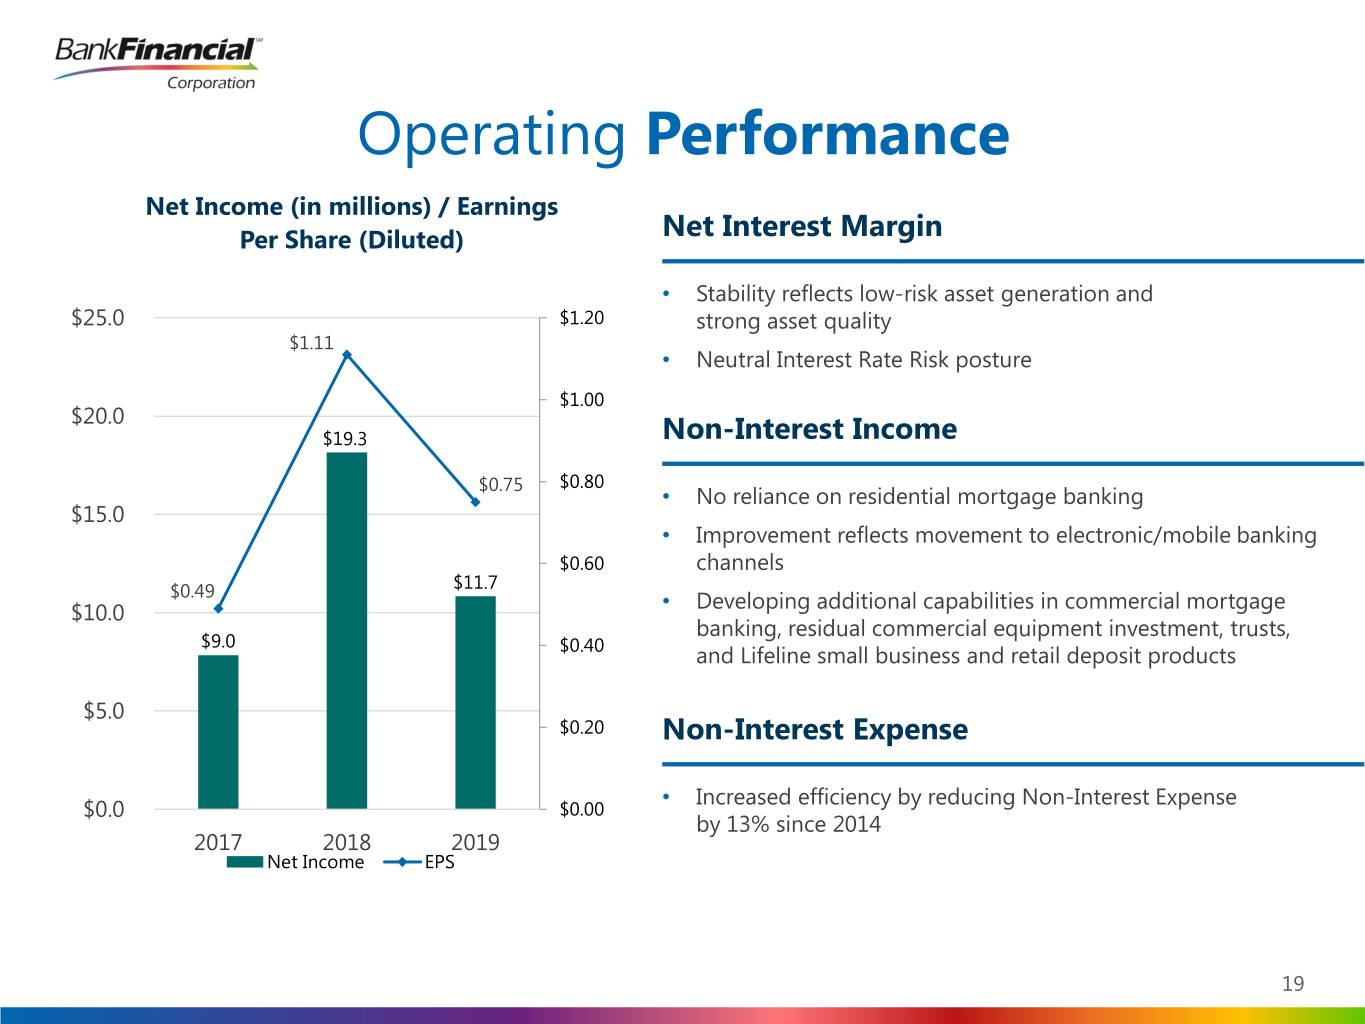
Operating Performance Net Income (in millions) / Earnings Per Share (Diluted) Net Interest Margin • Stability reflects low-risk asset generation and $25.0 $1.20 strong asset quality $1.11 • Neutral Interest Rate Risk posture $1.00 $20.0 $19.3 Non-Interest Income $0.75 $0.80 • No reliance on residential mortgage banking $15.0 • Improvement reflects movement to electronic/mobile banking $0.60 channels $11.7 $0.49 Developing additional capabilities in commercial mortgage $10.0 • banking, residual commercial equipment investment, trusts, $9.0 $0.40 and Lifeline small business and retail deposit products $5.0 $0.20 Non-Interest Expense • Increased efficiency by reducing Non-Interest Expense $0.0 $0.00 by 13% since 2014 2017 2018 2019 Net Income EPS 19
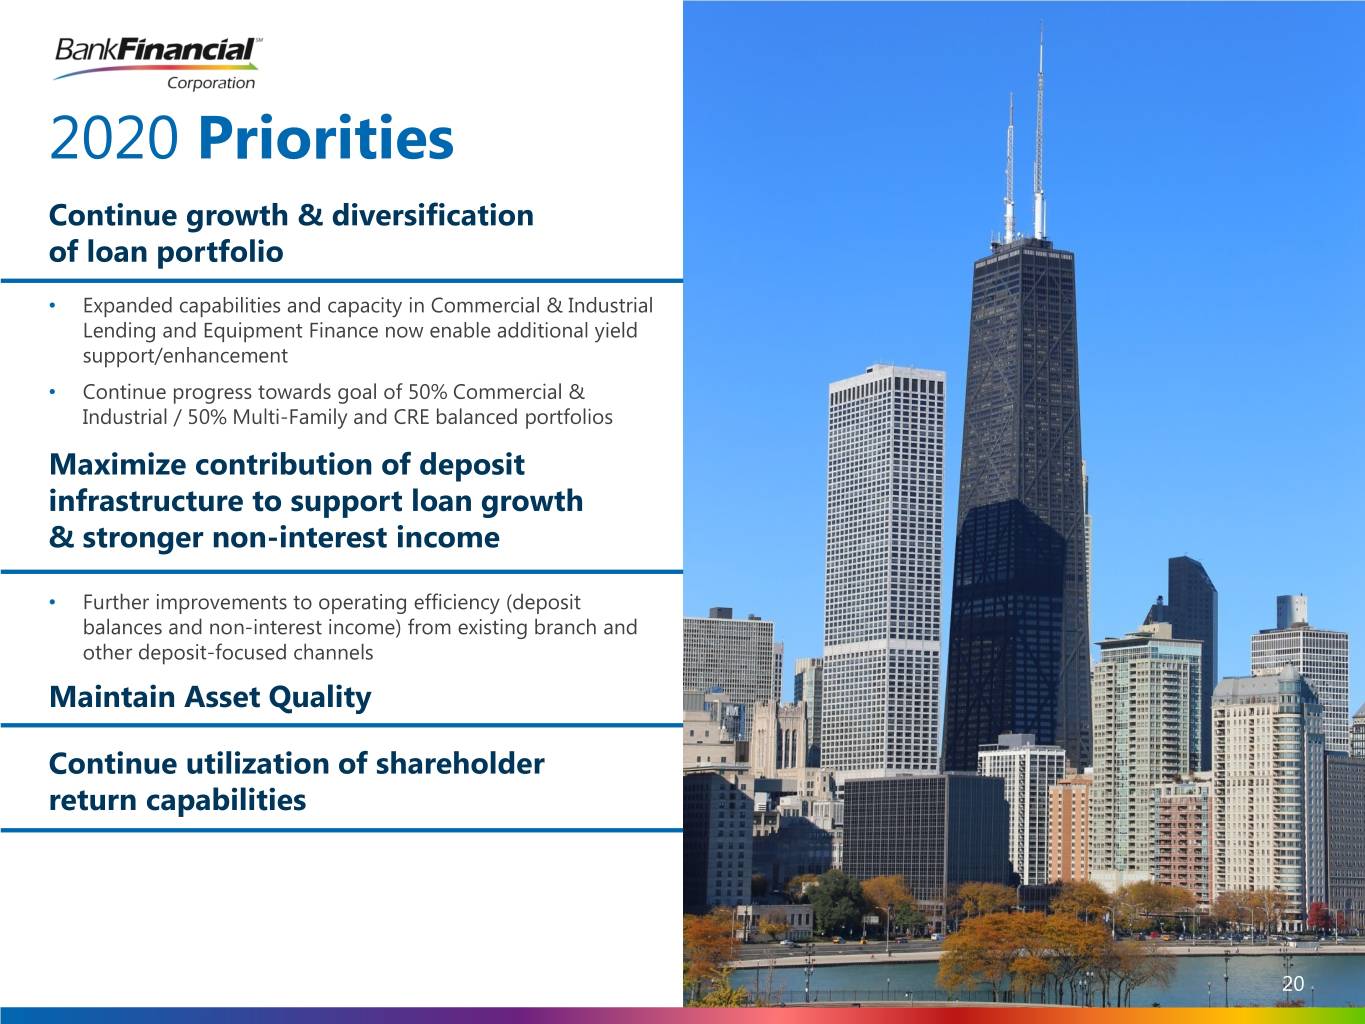
2020 Priorities Continue growth & diversification of loan portfolio • Expanded capabilities and capacity in Commercial & Industrial Lending and Equipment Finance now enable additional yield support/enhancement • Continue progress towards goal of 50% Commercial & Industrial / 50% Multi-Family and CRE balanced portfolios Maximize contribution of deposit infrastructure to support loan growth & stronger non-interest income • Further improvements to operating efficiency (deposit balances and non-interest income) from existing branch and other deposit-focused channels Maintain Asset Quality Continue utilization of shareholder return capabilities 20
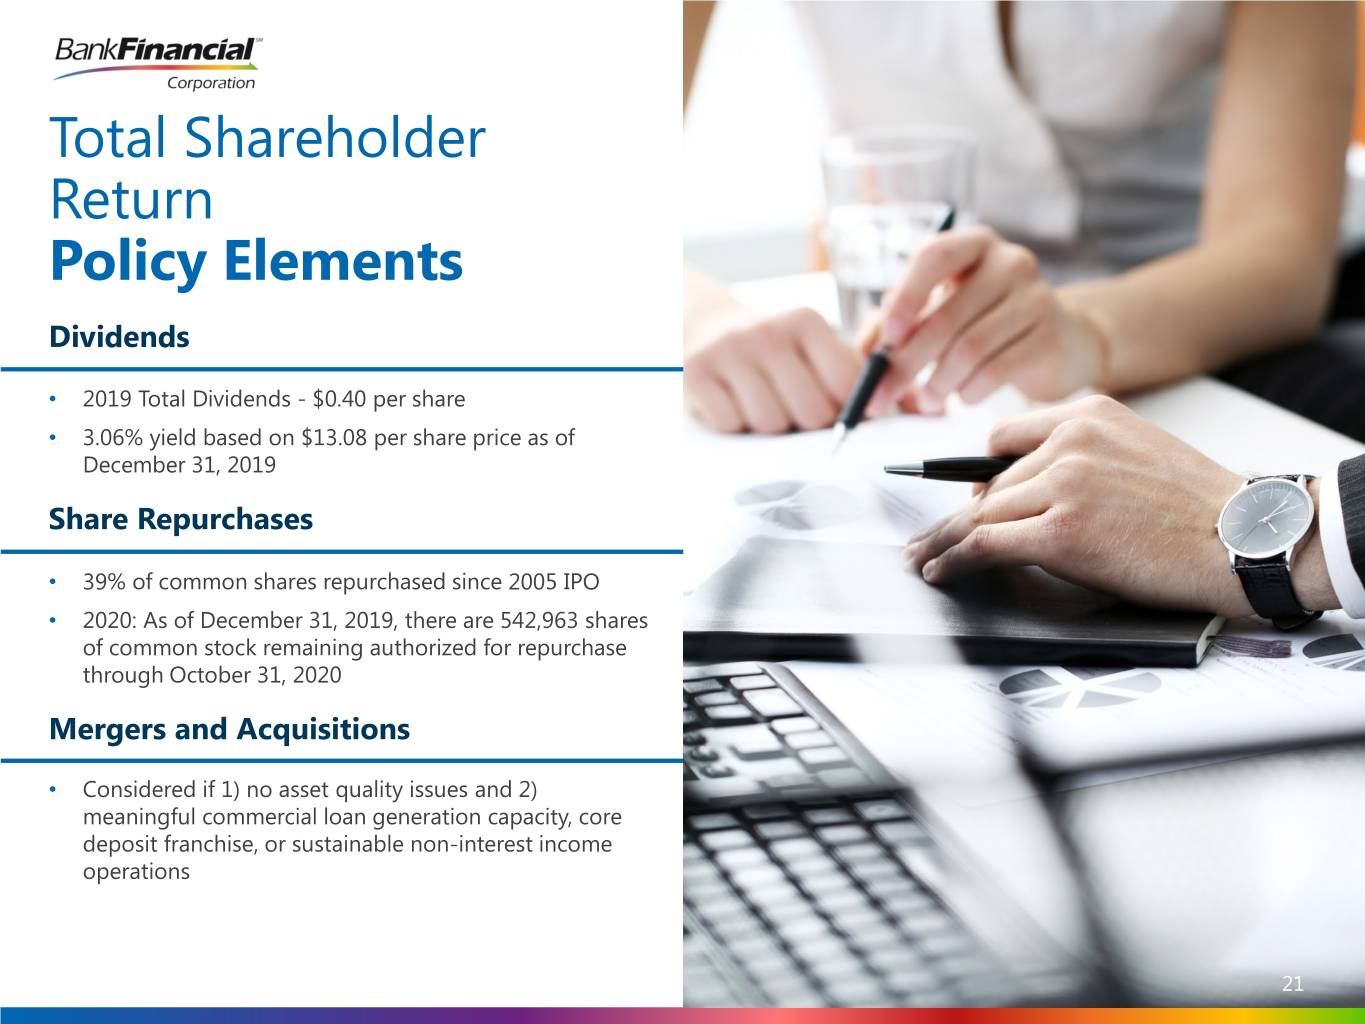
Total Shareholder Return Policy Elements Dividends • 2019 Total Dividends - $0.40 per share • 3.06% yield based on $13.08 per share price as of December 31, 2019 Share Repurchases • 39% of common shares repurchased since 2005 IPO • 2020: As of December 31, 2019, there are 542,963 shares of common stock remaining authorized for repurchase through October 31, 2020 Mergers and Acquisitions • Considered if 1) no asset quality issues and 2) meaningful commercial loan generation capacity, core deposit franchise, or sustainable non-interest income operations 21


