 Novelis Third Quarter 2012 Earnings Conference Call Philip Martens President and Chief Executive Officer Steve Fisher Senior Vice President and Chief Financial Officer Brighter Ideas with Aluminum February 8, 2012 Exhibit 99.2 |
 2 Forward-Looking Statements Statements made in this presentation which describe Novelis' intentions, expectations, beliefs or predictions may be forward-looking statements within the meaning of securities laws. Forward-looking statements include statements preceded by, followed by, or including the words "believes," "expects," "anticipates," "plans," "estimates," "projects," "forecasts," or similar expressions. Examples of forward-looking statements in this presentation are our stated view regarding our ability to generate free cash flows this fiscal year, the projected growth rate for aluminum flat rolled products in Asia, the projected growth rate for automotive sheet growth in North America, and anticipated full-year EBITDA. Novelis cautions that, by their nature, forward-looking statements involve risk and uncertainty and that Novelis' actual results could differ materially from those expressed or implied in such statements. We do not intend, and we disclaim any obligation, to update any forward-looking statements, whether as a result of new information, future events or otherwise. Factors that could cause actual results or outcomes to differ from the results expressed or implied by forward-looking statements include, among other things: changes in the prices and availability of aluminum (or premiums associated with such prices) or other materials and raw materials we use; the capacity and effectiveness of our metal hedging activities; relationships with, and financial and operating conditions of, our customers, suppliers and other stakeholders; fluctuations in the supply of, and prices for, energy in the areas in which we maintain production facilities; our ability to access financing for future capital requirements; changes in the relative values of various currencies and the effectiveness of our currency hedging activities; factors affecting our operations, such as litigation, environmental remediation and clean-up costs, labor relations and negotiations, breakdown of equipment and other events; the impact of restructuring efforts in the future; economic, regulatory and political factors within the countries in which we operate or sell our products, including changes in duties or tariffs; competition from other aluminum rolled products producers as well as from substitute materials such as steel, glass, plastic and composite materials; changes in general economic conditions including deterioration in the global economy, particularly sectors in which our customers operate; changes in the fair value of derivative instruments; cyclical demand and pricing within the principal markets for our products as well as seasonality in certain of our customers’ industries; changes in government regulations, particularly those affecting taxes, environmental, health or safety compliance; changes in interest rates that have the effect of increasing the amounts we pay under our principal credit agreement and other financing agreements; the effect of taxes and changes in tax rates; and our indebtedness and our ability to generate cash. The above list of factors is not exhaustive. Other important risk factors included under the caption "Risk Factors" in our Annual Report on Form 10-K for the fiscal year ended March 31, 2011 are specifically incorporated by reference into this presentation. Non-GAAP Financial Measures This presentation contains non-GAAP financial measures as defined by SEC rules. We think that these measures are helpful to investors in measuring our financial performance and liquidity and comparing our performance to our peers. However, our non-GAAP financial measures may not be comparable to similarly titled non-GAAP financial measures used by other companies. These non-GAAP financial measures have limitations as an analytical tool and should not be considered in isolation or as a substitute for GAAP financial measures. We have included reconciliations of each of these measures to the most directly comparable GAAP measure. In addition, a more detailed description of these non-GAAP financial measures used in this presentation, together with a discussion of the usefulness and purpose of such measures, is included as Exhibit 99.2 to our Current Report on Form 8-K furnished to the SEC with our earnings press release. Safe Harbor Statement |
 3 Agenda |
 4 |
 5 Business Review & Outlook Tough Quarter: Felt Economic Impact + Seasonally Low Quarter Fourth Quarter Recovering & Full-Year on Par with Last Year’s Record EBITDA Results While Economic Pressure Persists, Our Business Model Reduces Exposure (EBITDA/ton flat YOY) Expansions on Track and Budget. Continued Investments to Support Strategy Pressure in Q3, on Track with Strategic Expansion Plans |
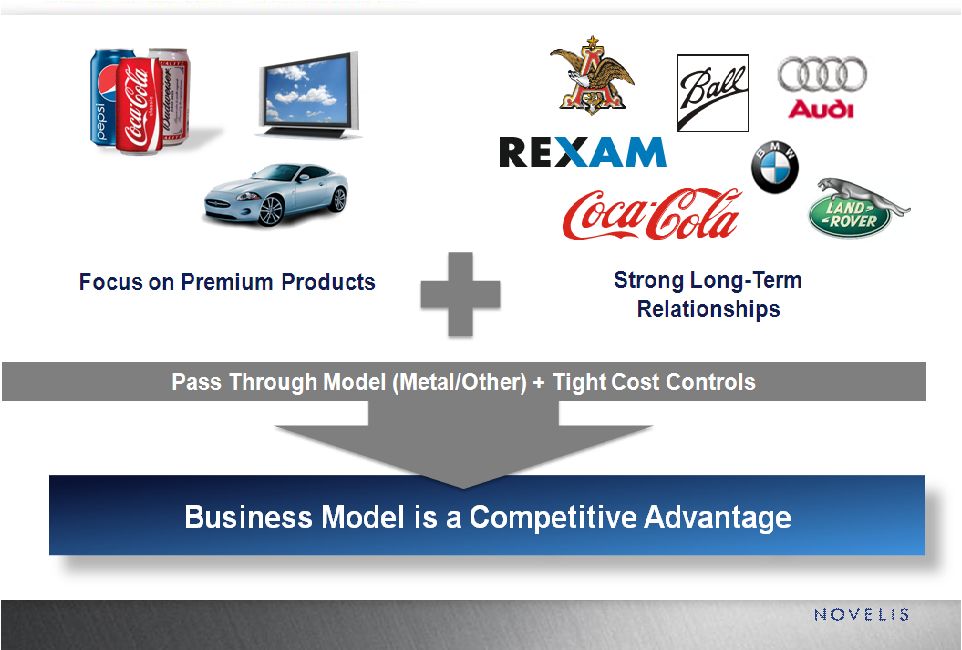 6 Novelis Business Model |
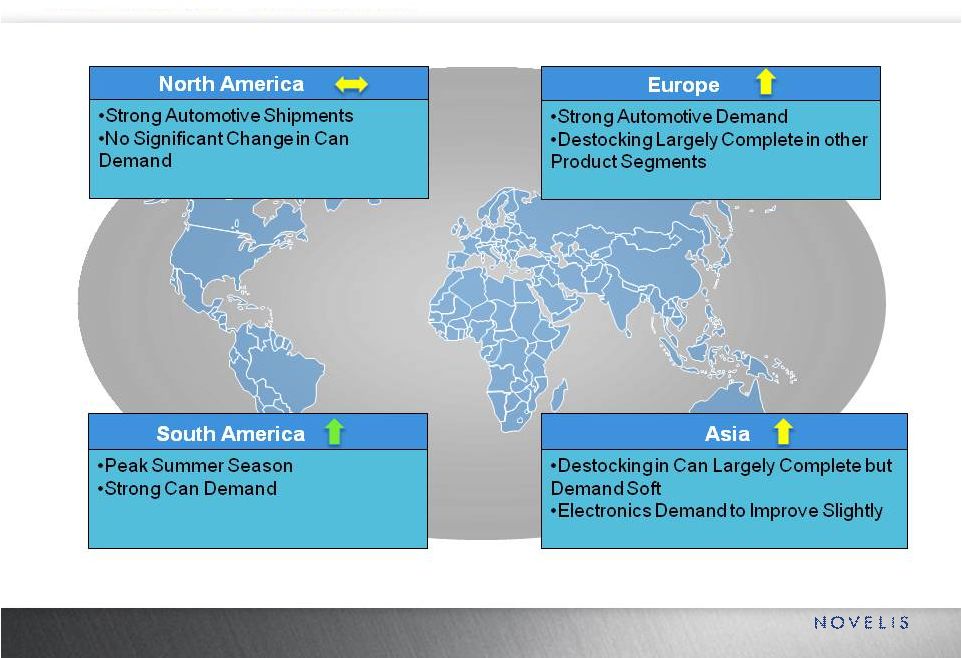 7 Regional Business Outlook (Q4FY12) 7 |
 8 |
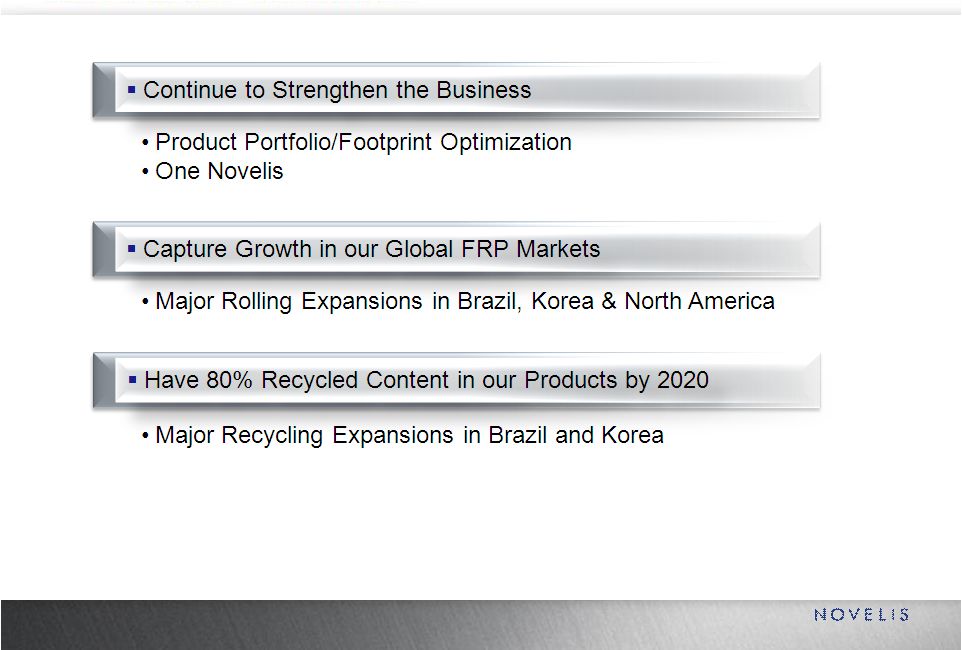 9 Novelis’ Strategy |
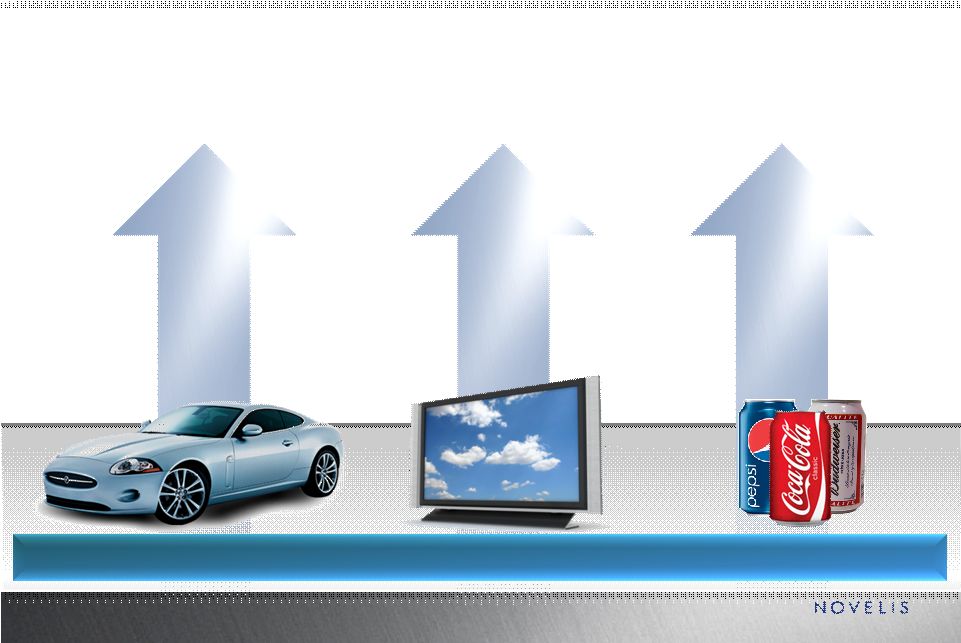 10 Source: Novelis Estimates and November 2011 CRU Long-Term Global Trends in Aluminum Demand Electronics & High-End Specialties Beverage Can Automotive Long-term (CY11-16) ~25% ~25% ~6% ~6% ~4-5% ~4-5% Strong Long-Term Outlook |
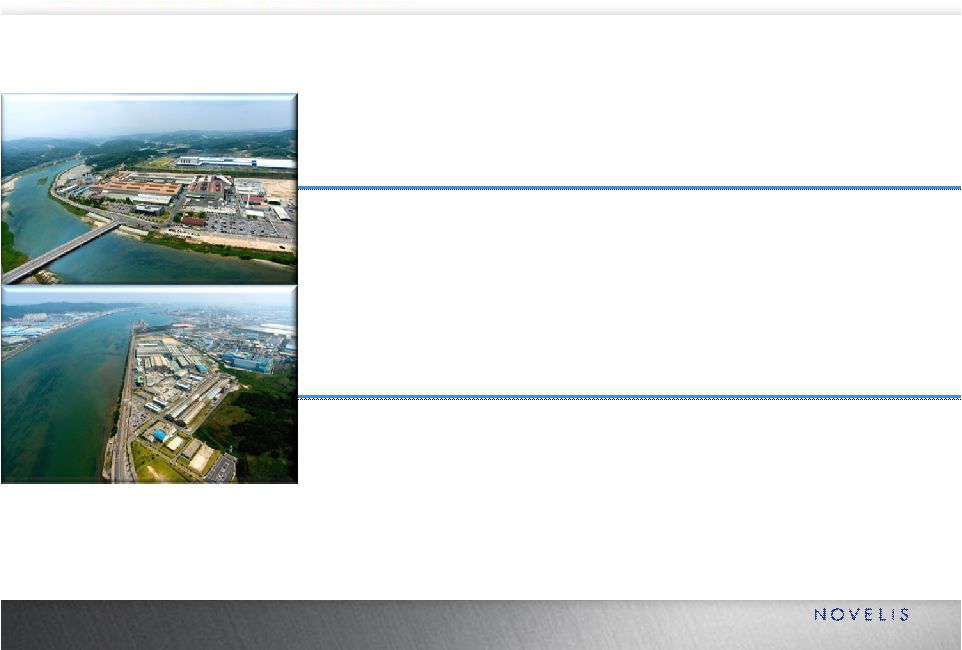 11 Asia – Invested $350M to Acquire Minority Interest • Completed purchase of minority stake in Korean Operations • Provides greater control of our manufacturing assets • Drives our ongoing initiatives for globally integrated operations |
 12 Asia – Korea Expansion Update • Total Investment of ~$400M • On Track for Incremental Capacity of ~350kt • Expect to begin commissioning by end of CY 2013 • FRP CAGR of 8% for Asia over the next 5 years |
 13 Brazil – Expansions Update Rolling Expansion • Total Investment of ~$300M • Expect to begin commissioning ~220kt by end of CY 2012 • Beverage Can CAGR of 7% over next 5 years Recycling Line • Total Investment of ~$30M • Recycling Capacity of ~190 kts begins commissioning by end of CY 2013 • Drives Towards 80% Recycled Content Goal, Ensures Metal Supply and Reduces Costs Can End Stock (CES) Coating Line • Total Investment of ~$50M • Capacity of ~100 kts begins commissioning by end of CY 2013 • Captures Growth, Reduces costs and Reliability on Third Parties Creating a World Class, Fully-Integrated Rolling System |
 14 North America – Expansion Update • Total Investment of ~$200M • On Track for Incremental Capacity of ~200kt • Expect to begin commissioning by mid CY 2013 • Strong Double Digit Auto Sheet CAGR in N.A. over the next 5 years |
 15 |
 16 Third Quarter Financial Highlights (Q3FY12 vs. Q3FY11) Shipments Down 9% to 648 Kilotonnes Net Sales Down 4% to $2.5 Billion Adjusted EBITDA Down 11% to $213 Million Free Cash Flow Before CapEx of $186 Million Liquidity of $857 Million Net Loss of $12 Million Solid Performance in a Tough Market |
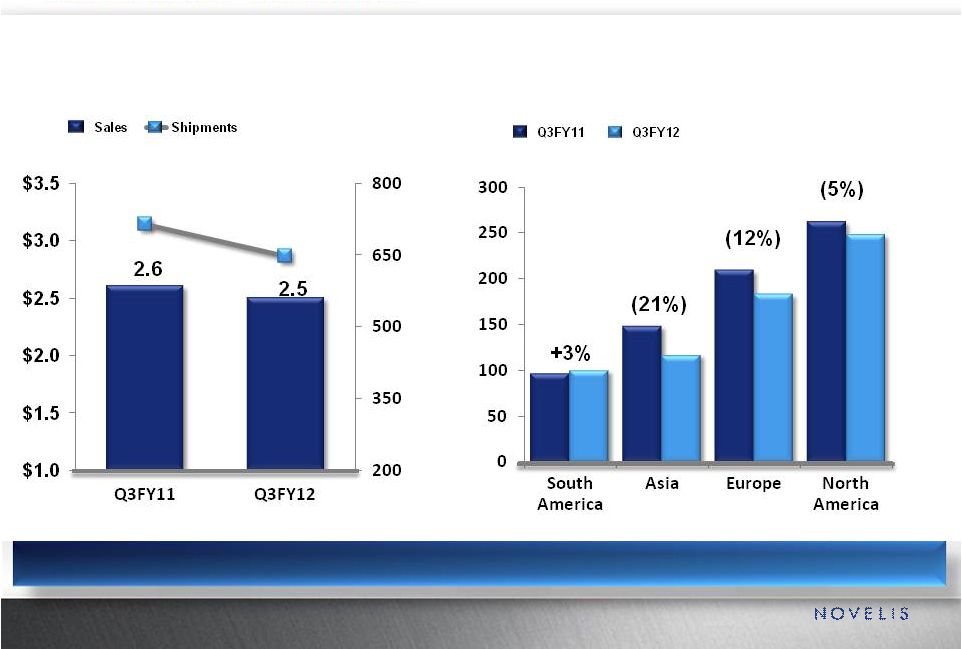 17 Shipments & Sales Total Company Sales (Billions) • Shipments (Kt) Shipments by Region Short-term Softness in Most Regions |
 18 (Millions) Adjusted EBITDA Trend Short-term Softness Impacting EBITDA |
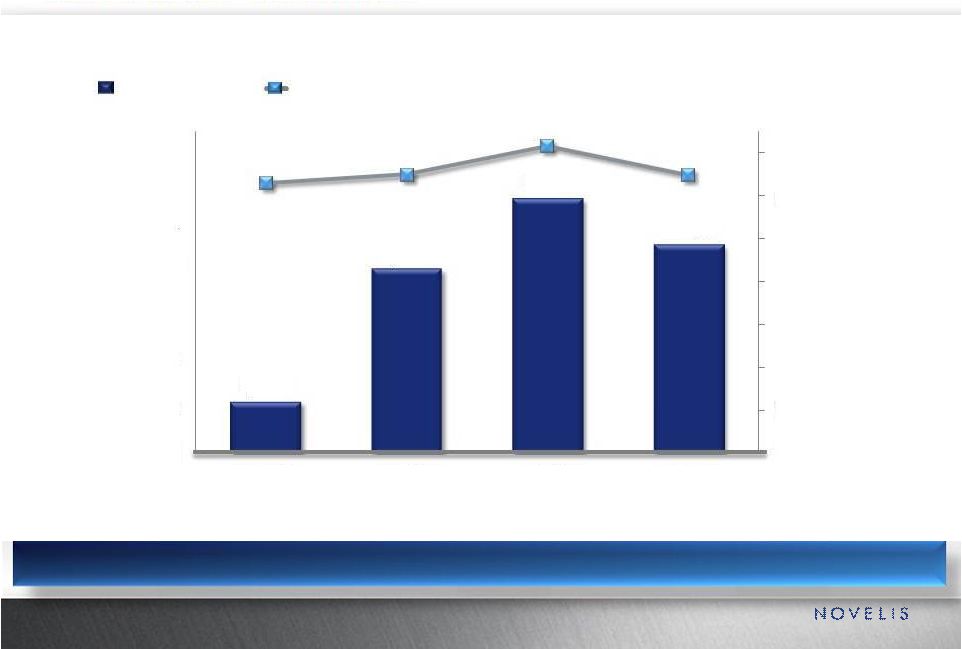 EBITDA & Shipments EBITDA (Millions) • Shipments (Kt) 19 Business Model Drives Performance $128 $200 $238 $213 0 100 200 300 400 500 600 700 $100 $125 $150 $175 $200 $225 $250 $275 Q3FY09 Q3FY10 Q3FY11 Q3FY12 Shipments Adjusted EBITDA |
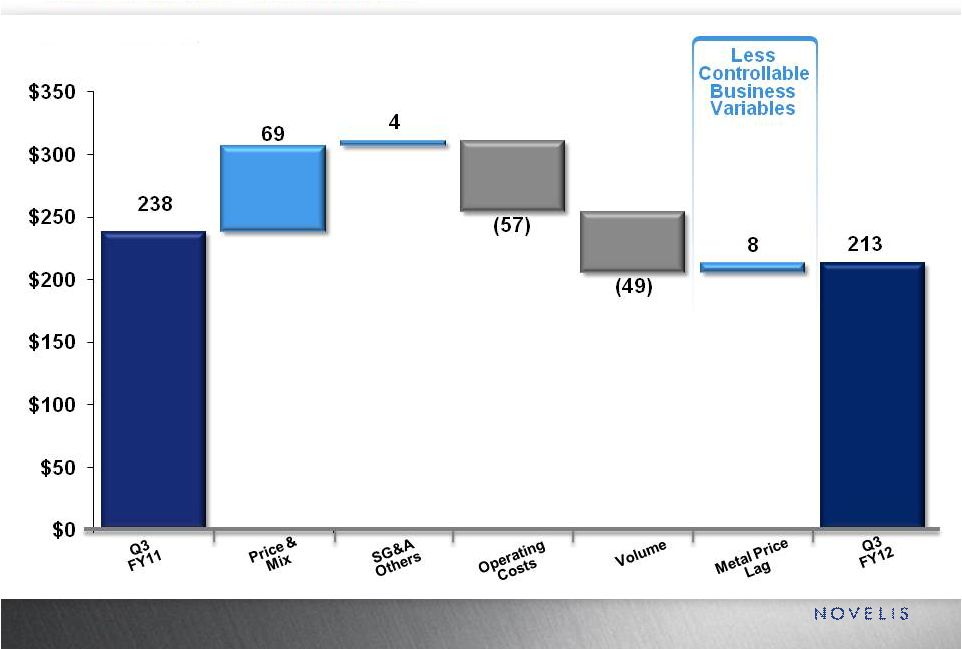 20 Adjusted EBITDA Q3FY11 vs. Q3FY12 (Millions) |
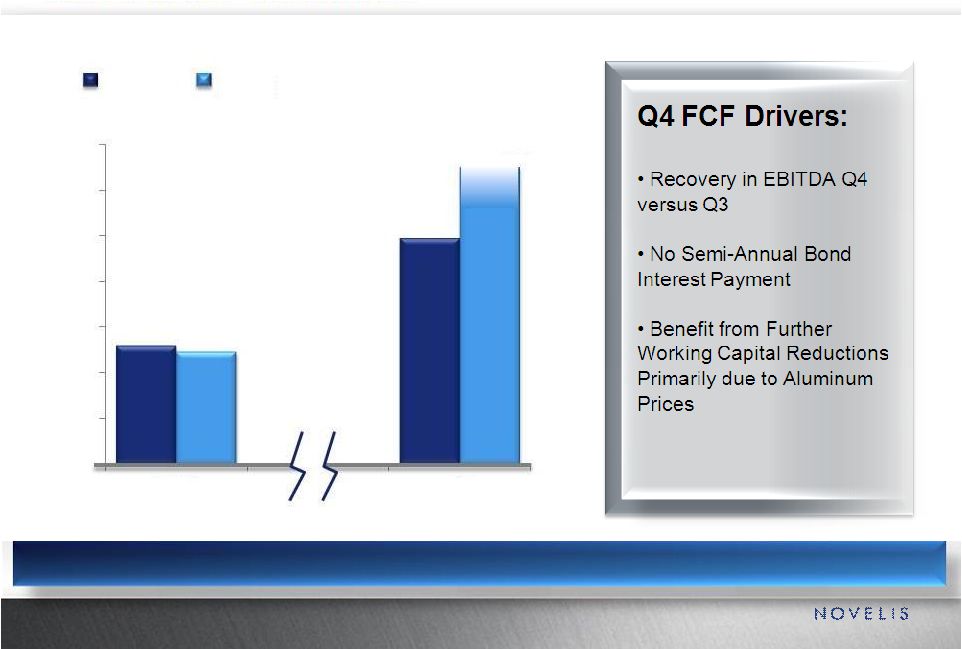 21 Free Cash Flow Before CapEx On Track to Generate ~$600-700 Million for FY12 308 544 296 $50 $150 $250 $350 $450 $550 $650 $750 YTD FY FY11 FY12 (Millions) ~600-700 |
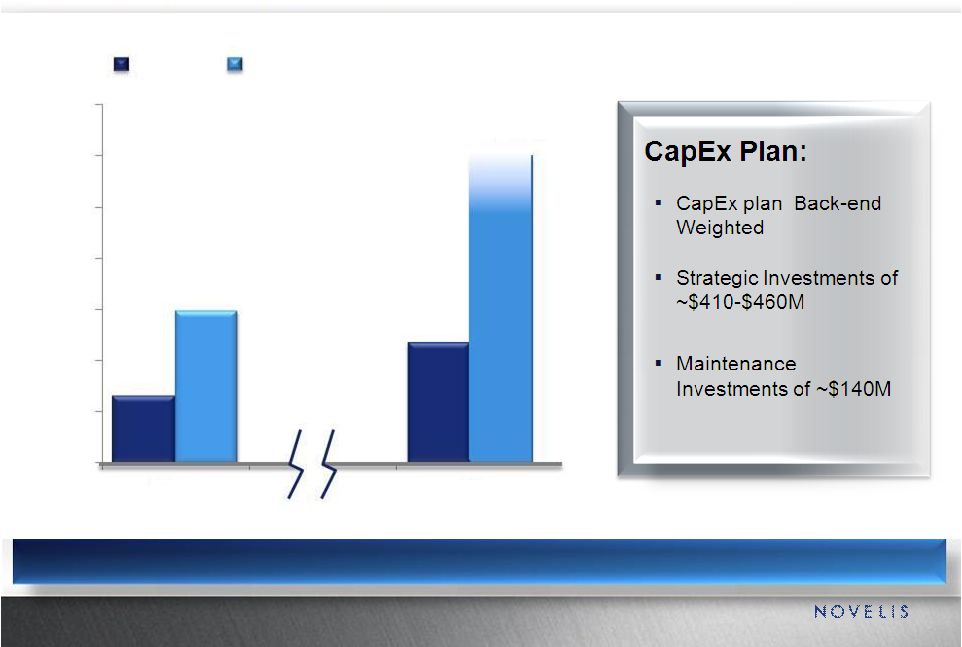 22 (Millions) Capital Expenditures Focused on Strategic Investments 132 234 297 $0 $100 $200 $300 $400 $500 $600 $700 YTD FY FY11 FY12 ~550-600 |
 23 |
 Summary & Outlook While Economic Pressure Persists, Our Business Model Reduces Exposure (EBITDA/ton flat YOY) Fourth Quarter Recovering & Full-Year on Par with Last Year’s Record EBITDA Results • FY12 Adjusted EBITDA between $1.05-1.08B Long-Term Outlook Supports Significant Global Expansion Projects • Three Large Mill Expansions on Track & Budget 24 |
 25 |
 26 |
   27 (in $ m) Q1 FY10 Q2 FY10 Q3 FY10 Q4 FY10 FY 10 Q1 FY11 Q2 FY11 Q3 FY11 Q4 FY11 FY11 Q1 FY12 Q2 FY12 Q3 FY12 Net Income (loss) Attributable to Our Common Shareholder 143 195 68 (1) 405 50 62 (46) 50 116 62 120 (12) - Interest, net (40) (41) (42) (41) (164) (36) (37) (42) (79) (194) (73) (73) (71) - Income tax (provision) benefit (112) (87) (48) (15) (262) (15) (56) (33) 21 (83) (59) 7 10 - Depreciation and amortization (100) (92) (93) (99) (384) (103) (104) (100) (97) (404) (89) (81) (79) - Noncontrolling interests (18) (19) (13) (10) (60) (9) (11) (11) (13) (44) (15) (10) (1) EBITDA 413 434 264 164 1,275 213 270 140 218 841 298 277 129 - Unrealized gain (loss) on derivatives 299 254 62 (37) 578 (47) 1 9 (27) (64) 26 (1) (63) - Realized gain on derivative instruments not included in segment income - - - - - - - 4 1 5 2 - (3) - Loss on early extinguishment of debt - - - - - - - (74) (10) (84) - - - - Proportional consolidation (16) (17) 2 (21) (52) (10) (11) (10) (14) (45) (13) (12) (9) - Restructuring charges, net (3) (3) (1) (7) (14) (6) (9) (20) 1 (34) (19) (11) (1) - Others costs, net 9 1 1 (3) 8 13 (2) (7) (13) (9) (4) - (8) Adjusted EBITDA 124 199 200 232 755 263 291 238 280 1,072 306 301 213 Other Income (expense) Included in Adjusted EBITDA - Metal price lag (30) (10) 3 2 (35) 9 19 - (3) 25 5 15 8 - Foreign currency remeasurement 5 13 (6) 4 16 (22) 20 1 9 8 (8) - (2) - Purchase accounting 52 49 42 (2) 141 (3) (4) (3) (3) (13) (3) (3) (3) - Can price ceiling, net (54) (54) (20) - (128) - - - - - - - - Income Statement Reconciliation to Adjusted EBITDA |
   28 (in $m) FY10 FY11 FY12 Q1 Q2 Q3 Q4 Full Year Q1 Q2 Q3 Q4 Full Year Q1 Q2 Q3 Cash Provided by (used in) Operating Activities 256 195 179 214 844 22 102 94 236 454 (115) 171 145 Cash Provided by (used in) Investing Activities) (233) (196) (55) 0 (484) 27 (2) (39) (99) (113) (79) (40) (72) Less: Proceeds from Sales of Fixed Assets (3) (1) 0 (1) (5) (15) (3) (10) (3) (31) 0 1 (10) Free Cash Flow 20 (2) 124 213 355 34 97 45 134 310 (194) 130 63 Free Cash Flow |
 29 Explanation of Other Income (Expenses) Included in our Adjusted EBITDA 1) Metal Price Lag Net of Related Hedges: On certain sales contracts we experience timing differences on the pass through of changing aluminum prices from our suppliers to our customers. Additional timing differences occur in the flow of metal costs through moving average inventory cost values and cost of goods sold. This timing difference is referred to as Metal Price Lag. We have a risk management program in place to minimize impact of this “lag”. 2) Foreign Currency Remeasurement Net of Related Hedges: All non-functional currency denominated Working Capital and Debt gets remeasured every period by the period end exchange rates. This impacts our profitability. Like Metal Price Lag, we have a risk management program in place to minimize impact of such Remeasurement. 3) Purchase Accounting: Following our acquisition, the consideration and transaction costs paid by Hindalco in connection with the transaction were “pushed down” to us and were allocated to the assets acquired and the liabilities assumed. These allocations are amortized over periods, impacting our profitability. A significant portion of such amortizations pertain to ceiling contracts. 4) Can Price Ceilings: Some sales contracts contained a ceiling over which metal prices could not be contractually passed through to certain customers. This negatively impacted our margins and cash flows when the price we paid for metal was above the ceiling price contained in these contracts. These contracts expired December 31, 2009. |