Exhibit 99.1

INVESTOR PRESENTATION
Forward Looking Information
Certain statements contained in this presentation, including, without limitation, statements containing the words “believes”, “anticipates”, “intends”, and “expects”, and words of similar import, constitute “forward-looking statements” within the meaning of Section 27A of the Securities Act of 1933 and Section 21E of the Securities Exchange Act of 1934. Such forward looking statements involve known and unknown risks, uncertainties and other factors that may cause the actual results, performance or achievements of the Company to be materially different from any future results, performance or achievements expressed or implied by such forward-looking statements. Such factors include, among others, the following: general economic and business conditions in those areas in which the Company operates, demographic changes, competition, fluctuations in interest rates, changes in business strategy or development plans, changes in governmental regulation, credit quality, the availability of capital to fund the expansion of the Company’s business, and other factors referenced in this presentation. The Company disclaims any obligation to update any such factors or to publicly announce the results of any revisions to any of the forward-looking statements contained herein to reflect future events or developments.
2
Securities Law Matters
This presentation may be deemed to be solicitation material in respect to the proposed transaction between Community Bancorp and Bank of Commerce pursuant to an Agreement to Merge and Plan of Reorganization, dated as of May 19, 2005 by and among Community Bancorp, Community Bank of Nevada and Bank of Commerce (the “Agreement”). Filing of this presentation is being made in connection with Rules 165 and 425 promulgated by the Securities and Exchange Commission (“SEC”).
In connection with the proposed transaction, Community Bancorp has filed with the SEC a registration statement on SEC Form S-4. The registration statement contains a proxy statement/prospectus which describes the proposed transaction and its proposed terms and conditions. Shareholders of Bank of Commerce are encouraged to read the registration material and proxy statement/prospectus because these documents contain important information about the transaction. A copy of the Agreement has been filed with the SEC as an exhibit to Community Bancorp’s 8-K, a separate filing from the Form S-4. The registration statement, the Form 8-K and all other documents filed with the SEC in connection with the transaction are available for free when filed, both on SEC’s web-site (www.sec.gov) or by contacting Cathy Robinson, Executive Vice President and Chief Financial Officer, Community Bancorp, 400 South 4th Street, Las Vegas, Nevada 89101. Additionally, all forms filed with the SEC and additional shareholder information is available free of charge on Community’s web-site: www.communitybanknv.com. Community posts these reports to its web-site as soon as reasonably practicable after filing them with the SEC. None of the information on or hyper-linked from Community’s web-site is incorporated into this presentation.
3
Key Investment Considerations
One of the largest community banks headquartered in the high growth market of Las Vegas
Consistent, high performing institution
Five year CAGR of assets and net income of 26% and 15% respectively
Five year average ROE and ROA of 17.3% and 1.23% respectively
Second quarter 2005 ROE and ROA of 10% and 1.32% respectively
Focus on business lending and relationship banking
Experienced management team with extensive Las Vegas experience
Successful initial public offering in December 2004 – priced above initial filing range and was over 10x oversubscribed
Bellagio
4
Summary of Initial Public Offering
Issuer:
Community Bancorp
NASDAQ Symbol:
CBON
Shares Offered:
1,495,652 Primary
800,000 Secondary
344,348 Over-allotment
2,640,000 Total
Shares Outstanding (6/30/05): 6,754,847
Trading Range Since IPO: $23.00 - $33.00 per Share
Market Capitalization Range: $155 Million to $223 Million
Effective Date: December 10, 2004
Use of Proceeds: Expansion in the Greater Las Vegas Area, potential acquisitions and general corporate purposes
Lead Manager: Keefe, Bruyette & Woods, Inc.
Co-Manager: D.A. Davidson & Co.
Commercial Construction
5
Company Overview
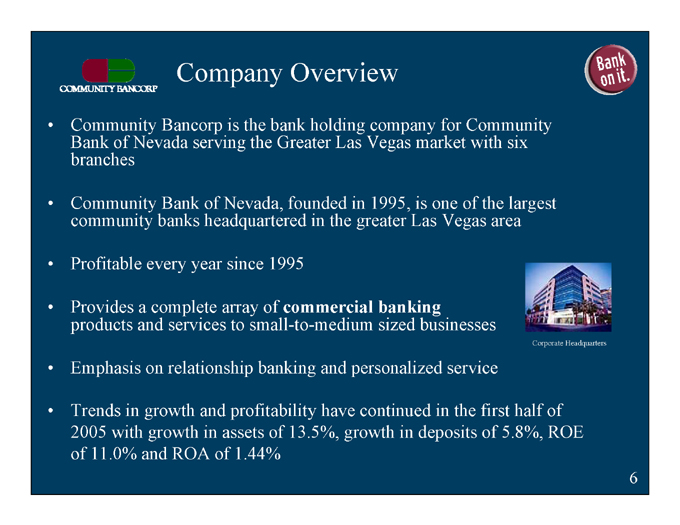
Community Bancorp is the bank holding company for Community Bank of Nevada serving the Greater Las Vegas market with six branches
Community Bank of Nevada, founded in 1995, is one of the largest community banks headquartered in the greater Las Vegas area
Profitable every year since 1995
Provides a complete array of commercial banking products and services to small-to-medium sized businesses
Emphasis on relationship banking and personalized service
Trends in growth and profitability have continued in the first half of 2005 with growth in assets of 13.5%, growth in deposits of 5.8%, ROE of 11.0% and ROA of 1.44%
Corporate Headquarters
6

Community Bancorp/Bank of Commerce
On May 19, 2005 Community Bancorp announced the signing of a definitive agreement to acquire all of the common stock and equivalents of Henderson, NV based Bank of Commerce for approximately $40.0 million in cash and stock. On July 15, 2005 the Federal Reserve Bank of San Francisco approved the acquisition.
Shareholders of Bank of Commerce will have the option to receive cash, shares of Community Bancorp common stock, or a combination subject to an aggregate consideration limit of 50% stock and 50% cash.
The acquisition has been approved by the Board of Directors of each company and is expected to be accretive to Community Bancorp’s earnings per share in 2005 and 2006.
Under the consummation of the transaction, Bank of Commerce will be merged into Community Bank of Nevada under the holding company, Community Bancorp.
7
Community Bancorp/Bank of Commerce
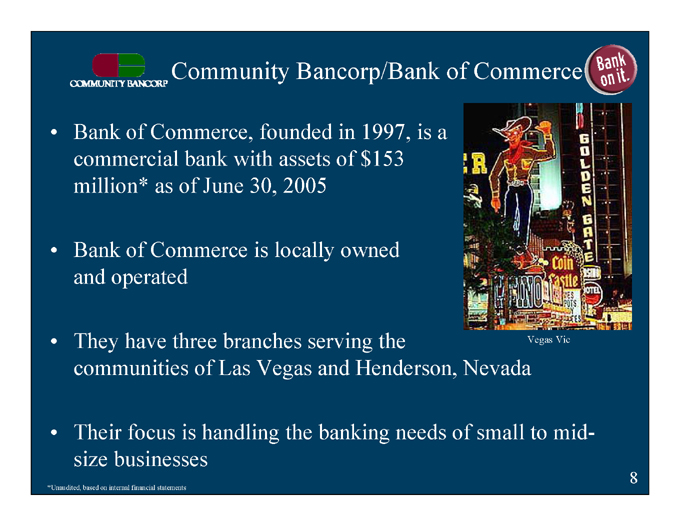
Bank of Commerce, founded in 1997, is a commercial bank with assets of $153 million* as of June 30, 2005
Bank of Commerce is locally owned and operated
They have three branches serving the communities of Las Vegas and Henderson, Nevada
Their focus is handling the banking needs of small to mid-size businesses
Vegas Vic
*Unaudited, based on internal financial statements
8
Branch Locations & Market Area
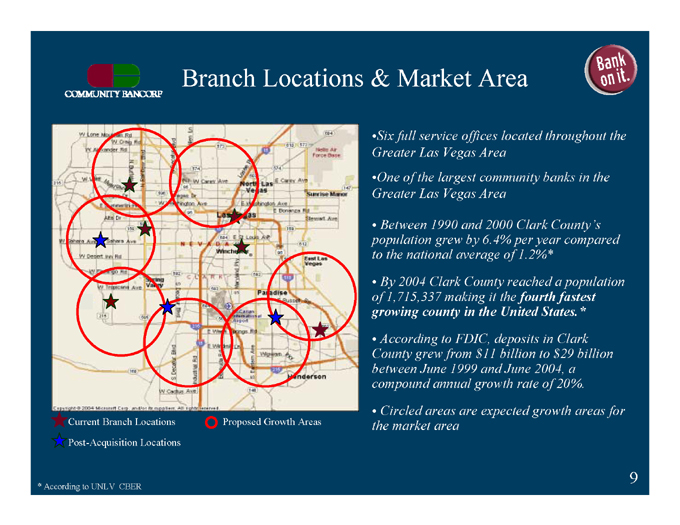
Six full service offices located throughout the Greater Las Vegas Area
One of the largest community banks in the Greater Las Vegas Area
Between 1990 and 2000 Clark County’s population grew by 6.4% per year compared to the national average of 1.2%*
By 2004 Clark County reached a population of 1,715,337 making it the fourth fastest growing county in the United States.*
According to FDIC, deposits in Clark County grew from $11 billion to $29 billion between June 1999 and June 2004, a compound annual growth rate of 20%.
Circled areas are expected growth areas for the market area
Current Branch Locations Proposed Growth Areas
Post-Acquisition Locations
* According to UNLV CBER
W Lone Mountain Rd W Craig Rd W Alexander Rd N Buffalo W Lake Meed Blvd Vegas Dr E Summerlin Pky Alta Dr W Sahara Ave W Sahara Ave W Desert Inn Rd W Flamingo Rd W Tropicana Ave N Rainbow Blvd N Decatur Blvd Allen Ln Losee Rd W Carey Ave Vegas Dr W Washington Ave Spring Valley S Decatur Blvd S Decatur Blvd Industrial Rd W Cactus Ave Nellis Air Force Base E Carey Ave North Las Vegas Sunrise Manor E Washington Ave E Bonanza Rd Las vegas Stewart Ave E St Louis Ave NEVADA Winchester CLARK clark East Las Vegas S Maryland Pky Paradise E Russell Rd Mc Carran International Airport E Warm Springs Rd E Windmill Ln Wigwam Pky Bermuda Rd S Eastern Ave Henderson Copyright ©2004 Microsoft Corp. and/or its suppliers. All rights reserved.
9

Deposit Market Share
COUNTY: Clark, Nevada
Rank Institution Type Branch Count Total Deposits in Market ($000) Total Market Share (%)
1 Citigroup Inc. (NY) Bank 13 6,663,054 23.36
2 Bank of America Corp. (NC) Bank 48 5,986,101 20.98
3 Wells Fargo & Co. (CA) Bank 67 4,797,414 16.82
4 Zions Bancorp (UT) Bank 48 1,926,091 6.75
5 Western Alliance Bancorp (NV) Bank 5 1,251,452 4.39
6 U.S. Bancorp (MN) Bank 33 1,240,783 4.35
7 Washington Mutual Inc. (WA) Thrift 28 950,744 3.33
8 Marshall & Ilsley Corp. (WI) Bank 1 941,842 2.95
9 Community Bancorp (NV) Bank 6 530,258 1.86
10 First NB Holding Company (AZ) Bank 5 518,029 1.82
11 Silver State Bancorp (NV) Bank 9 493,839 1.73
12 Golden West Financial (CA) Thrift 2 429,565 1.51
13 Capitol Bancorp Ltd. (MI) Bank 4 286,358 1.00
14 Intermountain First Bancorp (NV) Bank 1 285,288 1.00
15 Irwin Financial Corp. (IN) Bank 0 254,828 0.89
16 Colonial BancGroup Inc. (AL) Bank 7 208,915 0.73
17 Sun West Capital Corp. (NV) Bank 3 202,303 0.71
18 Central Financial Corp. (KS) Bank 3 187,123 0.66
19 Business Bank Corporation (NV) Bank 3 185,572 0.65
20 BNP Paribas Group Bank 7 184,996 0.65
21 Valley Bancorp (NV) Bank 2 160,950 0.56
22 United Svcs Automobile Assn. (TX Thrift 1 159,908 0.56
23 Marin National Bancorp (NV) Bank 1 128,864 0.45
24 Bank of Commerce (NV) Bank 3 121,438 0.43
25 West Point Bancorp Inc. (NE) Bank 1 106,429 0.37
All other Institutions 12 423,564 2
Total 313 28,625,708 100
One of the largest community banks based in Las Vegas
Bank of Commerce
Source: SNL Securities at 6/30/04
10
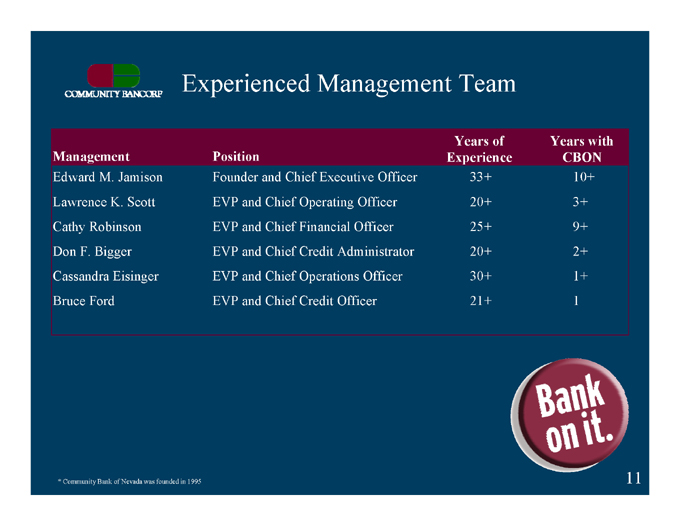
Experienced Management Team
Years of Experience
Years with CBON
Management
Position
33+
20+
25+
20+
30+
21+
Founder and Chief Executive Officer
EVP and Chief Operating Officer
EVP and Chief Financial Officer
EVP and Chief Credit Administrator
EVP and Chief Operations Officer
EVP and Chief Credit Officer
Edward M. Jamison
Lawrence K. Scott
Cathy Robinson
Don F. Bigger
Cassandra Eisinger
Bruce Ford
10+
3+
9+
2+
1+
1
* Community Bank of Nevada was founded in 1995
11
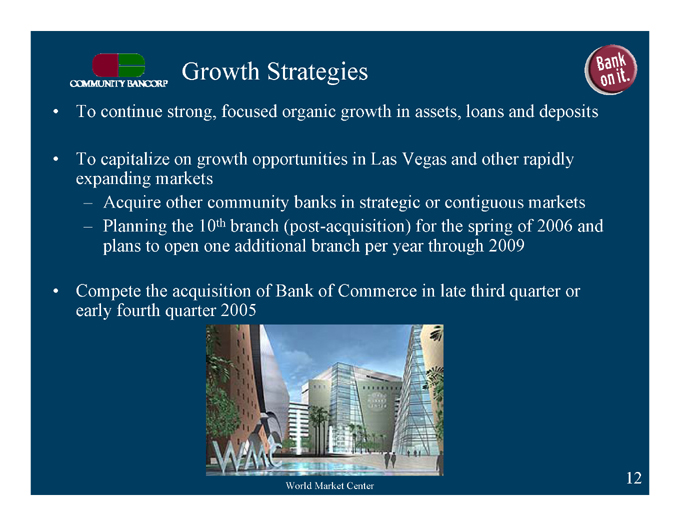
Growth Strategies
To continue strong, focused organic growth in assets, loans and deposits
To capitalize on growth opportunities in Las Vegas and other rapidly expanding markets
Acquire other community banks in strategic or contiguous markets
Planning the 10th branch (post-acquisition) for the spring of 2006 and plans to open one additional branch per year through 2009
Compete the acquisition of Bank of Commerce in late third quarter or early fourth quarter 2005
World Market Center
12
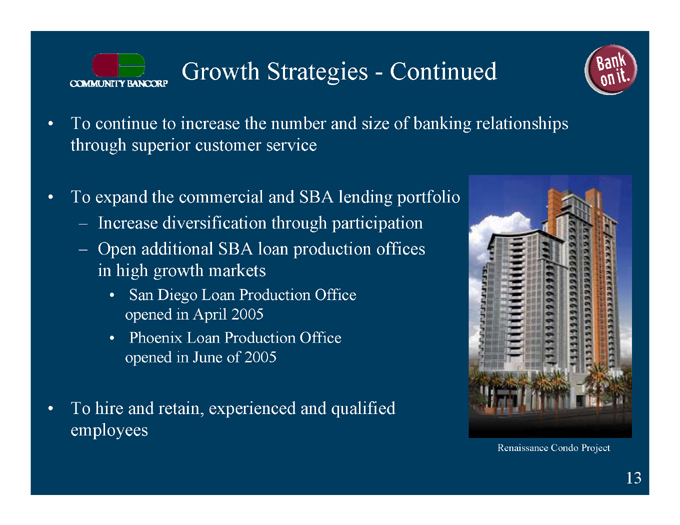
Growth Strategies - Continued
To continue to increase the number and size of banking relationships through superior customer service
To expand the commercial and SBA lending portfolio
Increase diversification through participation
Open additional SBA loan production offices in high growth markets
San Diego Loan Production Office opened in April 2005
Phoenix Loan Production Office opened in June of 2005
To hire and retain, experienced and qualified employees
Renaissance Condo Project
13
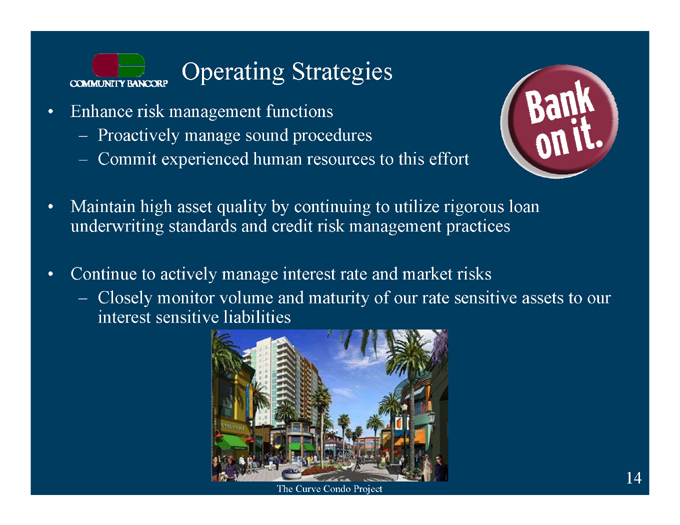
Operating Strategies
Enhance risk management functions
Proactively manage sound procedures
Commit experienced human resources to this effort
Maintain high asset quality by continuing to utilize rigorous loan underwriting standards and credit risk management practices
Continue to actively manage interest rate and market risks
Closely monitor volume and maturity of our rate sensitive assets to our interest sensitive liabilities
The Curve Condo Project
14
FINANCIAL PERFORMANCE
15
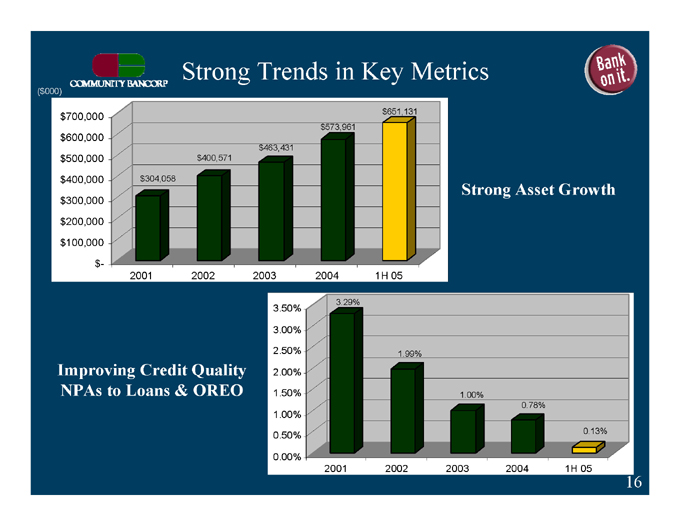
Strong Trends in Key Metrics
($000)
$651,131
$700,000
$573,961
$600,000
$463,431
$500,000
$400,571
$304,058
Strong Asset Growth
$400,000
$300,000
$200,000
$100,000
$-
1H 05
2004
2003
2002
2001
3.29%
3.50%
3.00%
1.99%
2.50%
Improving Credit Quality NPAs to Loans & OREO
2.00%
1.50%
1.00%
0.78%
1.00%
0.13%
0.50%
0.00%
2004
2003
2002
2001
1H 05
16
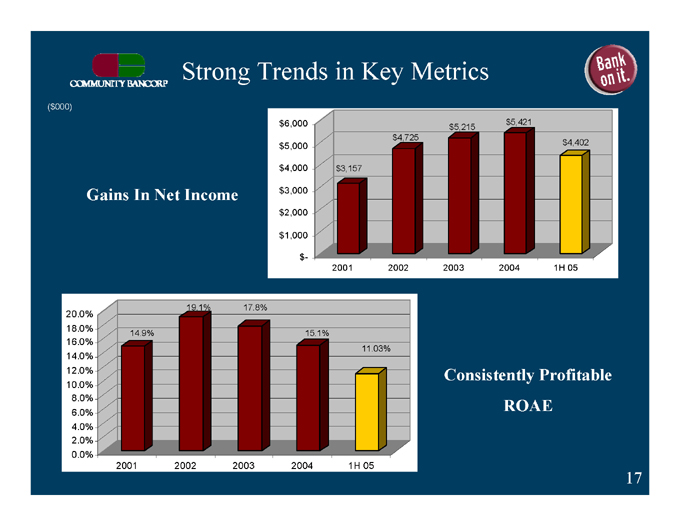
Strong Trends in Key Metrics
($000)
Gains In Net Income
$5,421
$5,215
$6,000
$4,725
$4,402
$5,000
$3,157
$4,000
$3,000
$2,000
$1,000
$-
2004
2003
2002
2001
1H 05
19.1%
17.8%
20.0%
18.0%
14.9%
15.1%
11.03%
16.0%
14.0%
Consistently Profitable
ROAE
12.0%
10.0%
8.0%
6.0%
4.0%
2.0%
0.0%
2004
2003
2002
2001
1H 05
17
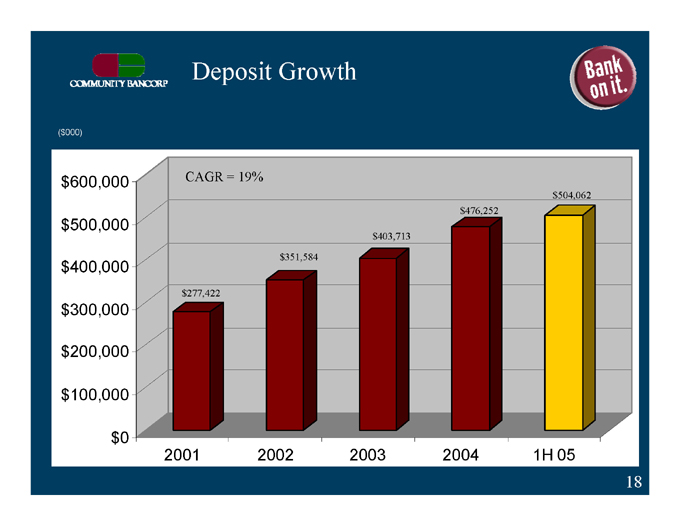
Deposit Growth
($000)
CAGR = 19%
$600,000
$504,062
$476,252
$500,000
$403,713
$351,584
$400,000
$277,422
$300,000
$200,000
$100,000
$0
2004
2003
2002
2001
1H 05
18
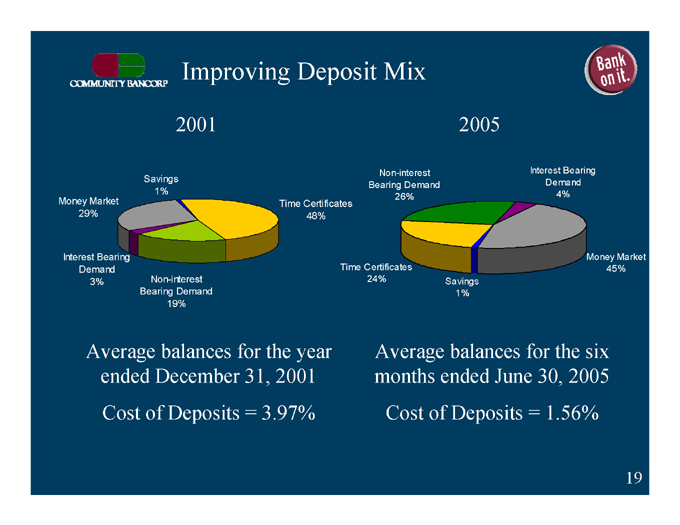
Improving Deposit Mix
2001
2005
Interest Bearing
Savings
Non-interest
Bearing Demand
Demand
4%
26%
1%
Time Certificates
Money Market
29%
48%
Money Market
Interest Bearing
45%
Demand
Time Certificates
Non-interest
Savings
3%
24%
1%
Bearing Demand
19%
Average balances for the year ended December 31, 2001
Cost of Deposits = 3.97%
Average balances for the six months ended June 30, 2005
Cost of Deposits = 1.56%
19
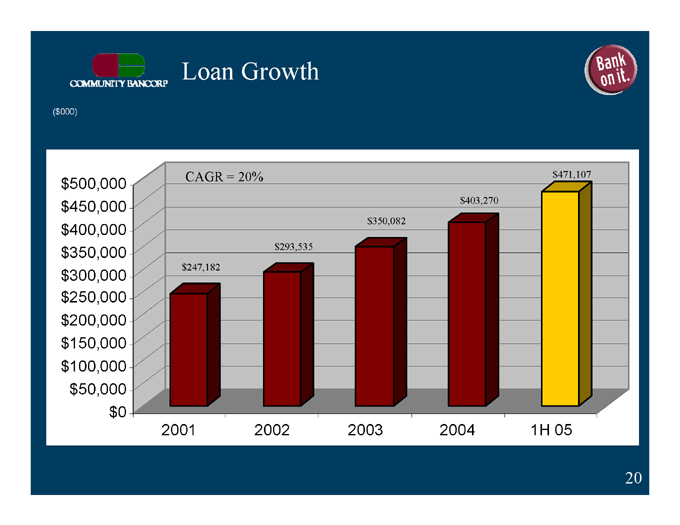
Loan Growth
($000)
$471,107
CAGR = 20%
$500,000
$403,270
$450,000
$350,082
$400,000
$293,535
$350,000
$247,182
$300,000
$250,000
$200,000
$150,000
$100,000
$50,000
$0
2004
2003
2002
2001
1H 05
20
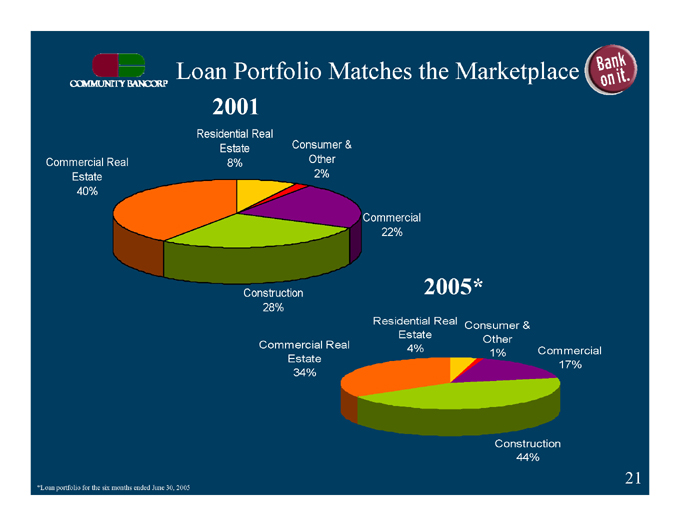
Loan Portfolio Matches the Marketplace
2001
Residential Real
Estate
Consumer &
Commercial Real
8%
Other
Estate
2%
40%
Commercial
22%
2005*
Construction
28%
Consumer &
Residential Real
Other
Estate
4%
Commercial
Commercial Real
Estate
1%
17%
34%
Construction
44%
*Loan portfolio for the six months ended June 30, 2005
21
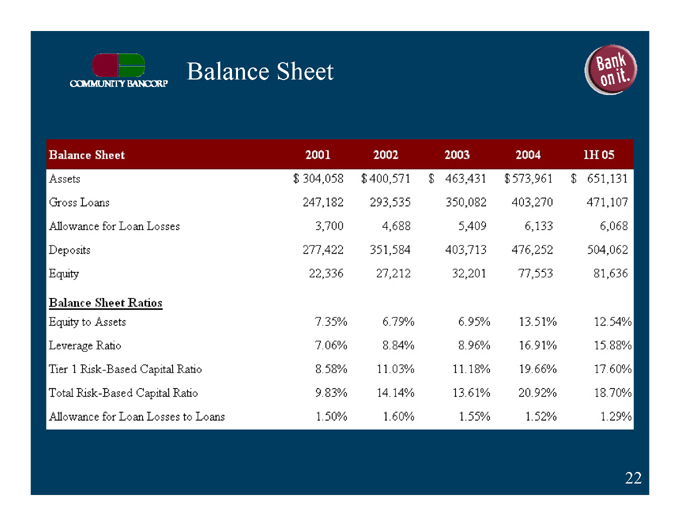
Balance Sheet
Balance Sheet 2001 2002 2003 2004 1H05
Assets $ 304,058 $400,571 $463,431 $573,961 $651,131
Gross Loans 247,182 293,535 350,082 403,270 471,107
Allowance for Loan Losses 3,700 4,688 5,409 6,133 6,068
Deposits 277,422 351,584 403,713 476,252 504,062
Equity 22,336 27,212 32,201 77,553 81,636
Balance Sheet Ratios
Equity to Assets 7.35% 6.79% 6.95% 13.51% 12.54%
Leverage Ratio 7.06% 8.84% 8.96% 16.91% 15.88%
Tier 1 Risk-Based Capital Ratio 8.58% 11.03% 11.18% 19.66% 17.60%
Total Risk-Based Capital Ratio 9.83% 14.14% 13.61% 20.92% 18.70%
Allowance for Loan Losses to Loans 1.50% 1.60% 1.55% 1.52% 1.29%
22
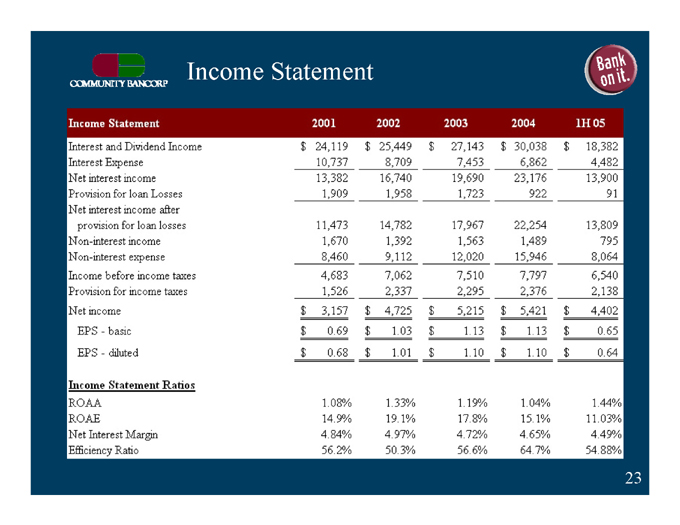
Income Statement
Income Statement 2001 2002 2003 2004 1H05
Interest and Dividend Income $24,119 $25,449 $27,143 $30,038 $18,382
Interest Expense 10,737 8,709 7,453 6,862 4,482
Net interest income 13,382 16,740 19,690 23,176 13,900
Provision for loan Losses 1,909 1,958 1,723 922 91
Net interest income after provision for loan losses 11,473 14,782 17,967 22,254 13,809
Non-interest income 1,670 1,392 1,563 1,489 795
Non-interest expense 8,460 9,112 12,020 15,946 8,064
Income before income taxes 4,683 7,062 7,510 7,797 6,540
Provision for income taxes 1,526 2,337 2,295 2,376 2,138
Net income $3,157 $4,725 $5,215 $5,421 $4,402
EPS - basic $0.69 $1.03 $1.13 $1.13 $0.65
EPS - diluted $0.68 $1.01 $1.10 $1.10 $0.64
Income Statement Ratios
ROAA 1.08% 1.33% 1.19% 1.04% 1.44%
ROAE 14.9% 19.1% 17.8% 15.1% 11.03%
Net Interest Margin 4.84% 4.97% 4.72% 4.65% 4.49%
Efficiency Ratio 56.2% 50.3% 56.6% 64.7% 54.88%
23
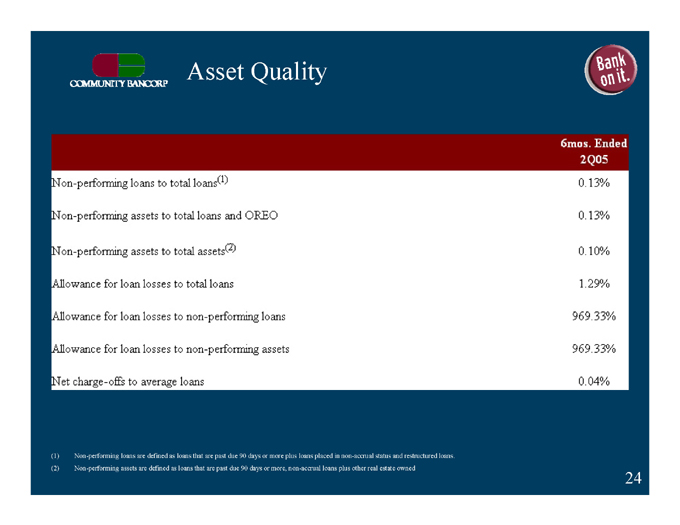
Asset Quality
6mos. Ended 2Q05
Non-performing loans to total loans(1)
Non-performing assets to total loans and OREO
Non-performing assets to total assets(2)
Allowance for loan losses to total loans
Allowance for loan losses to non-performing loans
Allowance for loan losses to non-performing assets
Net charge-offs to average loans
0.13%
0.13%
0.10%
1.29%
969.33%
969.33%
0.04%
(1) Non-performing loans are defined as loans that are past due 90 days or more plus loans placed in non-accrual status and restructured loans.
(2) Non-performing assets are defined as loans that are past due 90 days or more, non-accrual loans plus other real estate owned.
24
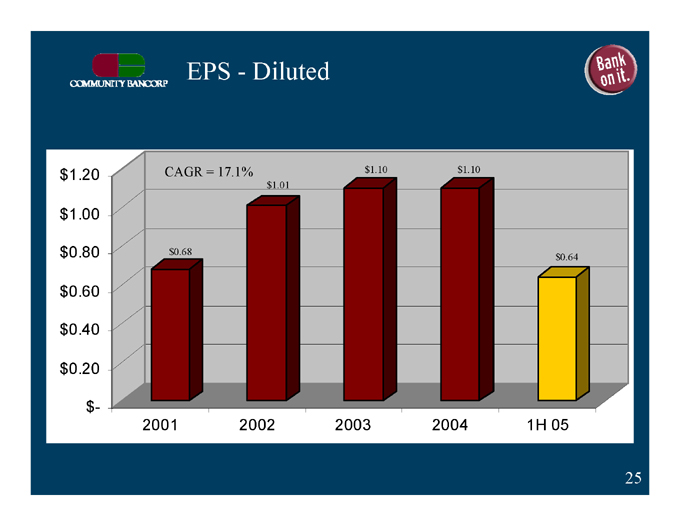
EPS - Diluted
$1.10
CAGR = 17.1%
$1.10
$1.01
$0.64
$0.68
$1.20
$1.00
$0.80
$0.60
$0.40
$0.20
$-
2004
2003
2002
2001
1H 05
25
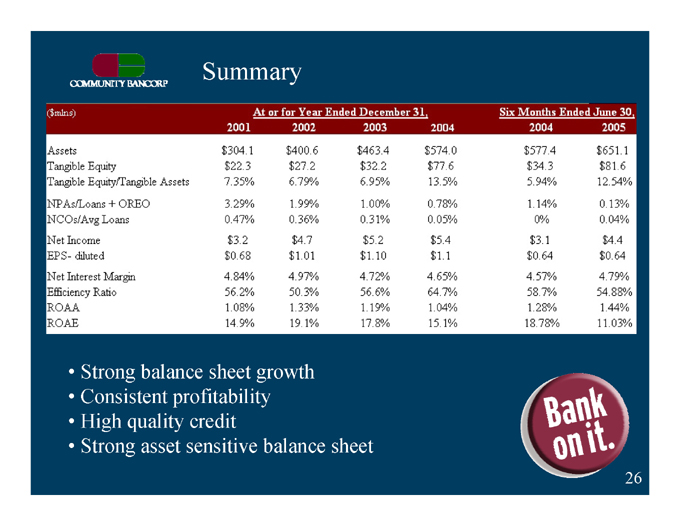
Summary
($mlns) At or for Year Ended December 31, Six Months Ended June 30,
2001 2002 2003 2004 2004 2005
Assets $304.1 $400.6 $463.4 $574.0 $577.4 $651.1
Tangible Equity $22.3 $27.2 $32.2 $77.6 $34.3 $81.6
Tangible Equity/Tangible Assets 7.35% 6.79% 6.95% 13.5% 5.94% 12.54%
NPAs/Loans + OREO 3.29% 1.99% 1.00% 0.78% 1.14% 0.13%
NCOs/Avg Loans 0.47% 0.36% 0.31% 0.05% 0% 0.04%
Net Income $3.2 $4.7 $5.2 $5.4 $3.1 $4.4
EPS - diluted $0.68 $1.01 $1.10 $1.1 $0.64 $0.64
Net Interest Margin 4.84% 4.97% 4.72% 4.65% 4.57% 4.79%
Efficiency Ratio 56.2% 50.3% 56.6% 64.7% 58.7% 54.88%
ROAA 1.08% 1.33% 1.19% 1.04% 1.28% 1.44%
ROAE 14.9% 19.1% 17.8% 15.1% 18.78% 11.03%
Strong balance sheet growth
Consistent profitability
High quality credit
Strong asset sensitive balance sheet
26
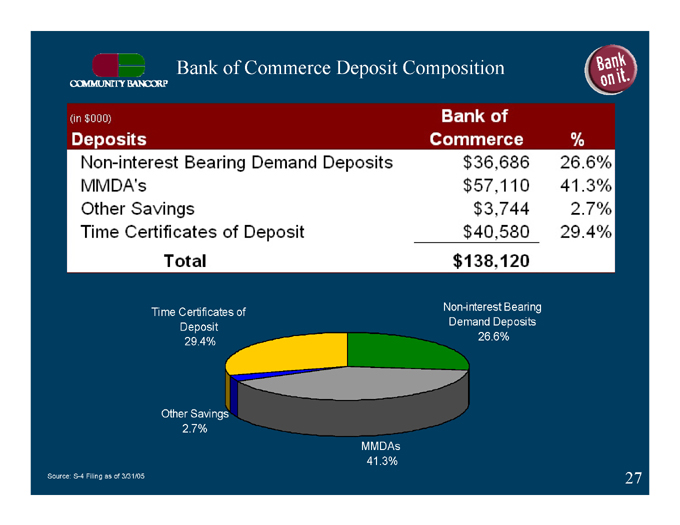
Bank of Commerce Deposit Composition
(in $000)
Deposits Bank of Commerce %
Non-interest Bearing Demand Deposits $36,686 26.6%
MMDA’s $57,110 41.3%
Other Savings $3,744 2.7%
Time Certificates of Deposit $40,580 29.4%
Total $138,120
Time Certificates of
Non-interest Bearing
Deposit
Demand Deposits
29.4%
26.6%
Other Savings
2.7%
MMDAs
41.3%
Source: S-4 Filing as of 3/31/05
27

Bank of Commerce Loan Composition
(in $000) Loans
Construction
Commercial
Real Estate- Commercial
Real Estate- Residential
Consumer & Other
Total
Bank of Commerce
$19,284
$37,847
$54,045
$9,758
$702
$121,636
%
15.9%
31.1%
44.4%
8.0%
0.6%
Consumer & Other
Real Estate- Residential
Construction
8%
16%
1%
Real Estate- Commercial
31%
Commercial
44%
Source: S-4 Filing as of 3/31/05
28
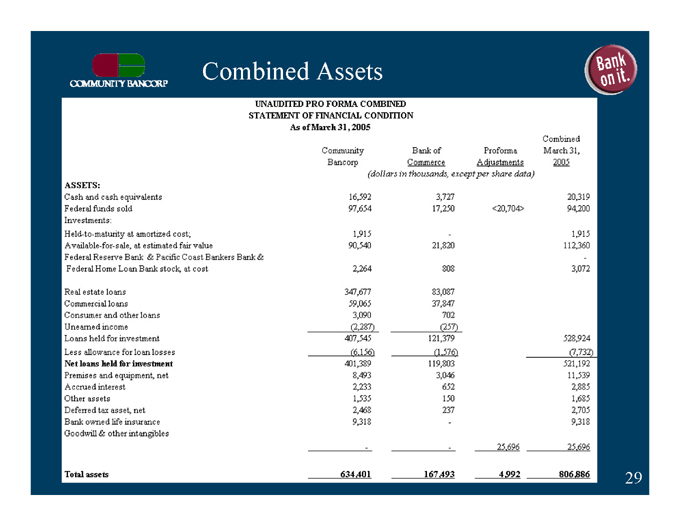
Combined Assets
UNAUDITED PRO FORMA COMBINED
STATEMENT OF FINANCIAL CONDITION
As of March 31, 2005
ASSETS:
Cash and cash equivalents
Federal funds sold
Investments:
Held-to-maturity at amortized cost;
Available-for-sale, at estimated fair value
Federal Reserve Bank & Pacific Coast Bankers Bank & Federal Home Loan Bank stock, at cost
Real estate loans
Commercial loans
Consumer and other loans
Unearned income
Loans held for investment
Less allowance for loan losses
Net loans held for investment
Premises and equipment, net
Accrued interest
Other assets
Deferred tax asset, net
Bank owned life insurance
Goodwill & other intangibles
Total assets
(dollars in thousands, except per share data)
Community Bancorp
16,592
97,654
1,915
90,540
2,264
347,677
59,065
3,090
(2,287)
407,545
(6,156)
401,389
8,493
2,233
1,535
2,468
9,318
-
634,401
Bank of Commerce
3,727
17,250
-
21,820
808
83,087
37,847
702
(257)
121,379
(1,576)
119,803
3,046
652
150
237
-
-
167,493
Proforma Adjustments
<20,704>
25,696
4,992
Combined March 31, 2005
20,319
94,200
1,915
112,360
-
3,072
528,924
(7,732)
521,192
11,539
2,885
1,685
2,705
9,318
25,696
806,886
29
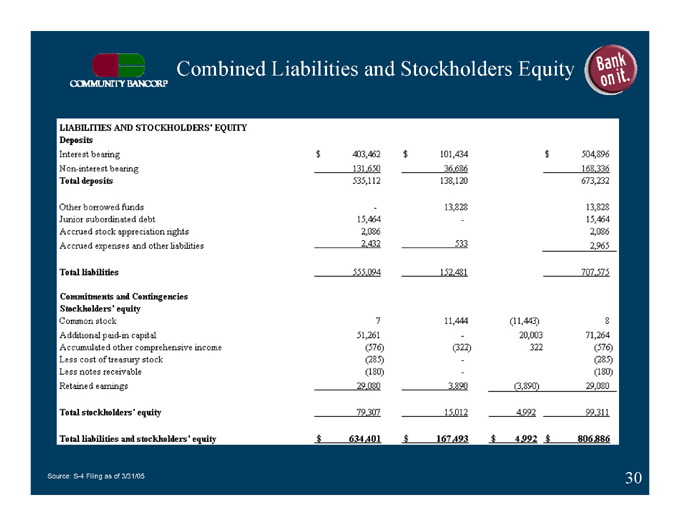
Combined Liabilities and Stockholders Equity
LIABILITIES AND STOCKHOLDERS’ EQUITY
Deposits
Interest bearing $403,462 $101,434 $504,896
Non-interest bearing 131,650 36,686 168,336
Total deposits 535,112 138,120 673,232
Other borrowed funds - 13,828 13,828
Junior subordinated debt 15,464 - 15,464
Accrued stock appreciation rights 2,086 2,086
Accrued expenses and other liabilities 2,432 533 2,965
Total liabilities 555,094 152,481 707,575
Commitments and Contingencies Stockholders’ equity
Common stock 7 11,444 (11,443) 8
Additional paid-in capital 51,261 - 20,003 71,264
Accumulated other comprehensive income (576) (322) 322 (576)
Less cost of treasury stock (285) - (285)
Less notes receivable (180) - (180)
Retained earnings 29,080 3,890 (3,890) 29,080
Total stockholders’ equity 79,307 15,012 4,992 99,311
Total liabilities and stockholders’ equity $634,401 $167,493 $4,992 $806,886
Source: S-4 Filing as of 3/31/05
30
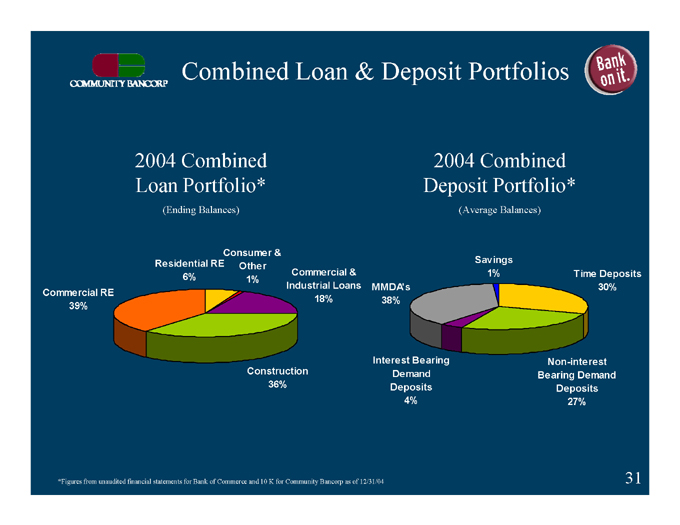
Combined Loan & Deposit Portfolios
2004 Combined Loan Portfolio*
(Ending Balances)
2004 Combined Deposit Portfolio*
(Average Balances)
Consumer &
Residential RE
Other
Savings
1%
Time Deposits
6%
Commercial &
Industrial Loans
1%
30%
Commercial RE
MMDA’s
18%
38%
39%
Non-interest
Interest Bearing
Demand
Bearing Demand
Construction
Deposits
Deposits
36%
27%
4%
*Figures from unaudited financial statements for Bank of Commerce and 10 K for Community Bancorp as of 12/31/04
31
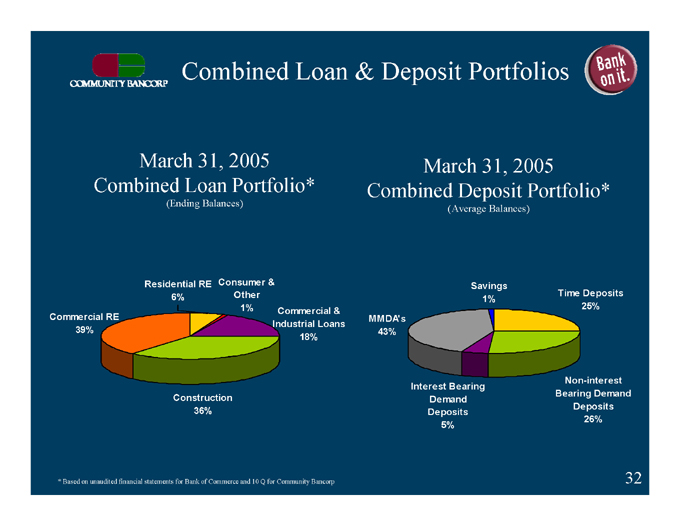
Combined Loan & Deposit Portfolios
March 31, 2005
Combined Deposit Portfolio*
(Average Balances)
March 31, 2005
Combined Loan Portfolio*
(Ending Balances)
Consumer &
Residential RE
Savings
Other
6%
1%
Time Deposits
1%
Commercial &
25%
Commercial RE
MMDA’s
39%
Industrial Loans
18%
43%
Interest Bearing
Non-interest
Construction
Demand
Bearing Demand
36%
Deposits
Deposits
5%
26%
* Based on unaudited financial statements for Bank of Commerce and 10 Q for Community Bancorp
32
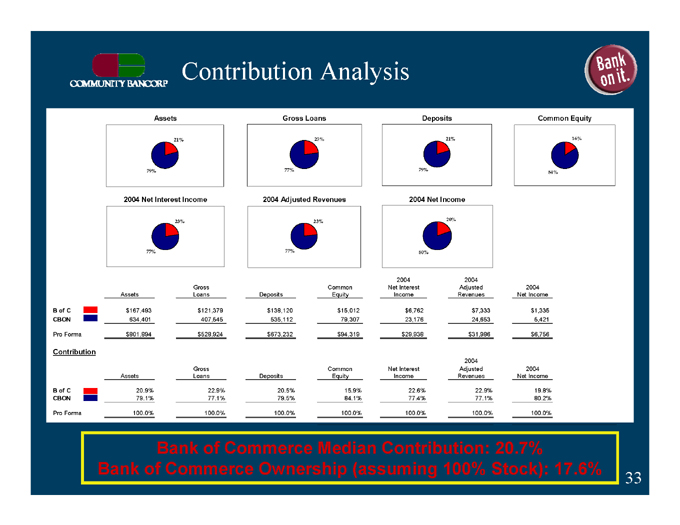
Contribution Analysis
Common Equity
Deposits
Gross Loans
Assets
21%
23%
21%
16%
77%
79%
84%
79%
2004 Net Income
2004 Adjusted Revenues
2004 Net Interest Income
23%
23%
20%
77%
80%
77%
Assets
Gross Loans
Deposits
Common Equity
2004 Net Interest Income
2004 Adjusted Revenues
2004 Net Income
B of C
$1,335
$7,333
$6,762
$15,012
$138,120
$121,379
$167,493
CBON
5,421
24,653
23,176
79,307
535,112
407,545
634,401
Pro Forma
$6,756
$31,986
$29,938
$94,319
$673,232
$528,924
$801,894
Contribution
Assets
Gross Loans
Deposits
Common Equity
2004 Net Interest Income
2004 Adjusted Revenues
2004 Net Income
19.8%
22.9%
22.6%
15.9%
20.5%
22.9%
20.9%
B of C
80.2%
77.1%
77.4%
84.1%
79.5%
77.1%
79.1%
CBON
100.0%
100.0%
100.0%
100.0%
100.0%
100.0%
100.0%
Pro Forma
Bank of Commerce Median Contribution: 20.7%
Bank of Commerce Ownership (assuming 100% Stock): 17.6%
33
Investment Thesis
One of the largest community banks headquartered in the high growth market of Las Vegas
Excellent expansion opportunities in both Las Vegas and other high growth markets
Consistent, high performance institution
Five year CAGR of assets and net income of 26% and 15% respectively
Five year average ROE and ROA of 17.3% and 1.23% respectively
Focus on commercial banking and total client relationships
Experienced management team with over 145 years banking experience in the Greater Las Vegas area
34

INVESTOR PRESENTATION