Exhibit 99.1

INVESTOR PRESENTATION
Forward Looking Information
Certain statements contained in this presentation, including, without limitation, statements containing the words “believes”, “anticipates”, “intends”, and “expects”, and words of similar import, constitute “forward-looking statements” within the meaning of Section 27A of the Securities Act of 1933 and Section 21E of the Securities Exchange Act of 1934. Such forward looking statements involve known and unknown risks, uncertainties and other factors that may cause the actual results, performance or achievements of the Company to be materially different from any future results, performance or achievements expressed or implied by such forward-looking statements. Such factors include, among others, the following: general economic and business conditions in those areas in which the Company operates, demographic changes, competition, fluctuations in interest rates, changes in business strategy or development plans, changes in governmental regulation, credit quality, the availability of capital to fund the expansion of the Company’s business, and other factors referenced in this presentation. The Company disclaims any obligation to update any such factors or to publicly announce the results of any revisions to any of the forward-looking statements contained herein to reflect future events or developments.
Key Investment Considerations
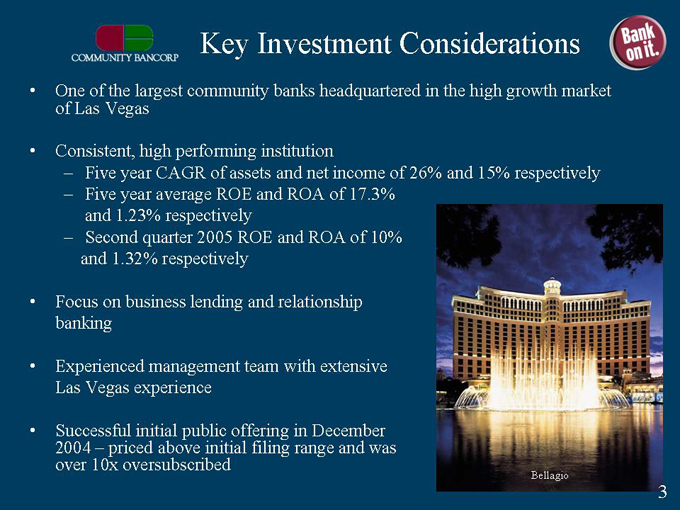
One of the largest community banks headquartered in the high growth market of Las Vegas
Consistent, high performing institution
Five year CAGR of assets and net income of 26% and 15% respectively
Five year average ROE and ROA of 17.3%
and 1.23% respectively
Second quarter 2005 ROE and ROA of 10%
and 1.32% respectively
Focus on business lending and relationship
banking
Experienced management team with extensive
Las Vegas experience
Successful initial public offering in December 2004 – priced above initial filing range and was over 10x oversubscribed
Stock Summary
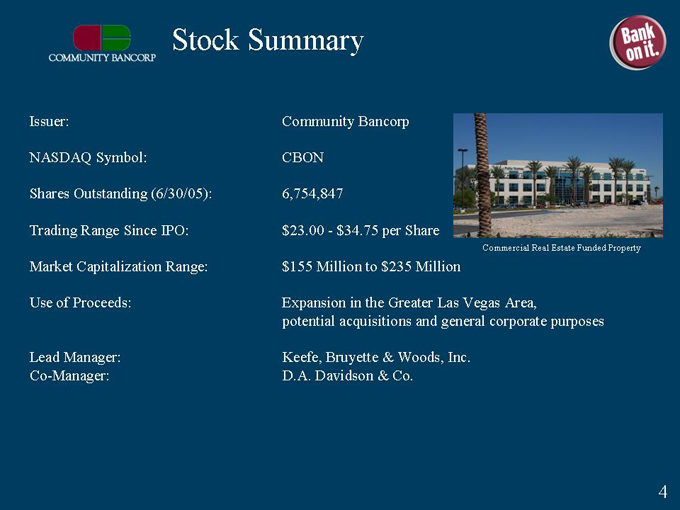
Issuer: Community Bancorp
NASDAQ Symbol: CBON
Shares Outstanding (6/30/05): 6,754,847
Trading Range Since IPO: $23.00—$34.75 per Share
Market Capitalization Range: $155 Million to $235 Million
Use of Proceeds: Expansion in the Greater Las Vegas Area, potential acquisitions and general corporate purposes
Lead Manager: Keefe, Bruyette & Woods, Inc.
Co-Manager: D.A. Davidson & Co.

Company Overview
Community Bancorp is the bank holding company for Community Bank of Nevada serving the Greater Las Vegas market with nine branches
Community Bank of Nevada, founded in 1995, is one of the largest community banks headquartered in the greater Las Vegas area
Profitable every year since 1995
Provides a complete array of commercial banking products and services to small-to-medium sized businesses
Emphasis on relationship banking and personalized service
Trends in growth and profitability have continued in the first half of 2005 with growth in assets of 13.5%, growth in deposits of 5.8%, ROE of 11.0% and ROA of 1.44%
On August 26, 2005 closed the acquisition of Bank of Commerce for approximately $40.0 million in 50 % cash and 50% stock. Acquisition closed 99 days after the signing of definitive agreement.
Branch Locations & Market Area
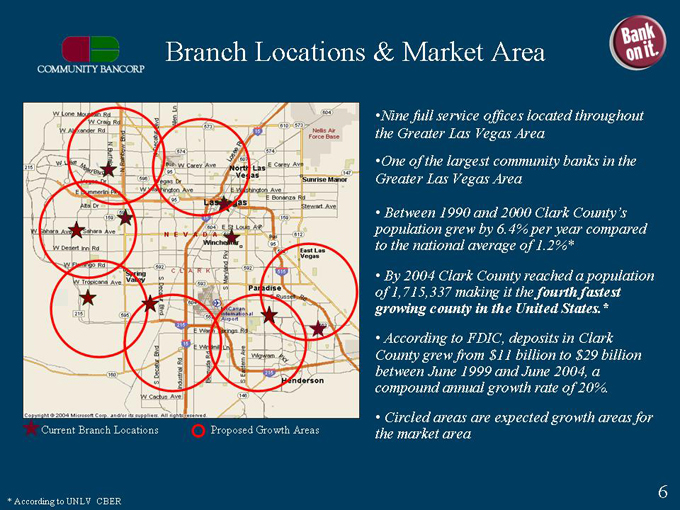
Nine full service offices located throughout the Greater Las Vegas Area
One of the largest community banks in the Greater Las Vegas Area
Between 1990 and 2000 Clark County’s population grew by 6.4% per year compared to the national average of 1.2%*
By 2004 Clark County reached a population of 1,715,337 making it the fourth fastest growing county in the United States.*
According to FDIC, deposits in Clark County grew from $11 billion to $29 billion between June 1999 and June 2004, a compound annual growth rate of 20%.
Circled areas are expected growth areas for the market area
Current Branch Locations
Proposed Growth Areas

Deposit Market Share
One of the largest community banks based in Las Vegas
Source: SNL Securities at 6/30/04 (includes Bank of Commerce deposits)
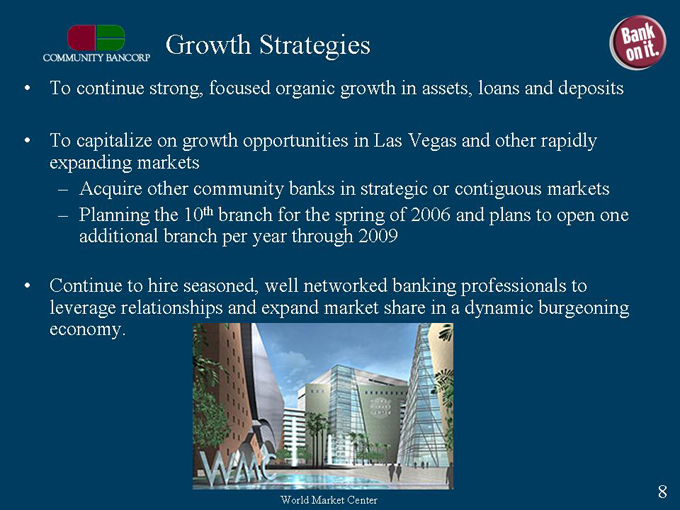
Growth Strategies
To continue strong, focused organic growth in assets, loans and deposits
To capitalize on growth opportunities in Las Vegas and other rapidly expanding markets
Acquire other community banks in strategic or contiguous markets
Planning the 10th branch for the spring of 2006 and plans to open one additional branch per year through 2009
Continue to hire seasoned, well networked banking professionals to leverage relationships and expand market share in a dynamic burgeoning economy.
World Market Center
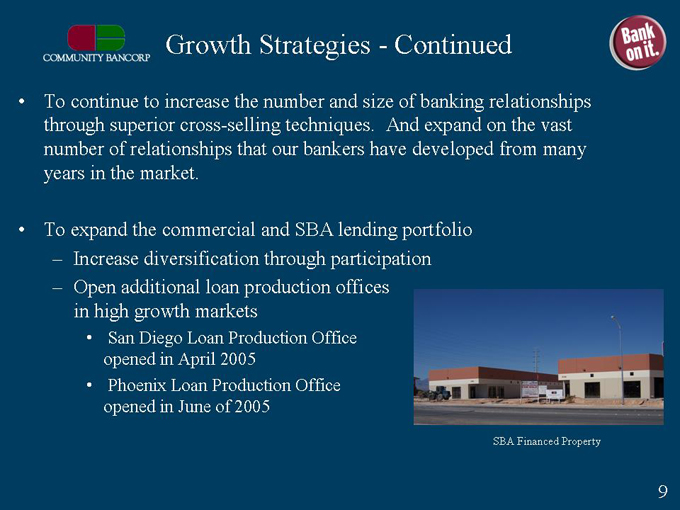
Growth Strategies – Continued
To continue to increase the number and size of banking relationships through superior cross-selling techniques. And expand on the vast number of relationships that our bankers have developed from many years in the market.
To expand the commercial and SBA lending portfolio
Increase diversification through participation
Open additional loan production offices in high growth markets
San Diego Loan Production Office opened in April 2005
Phoenix Loan Production Office opened in June of 2005
9
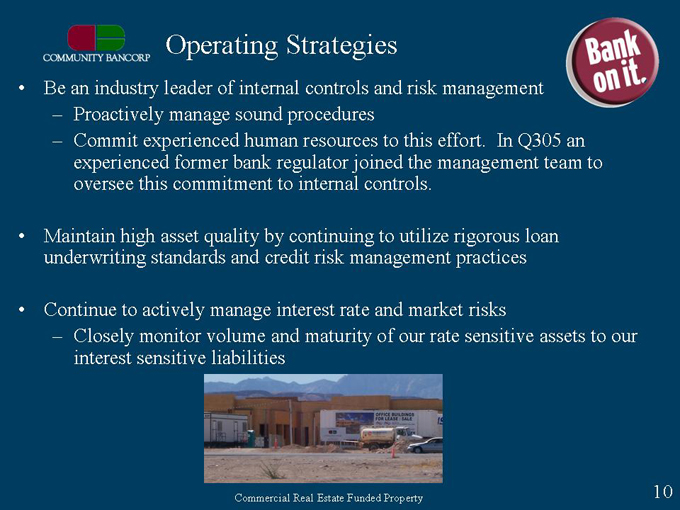
Operating Strategies
Be an industry leader of internal controls and risk management
Proactively manage sound procedures
Commit experienced human resources to this effort. In Q305 an experienced former bank regulator joined the management team to oversee this commitment to internal controls.
Maintain high asset quality by continuing to utilize rigorous loan underwriting standards and credit risk management practices
Continue to actively manage interest rate and market risks
Closely monitor volume and maturity of our rate sensitive assets to our interest sensitive liabilities
Commercial Real Estate Funded Property
10
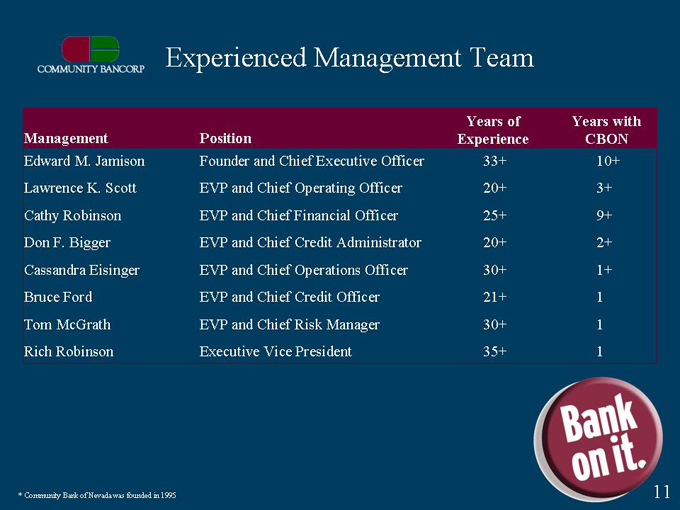
Experienced Management Team
Management
Edward M. Jamison
Lawrence K. Scott
Cathy Robinson
Don F. Bigger
Cassandra Eisinger
Bruce Ford
Tom McGrath
Rich Robinson
Position
Founder and Chief Executive Officer
EVP and Chief Operating Officer
EVP and Chief Financial Officer
EVP and Chief Credit Administrator
EVP and Chief Operations Officer
EVP and Chief Credit Officer
EVP and Chief Risk Manager
Executive Vice President
Years of Experience
33+
20+
25+
20+
30+
21+
30+
35+
Years with CBON
10+
3+
9+
2+
1+
* Community Bank of Nevada was founded in 1995
11
COMMUNITY BANCORP
FINANCIAL PERFORMANCE
12
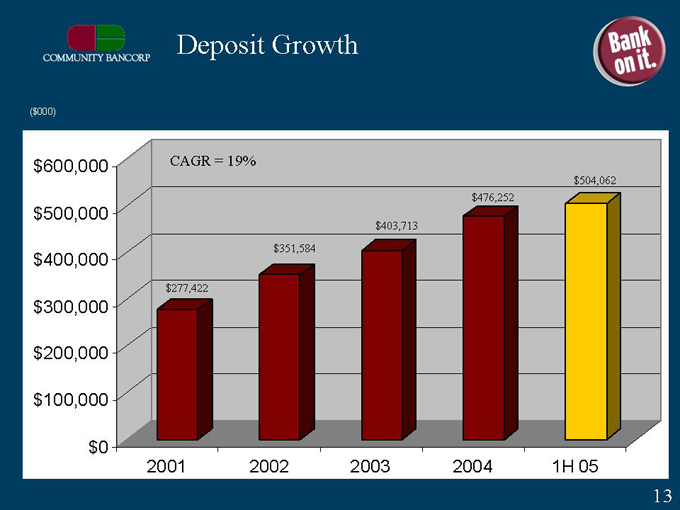
Deposit Growth
($000)
CAGR = 19%
$600,000
$500,000
$400,000
$300,000
$200,000
$100,000
$0
$277,422
$351,584
$403,713
$476,252
$504,062
2001 2002 2003 2004 1H 5
13
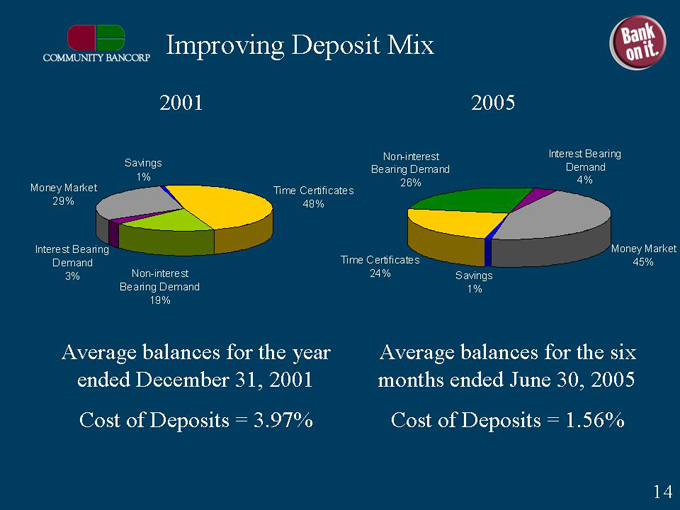
Improving Deposit Mix
2001 2005
Saving 1%
Money Market 29%
Interest Bearing Demand 3%
Non-interest Bearing Demand 19%
Time Certificates 48%
Saving 1%
Money Market 45%
Interest Bearing Demand 4%
Non-interest Bearing Demand 26%
Time Certificates 24%
Average balances for the year ended December 31, 2001
Cost of Deposits = 3.97%
Average balances for the six months ended June 30, 2005
Cost of Deposits = 1.56%
14
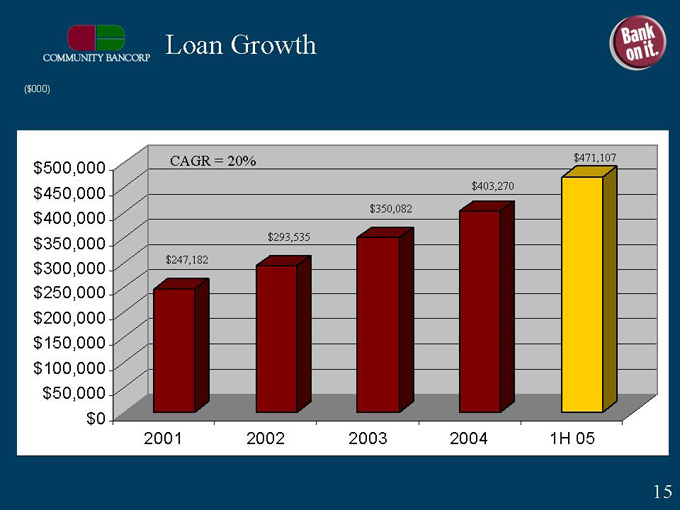
Loan Growth
($000)
CAGR = 20%
$247,182
$293,535
$350,082
$403,270
$471,107
$500,000
$450,000
$400,000
$350,000
$300,000
$250,000
$150,000
$100,000
$50,000
$0
2001 2002 2003 2004 1H 05
15
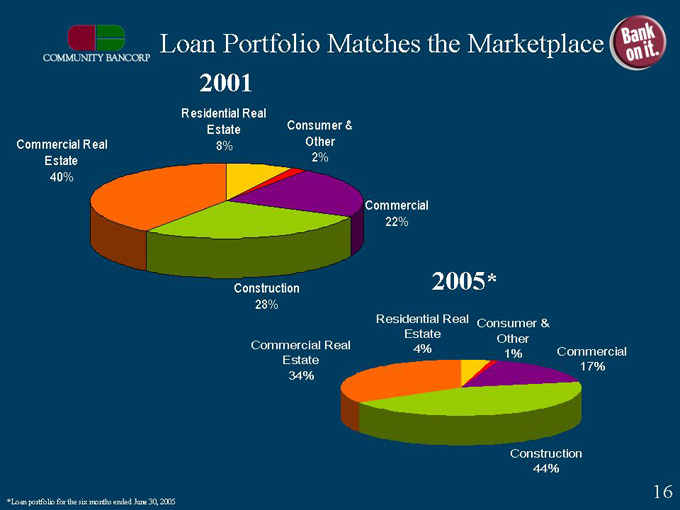
Loan Portfolio Matches the Marketplace
2001
Commercial Real Estate 40%
Residential Real Estate 8%
Consumer & Other 2%
Commercial 22%
Construction 28%
2005*
Commercial Real Estate 34%
Residential Real Estate 4%
Consumer & Other 1%
Commercial 17%
Construction 44%
*Loan portfolio for the six months ended June 30, 2005
16
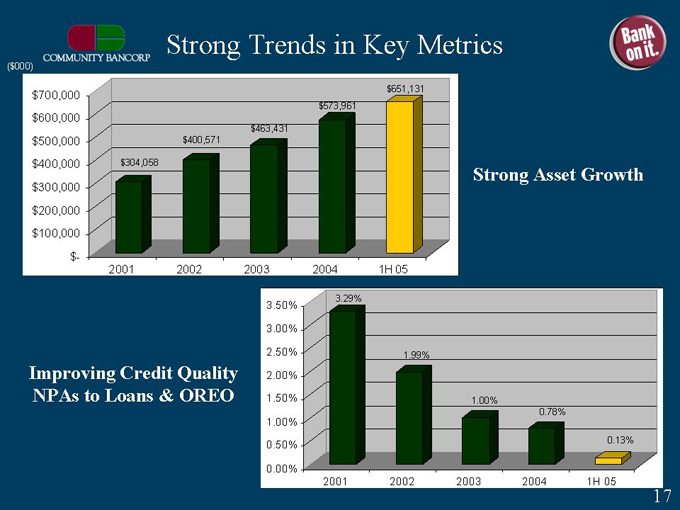
Strong Trends in Key Metrics
($000)
$304,058
$400,571
$463,431
$573,961
$651,131
$700,000
$600,000
$500,000
$400,000
$300,000
$200,000
$100,000
$-
2001 2002 2003 2004 1H 05
Improving Credit Quality NPAs to Loans & OREO
3.29%
1.99%
1.00%
0.78%
0.13%
3.50%
3.00%
2.50%
2.00%
2.00%
1.50%
1.00%
0.50%
0.00%
2001 2002 2003 2004 IH 05
17
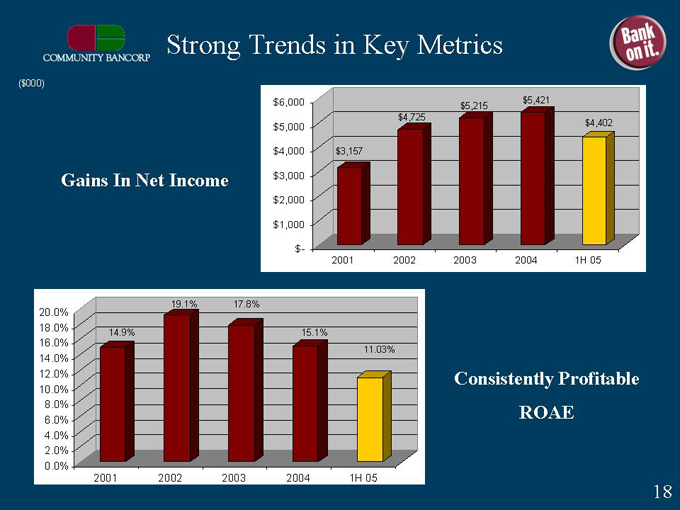
Strong Trends in Key Metrics
($000)
Gains In Net Income
$3,157
$4,725
$5,215
$5,421
$4,402
$6,000
$5,000
$4,000
$3,000
$2,000
$1,000
$-
2001 2002 2003 2004 IH 05
Consistently Profitable ROAE
14.9%
19.1%
17.8%
15.1%
11.03%
20.0%
18.0%
16.0%
14.0%
12.0%
10.0%
8.0%
6.0%
4.0%
2.0%
0.0%
2001 2002 2003 2003 2004 IH 05
18
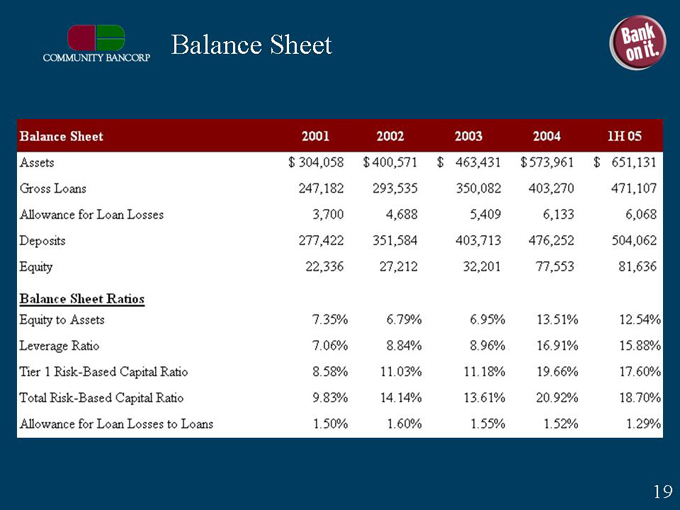
Balance Sheet
19
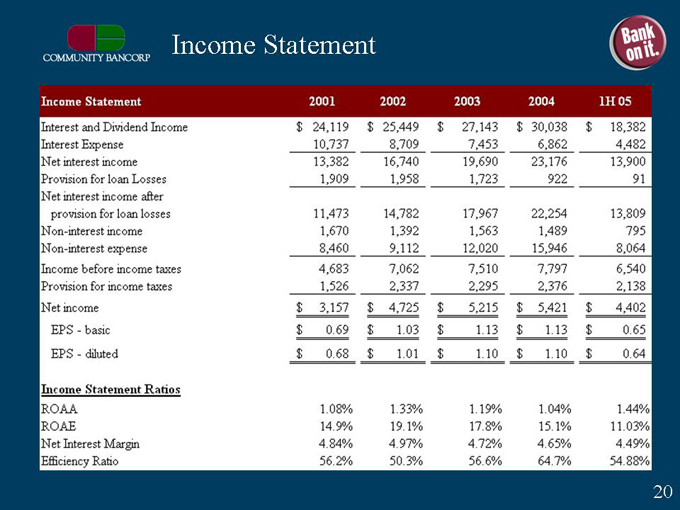
Income Statement
20
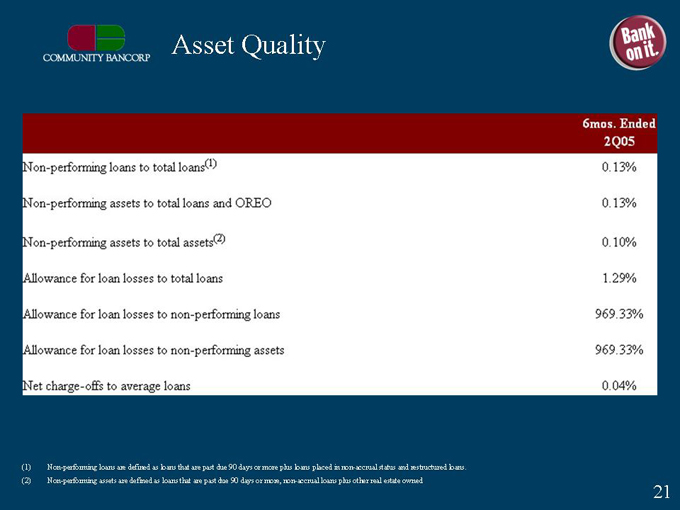
Asset Quality
Non-performing loans are defined as loans that are past due 90 days or more plus loans placed in non-accrual status and restructured loans.
Non-performing assets are defined as loans that are past due 90 days or more, non-accrual loans plus other real estate owned.
21
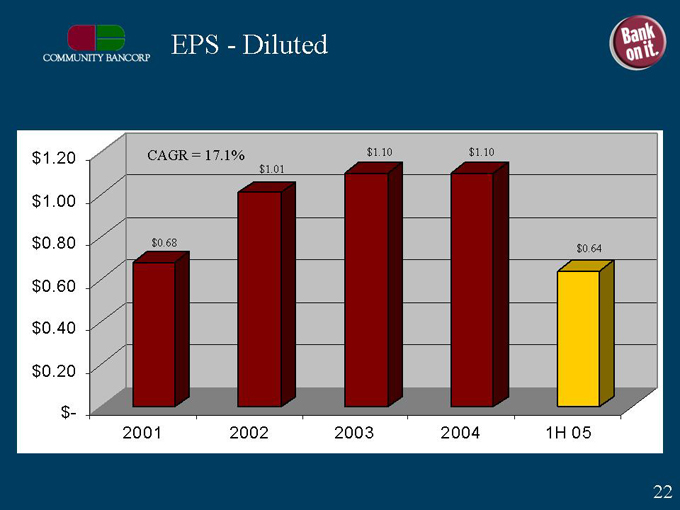
EPS—Diluted
CAGR = 17.1%
$0.68
$1.01
$1.10
$1.10
$0.64
$1.20
$1.00
$0.80
$0.60
$0.40
$0.20
$-
2001 2002 2003 2004 IH 05
22
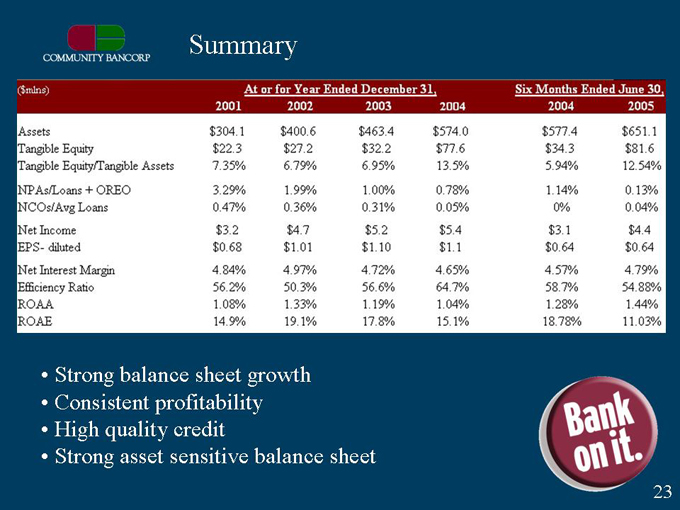
Summary
Strong balance sheet growth
Consistent profitability
High quality credit
Strong asset sensitive balance sheet
23
Investment Thesis
One of the largest community banks headquartered in the high growth market of Las Vegas
Excellent expansion opportunities in both Las Vegas and other high growth markets
Consistent, high performance institution
Five year CAGR of assets and net income of 26% and 15% respectively
Five year average ROE and ROA of 17.3% and 1.23% respectively
Focus on commercial banking and total client relationships
Experienced management team with over 210 years banking experience in the Greater Las Vegas area
24

INVESTOR PRESENTATION