Bob Currey – Chief Executive Officer
Steve Childers – Chief Financial Officer
Steve Jones – Vice President, Investor Relations
April 2008
1
Safe Harbor
2

Company Overview
12th largest Independent Local Exchange Carrier in the U.S., with
operations in Illinois, Texas and Pennsylvania
Approximately 282,028 ILEC access lines, 68,874 CLEC access line equivalents,
83,521 DSL subscribers and 12,241 IPTV subscribers, representing 446,664 total
connections
Providing voice, video and data services
Triple play offerings in both Texas and Illinois, and coming soon in Pennsylvania
Full year 2007 CNSL financial overview:
Revenues of $329.2 million
Adjusted EBITDA of $143.8 million
$82.1 million in cash from operations
Dividend payout ratio of 75.9%
Full year 2007 NPSI financial overview:
Revenues of $95.7 million
Adjusted EBITDA of $43.2 million
$9.8 million in cash from operations
3
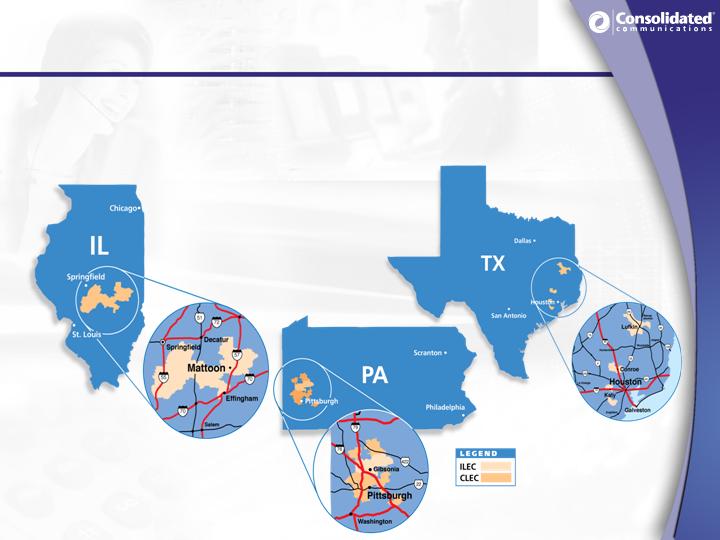
Operations in Illinois, Texas and
Pennsylvania
ILEC markets are a balance of both rural and
suburban markets
4

Marketing, customer service and technology initiatives have been
designed to minimize competitive traction
This approach will be leveraged in Pennsylvania
Cable operators - Mediacom and Nu Wave in Illinois, Comcast and
Suddenlink in Texas, and Armstrong and Comcast in Pennsylvania
Mediacom, Armstrong and Comcast in Pennsylvania have launched
voice products in CNSL’s markets
Managing Competition
CNSL’s strategy is to minimize competition from cable and
wireless companies by providing “sticky” bundled service
offerings and exemplary customer service
5

Regulatory Landscape
Rate of return regulated at the federal level in all states
Filed petition for price caps in Illinois and Texas
Will remain an average schedule company in Pennsylvania in 2008
Elected incentive regulation at the state level in Texas & Pennsylvania,
and rate of return in Illinois
Strong working relationships with the FCC and all state commissions
Actively involved in both USF and access charge reform
Favorable Regulatory Environment
6

Experienced & Operations-Focused
Management Team
Executive
Title
Telecom
Experience
Bob Currey
President & CEO
38 Years
Steve Childers
Senior Vice President &
Chief Financial Officer
20 Years
Joe Dively
Senior Vice President
21 Years
Steve Shirar
Senior Vice President
23 Years
Bob Udell
Senior Vice President
20 Years
Chris Young
Chief Information Officer
20 Years
Richard Lumpkin
Chairman
47 Years
CCI Date of
Initial Hire
1990
1986
1991
1996
1993
1985
1963
7
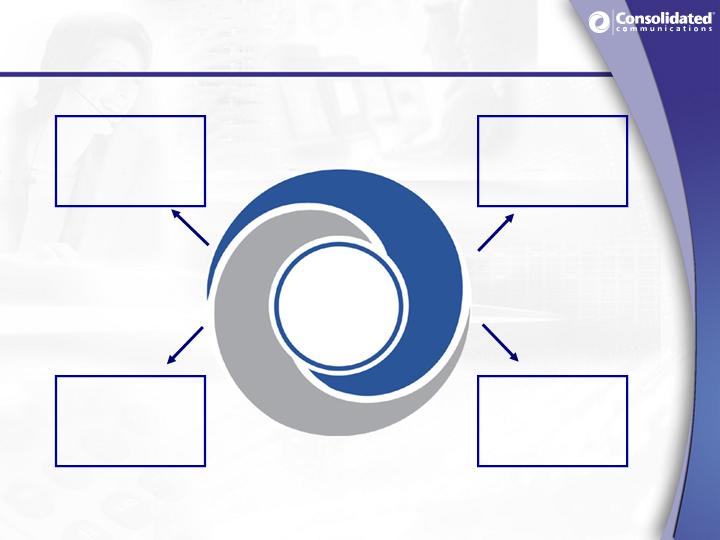
Executing on our Strategy
8
Sustain
and grow
cash flow
Increase
revenue
per customer
Improve
operating
efficiency
Pursue selective
acquisitions
Maintain
effective capital
deployment
8
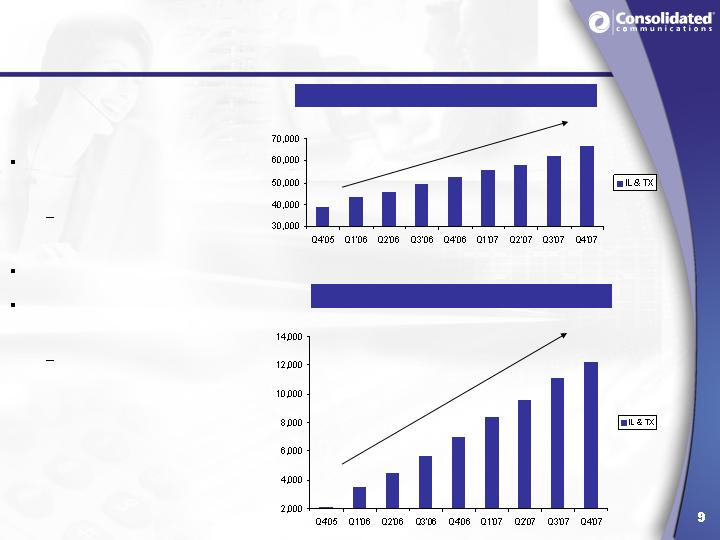
Increase Revenue per Customer
DSL Subscriber Growth
IPTV Subscriber Growth
Attractive, feature rich
broadband offerings
Multiple DSL speeds
and price points
Higher margin products
IPTV enables the Triple
Play offering
Enhances the value of
the bundle and
deepens customer
relationships
9

IPTV Service in Illinois & Texas
A robust offering with over 200 all-digital channels,
premium movie packages and over a 1000 hours of
movies on demand
10

Video Drives Incremental Revenue Per Customer
IPTV enables the Triple Play offering
Incremental Product Rollout
Leverages existing resources and network
IP Backbone/ADSL 2+
Future CapEx is success based
Enhances the value of the bundle and deepens customer
relationships
Currently available in Illinois and Texas
12,241 total video subscribers
HDTV rolled out in Q2 in Texas and Q3 in Illinois
Coming soon: In Q2 2008, IPTV service in PA and DVR in all states
11
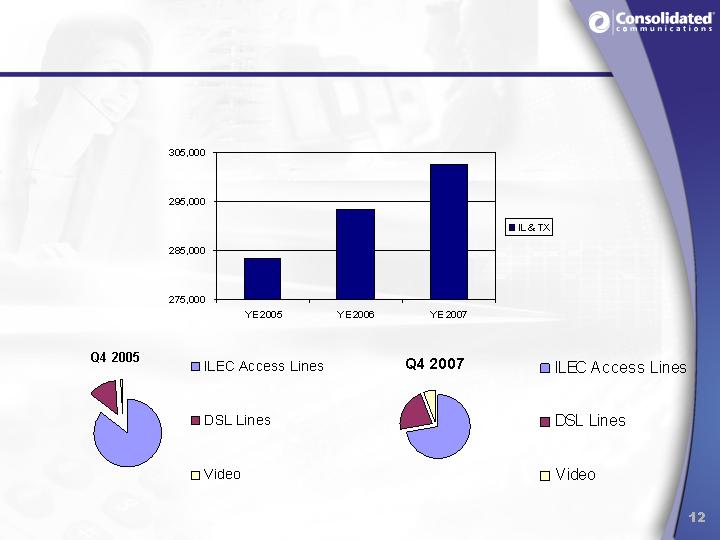
Stable Customer Base
CNSL’s total connections have grown by over 19,000 since
2005 and product mix has changed
12

CLEC Overview
True “edge-out” strategy, which leverages ILEC network, human capital skills
and reputation in the surrounding markets
Cash flow positive due to focus on success-based capital expenditures
Focus on small to mid-sized business customers (5 to 500 lines), educational
institutions and healthcare facilities
Operates an extensive SONET optical network with over 300 route miles of fiber
optic facilities in the Pittsburgh metropolitan market
Focus is on migrating to an on-net, ethernet and VoIP delivery system
13

Disciplined Capital Deployment
Installed television headends in Texas and Illinois and is currently
delivering an all digital video signal over its existing fiber/copper
network
Expect to launch IPTV service in Pennsylvania in Q2 2008, utilizing
Illinois headend
95% of total access lines are DSL-capable in Illinois and Texas, 100%
in Pennsylvania
The networks in all three states support speeds up to 10 megabits
per second, as required by consumer demand
Historically capital spending has run 10% -12% of revenue
CNSL’s advanced network enables it to offer advanced
products and services, which is a key part of its strategy to
retain customers and increase revenue
14

CNSL Acquisition Criteria
Attractiveness of the markets
North Pittsburgh:
High growth, affluent markets
Edge-out CLEC provides synergy with ILEC
Quality of the network
North Pittsburgh:
Well maintained plant
Short loops enable higher broadband speeds and efficient video
overlay
Ability to integrate efficiently
North Pittsburgh:
Leverage existing, proven systems and processes
Potential for operating synergies
North Pittsburgh:
$7-$11 million annually in estimated Op Ex savings
$3-$6 million annually in estimated Cap Ex savings
Cash flow accretive
North Pittsburgh:
Improves dividend payout ratio
15

CNSL Delivering Strong Financial Results…
16
($ in millions)
2005
2006
2007
CNSL
Revenue
321.4
$
320.8
$
329.2
$
Adjusted EBITDA
136.8
$
139.8
$
143.8
$
Cash Provided by Operating Activities
72.5
$
84.6
$
82.1
$
CapEx
31.1
$
33.4
$
33.5
$
Payout Ratio
(1)
68.9%
76.6%
75.9%
NPSI
Revenue
109.8
$
103.5
$
95.7
$
Cash Provided by Operating Activities
32.7
$
13.9
$
9.8
$
Adjusted EBITDA
55.6
$
46.2
$
43.2
$
CapEx
10.5
$
16.0
$
16.7
$
CNSL Balance Sheet
Total Cash and Marketable Securities
31.4
$
26.7
$
34.3
$
Total Debt
555.0
$
594.0
$
893.0
$
Leverage
3.8x
4.1x
4.6x
(1) 2005 reflects the three months ended December 31, 2005 only. 2006 excludes the impact of asset sales.
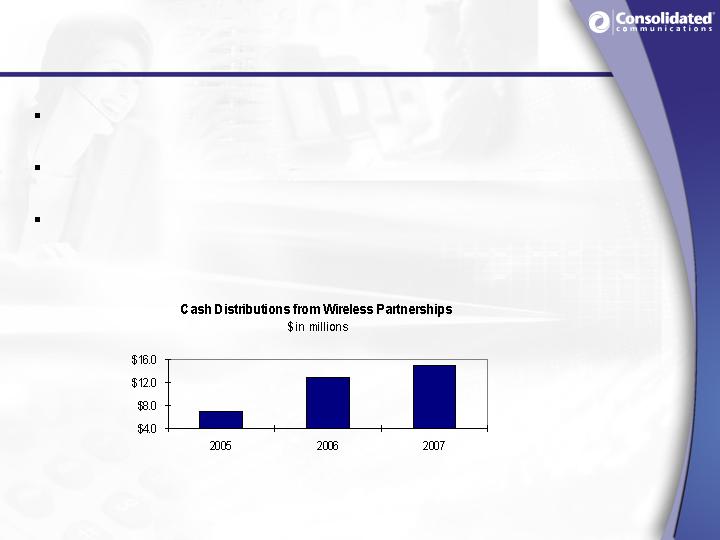
Wireless Partnerships
In addition to its core business, CNSL derives a portion of its cash
flow from five wireless partnerships.
All are managed by Verizon Wireless and overlap with our ILEC and
CLEC markets
All have experienced solid revenue, operating income, cash
distribution and subscriber growth over the past few years
17

Integration Update
Integration efforts well underway
Six major projects being worked
Most will be completed in 2008
Financial system consolidation complete and IPTV launch
scheduled for Q2 2008
Synergy estimates:
Op Ex: $7M in 2008 & $11M in 2009
Cap Ex: $3M in 2008 & $6M in 2009
18
Investment Highlights
Attractive Markets
Stable Local
Telephone Business
Bundled
Service Offerings
Favorable
Regulatory
Environment
Technologically
Advanced Network
Experienced
Management Team
19

Appendix
20
GAAP Reconciliation
21
GAAP Reconciliation (con’t)
22

Adjusted EBITDA Reconciliation
See footnotes on next page
23
($ in millions)
CNSL
2005
2006
2007
Historical EBITDA:
Net cash provided by operating activities
72,475
$
84,593
$
82,069
$
Adjustments:
Pension curtailment gain
7,880
-
-
Compensation from restricted share plan
(8,590)
(2,482)
(4,034)
Other adjustments, net (1)
(19,068)
(8,083)
(3,781)
Changes in operating assets and liabilities
10,220
6,669
2,828
Interest expense, net
53,443
42,899
56,780
Income taxes
10,935
405
4,674
Historical EBITDA (2)
127,295
124,001
138,536
Adjustments to EBITDA (3)
Integration, restructuring and Sarbanes-Oxley (4)
7,400
3,684
1,187
Professional service fees (5)
2,867
-
-
Other, net (6)
(3,036)
(7,143)
(6,567)
Investment distributions (7)
1,590
5,516
6,586
Pension curtailment gain (8)
(7,880)
-
-
Intangible assets impairment (1)
-
11,240
-
Non-cash compensation (9)
8,590
2,482
4,034
Adjusted EBITDA
136,826
$
139,780
$
143,776
$
Year Ended
December 31,
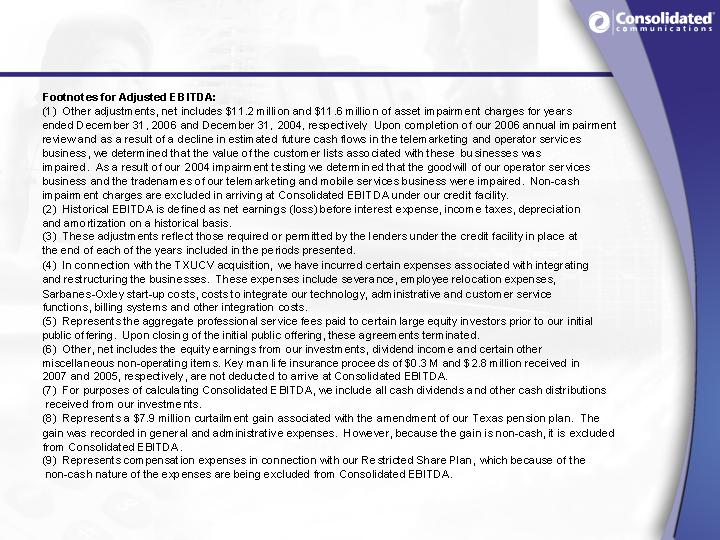
Adjusted EBITDA Reconciliation
24

Adjusted EBITDA Reconciliation
See footnotes on next page
25
($ in millions)
NPSI
2005
2006
2007
Historical EBITDA:
Net cash provided by operating activities
32,723
$
13,863
$
9,771
$
Adjustments:
Curtailment and special termination benefits
-
-
(9,786)
Equity income of affiliated companies
6,001
8,623
9,944
Other adjustments, net
2,695
1,283
89
Changes in operating assets and liabilities
(423)
1,491
6,528
Interest expense, net
182
(1,144)
(1,146)
Income taxes
15,407
22,473
5,352
Historical EBITDA (1)
56,585
46,589
20,752
Adjustments to EBITDA (2)
Merger costs (3)
-
-
5,817
Curtailment expense (4)
-
-
9,786
Other, net (5)
(7,093)
(8,510)
(9,644)
Investment distributions (6)
6,177
8,087
8,972
Change of control, retention, severance and
-
-
-
other merger related payments (7)
-
-
7,482
Adjusted EBITDA
55,669
$
46,166
$
43,165
$
Year Ended
December 31,
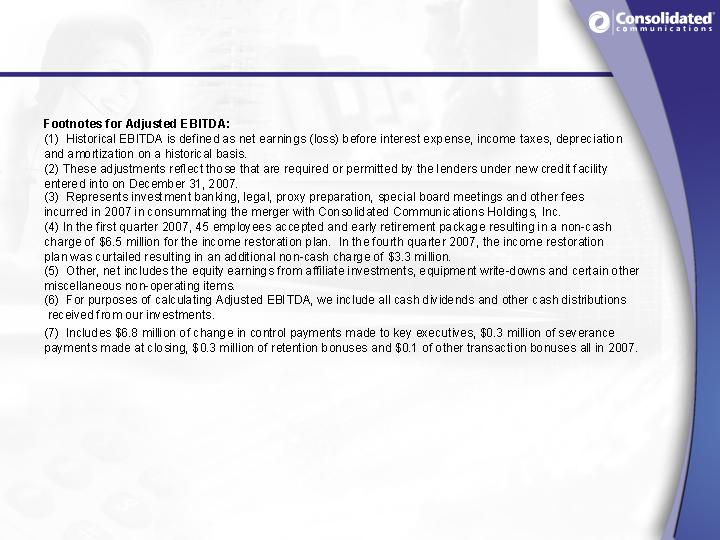
Adjusted EBITDA Reconciliation
26

Cash Available to Pay Dividends
27
($ in millions)
2005
2006
2007
Adjusted EBITDA
35,626
$
139,780
$
143,776
$
- Cash interest expense
(9,384)
(40,613)
(44,222)
- Capital Expenditures
(9,498)
(33,388)
(33,495)
+ Proceeds from asset sales
(1)
-
6,594
-
- Cash income taxes
(172)
(8,237)
(13,976)
+ Cash interest income
174
745
893
��
- Repurchases of stock
(2)
-
(87)
-
Cash available to pay dividends
16,746
$
64,794
$
52,976
$
Quarterly Dividend
11,537
$
44,593
$
40,195
$
Payout Ratio
68.9%
68.8%
75.9%
Adjusted Payout Ratio
(3)
68.9%
76.6%
75.9%
(1) Represents $673 of proceeds from the sale of idle property and $5,921 of proceeds from the redemption of class C
shares of RTB stock.
(2) Represents the cancellation of stock by employees to pay withholding tax on shares vesting under the company's
Long Term Incentive Plan.
(3) Represents the payout ratio excluding the effect of asset sales.
Year Ended December 31,

Total Net Debt to Adjusted EBITDA Ratio
28
($ in millions)
2005
2006
2007
Summary of Outstanding Debt
Senior Notes
130,000
$
130,000
$
130,000
$
Term loan
425,000
464,000
760,000
Capital Leases
-
-
2,646
Total debt as of December 31, 2007
555,000
$
594,000
$
892,646
$
Less cash on hand
(31,409)
(26,672)
(37,297)
Total net debt
523,591
$
567,328
$
855,349
$
Adjusted EBITDA (1)
136,826
$
139,780
$
187,000
$
Total Net Debt to Adjusted EBITDA
3.8
4.1
4.6
(1) Per the new credit facility adjusted EBITDA has been agreed upon for the first three quarters of 2007 at
$138,700 and reflects a combined pro forma number for the fourth quarter 2007. Adjusted EBITDA for the
fourth quarter 2007 is the sum of $11,264 for the Pennsylvania operations and $37,036 for the Illinois and
Texas operations.
Year Ended December 31,