
Bob Currey – Chief Executive Officer
Steve Childers – Chief Financial Officer
May 2009
1
Safe Harbor
2

Company Overview
12th largest Independent Local Exchange Carrier in the U.S., with
operations in Illinois, Texas and Pennsylvania
Approximately 259,787 ILEC access lines, 73,737 CLEC access line equivalents,
94,554 DSL subscribers, 18,207 IPTV subscribers, and 7,141 VOIP subscribers
representing 453,426 total connections
Providing voice, video and data services
Triple play offerings in all markets
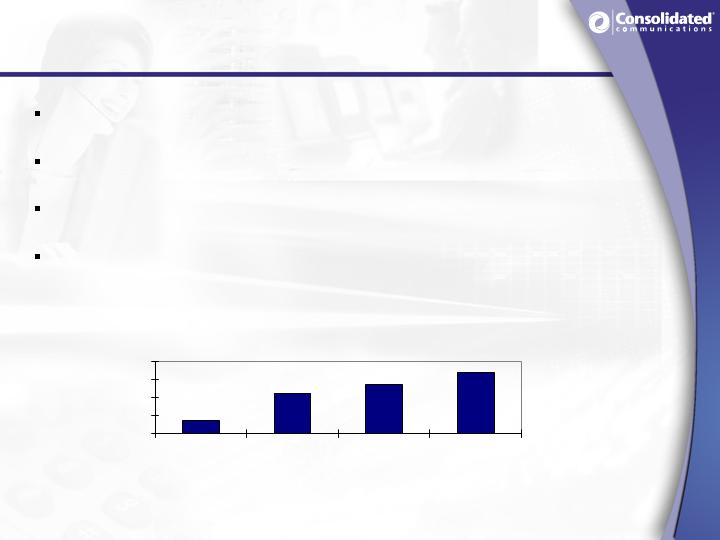
Full Year 2008 CNSL financial overview:
Revenues of $418.4 million
Adjusted EBITDA of $191.3 million, excluding Hurricane Ike recovery exp.
$92.4 million in cash from operations
Dividend payout ratio of 71.6%
First Quarter 2009 CNSL financial overview:
Revenues of $101.7 million
Adjusted EBITDA of $45.3
Dividend payout ratio of 64.3%
3

Well-Established Operating History
1894
1984
2005
1997
2002
2004
CCI was formed and
non-regulated
businesses incorporated
from 1984-1989
CCI acquired
by McLeodUSA
Lumpkin,
Providence and
Spectrum
acquire CCI
Mattoon
Telephone Co.
founded by Dr.
I.A. Lumpkin
CCI acquires
TXUCV and
VOIP deployed in
TX
Consolidated
completes IPO; IPTV
Launch in Illinois
CNSL
acquires
NPSI
2006
IPTV Launch
in TX
2007
2008
IPTV launch
in PA
VOIP
deployed in IL
4

Consistent Organic and Acquisition Growth
2002 – New Consolidated created after acquisition from McLeod.
2004 – Tripled the size of the company with TXU acquisition.
2005 – Initial Public Offering.
2007 – Completed acquisition of North Pittsburgh Systems, Inc.
$191.3M
$418.4M
2008
$45.3M
$101.7M
Q1 2009
$143.8M
$329.2M
2007
$139.8M
$136.8M
$123.3M
$45.7M
Adj.
EBITDA
$320.8M
$321.4M
$269.6M
$132.3M
Revenue
2006
2005
2004
2003
CNSL
5
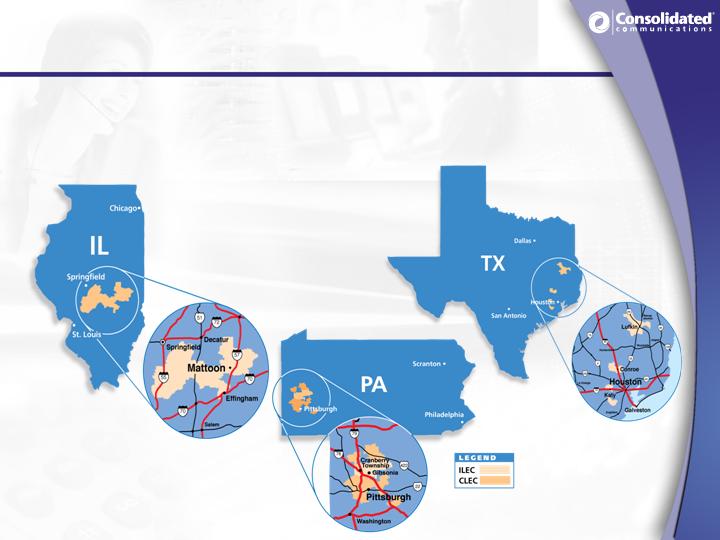
Operations in Illinois, Texas and
Pennsylvania
ILEC markets are a balance of both rural and
suburban markets
6

Texas – A large engineering construction company, KBR, has reported
it will be building a 900,000 square foot facility in our Katy market
centralizing approximately 4,500 employees
Pennsylvania – Westinghouse is consolidating its nuclear division in
Cranberry Woods, which is reported to bring as many as 3,000
employees to our service area
Construction is underway and we are providing services today.
Illinois – Futuregen is near-zero emission coal fired power plant that
has selected Mattoon, IL as site and would produce about 3,000
temporary construction jobs and about 200 full-time positions.
Future depends on Department of Energy’s support of project.
Attractive Markets
Suburban markets continue to expand:
7

Westinghouse – Cranberry, PA
8

Regulatory Landscape
The regulatory environment is stable.
We have very good relations with the FCC and the state Public Utility
Commissions.
We support appropriate intercarrier compensation reform
Have been and continue to be actively involved in broad reform
that will support ongoing investment in rural America
The rules and applications for the Broadband Stimulus are still in
development.
We are actively involved and plan to pursue any opportunity that
helps support expansion and increased speeds.
Regulatory Environment
9

Experienced & Operations-Focused
Management Team
Executive
Title
Telecom
Experience
Bob Currey
President & CEO
39 Years
Steve Childers
Senior Vice President &
Chief Financial Officer
23 Years
Joe Dively
Senior Vice President
23 Years
Steve Shirar
Senior Vice President
27 Years
Bob Udell
Senior Vice President
21 Years
Chris Young
Chief Information Officer
22 Years
Richard Lumpkin
Chairman
48 Years
CCI Date of
Initial Hire
1990
1986
1991
1996
1993
1985
1963
10
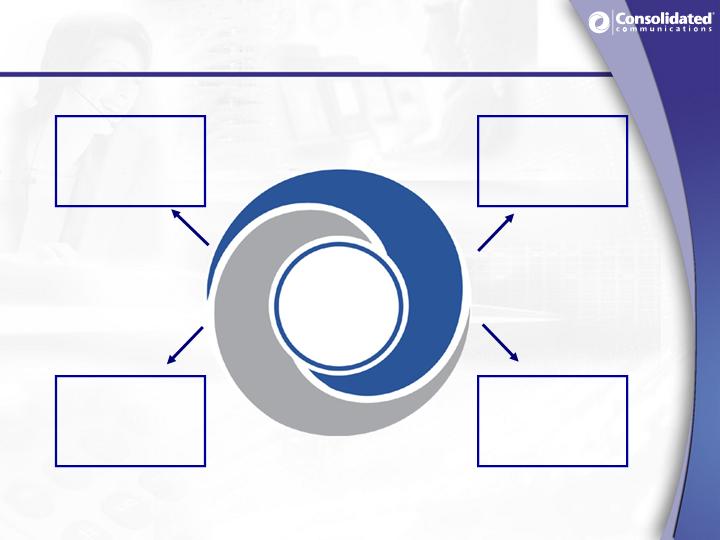
Executing on our Strategy
Sustain
and grow
cash flow
Increase
revenue
per customer
Improve
operating
efficiency
Pursue selective
acquisitions
Maintain
effective capital
deployment
11

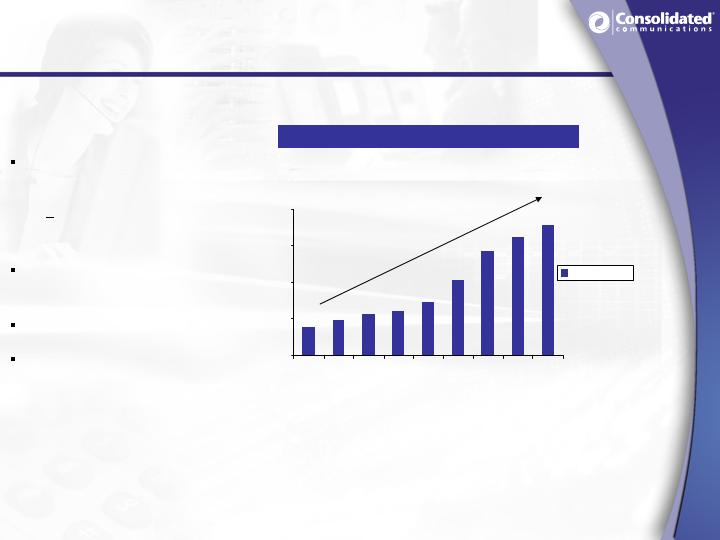
Increase Revenue per Customer
DSL Subscriber Growth
Q1'09
Q4'08
Q2'08
Q4'07
Q2'07
Q4'06
Q2'06
Q4'05
100,000
85,000
70,000
55,000
40,000
IPTV Subscriber Growth
Attractive, feature rich
broadband offerings
Multiple DSL speeds
and price points
Higher margin products
IPTV enables the Triple
Play offering
Enhances the value of
the bundle and
deepens customer
relationships
0
3,000
6,000
9,000
12,000
15,000
18,000
Q4'05
Q2'06
Q4'06
Q2'07
Q4'07
Q2'08
Q4'08
Q1'09
Pro-Forma IL, TX & PA
Pro-Forma IL, TX & PA
12

Broadband Penetration
* Data based on company reports and Wall Street Research
Q109 DSL Penetration
% of ILEC Access Lines
36%
34%
34%
33%
27%
26%
18%
0%
5%
10%
15%
20%
25%
30%
35%
40%
CNSL
WIN
CTL
IWA
FTR
EQ
FRP
13

IPTV Service in all markets
A robust offering with over 200 all-digital channels,
premium movie packages and over a 1000 hours of
movies on demand
14

Video Drives Incremental Revenue Per Customer
IPTV enables the Triple Play offering
Incremental Product Rollout
Leverages existing resources and IP Backbone/ADSL 2+
Future CapEx is success based
Enhances the value of the bundle and deepens customer
relationships
Service available in all markets
18,207 total video subscribers
Approx. 148,000 homes passed
Doubled HD channels in 2008 – will do the same in 2009
Q2 2008, rolled out IPTV service in PA and DVR in all states
15
ILEC VOIP
ILEC VOIP Subscriber Growth
Maintains customer
relationship
Save opportunity for
line disconnection
Provides new customer
opportunities
Triple play bundle.
Competes head-to-head
with cable provider.
0
2,000
4,000
6,000
8,000
Q1'07
Q2'07
Q3'07
Q4'07
Q1'08
Q2'08
Q3'08
Q4'08
Q1'09
IL, TX & PA
16

PA ILEC Access Line Trends
-2.6%
-3.8%
-4.8%
-5.1%
-9.1%
-10.0%
-10.0%
-9.5%
-8.0%
-6.8%
-6.5%
-5.4%
-5.7%
-12.0%
-10.0%
-8.0%
-6.0%
-4.0%
-2.0%
0.0%
Q405
Q106
Q206
Q306
Q406
Q107
Q207
Q307
Q407
Q108
Q208
Q308
Q408
Competition launches
VOIP
CNSL announces
NPSI acquisition
CNSL closes
NPSI acquisition
CNSL launches
IPTV
17

CLEC Overview
True “edge-out” strategy, which leverages ILEC network, human capital skills
and reputation in the surrounding markets
Cash flow positive due to focus on success-based capital expenditures
Focus on small to mid-sized business customers (5 to 500 lines), educational
institutions and healthcare facilities
Operates an extensive SONET optical network with over 300 route miles of fiber
optic facilities in the Pittsburgh metropolitan market
Focus is on migrating to an on-net, ethernet and VoIP delivery system
18

Disciplined Capital Deployment
IP platform supports triple play, increased data speeds and new
products
Delivering an all digital video signal over existing fiber/copper network
96% of total access lines are DSL-capable in Illinois and Texas, 100%
in Pennsylvania
Technology investments, which enable operating expense reductions
Historically capital spending has run 10% -12% of revenue
2009 Cap ex Guidance is $42 million to $43 million
Cap ex focused on enhancing revenue, service quality and
efficiency gains
19

CNSL Acquisition Criteria
Attractiveness of the markets
North Pittsburgh:
High growth, affluent markets
Edge-out CLEC provides synergy with ILEC
Wireless partnerships overlap with ILEC and CLEC markets
Quality of the network
North Pittsburgh:
Well maintained plant
Short loops enable higher broadband speeds and efficient video overlay
Ability to integrate efficiently
North Pittsburgh:
Leverage existing, proven systems and processes
Potential for operating synergies
North Pittsburgh:
$7-$11 million annually in estimated Op Ex savings
$3-$6 million annually in estimated Cap Ex savings
Cash flow accretive
North Pittsburgh:
Improves dividend payout ratio
20

PA Integration Update
Integration efforts ahead of schedule and synergies.
Exceeded 2008 synergies Opex synergies by 10%.
Ahead of plan for 2009 synergies.
Substantial savings realized from multiple system integrations.
IPTV launched within four months of close.
Last system migration will complete in June.
21
Wireless Partnerships
In addition to its core business, CNSL derives a portion of its cash
flow from five wireless partnerships.
All are managed by Verizon Wireless and overlap with our ILEC and
CLEC markets.
All have experienced solid revenue, operating income, cash
distribution and subscriber growth over the past few years.
Contribution for the first quarter of 2009 was $5.1 million.
Cash Distributions from Wireless Partnerships
$ in millions
$4.0
$8.0
$12.0
$16.0
$20.0
2005
2006
2007
2008
22

Cash Available for Dividends vs. Access Lines
Stable CAPD despite Access Line loss.
Q307 excludes $2.1M subsidy true up
Cash Available for Dividends
$000's
0
50,000
100,000
150,000
200,000
250,000
Q1 '07
Q2 '07
Q3 '07
Q4 '07
Q1 '08
Q2 '08
Q3 '08
Q4 '08
Q1 '09
$0
$2,000
$4,000
$6,000
$8,000
$10,000
$12,000
$14,000
$16,000
$18,000
$20,000
Res Lines
Bus Lines
CAPD
23

CNSL Delivering Strong Financial Results…
($ in millions)
2005
2006
2007
(1)
2008
Q109
CNSL
Revenue
321.4
$
320.8
$
329.2
$
418.4
$
101.7
$
Adjusted EBITDA
136.8
$
139.8
$
143.8
$
189.8
$
45.3
$
Cash Provided by Operating Activities
72.5
$
84.6
$
82.1
$
92.4
$
19.4
$
CapEx
31.1
$
33.4
$
33.5
$
48.0
$
10.2
$
Payout Ratio
(1)
68.9%
76.6%
75.9%
71.6%
64.3%
CNSL Balance Sheet
Total Cash and Marketable Securities
31.4
$
26.7
$
34.3
$
15.5
$
13.3
$
Total Debt
555.0
$
594.0
$
893.0
$
881.0
$
881.0
$
Net Leverage
3.8x
4.1x
4.6x
4.6x
4.7x
(1) Balance Sheet data includes impact of the North Pittsburgh acquisition closed and funded on Dec. 31, 2007.
24

Advanced IP Network
Leading Operating
Metrics
Investment Highlights
Growing Free Cash
Flow
Attractive and
Stable Markets
Sustainable and
Attractive Dividend
Yield
Experienced
Management Team
25

Regulation G Disclaimer
This presentation includes certain non-GAAP financial measures. Each of our earnings releases providing
quarterly results has been posted to the investor relations section of our website at www.consolidated.com.
Each release provides an explanation of the use of non-GAAP financial measures and contains
reconciliations of these measures to their nearest GAAP equivalent.
26

GAAP Reconciliation
This presentation, includes disclosures regarding “EBITDA”, “Adjusted EBITDA”, “cash available to pay
dividends”, “total net debt to last twelve month Adjusted EBITDA coverage ratio”, “adjusted diluted net income,”
and “adjusted net income per share”, all of which are non-GAAP financial measures. Accordingly, they should
not be construed as alternatives to net cash from operating or investing activities, cash and cash equivalents,
cash flows from operations, net income (loss) or net income (loss) per share as defined by GAAP and are not,
on their own, necessarily indicative of cash available to fund cash needs as determined in accordance with
GAAP. In addition, not all companies use identical calculations, and the non-GAAP financial measures may not
be comparable to other similarly titled measures of other companies. A reconciliation of the differences between
these non-GAAP financial measures and the most directly comparable financial measures presented in
accordance with GAAP is included in the tables that follow.
Adjusted EBITDA is comprised of EBITDA, adjusted for certain items as permitted or required by the lenders
under the credit facility in place at the end of each quarter in the periods presented. The tables that follow
include an explanation of how Adjusted EBITDA is calculated for each of the periods presented.
EBITDA is defined as net earnings (loss) before interest expense, income taxes, depreciation and amortization
on an historical basis. We believe net cash provided by operating activities is the most directly comparable
financial measure to EBITDA under GAAP. EBITDA is a non-GAAP financial measure.
Cash available to pay dividends represents Adjusted EBITDA plus cash interest income less (1) cash interest
expense, (2) capital expenditures, and (3) cash taxes.
We present Adjusted EBITDA and cash available to pay dividends for several reasons. Management believes
Adjusted EBITDA and cash available to pay dividends are useful as a means to evaluate our ability to fund our
estimated uses of cash (including interest on our debt) and pay dividends. In addition, we have presented
Adjusted EBITDA and cash available to pay dividends to investors in the past because they are frequently used
by investors, securities analysts and other interested parties in the evaluation of companies in our industry, and
management believes presenting them here provides a measure of consistency in our financial reporting.
Adjusted EBITDA and cash available to pay dividends, referred to as Available Cash in our credit agreement,
are also components of the restrictive covenants and financial ratios contained in the agreements governing our
debt that require us to maintain compliance with these covenants and limit certain activities, such as our ability to
incur debt and to pay dividends.
27

GAAP Reconciliation cont…
The definitions in these covenants and ratios are based on Adjusted EBITDA and cash available to pay
dividends after giving effect to specified charges. We present other information related to the non-GAAP
financial measures, specifically “total net debt to last twelve month Adjusted EBITDA coverage ratio,”
principally to put these other measures in context and facilitate comparisons by investors, security analysts
and others; this ratio differs in certain respects from the similar ratio used in our credit agreement. As a
result, management believes the presentation of Adjusted EBITDA and cash available to pay dividends, as
supplemented by “total net debt to last twelve months Adjusted EBITDA coverage ratio,” provides
important additional information to investors. In addition, Adjusted EBITDA and cash available to pay
dividends provide our board of directors with meaningful information to determine, with other data,
assumptions and considerations, our dividend policy and our ability to pay dividends under the restrictive
covenants in the agreements governing our debt and to measure our ability to service and repay debt.
These non-GAAP financial measures have certain shortcomings. In particular, Adjusted EBITDA does not
represent the residual cash flows available for discretionary expenditures, since items such as debt
repayment and interest payments are not deducted from such measure. Similarly, while we may generate
cash available to pay dividends, we are not required to use any such cash to pay dividends, and the
payment of any dividends is subject to declaration by our board of directors, compliance with applicable
law and the terms of our credit agreement.
Because Adjusted EBITDA is a component of the Dividend Payout Ratio and the ratio of total net debt to
last twelve month Adjusted EBITDA, these measures are also subject to the material limitations discussed
above. In addition, the ratio of total net debt to last twelve month Adjusted EBITDA is subject to the risk
that we may not be able to use the cash on the balance sheet to reduce our debt on a dollar-for-dollar
basis. Management believes these ratios are useful as a means to evaluate our ability to incur additional
indebtedness in the future and, together with adjusted net income and adjusted diluted net income per
share, assist investors, securities analysts and other interested parties in evaluating both our company
over time and the relative performance of the companies in our industry.
28

Adjusted EBITDA Reconciliation
($ in thousands)
IL& TX
2005
IL& TX
2006
IL& TX
2007
IL, TX & PA
2008
IL, TX & PA
Q1 2009
Historical EBITDA:
Net cash provided by operating activities
72,475
$
84,593
$
82,069
$
92,411
$
19,354
$
Adjustments:
Pension curtailment gain
7,880
-
-
-
-
Compensation from restricted share plan
(8,590)
(2,482)
(4,034)
(1,901)
(433)
Loss on extinguishment of debt
-
-
(10,323)
(9,224)
-
Intangible asset impairment (1)
-
(11,240)
-
(6,050)
-
Extraordinary gain, net of tax
-
-
-
7,240
-
Other adjustments, net
(19,068)
3,157
(3,781)
46,053
1,443
Changes in operating assets and liabilities
10,220
6,669
2,828
(24,347)
5,010
Interest expense, net
53,443
42,899
56,780
66,292
14,470
Income taxes
10,935
405
4,674
6,639
2,386
Historical EBITDA (2)
127,295
124,001
128,213
177,113
42,230
Adjustments to EBITDA (3)
Integration and restructuring (4)
7,400
3,684
1,187
4,847
2,380
Professional service fees (5)
2,867
-
-
-
-
Other, net (6)
(3,036)
(7,143)
(6,567)
(19,918)
(4,904)
Investment distributions (7)
1,590
5,516
6,586
17,778
5,159
Pension curtailment gain (8)
(7,880)
-
-
-
-
Loss on extinguishment of debt
-
-
10,323
9,224
-
Intangible assets impairment (1)
-
11,240
-
6,050
-
Extraordinary gain, net of tax
-
-
-
(7,240)
-
Non-cash compensation (9)
8,590
2,482
4,034
1,901
433
Adjusted EBITDA
136,826
$
139,780
$
143,776
$
189,755
$
45,298
$
29
Adjusted EBITDA Reconciliation
30

Cash Available to Pay Dividends
($ in thousands)
IL, TX & PA
IL, TX & PA
2005
2006
2007
YE 2008
Q1 - 2009
Adjusted EBITDA
35,626
$
139,780
$
143,776
$
189,755
$
45,298
$
- Cash interest expense
(9,384)
(40,613)
(44,222)
(65,061)
(14,085)
- Capital Expenditures
(9,498)
(33,388)
(33,495)
(48,027)
(10,157)
+ Proceeds from asset sales
(1)
-
6,594
-
-
-
- Cash income taxes
(172)
(8,237)
(13,976)
(13,540)
(3,153)
+ Cash interest income
174
745
893
367
21
- Principal payments on debt
-
-
-
-
(224)
- Repurchases of stock
-
(87)
-
-
-
Cash available to pay dividends
16,746
$
64,794
$
52,976
$
63,494
$
17,700
$
Quarterly Dividend
11,537
$
44,593
$
40,195
$
45,449
$
11,388
$
Payout Ratio
68.9%
68.8%
75.9%
71.6%
64.3%
(1) Represents $673 of proceeds from the sale of idle property and $5,921 of proceeds from the redemption of class C
shares of RTB stock.
IL and TX Year Ended December 31,
31

Total Net Debt to Adjusted EBITDA Ratio
($ in thousands)
IL, TX & PA
IL, TX & PA
2005
2006
2007
YE 2008
Q1 - 2009
Summary of Outstanding Debt
Senior Notes
130,000
$
130,000
$
130,000
$
-
$
-
$
Term loan
425,000
464,000
760,000
880,000
880,000
Capital Leases
-
-
2,646
1,266
1,042
Total debt as of December 31, 2007
555,000
$
594,000
$
892,646
$
881,266
$
881,042
$
Less cash on hand
(31,409)
(26,672)
(37,297)
(15,471)
(13,347)
Total net debt
523,591
$
567,328
$
855,349
$
865,795
$
867,695
$
Adjusted EBITDA for the trailing
twelve months.
136,826
$
139,780
$
187,000
$
189,755
$
185,862
$
Total Net Debt to Adjusted EBITDA
3.8
4.1
4.6
4.6
4.7
IL and TX Year Ended December 31,
32