Exhibit 99.1

Deutsche Bank Annual Leveraged Finance Conference Oct. 5 - 6, 2020

2 Safe Harbor Forward - Looking Statements Certain statements in this communication are forward - looking statements and are made pursuant to the safe harbor provisions of t he Securities Litigation Reform Act of 1995. These forward - looking statements reflect, among other things, our current expectations, plans, strategies, and anticipated financial results. There are a number of risks, uncertainties, and conditions that may cause our actual results to differ materially from those expressed or implied b y t hese forward - looking statements. These risks and uncertainties include a number of factors related to our business, including the uncertainties relating to the impact of the novel coronavirus (COVID - 19) pandemic on the company’s business, results of operations, cash flows, stock price and employees; the possibility that any of the anticip ate d benefits of the strategic investment from Searchlight or our refinancing of outstanding debt will not be realized; the outcome of any legal proceedings that may be instituted against th e Company or its directors; the ability to obtain regulatory approvals and meet other closing conditions to the investment on a timely basis or at all, i ncl uding the risk that regulatory approvals required for the investment are not obtained on a timely basis or at all, or are obtained subject to conditions that are not ant icipated or that could adversely affect the Company or the expected benefits of the investment; the anticipated use of proceeds of the strategic investment; economic and fi nancial market conditions generally and economic conditions in our service areas; various risks to the price and volatility of our common stock; changes in the valuation of pension plan as sets; the substantial amount of debt and our ability to repay or refinance it or incur additional debt in the future; our need for a significant am oun t of cash to service and repay the debt restrictions contained in our debt agreements that limit the discretion of management in operating the business; regulatory c han ges, including changes to subsidies, rapid development and introduction of new technologies and intense competition in the telecommunications industry; risks associated wi th our possible pursuit of acquisitions; system failures; cyber - attacks, information or security breaches or technology failure of ours or of a third party; losses of la rge customers or government contracts; risks associated with the rights - of - way for the network; disruptions in the relationship with third party vendors; losses of key manag ement personnel and the inability to attract and retain highly qualified management and personnel in the future; changes in the extensive governmental legislation and reg ula tions governing telecommunications providers and the provision of telecommunications services; new or changing tax laws or regulations; telecommunications carri ers disputing and/or avoiding their obligations to pay network access charges for use of our network; high costs of regulatory compliance; the competitive impact of legislation and regulatory changes in the telecommunications industry; and liability and compliance costs regarding environmental regulations; and risks associated wit h d iscontinuing paying dividends on our common stock. A detailed discussion of these and other risks and uncertainties that could cause actual results and events to dif fer materially from such forward - looking statements are discussed in more detail in our filings with the SEC, including our reports on Form 10 - K and Form 10 - Q. Many of t hese circumstances are beyond our ability to control or predict. Moreover, forward - looking statements necessarily involve assumptions on our part. These forward - l ooking statements generally are identified by the words “believe,” “expect,” “anticipate,” “estimate,” “project,” “intend,” “plan,” “should,” “may,” “will,” “would,” “w ill be,” “will continue” or similar expressions. Such forward - looking statements involve known and unknown risks, uncertainties and other factors that may cause actual results, performance or achievements of the Company and its subsidiaries to be different from those exp res sed or implied in the forward - looking statements. All forward - looking statements attributable to us or persons acting on our behalf are expressly qualified in their e ntirety by the cautionary statements that appear throughout this communication. Furthermore, forward - looking statements speak only as of the date they are made. Except as required under the federal securities laws or the rules and regulations of the SEC, we disclaim any intention or obligation to update or revise publicly any forwar d - l ooking statements. You should not place undue reliance on forward - looking statements.
3 Non - GAAP Measures This presentation includes certain non - GAAP financial measures, including but not limited to “EBITDA,” “adjusted EBITDA,” “total net debt to last twelve month adjusted EBITDA ratio,” and “free cash flow.” In addition to providing key metrics for management to evaluate the Company’s p erf ormance, we believes these measurements assist investors in their understanding of operating performance and in identifying historical and prospective t ren ds. A reconciliation of the differences between these non - GAAP financial measures and the most directly comparable financial measure s presented in accordance with GAAP are available in the Appendix here to. Non - GAAP measures are not presented to be replacements or alternatives to the GAAP measures, and investors are urged to consider these non - GAAP measures in addition to, and not in substitution for, measures prepared in accordance with GAAP . Consolidated may present or calculate its non - GAAP measures differently from other companies.
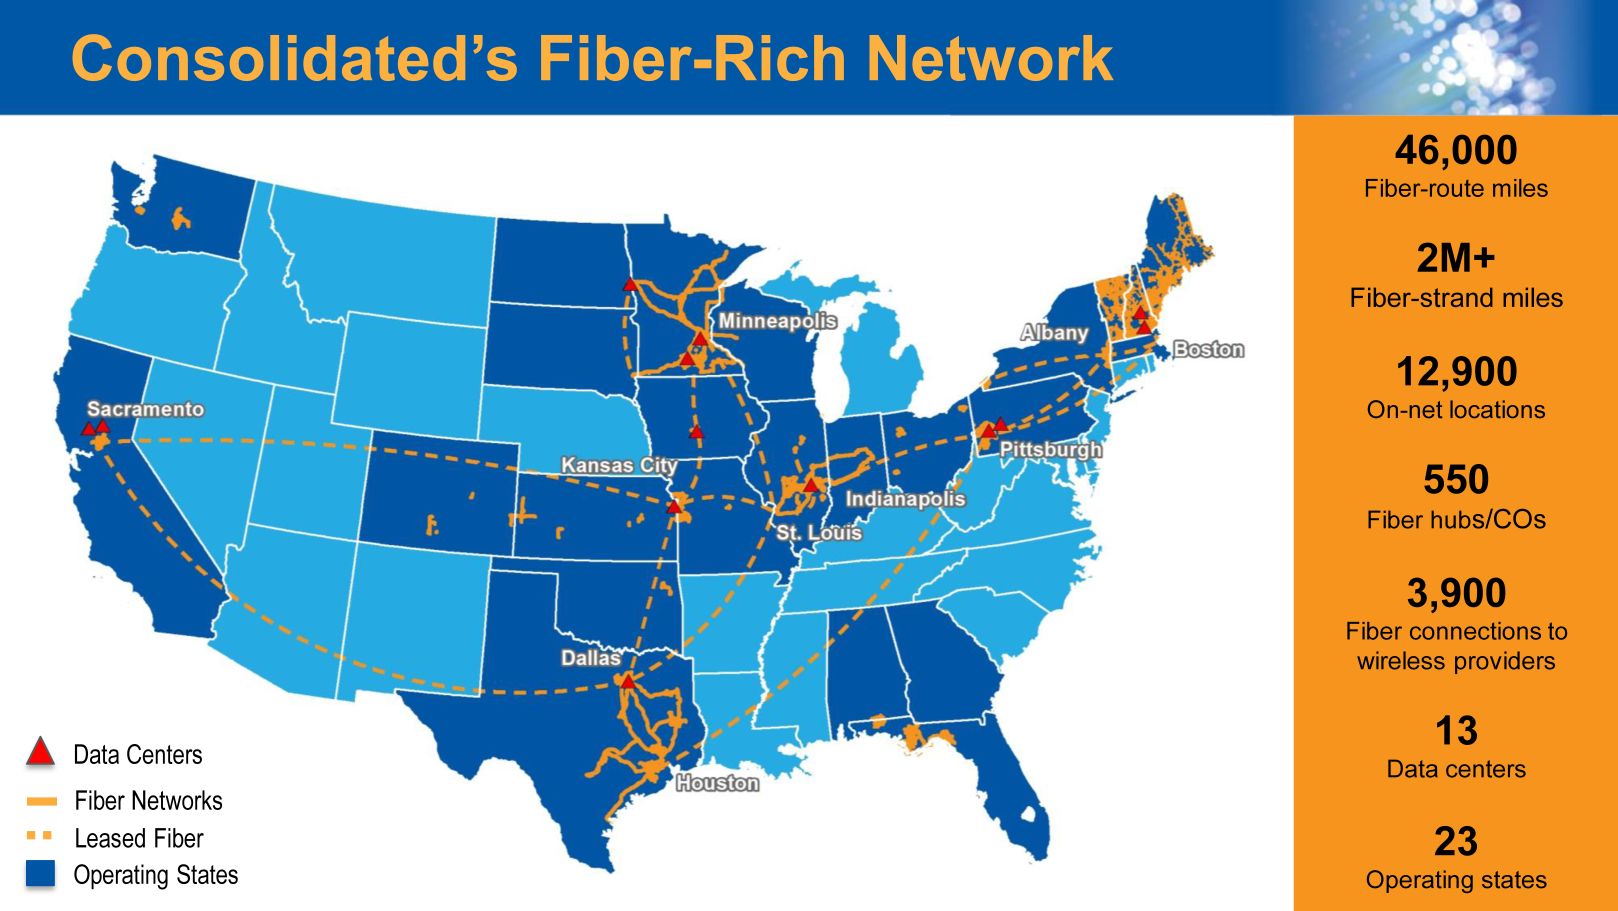
4 Consolidated’s Fiber - Rich Network 46,000 Fiber - route miles 2M+ Fiber - strand miles 12,900 On - net locations 550 F iber hub s/COs 3,900 F iber connections to wireless providers 13 Data centers 23 Operating states Data Centers Operating States Fiber Networks Leased Fiber
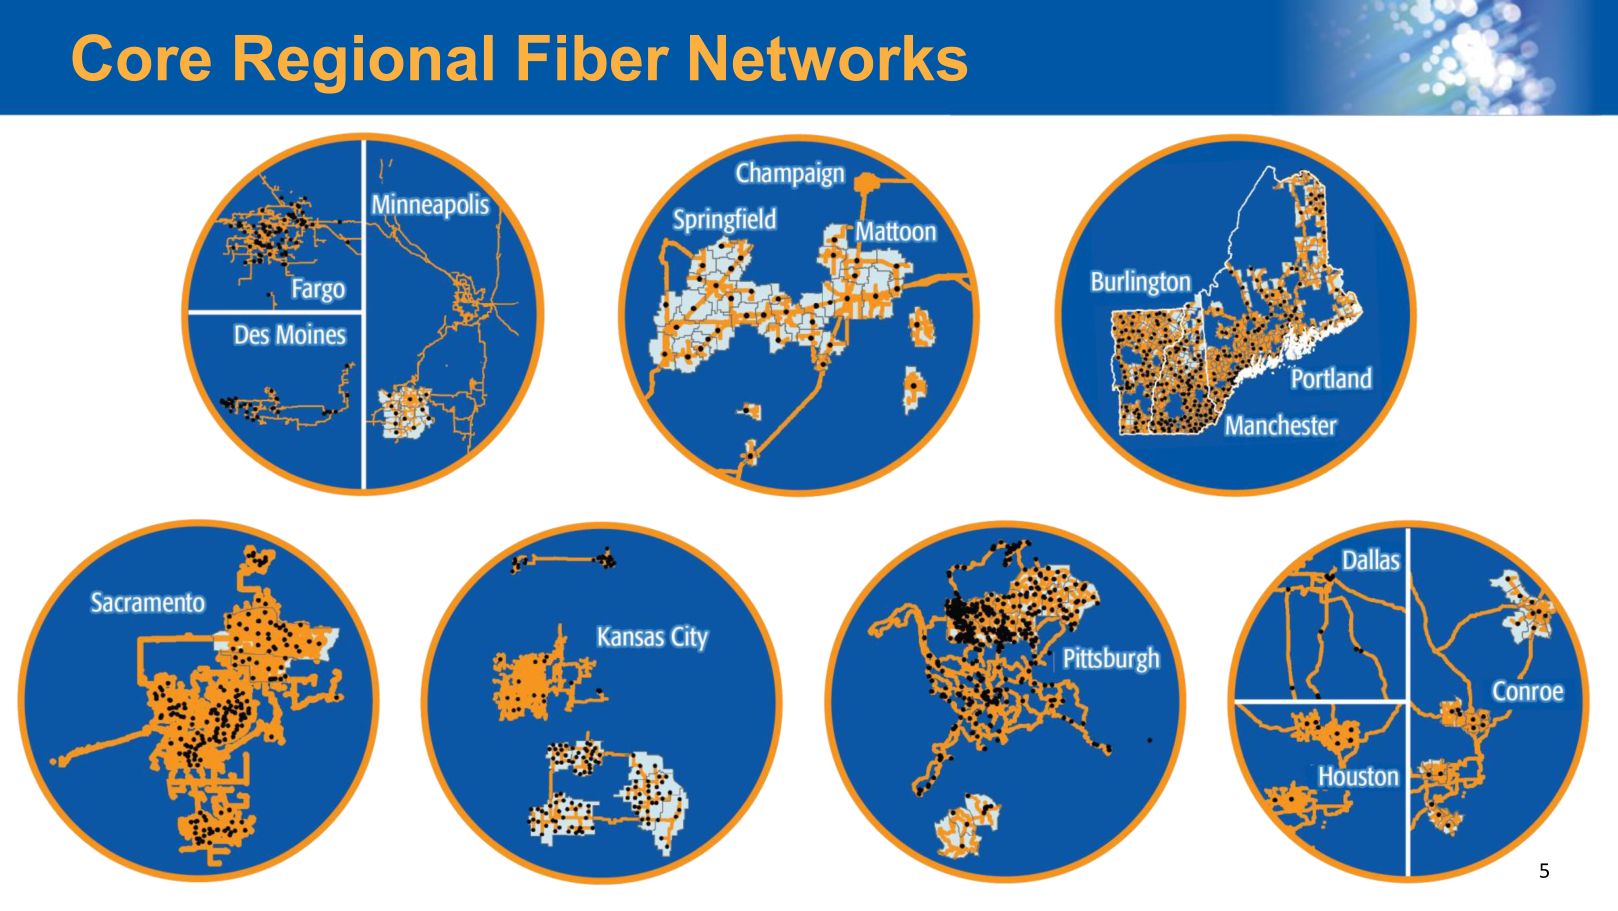
5 Core Regional Fiber Networks
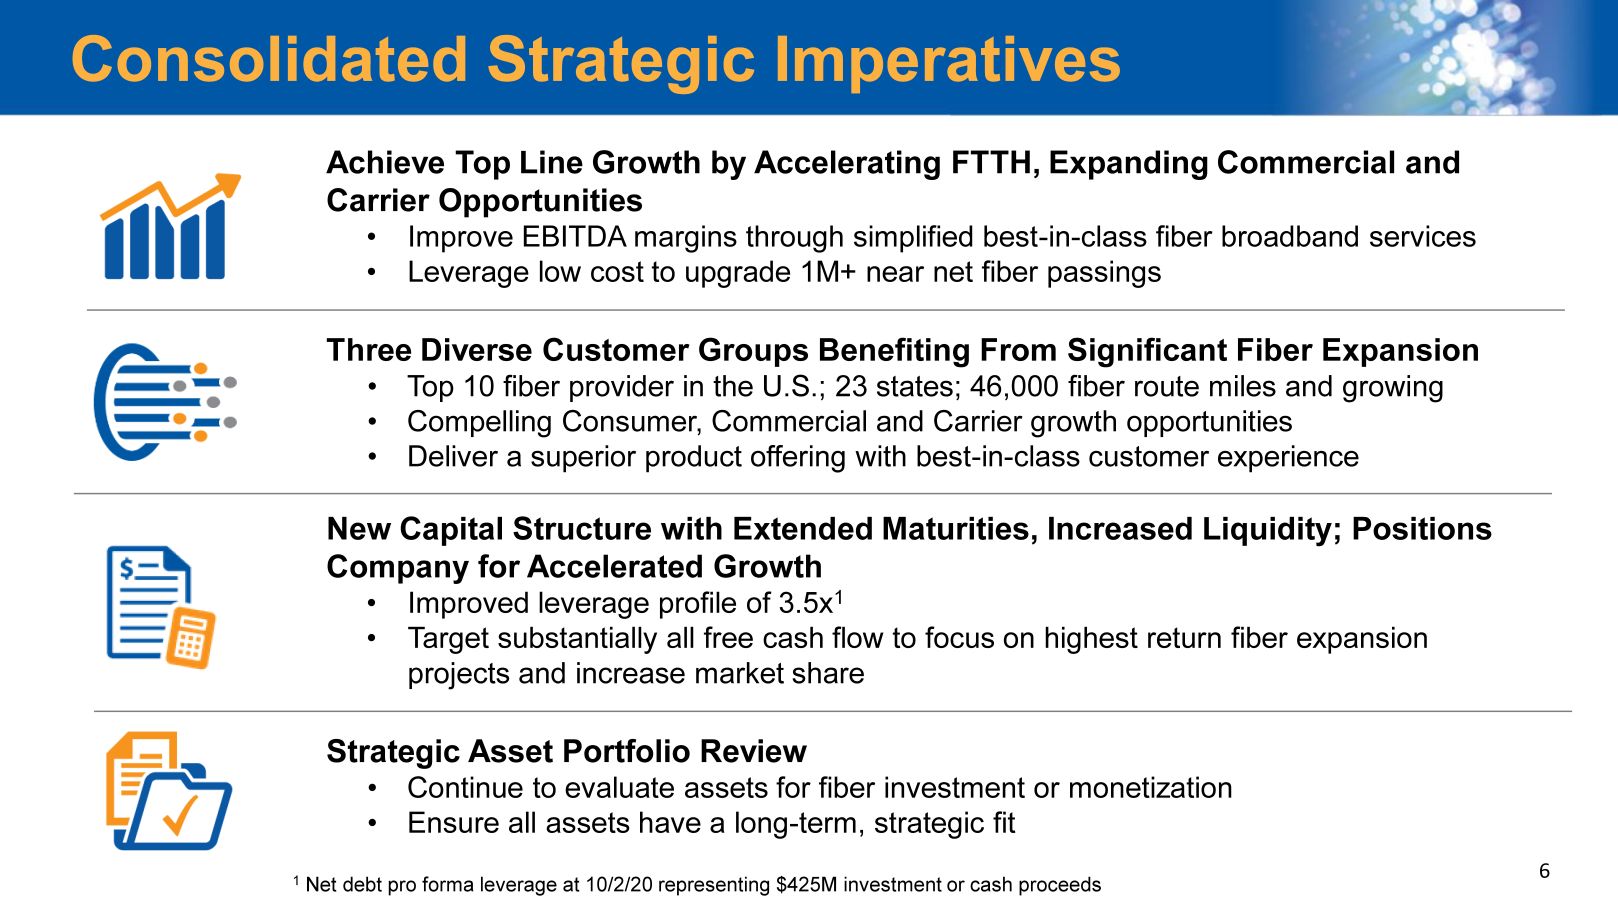
6 Consolidated Strategic Imperatives New Capital Structure with Extended Maturities, Increased Liquidity; Positions Company for Accelerated Growth • Improved leverage profile of 3.5x 1 • Target substantially all free cash flow to focus on highest return fiber expansion projects and increase market share Three Diverse Customer Groups Benefiting From Significant Fiber Expansion • Top 10 fiber provider in the U.S.; 23 states; 46,000 fiber route miles and growing • Compelling Consumer, Commercial and Carrier growth opportunities • Deliver a superior product offering with best - in - class customer experience Achieve Top Line Growth by Accelerating FTTH, Expanding Commercial and Carrier Opportunities • Improve EBITDA margins through simplified best - in - class fiber broadband services • Leverage low cost to upgrade 1M+ near net fiber passings Strategic Asset Portfolio Review • Continue to evaluate assets for fiber investment or monetization • Ensure all assets have a long - term, strategic fit 1 Net debt pro forma leverage at 10/2/20 representing $425M investment or cash proceeds
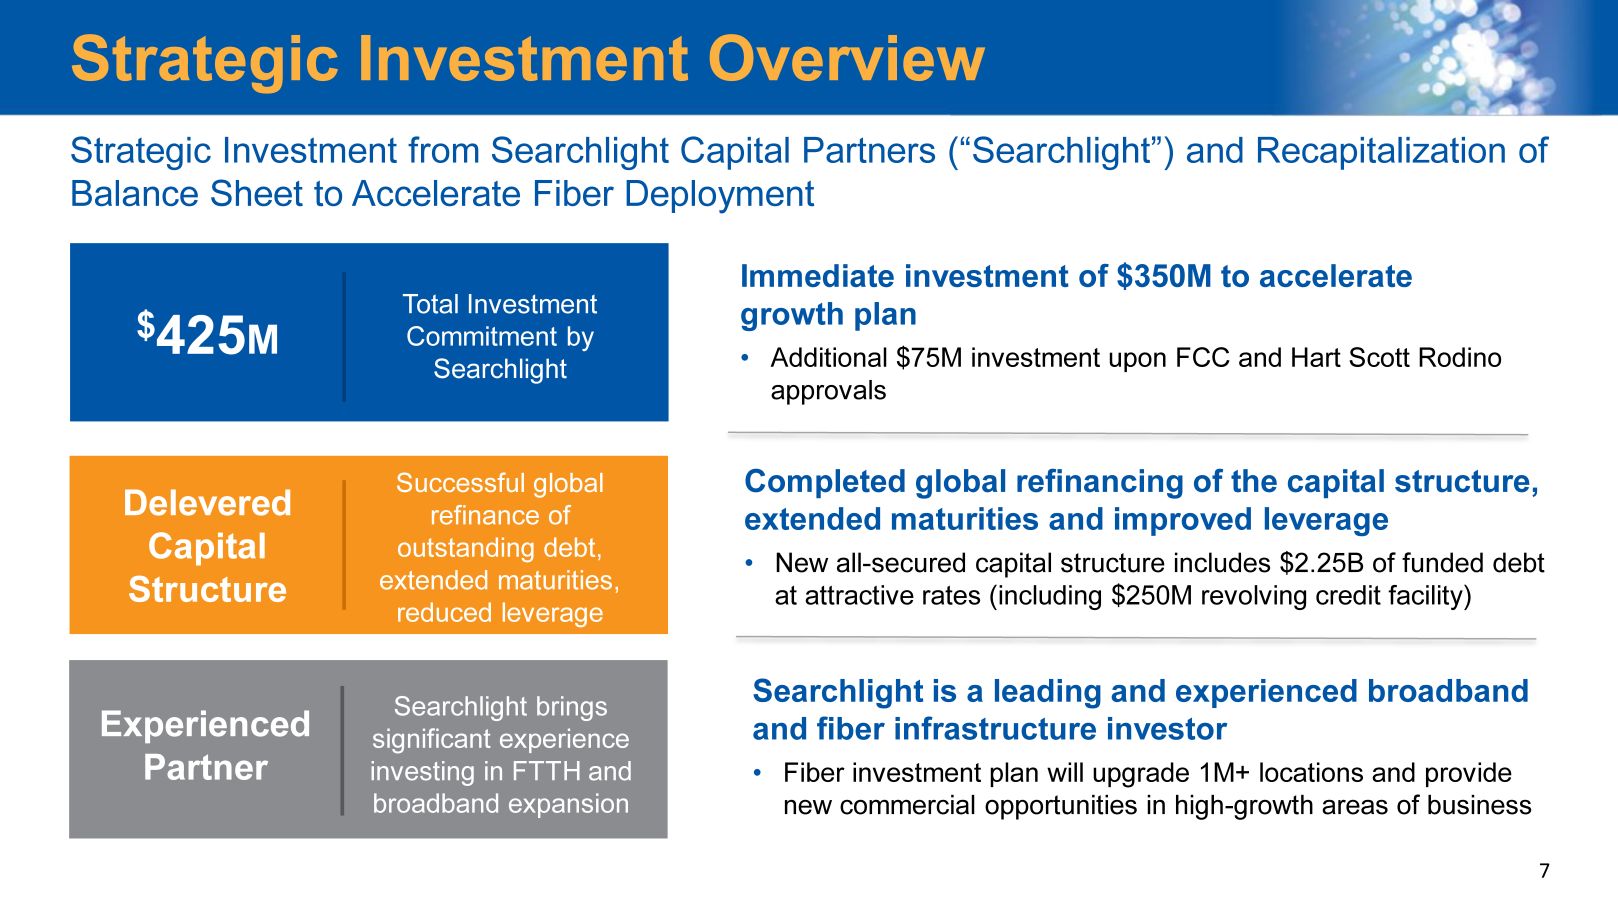
7 Strategic Investment Overview Strategic Investment from Searchlight Capital Partners (“ Searchlight”) and Recapitalization of Balance Sheet to Accelerate Fiber Deployment $ 425 M Experienced Partner Total Investment Commitment by Searchlight Successful global refinance of outstanding debt, extended maturities, reduced leverage Searchlight brings significant experience investing in FTTH and broadband expansion Delevered Capital Structure Immediate investment of $350M to accelerate growth plan • Additional $75M investment upon FCC and Hart Scott Rodino approvals Completed global refinancing of the capital structure, extended maturities and improved leverage • New all - secured capital structure includes $2.25B of funded debt at attractive rates (including $250M revolving credit facility) Searchlight is a leading and experienced broadband and fiber infrastructure investor • Fiber investment plan will upgrade 1M+ locations and provide new commercial opportunities in high - growth areas of business

8 x Consolidated global refinancing complete x Searchlight invests $ 350M Searchlight receives: ‒ 8% common equity and right to receive note with a principal amount of ~$395M ‒ Contingent Payment Rights (CPRs ) representing 16.9% common equity • Upon receipt of FCC and HSR approval, Searchlight invests $75M in return for: ‒ Additional CPRs representing 10.1% common equity ‒ The note converts to perpetual preferred stock with aggregate liquidation preference equal to principal amount of the note at conversion • Upon receipt of shareholder approvals, Searchlight CPRs convert to common equity Searchlight pro forma ownership of Consolidated: - 35% of common shares - $395.5M perpetual preferred stock with a 9.0% coupon, and a PIK option for five years 1 - 2 Board Seats Investment Steps Conversion of CPRs $350 million Investment $75 million Investment 1 Investment structured to comply with FCC, State Public Utility Commission and shareholder approval requirements. See our SEC filings for further details of the transaction and investment structure . Timeline of Searchlight Investment 1
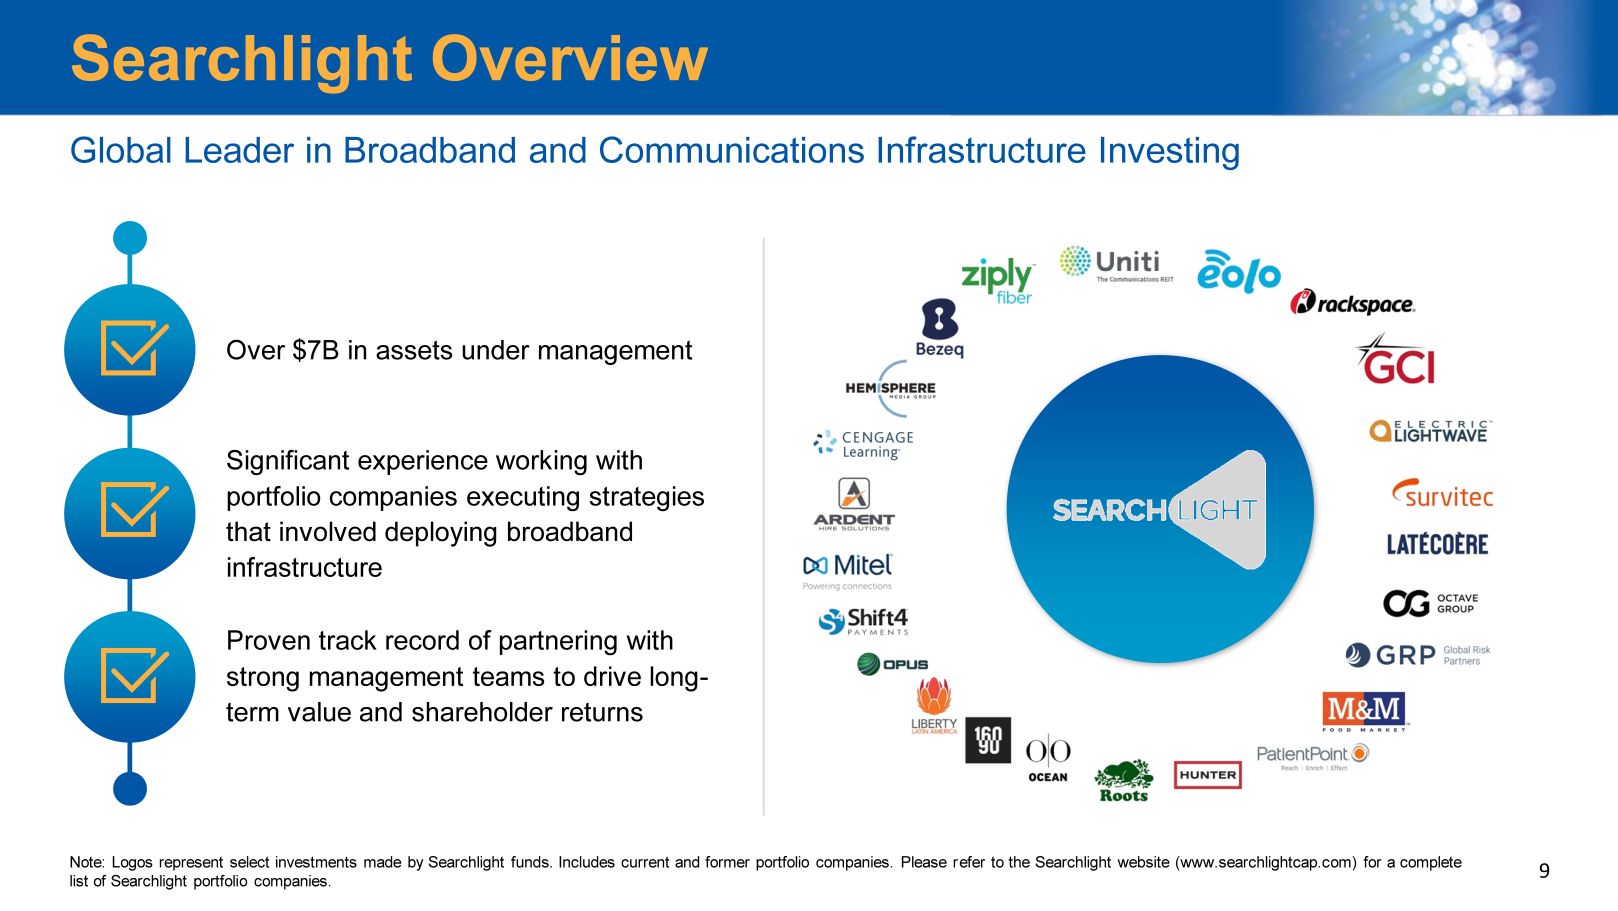
9 Searchlight Overview Note: Logos represent select investments made by Searchlight funds. Includes current and former portfolio companies. Please r efe r to the Searchlight website (www.searchlightcap.com) for a complete list of Searchlight portfolio companies. Global Leader in Broadband and Communications Infrastructure Investing 9 Over $7B in assets under management Significant experience working with portfolio companies executing strategies that involved deploying broadband infrastructure Proven track record of partnering with strong management teams to drive long - term value and shareholder returns
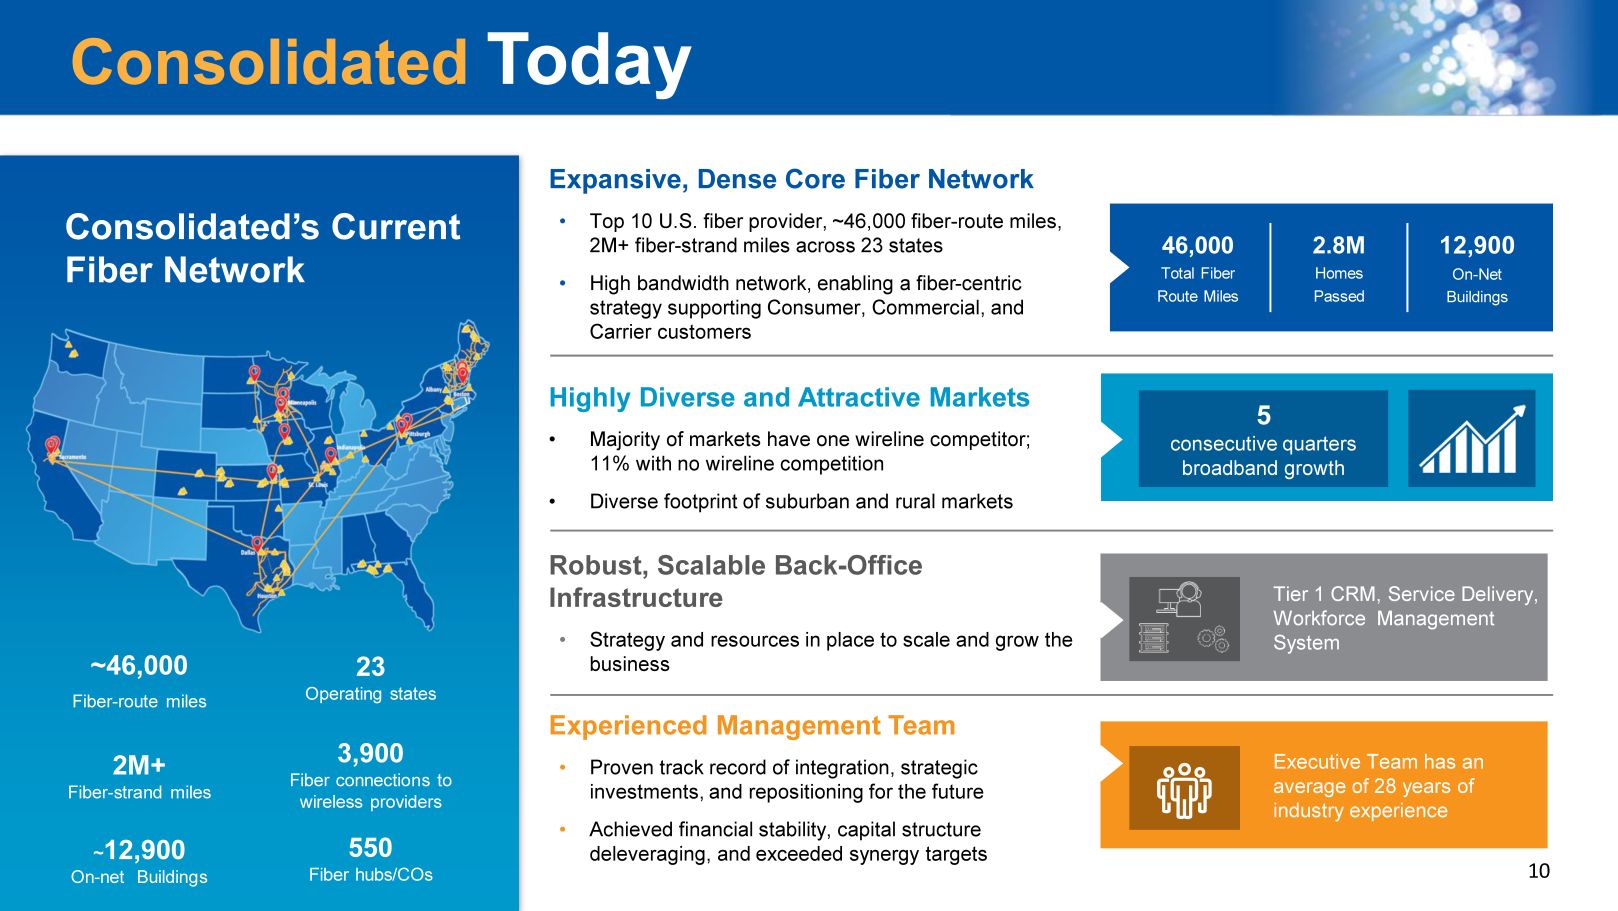
10 Consolidated’s Current Fiber Network Consolidated Today 46,000 Total Fiber Route Miles 2.8M Homes Passed 12,900 On - Net Buildings Executive Team has an average of 28 years of industry experience Expansive, Dense Core Fiber Network • Top 10 U.S. fiber provider, ~ 46,000 fiber - route miles, 2M+ fiber - strand miles across 23 states • High bandwidth network, enabling a fiber - centric strategy supporting Consumer , Commercial, and Carrier customers Robust, Scalable Back - Office Infrastructure • Strategy and resources in place to scale and grow the business Experienced Management Team • Proven track record of integration, strategic investments, and repositioning for the future • Achieved financial stability, capital structure deleveraging, and exceeded synergy targets Highly Diverse and Attractive Markets • Majority of markets have one wireline competitor; 11% with no wireline competition • Diverse footprint of suburban and rural markets Tier 1 CRM , Service Delivery , Workforce Management System 5 consecutive quarters broadband growth ~46,000 Fiber - route miles 2M+ Fiber - strand miles ~ 12,900 On - net Buildings 23 Operating states 3,900 Fiber connections to wireless providers 550 Fiber hubs/COs
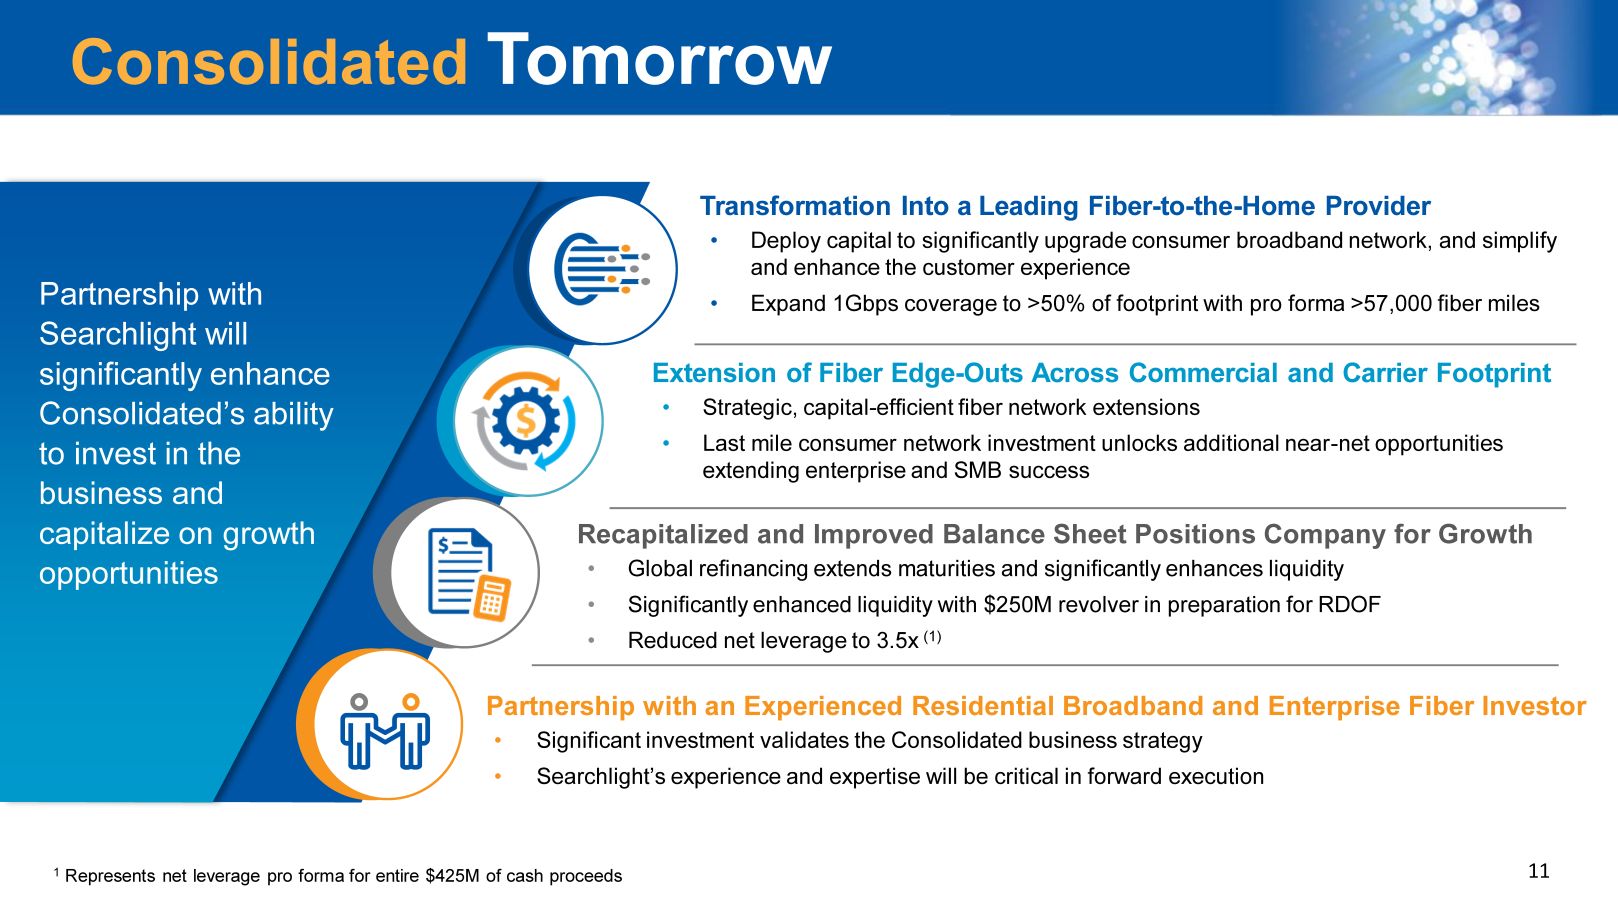
11 Extension of Fiber Edge - Outs Across Commercial and Carrier Footprint • Strategic , capital - efficient fiber network extensions • Last mile consumer network investment unlocks additional near - net opportunities extending enterprise and SMB success Transformation Into a Leading Fiber - to - the - Home Provider • D eploy capital to significantly upgrade consumer broadband network, and simplify and enhance the customer experience • Expand 1Gbps coverage to >50% of footprint with pro forma >57,000 fiber miles Recapitalized and Improved Balance Sheet Positions Company for Growth • Global refinancing extends maturities and significantly enhances liquidity • Significantly enhanced liquidity with $250M revolver in preparation for RDOF • Reduced net leverage to 3.5x (1) Partnership with an Experienced Residential Broadband and Enterprise Fiber Investor • Significant investment validates the Consolidated business strategy • Searchlight’s experience and expertise will be critical in forward execution Consolidated Tomorrow Partnership with Searchlight will significantly enhance Consolidated’s ability to invest in the business and capitalize on growth opportunities 1 Represents net leverage pro forma for entire $425M of cash proceeds
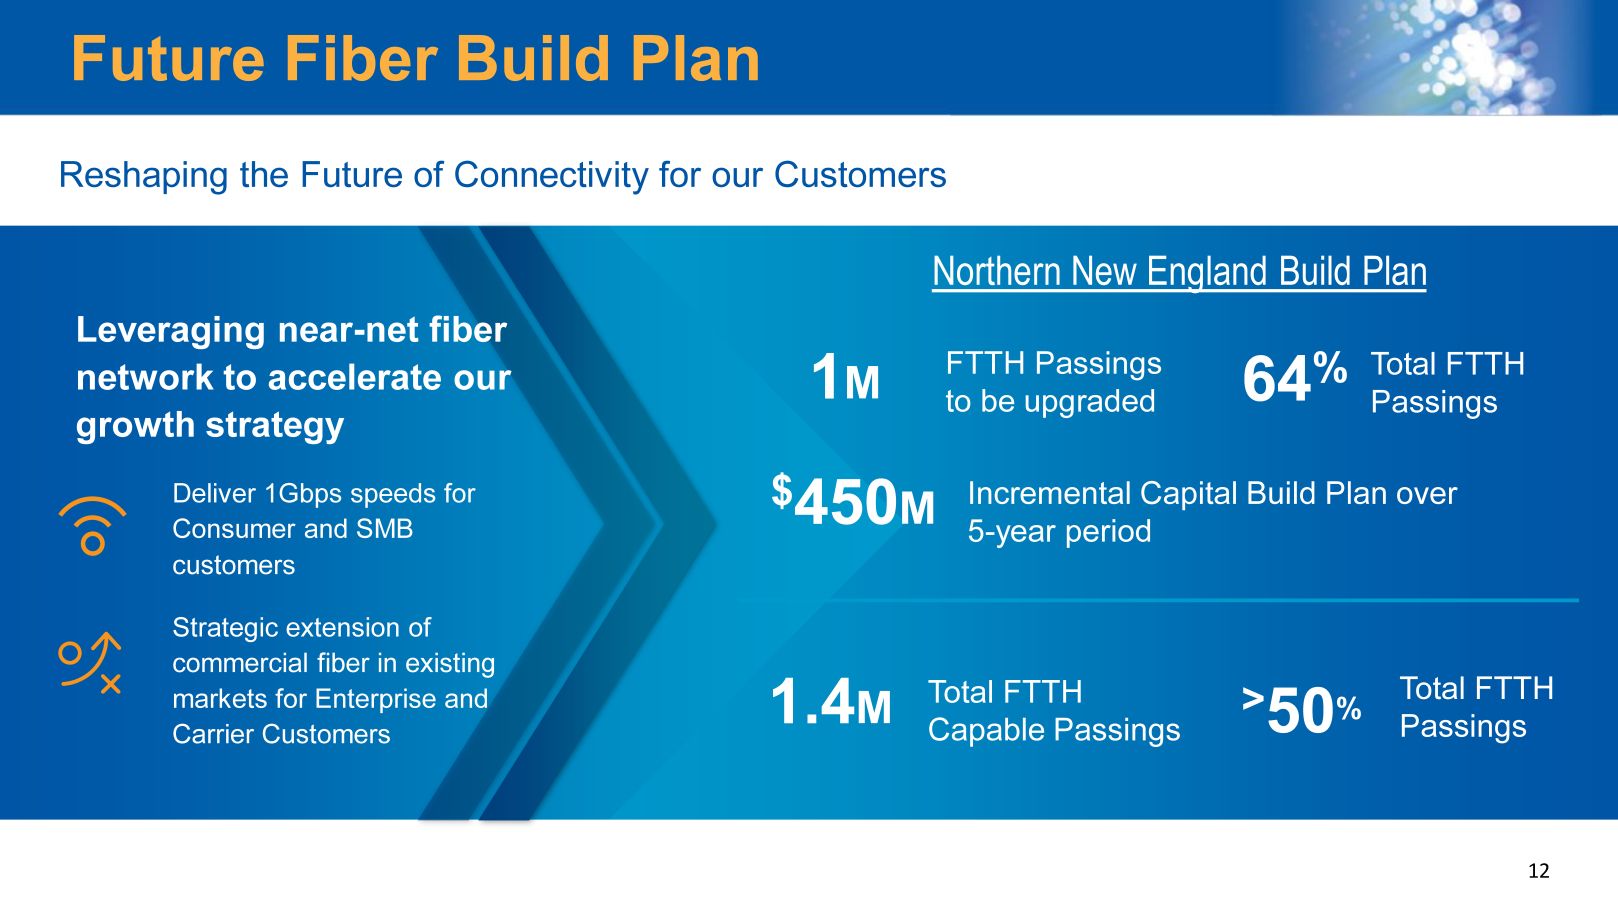
12 Future Fiber Build Plan T otal FTTH Passings > 50 % Reshaping the Future of Connectivity for our Customers Leveraging near - net fiber network to accelerate our growth strategy Deliver 1Gbps speeds for Consumer and SMB customers Strategic extension of commercial fiber in existing markets for Enterprise and Carrier Customers Total FTTH Capable Passings 1.4 M I ncremental Capital Build Plan over 5 - year period Total FTTH Passings FTTH Passings to be upgraded $ 450 M 1 M 64 % Northern New England Build Plan

13 13 The New Consolidated Communications Actions taken to position the Company for growth Dividend Cut + New Capital Allocation Plan Aggressive Debt Paydown from Free Cash Flow Conservative Financial Policy Accelerate Investment in Business; $ 425M Committed Capital I nfusion Future - proof the Fiber Network Deliver Best - in - Class Services, Customer Experience Across Three Customer Groups Return to Revenue Growth Lowered Leverage, Extended Maturities, Enhanced Liquidity Profile $350M investment
Appendix
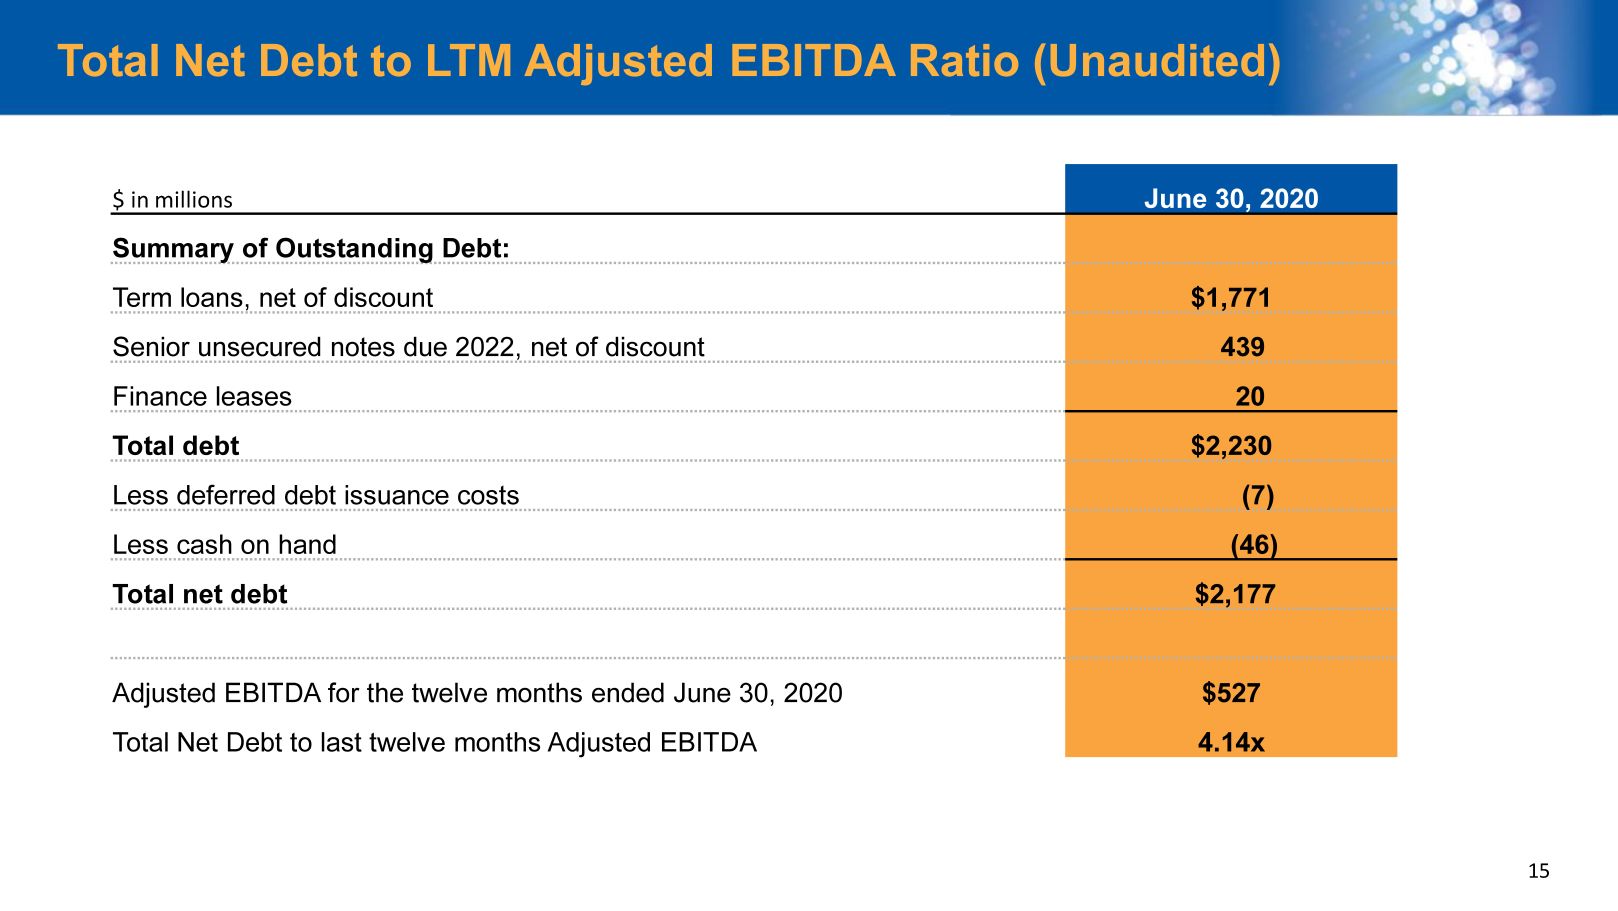
15 Total Net Debt to LTM Adjusted EBITDA Ratio (Unaudited) $ in millions June 30, 2020 Summary of Outstanding Debt: Term loans, net of discount $1,771 Senior unsecured notes due 2022, net of discount 439 Finance leases 20 Total debt $2,230 Less deferred debt issuance costs (7 ) Less cash on hand (46 ) Total net debt $ 2,177 Adjusted EBITDA for the twelve months ended June 30, 2020 $527 Total Net Debt to last twelve months Adjusted EBITDA 4.14x
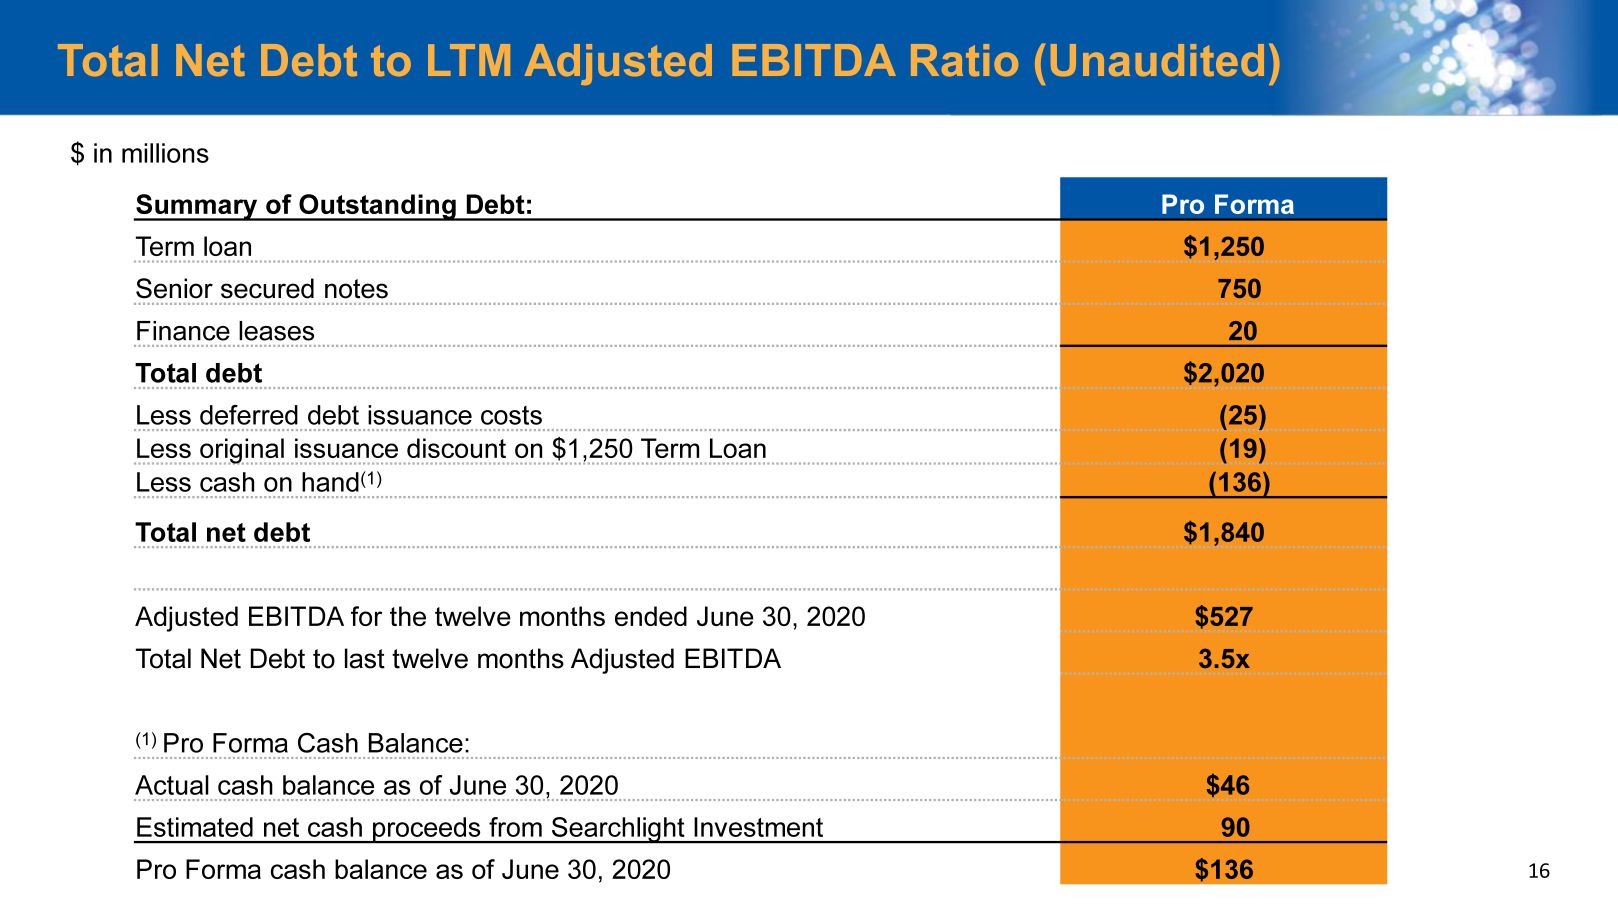
16 Total Net Debt to LTM Adjusted EBITDA Ratio (Unaudited) Summary of Outstanding Debt: Pro Forma Term loan $ 1,250 Senior secured notes 750 Finance leases 20 Total debt $2,020 Less deferred debt issuance costs (25 ) Less original issuance discount on $1,250 Term Loan (19) Less cash on hand (1) (136) Total net debt $ 1,840 Adjusted EBITDA for the twelve months ended June 30, 2020 $ 527 Total Net Debt to last twelve months Adjusted EBITDA 3.5x (1) Pro Forma Cash Balance: Actual cash balance as of June 30, 2020 $46 Estimated net cash proceeds from Searchlight Investment 90 Pro Forma cash balance as of June 30, 2020 $ 136 $ in millions