Free signup for more
- Track your favorite companies
- Receive email alerts for new filings
- Personalized dashboard of news and more
- Access all data and search results
Filing tables
Filing exhibits
Related financial report
CNSL similar filings
- 2 Dec 22 Consolidated Communications Announces CFO Transition
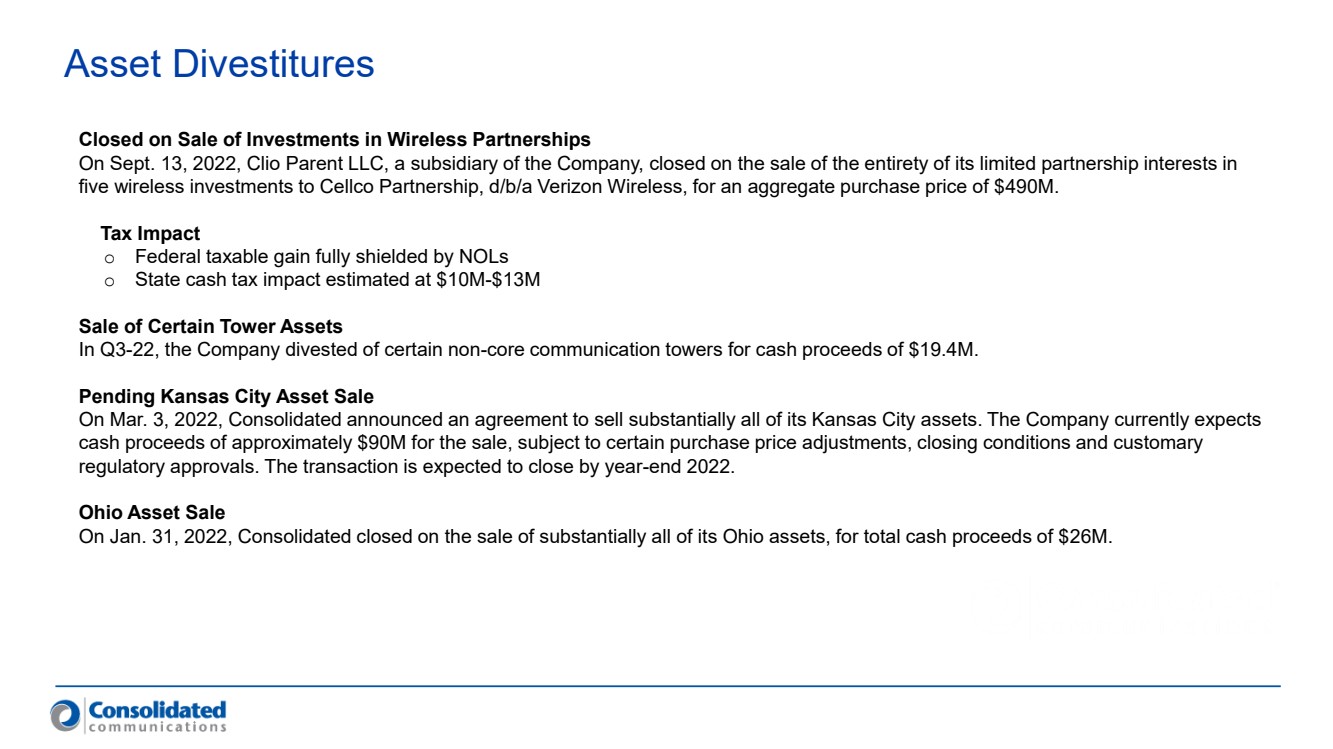
- 1 Dec 22 Consolidated Communications Closes on Sale of its Kansas City Assets
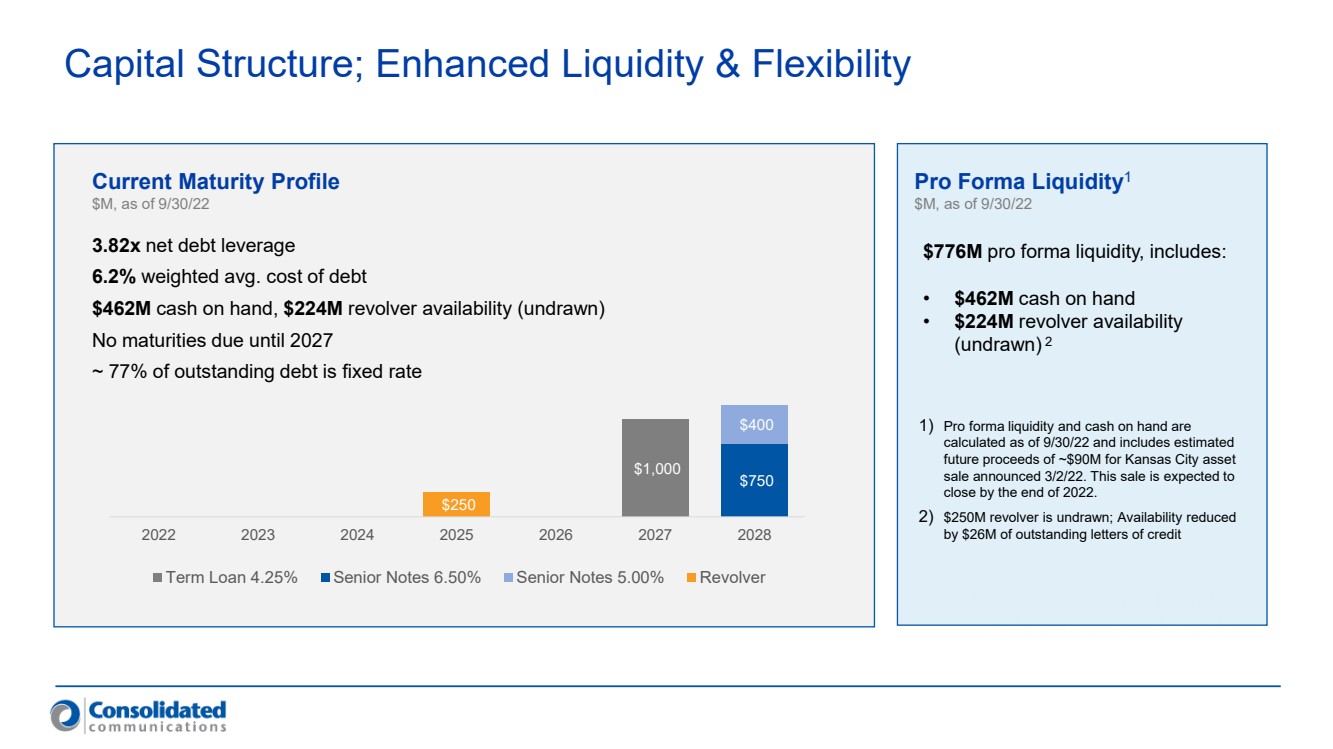
- 23 Nov 22 Consolidated Communications Announces Extension of Revolving Credit Facility
- 1 Nov 22 Results of Operations and Financial Condition
- 15 Sep 22 Unaudited Pro Forma Condensed Consolidated Financial Statements
- 13 Sep 22 Consolidated Communications Completes Sale of Wireless Investments
- 2 Aug 22 Results of Operations and Financial Condition
Filing view
External links