| Q4 2022 February 28, 2023 EARNINGS Nasdaq: CNSL consolidated.com Exhibit 99.2 |
| Safe Harbor Statement Certain statements in this communication are forward-looking statements and are made pursuant to the safe harbor provisions of the Private Securities Litigation Reform Act of 1995. These forward-looking statements reflect, among other things, our current expectations, plans, strategies, and anticipated financial results, including year over year revenue and EBITDA growth in 2024. There are a number of risks, uncertainties, and conditions that may cause our actual results to differ materially from those expressed or implied by these forward-looking statements. These risks and uncertainties include a number of factors related to our business, including the uncertainties relating to the impact of public health threats, including the novel coronavirus (COVID-19) pandemic, on the Company’s business, results of operations, cash flows and stock price; the possibility that any of the anticipated benefits of the strategic investment from Searchlight Capital Partners, L.P. or our refinancing of outstanding debt, including our senior secured credit facilities; the outcome of any legal proceedings that may be instituted against the Company or its directors; economic and financial market conditions generally and economic conditions in our service areas; various risks to the price and volatility of our common stock; changes in the valuation of pension plan assets; the substantial amount of debt and our ability to repay or refinance it or incur additional debt in the future; our need for a significant amount of cash to service and repay the debt restrictions contained in our debt agreements that limit the discretion of management in operating the business; our need for substantial capital expenditures for our operations; regulatory changes, including changes to subsidies, our need for continued receipt of support from various funds established under federal and state laws, such as network access and subsidies; rapid development and introduction of new technologies; intense competition in the telecommunications industry; shifts in our product mix; risks associated with our possible pursuit of or failure to consummate acquisitions or dispositions; disruptions in our networks and infrastructure; cyber-attacks, information or security breaches or technology failure of ours or of a third party; losses of large customers or government contracts; risks associated with the rights-of-way for the network; disruptions in the relationship with third party vendors or our ability to obtain necessary hardware, software and operational support from third party venders; losses of key management personnel and our ability to attract and retain highly qualified management and personnel in the future; our ability to enter into new, or renew existing, collective bargaining agreements with our employees; changes in the extensive governmental legislation and regulations governing telecommunications providers and the provision of telecommunications services; new or changing tax laws or regulations; telecommunications carriers disputing and/or avoiding their obligations to pay network access charges for use of our network; high costs of regulatory compliance; increasing video content costs; the competitive impact of legislation and regulatory changes in the telecommunications industry; liability and compliance costs regarding environmental regulations and environmental, social, and governance (ESG) initiatives; risks associated with discontinuing paying dividends on our common stock; and the potential for the rights of our series A preferred stock to negatively impact our cash flow. A detailed discussion of these and other risks and uncertainties that could cause actual results and events to differ materially from such forward-looking statements are discussed in more detail in our filings with the Securities and Exchange Commission (“SEC”), including our Form 10-K for the year ended December 31, 2021. Many of these circumstances are beyond our ability to control or predict. Moreover, forward-looking statements necessarily involve assumptions on our part. These forward-looking statements generally are identified by the words “believe,” “expect,” “anticipate,” “estimate,” “project,” “intend,” “plan,” “should,” “may,” “will,” “would,” “will be,” “will continue” or similar expressions. Such forward-looking statements involve known and unknown risks, uncertainties and other factors that may cause actual results, performance or achievements of the Company and its subsidiaries to be different from those expressed or implied in the forward-looking statements. All forward-looking statements attributable to us or persons acting on our behalf are expressly qualified in their entirety by the cautionary statements that appear throughout this communication. Furthermore, forward-looking statements speak only as of the date they are made. Except as required under the federal securities laws or the rules and regulations of the SEC, we disclaim any intention or obligation to update or revise publicly any forward-looking statements. You should not place undue reliance on forward-looking statements. Non-GAAP Measures This presentation includes certain non-GAAP historical and forward-looking financial measures, including but not limited to “EBITDA,” “adjusted EBITDA,” “net debt leverage ratio,” “total net debt to last twelve month adjusted EBITDA ratio,” and “normalized revenue.” In addition to providing key metrics for management to evaluate the Company’s performance, we believes these measurements assist investors in their understanding of operating performance and in identifying historical and prospective trends. See additional information and a reconciliation of these non-GAAP measures to the nearest comparable GAAP measures in the Appendix. Non-GAAP measures are not presented to be replacements or alternatives to the GAAP measures, and investors are urged to consider these non-GAAP measures in addition to, and not in substitution for, measures prepared in accordance with GAAP. Consolidated may present or calculate its non-GAAP measures differently from other companies. The Company’s 8-K, Form 10-K, Form 10-Q and other filings should be read in conjunction with this presentation as they contain additional important details on the quarterly results. |
| 2.6M total passings 1M Total fiber Gig+ capable passings Data as of 12/31/22; * Full-year 2022 including discontinued operations 123K Fiber Gig+ capable broadband connections 57,900 fiber route miles $1.2B Revenue $414M Adjusted EBITDA* Fidium is Consolidated’s consumer/SMB fiber broadband service offering symmetrical multi-gig speeds. Consolidated Communications Overview Transforming from a copper-based telco into a leading fiber provider Key Operational & Financial Metrics |

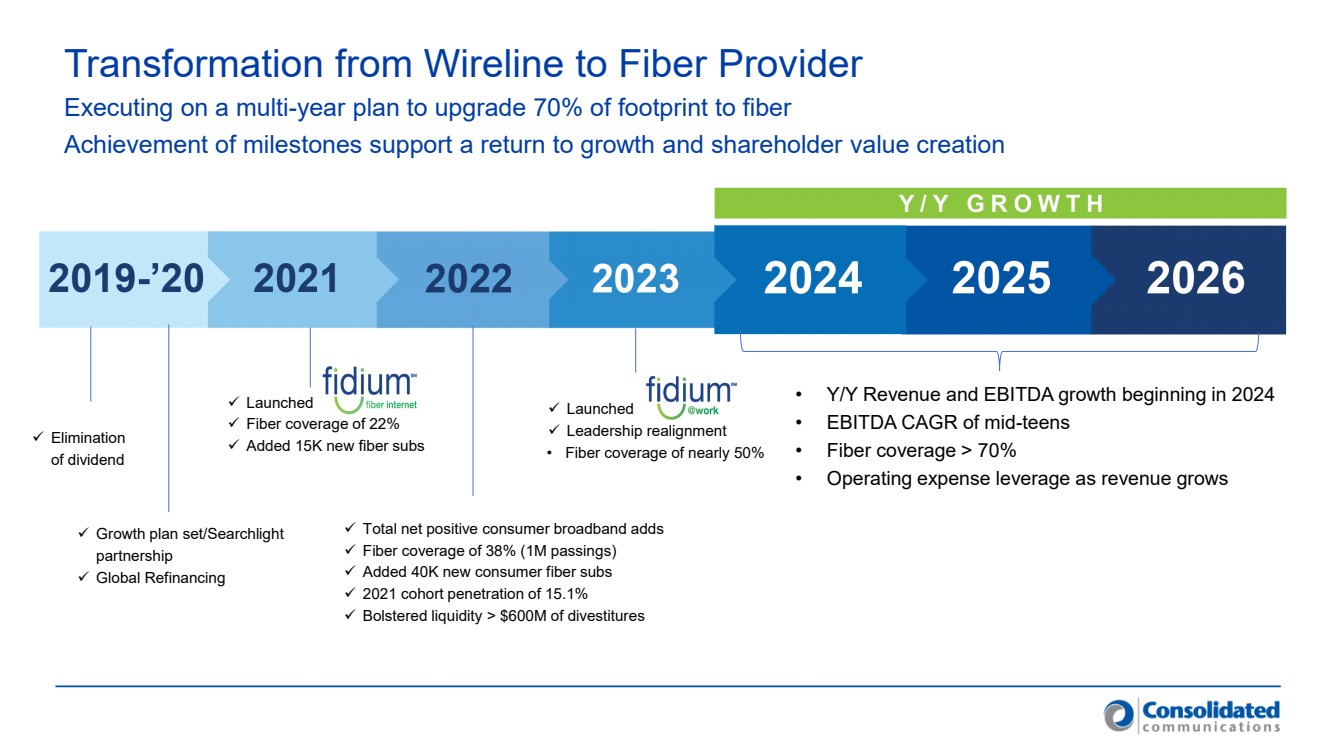
| Transformation from Wireline to Fiber Provider Growth plan set/Searchlight partnership Global Refinancing Launched Fiber coverage of 22% Added 15K new fiber subs Total net positive consumer broadband adds Fiber coverage of 38% (1M passings) Added 40K new consumer fiber subs 2021 cohort penetration of 15.1% Bolstered liquidity > $600M of divestitures Launched Leadership realignment • Fiber coverage of nearly 50% • Y/Y Revenue and EBITDA growth beginning in 2024 • EBITDA CAGR of mid-teens • Fiber coverage > 70% • Operating expense leverage as revenue grows Executing on a multi-year plan to upgrade 70% of footprint to fiber Achievement of milestones support a return to growth and shareholder value creation Elimination of dividend |
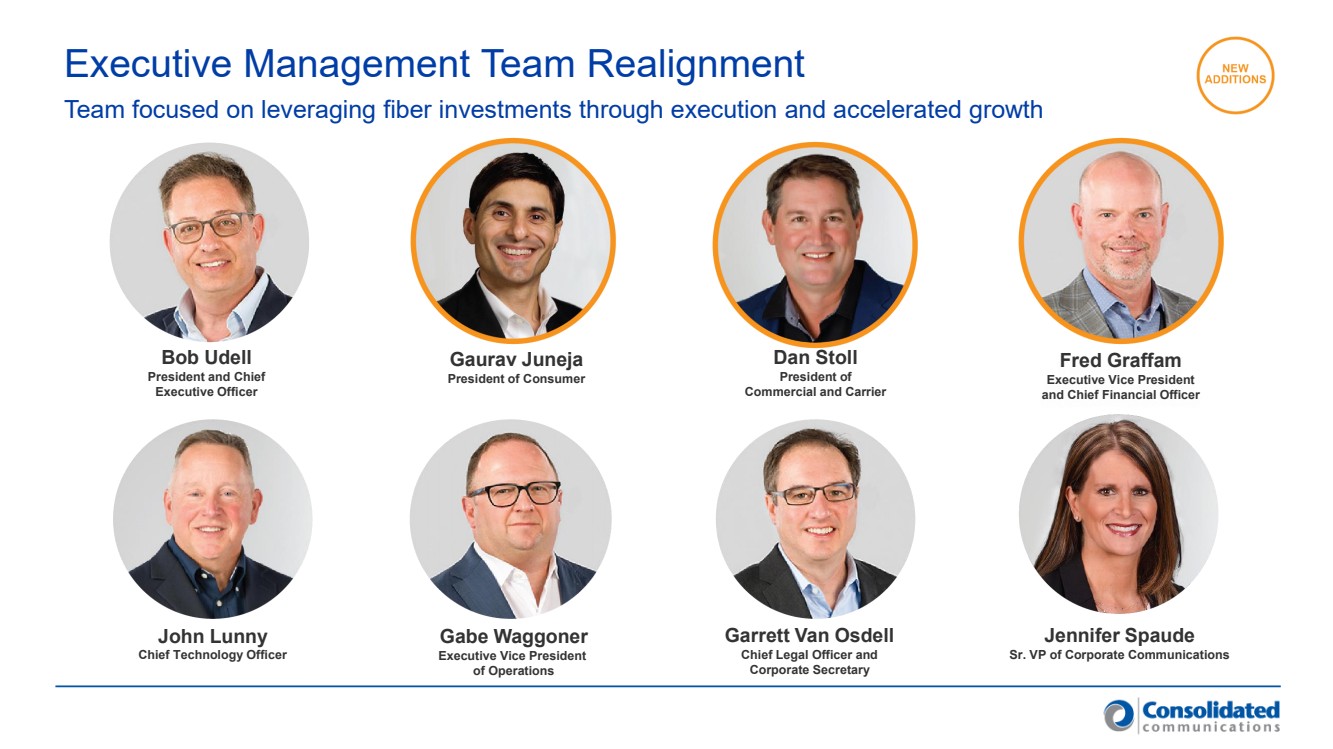
| Bob Udell President and Chief Executive Officer Fred Graffam Executive Vice President and Chief Financial Officer Gaurav Juneja President of Consumer John Lunny Chief Technology Officer Dan Stoll President of Commercial and Carrier Jennifer Spaude Sr. VP of Corporate Communications Garrett Van Osdell Chief Legal Officer and Corporate Secretary Gabe Waggoner Executive Vice President of Operations Team focused on leveraging fiber investments through execution and accelerated growth Executive Management Team Realignment |
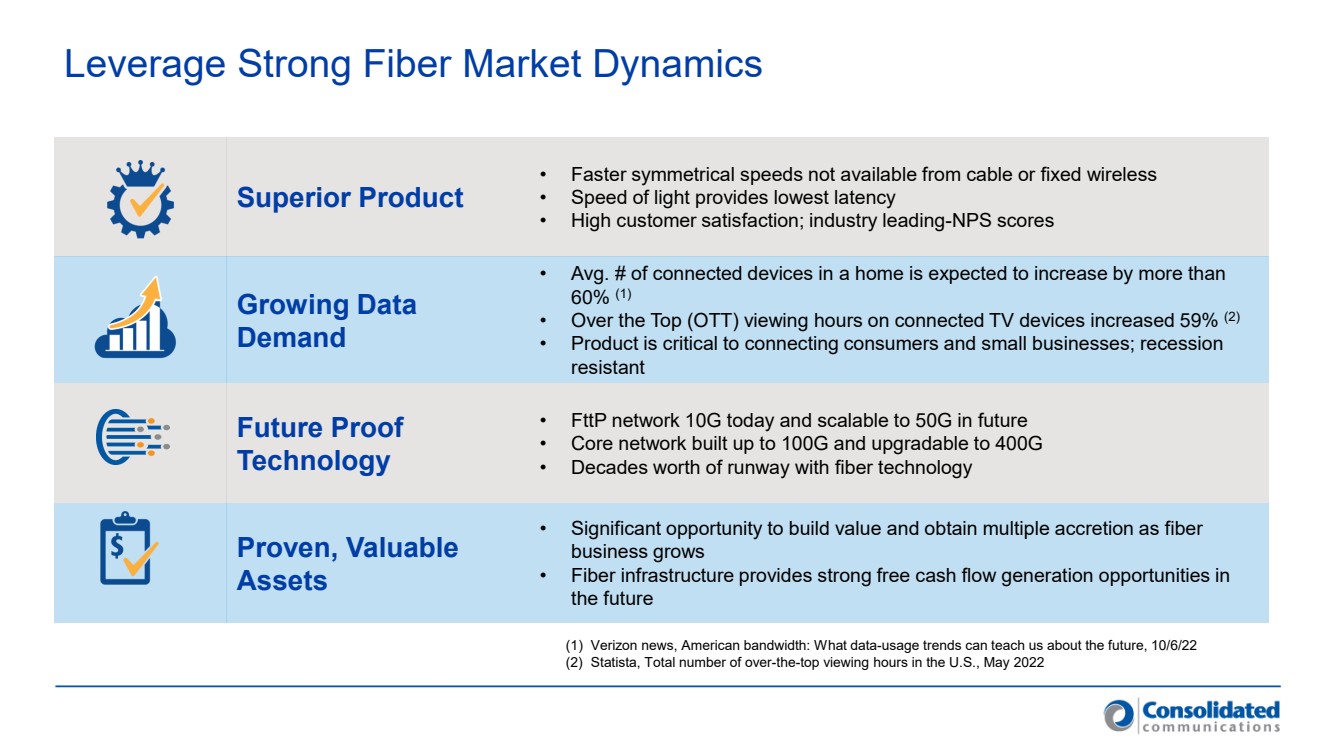
| Leverage Strong Fiber Market Dynamics Superior Product • Faster symmetrical speeds not available from cable or fixed wireless • Speed of light provides lowest latency • High customer satisfaction; industry leading-NPS scores Growing Data Demand • Avg. # of connected devices in a home is expected to increase by more than 60% (1) • Over the Top (OTT) viewing hours on connected TV devices increased 59% (2) • Product is critical to connecting consumers and small businesses; recession resistant Future Proof Technology • FttP network 10G today and scalable to 50G in future • Core network built up to 100G and upgradable to 400G • Decades worth of runway with fiber technology Proven, Valuable Assets • Significant opportunity to build value and obtain multiple accretion as fiber business grows • Fiber infrastructure provides strong free cash flow generation opportunities in the future (1) Verizon news, American bandwidth: What data-usage trends can teach us about the future, 10/6/22 (2) Statista, Total number of over-the-top viewing hours in the U.S., May 2022 |
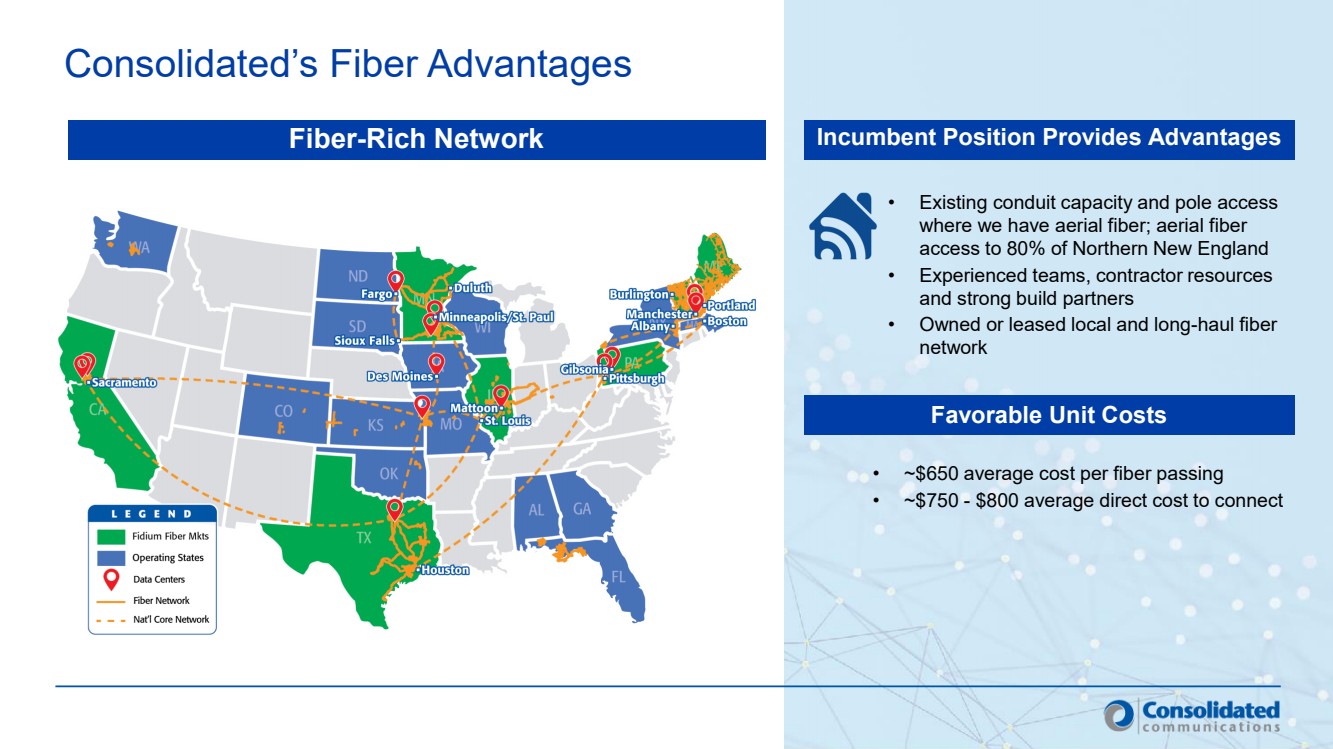
| Consolidated’s Fiber Advantages • Existing conduit capacity and pole access where we have aerial fiber; aerial fiber access to 80% of Northern New England • Experienced teams, contractor resources and strong build partners • Owned or leased local and long-haul fiber network Fiber-Rich Network Incumbent Position Provides Advantages Favorable Unit Costs • ~$650 average cost per fiber passing • ~$750 - $800 average direct cost to connect |
| Q422 and FY22 Highlights |
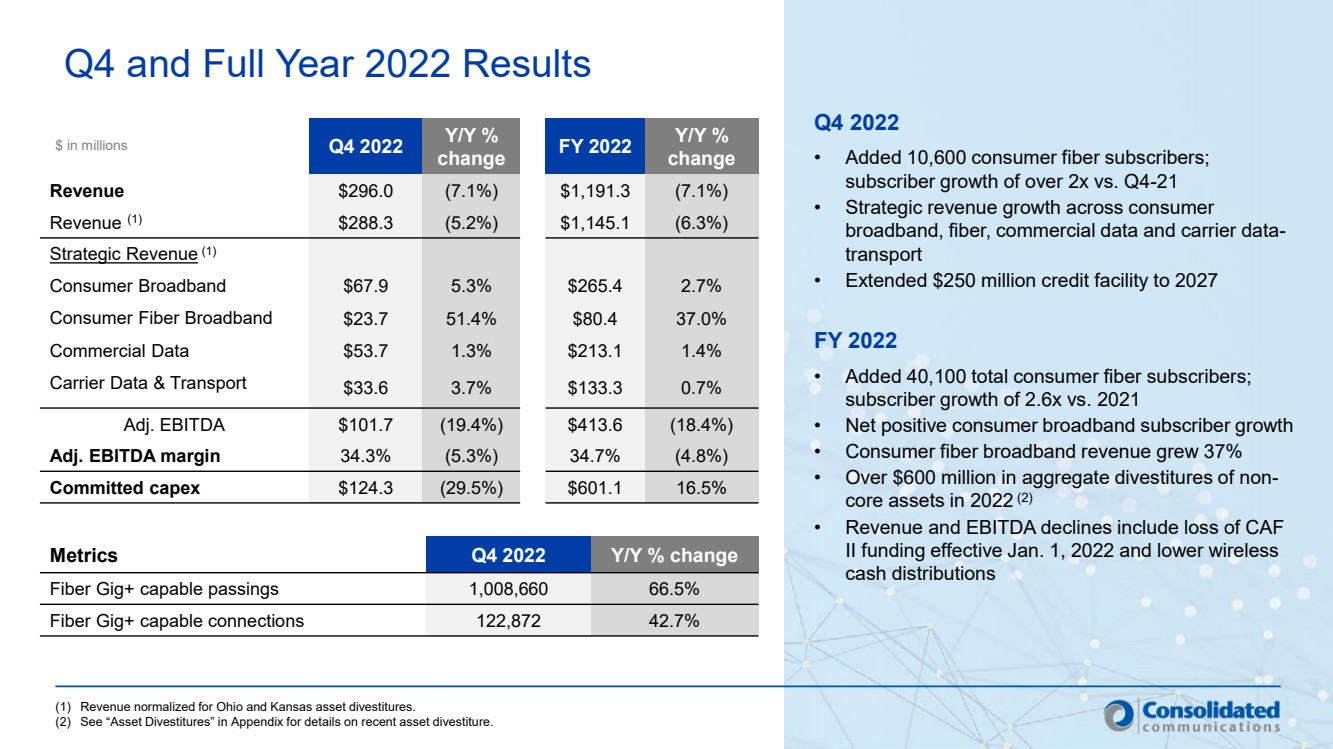
| Q4 2022 Y/Y % change FY 2022 Y/Y % change Revenue $296.0 (7.1%) $1,191.3 (7.1%) Revenue (1) $288.3 (5.2%) $1,145.1 (6.3%) Strategic Revenue (1) Consumer Broadband $67.9 5.3% $265.4 2.7% Consumer Fiber Broadband $23.7 51.4% $80.4 37.0% Commercial Data $53.7 1.3% $213.1 1.4% Carrier Data & Transport $33.6 3.7% $133.3 0.7% Adj. EBITDA $101.7 (19.4%) $413.6 (18.4%) Adj. EBITDA margin 34.3% (5.3%) 34.7% (4.8%) Committed capex $124.3 (29.5%) $601.1 16.5% Q4 and Full Year 2022 Results $ in millions Metrics Q4 2022 Y/Y % change Fiber Gig+ capable passings 1,008,660 66.5% Fiber Gig+ capable connections 122,872 42.7% (1) Revenue normalized for Ohio and Kansas asset divestitures. (2) See “Asset Divestitures” in Appendix for details on recent asset divestiture. Q4 2022 • Added 10,600 consumer fiber subscribers; subscriber growth of over 2x vs. Q4-21 • Strategic revenue growth across consumer broadband, fiber, commercial data and carrier data-transport • Extended $250 million credit facility to 2027 FY 2022 • Added 40,100 total consumer fiber subscribers; subscriber growth of 2.6x vs. 2021 • Net positive consumer broadband subscriber growth • Consumer fiber broadband revenue grew 37% • Over $600 million in aggregate divestitures of non-core assets in 2022 (2) • Revenue and EBITDA declines include loss of CAF II funding effective Jan. 1, 2022 and lower wireless cash distributions |
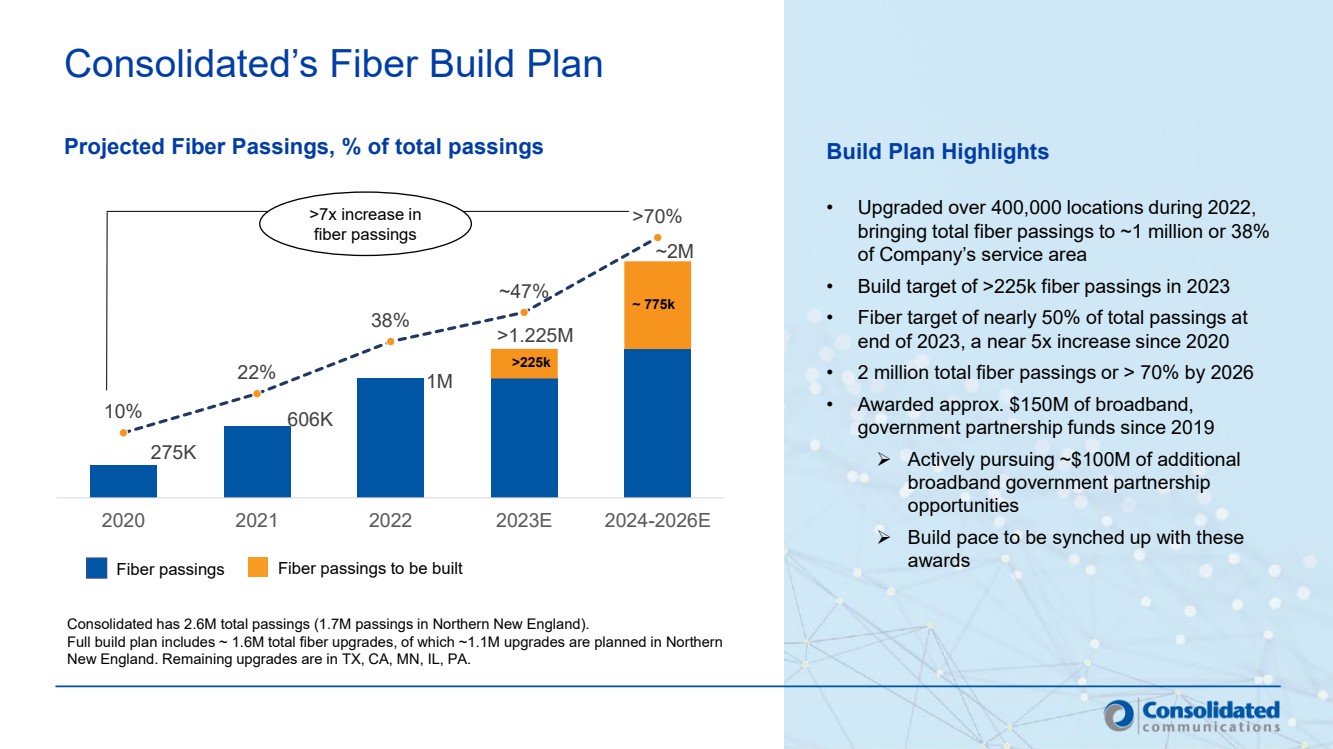
| Consolidated’s Fiber Build Plan Projected Fiber Passings, % of total passings Build Plan Highlights • Upgraded over 400,000 locations during 2022, bringing total fiber passings to ~1 million or 38% of Company’s service area • Build target of >225k fiber passings in 2023 • Fiber target of nearly 50% of total passings at end of 2023, a near 5x increase since 2020 • 2 million total fiber passings or > 70% by 2026 • Awarded approx. $150M of broadband, government partnership funds since 2019 Actively pursuing ~$100M of additional broadband government partnership opportunities Build pace to be synched up with these awards Consolidated has 2.6M total passings (1.7M passings in Northern New England). Full build plan includes ~ 1.6M total fiber upgrades, of which ~1.1M upgrades are planned in Northern New England. Remaining upgrades are in TX, CA, MN, IL, PA. >7x increase in fiber passings Fiber passings Fiber passings to be built 10% 22% 38% ~47% >70% 275K 606K 1M >1.225M ~2M 2020 2021 2022 2023E 2024-2026E ~ 775k >225k |
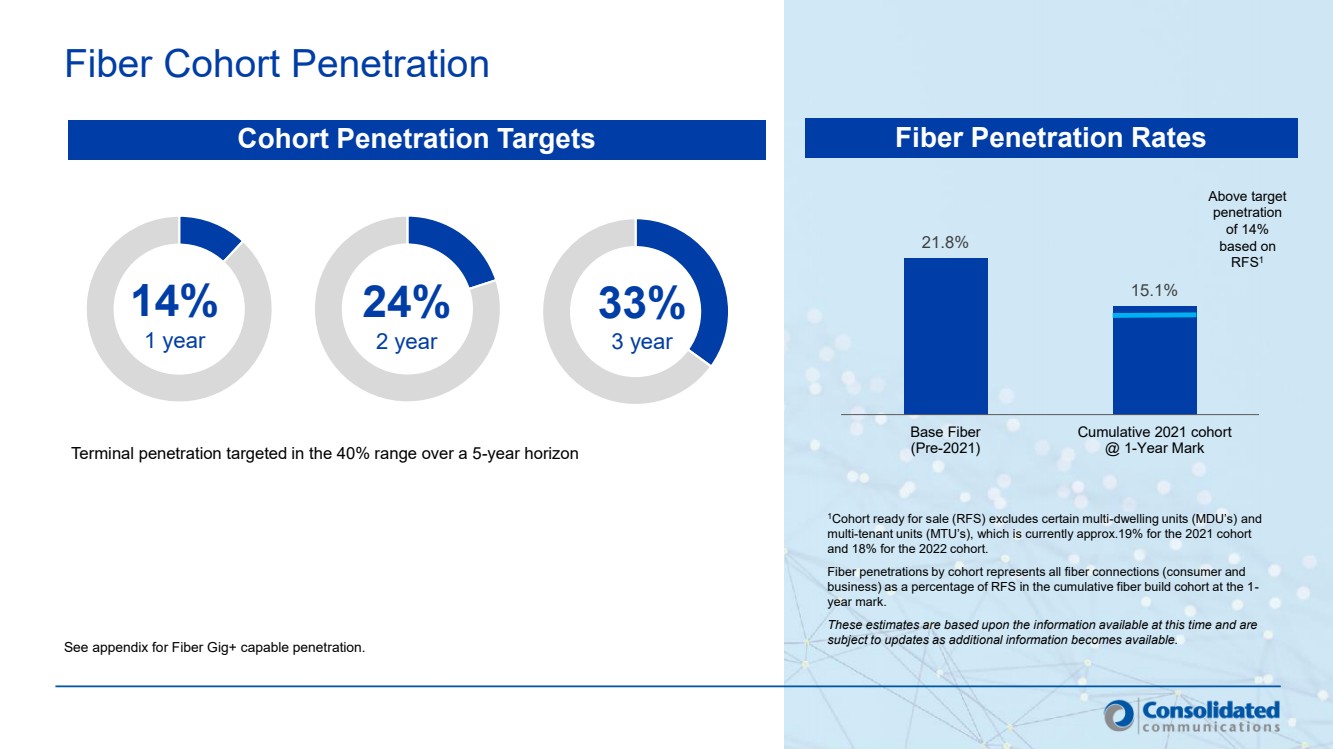
| Fiber Cohort Penetration Cohort Penetration Targets 14% 1 year 24% 2 year 33% 3 year See appendix for Fiber Gig+ capable penetration. Terminal penetration targeted in the 40% range over a 5-year horizon Fiber Penetration Rates 21.8% 15.1% Base Fiber (Pre-2021) Cumulative 2021 cohort @ 1-Year Mark 1Cohort ready for sale (RFS) excludes certain multi-dwelling units (MDU’s) and multi-tenant units (MTU’s), which is currently approx.19% for the 2021 cohort and 18% for the 2022 cohort. Fiber penetrations by cohort represents all fiber connections (consumer and business) as a percentage of RFS in the cumulative fiber build cohort at the 1- year mark. These estimates are based upon the information available at this time and are subject to updates as additional information becomes available. Above target penetration of 14% based on RFS1 |
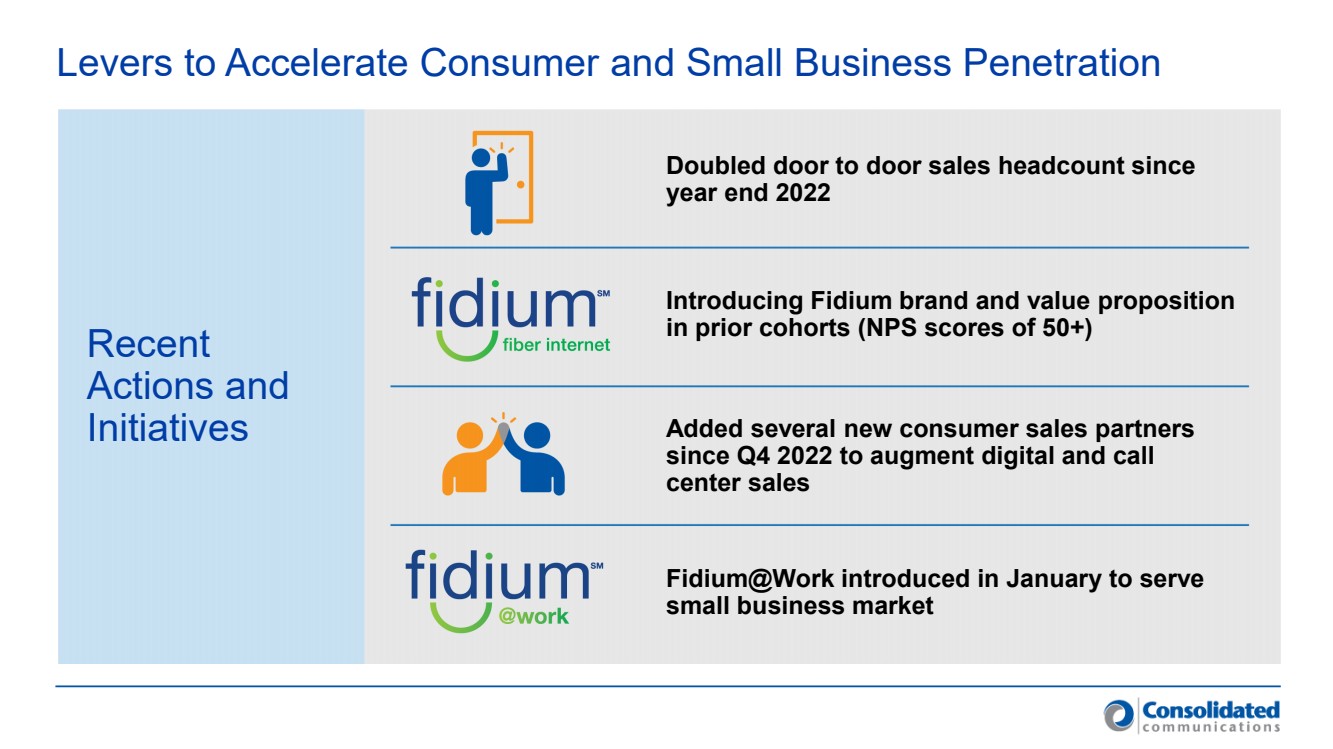
| Levers to Accelerate Consumer and Small Business Penetration Doubled door to door sales headcount since year end 2022 Introducing Fidium brand and value proposition in prior cohorts (NPS scores of 50+) Added several new consumer sales partners since Q4 2022 to augment digital and call center sales Fidium@Work introduced in January to serve small business market Recent Actions and Initiatives |
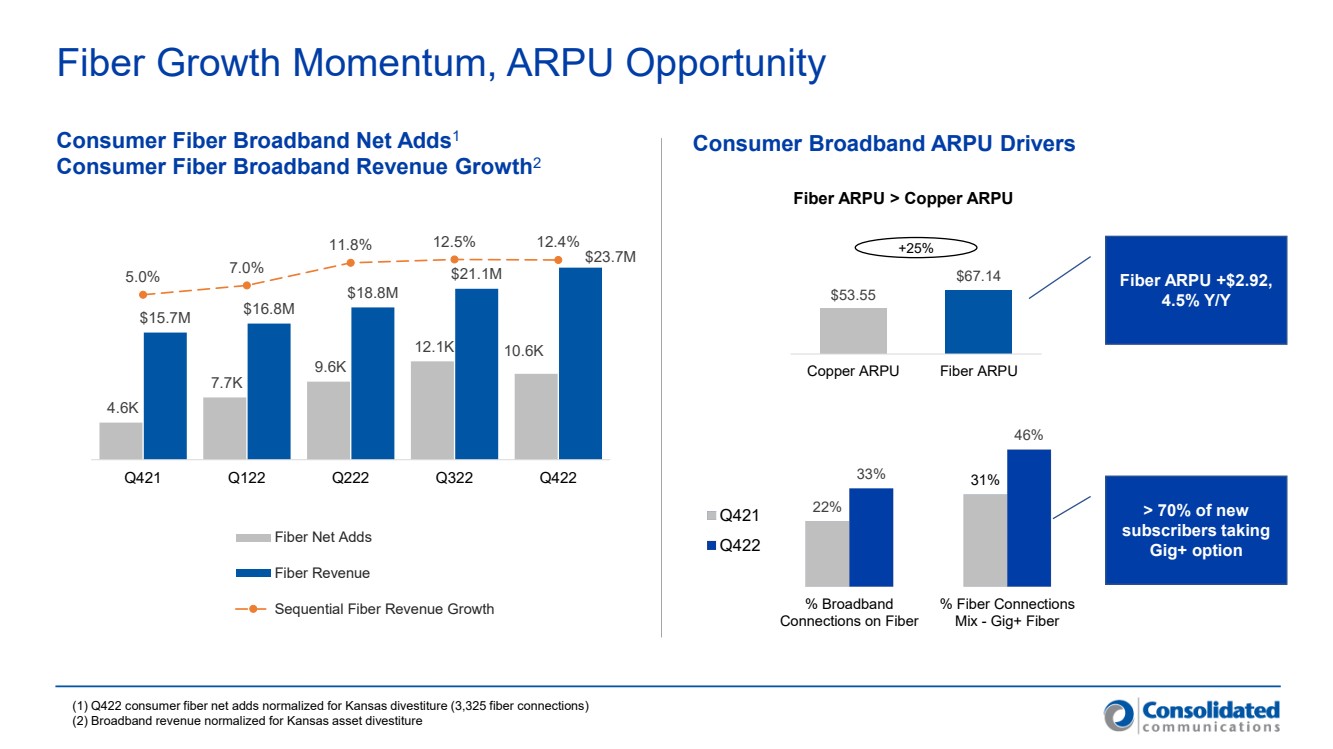
| Fiber Growth Momentum, ARPU Opportunity Consumer Fiber Broadband Net Adds1 Consumer Fiber Broadband Revenue Growth2 $53.55 $67.14 Copper ARPU Fiber ARPU Fiber ARPU > Copper ARPU +25% Consumer Broadband ARPU Drivers 22% 33% 31% 46% % Broadband Connections on Fiber % Fiber Connections Mix - Gig+ Fiber Q421 Q422 > 70% of new subscribers taking Gig+ option Fiber ARPU +$2.92, 4.5% Y/Y 4.6K 7.7K 9.6K 12.1K 10.6K $15.7M $16.8M $18.8M $21.1M $23.7M 5.0% 7.0% 11.8% 12.5% 12.4% -30.0% -25.0% -20.0% -15.0% -10.0% -5.0% 0.0% 5.0% 10.0% - 5.0K 10.0K 15.0K 20.0K 25.0K Q421 Q122 Q222 Q322 Q422 Fiber Net Adds Fiber Revenue Sequential Fiber Revenue Growth (1) Q422 consumer fiber net adds normalized for Kansas divestiture (3,325 fiber connections) (2) Broadband revenue normalized for Kansas asset divestiture |
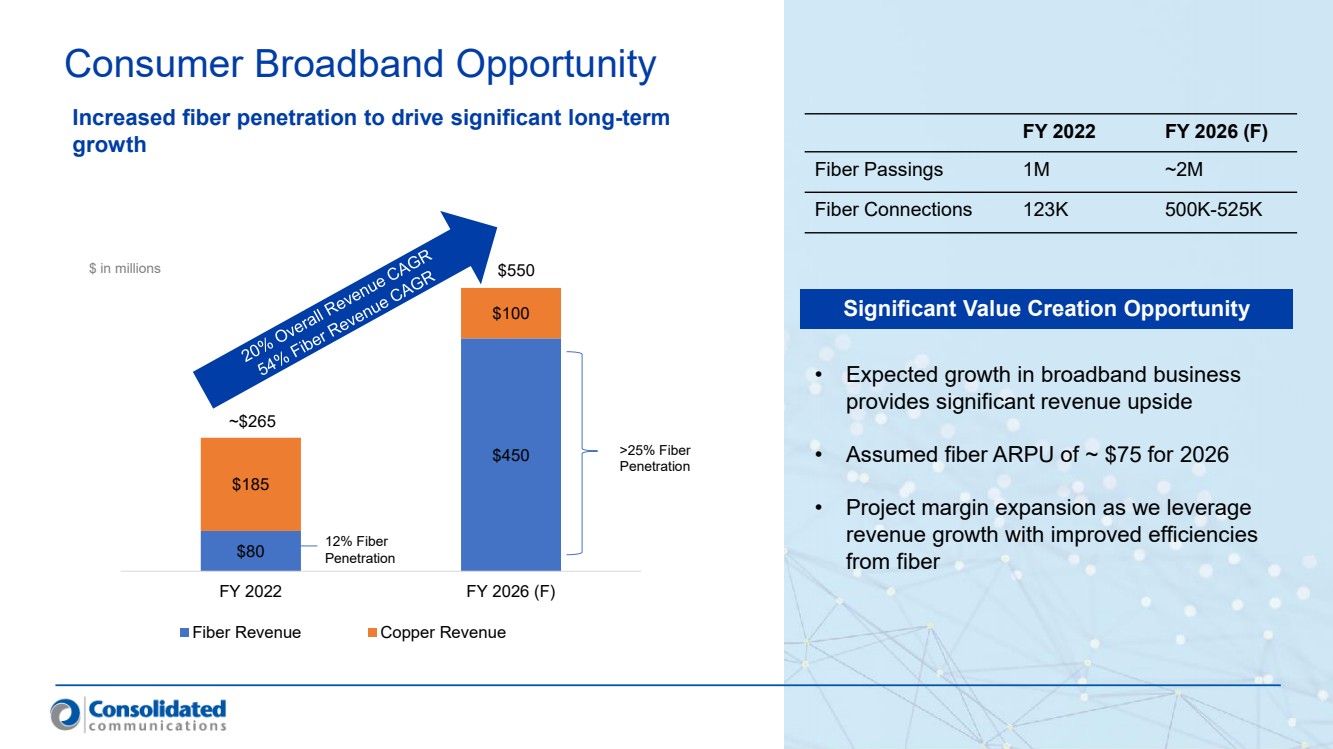
| $80 $450 $185 $100 FY 2022 FY 2026 (F) Fiber Revenue Copper Revenue Consumer Broadband Opportunity • Expected growth in broadband business provides significant revenue upside • Assumed fiber ARPU of ~ $75 for 2026 • Project margin expansion as we leverage revenue growth with improved efficiencies from fiber Increased fiber penetration to drive significant long-term growth $ in millions 12% Fiber Penetration >25% Fiber Penetration $550 ~$265 FY 2022 FY 2026 (F) Fiber Passings 1M ~2M Fiber Connections 123K 500K-525K Significant Value Creation Opportunity |
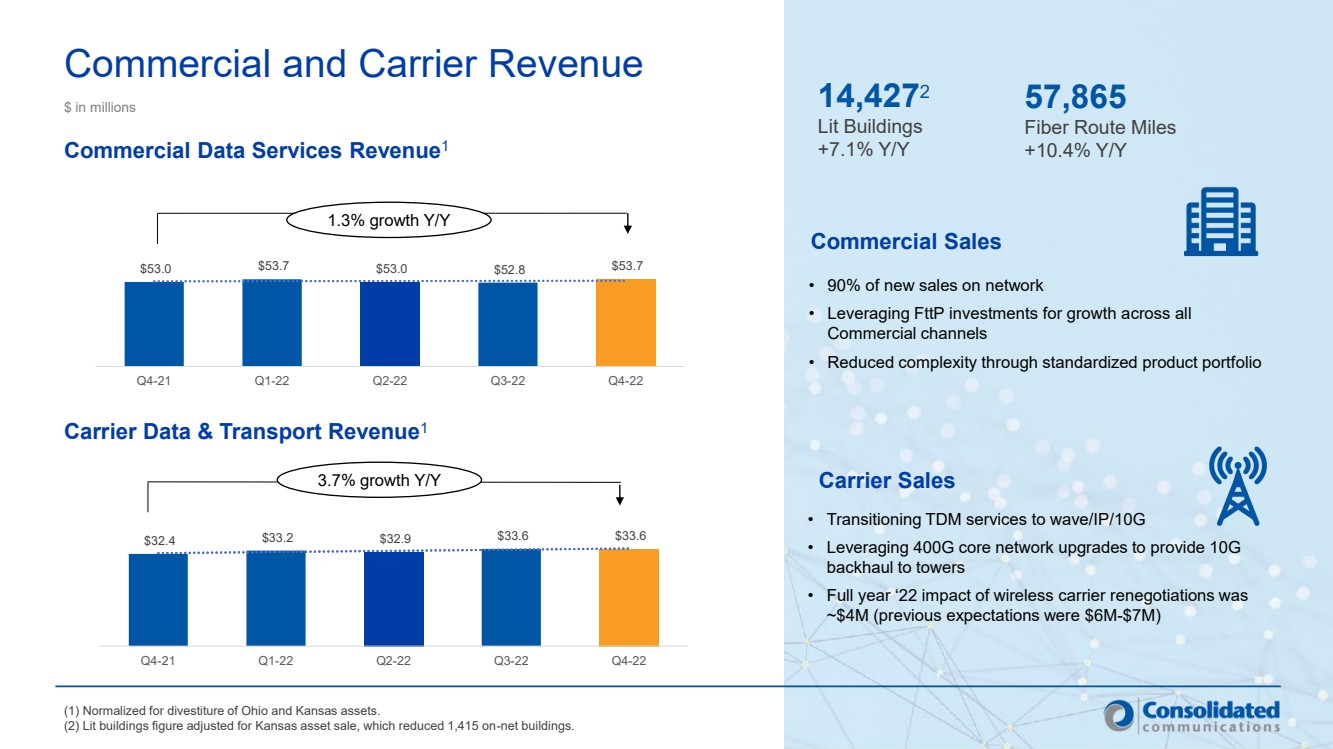
| Commercial and Carrier Revenue $ in millions Commercial Data Services Revenue1 Carrier Data & Transport Revenue1 • 90% of new sales on network • Leveraging FttP investments for growth across all Commercial channels • Reduced complexity through standardized product portfolio 14,4272 Lit Buildings +7.1% Y/Y 57,865 Fiber Route Miles +10.4% Y/Y • Transitioning TDM services to wave/IP/10G • Leveraging 400G core network upgrades to provide 10G backhaul to towers • Full year ‘22 impact of wireless carrier renegotiations was ~$4M (previous expectations were $6M-$7M) Commercial Sales Carrier Sales 1.3% growth Y/Y 3.7% growth Y/Y (1) Normalized for divestiture of Ohio and Kansas assets. (2) Lit buildings figure adjusted for Kansas asset sale, which reduced 1,415 on-net buildings. $53.0 $53.7 $53.0 $52.8 $53.7 Q4-21 Q1-22 Q2-22 Q3-22 Q4-22 $32.4 $33.2 $32.9 $33.6 $33.6 Q4-21 Q1-22 Q2-22 Q3-22 Q4-22 |
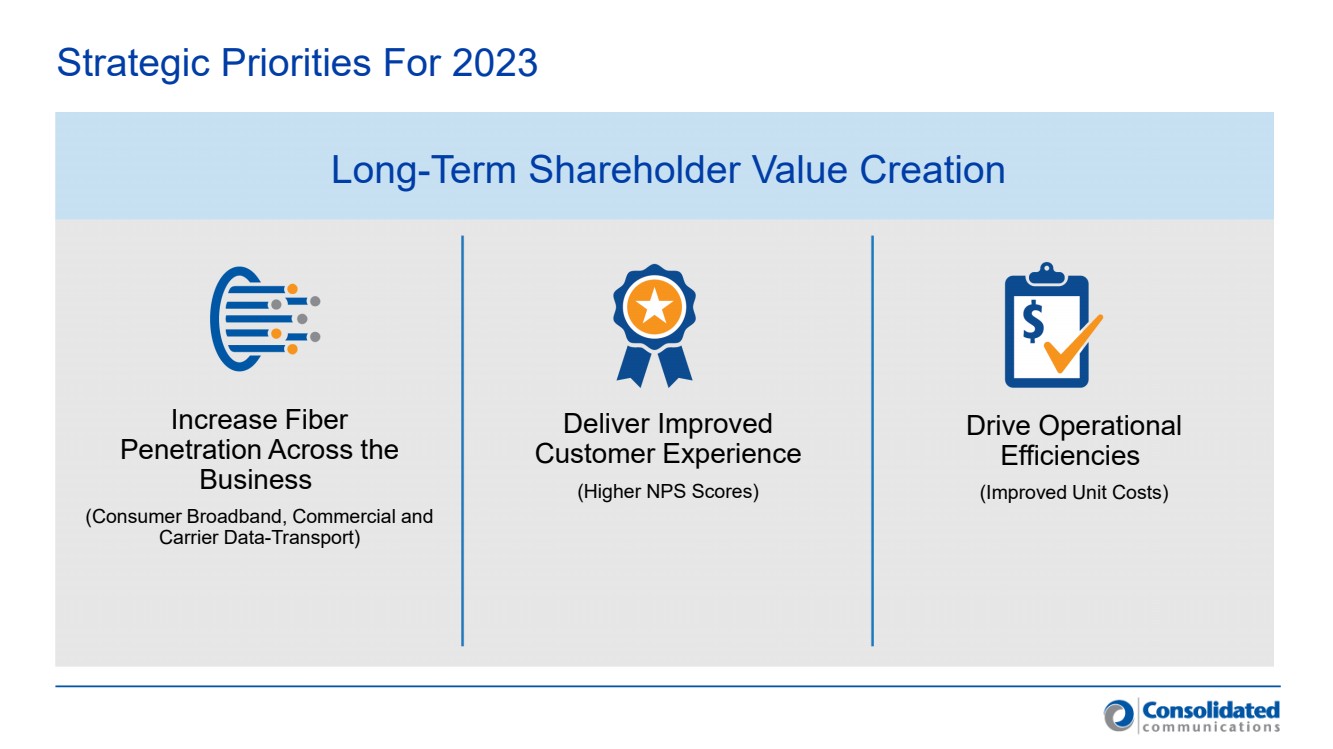
| Strategic Priorities For 2023 Increase Fiber Penetration Across the Business (Consumer Broadband, Commercial and Carrier Data-Transport) Deliver Improved Customer Experience (Higher NPS Scores) Drive Operational Efficiencies (Improved Unit Costs) Long-Term Shareholder Value Creation |
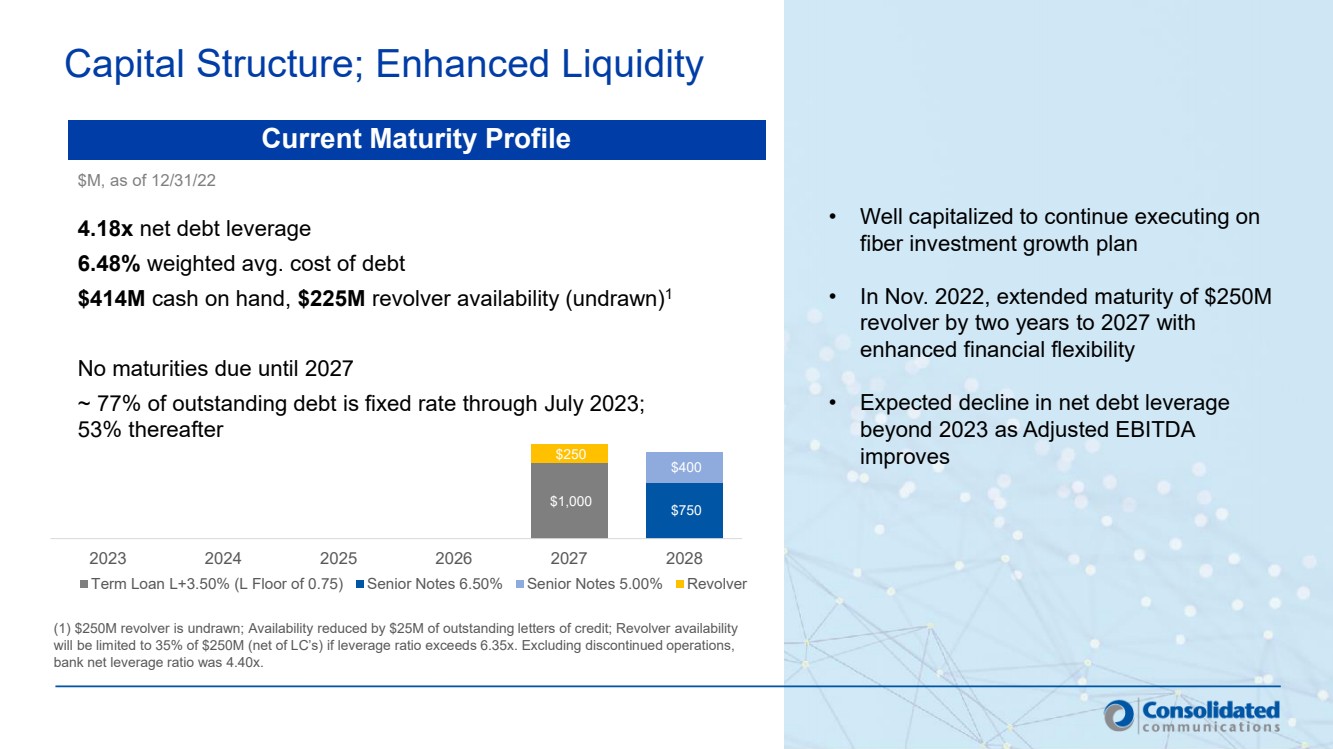
| Capital Structure; Enhanced Liquidity Current Maturity Profile • Well capitalized to continue executing on fiber investment growth plan • In Nov. 2022, extended maturity of $250M revolver by two years to 2027 with enhanced financial flexibility • Expected decline in net debt leverage beyond 2023 as Adjusted EBITDA improves (1) $250M revolver is undrawn; Availability reduced by $25M of outstanding letters of credit; Revolver availability will be limited to 35% of $250M (net of LC’s) if leverage ratio exceeds 6.35x. Excluding discontinued operations, bank net leverage ratio was 4.40x. $M, as of 12/31/22 4.18x net debt leverage 6.48% weighted avg. cost of debt $414M cash on hand, $225M revolver availability (undrawn)1 No maturities due until 2027 ~ 77% of outstanding debt is fixed rate through July 2023; 53% thereafter $1,000 $750 $400 $250 2023 2024 2025 2026 2027 2028 Term Loan L+3.50% (L Floor of 0.75) Senior Notes 6.50% Senior Notes 5.00% Revolver |
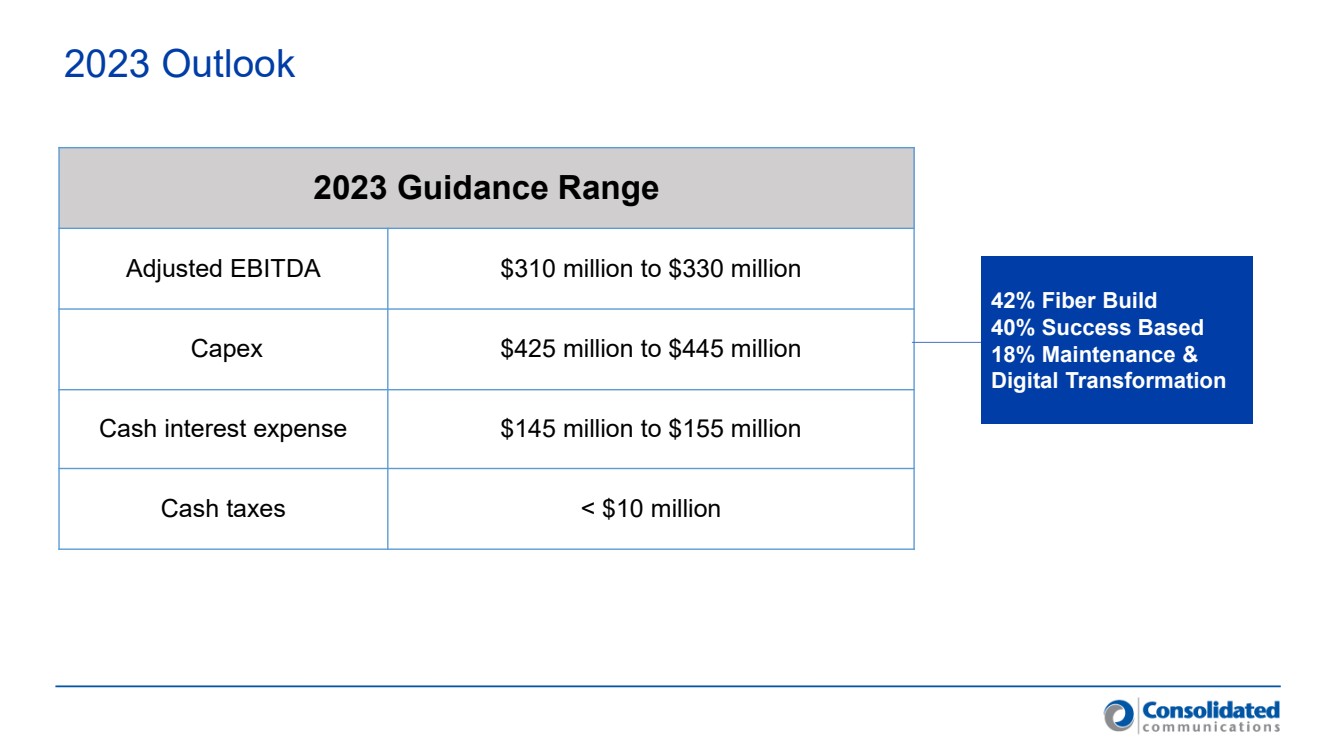
| 2023 Outlook 2023 Guidance Range Adjusted EBITDA $310 million to $330 million Capex $425 million to $445 million Cash interest expense $145 million to $155 million Cash taxes < $10 million 42% Fiber Build 40% Success Based 18% Maintenance & Digital Transformation |
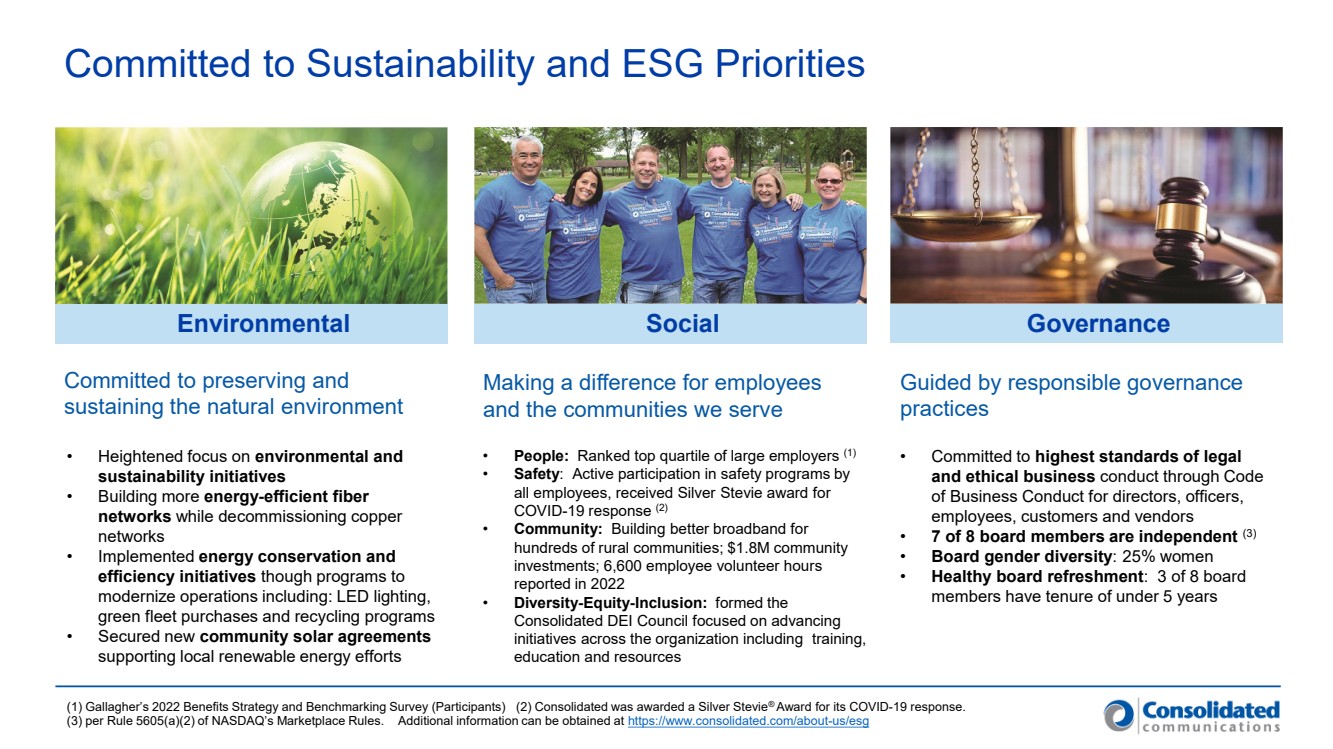
| Committed to Sustainability and ESG Priorities Social Governance • Heightened focus on environmental and sustainability initiatives • Building more energy-efficient fiber networks while decommissioning copper networks • Implemented energy conservation and efficiency initiatives though programs to modernize operations including: LED lighting, green fleet purchases and recycling programs • Secured new community solar agreements supporting local renewable energy efforts • Committed to highest standards of legal and ethical business conduct through Code of Business Conduct for directors, officers, employees, customers and vendors • 7 of 8 board members are independent (3) • Board gender diversity: 25% women • Healthy board refreshment: 3 of 8 board members have tenure of under 5 years • People: Ranked top quartile of large employers (1) • Safety: Active participation in safety programs by all employees, received Silver Stevie award for COVID-19 response (2) • Community: Building better broadband for hundreds of rural communities; $1.8M community investments; 6,600 employee volunteer hours reported in 2022 • Diversity-Equity-Inclusion: formed the Consolidated DEI Council focused on advancing initiatives across the organization including training, education and resources (1) Gallagher’s 2022 Benefits Strategy and Benchmarking Survey (Participants) (2) Consolidated was awarded a Silver Stevie® Award for its COVID-19 response. (3) per Rule 5605(a)(2) of NASDAQ’s Marketplace Rules. Additional information can be obtained at https://www.consolidated.com/about-us/esg Committed to preserving and sustaining the natural environment Making a difference for employees and the communities we serve Guided by responsible governance practices Environmental |
| Appendix |
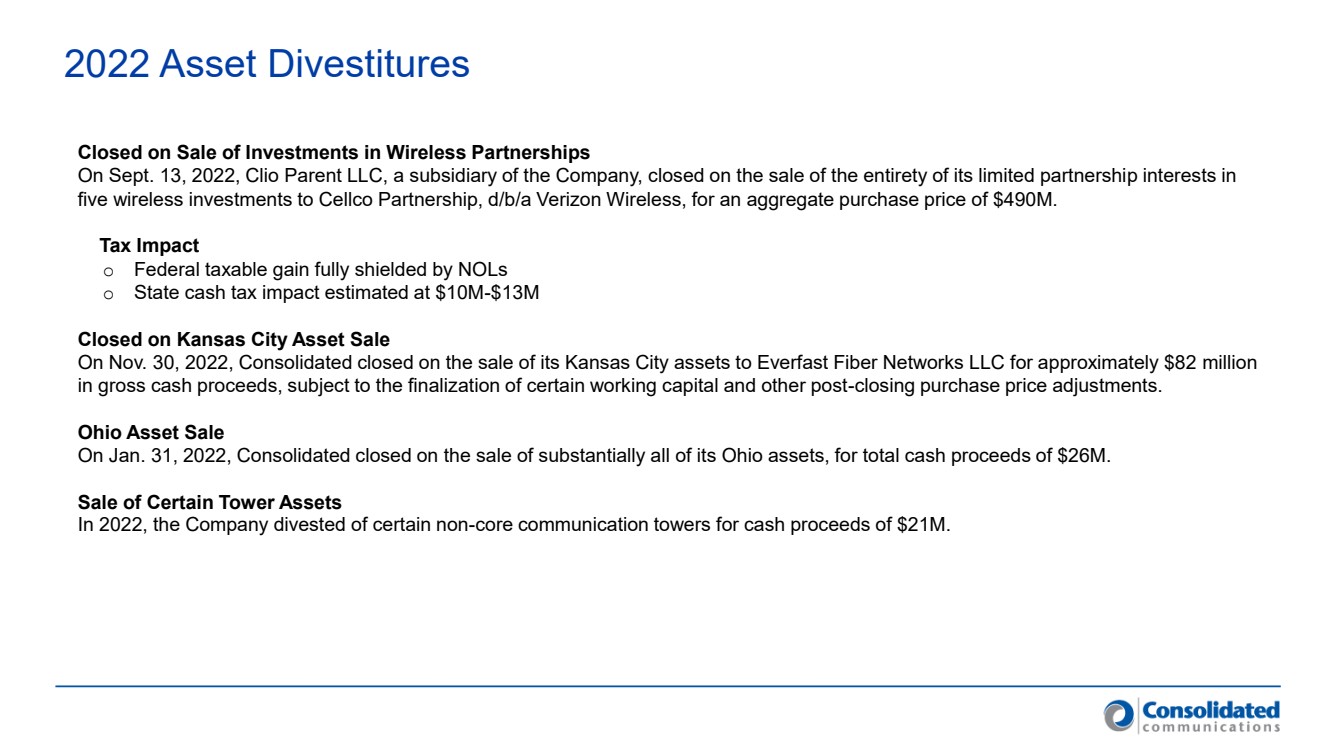
| 2022 Asset Divestitures Closed on Sale of Investments in Wireless Partnerships On Sept. 13, 2022, Clio Parent LLC, a subsidiary of the Company, closed on the sale of the entirety of its limited partnership interests in five wireless investments to Cellco Partnership, d/b/a Verizon Wireless, for an aggregate purchase price of $490M. Tax Impact o Federal taxable gain fully shielded by NOLs o State cash tax impact estimated at $10M-$13M Closed on Kansas City Asset Sale On Nov. 30, 2022, Consolidated closed on the sale of its Kansas City assets to Everfast Fiber Networks LLC for approximately $82 million in gross cash proceeds, subject to the finalization of certain working capital and other post-closing purchase price adjustments. Ohio Asset Sale On Jan. 31, 2022, Consolidated closed on the sale of substantially all of its Ohio assets, for total cash proceeds of $26M. Sale of Certain Tower Assets In 2022, the Company divested of certain non-core communication towers for cash proceeds of $21M. |
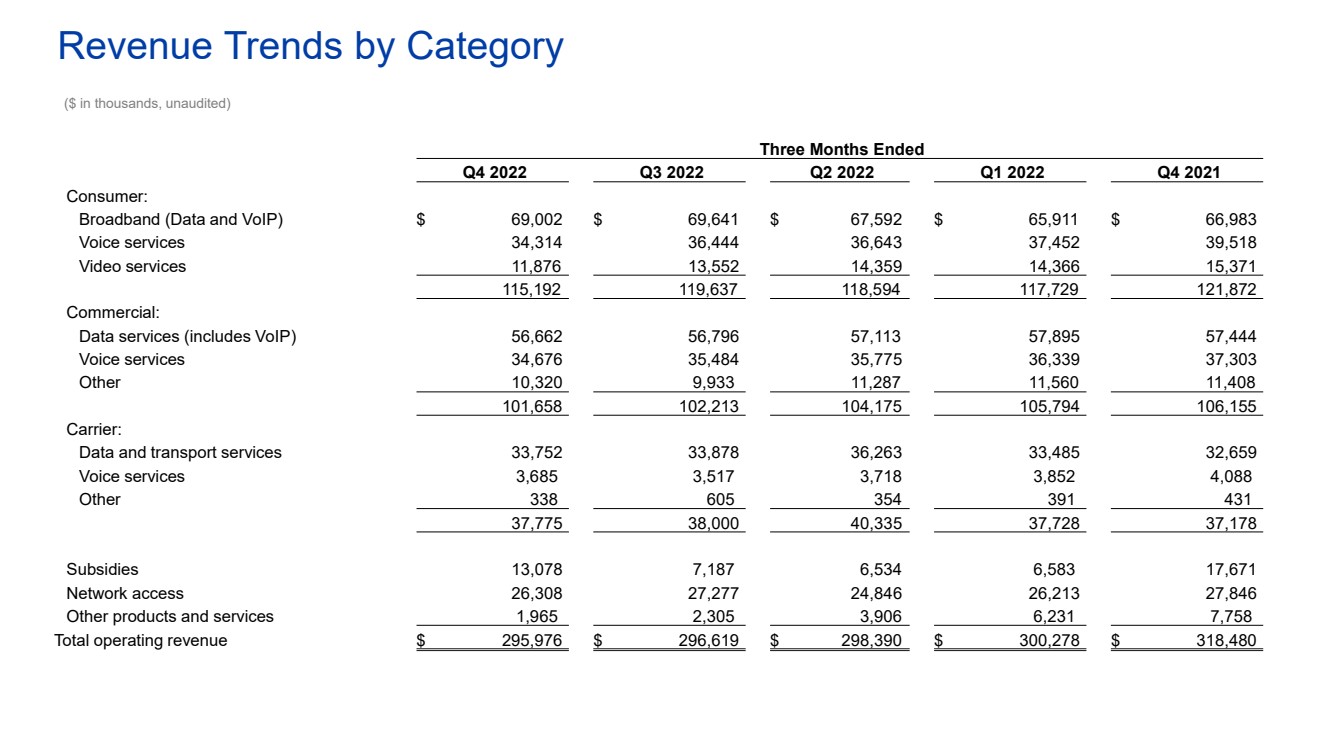
| Revenue Trends by Category ($ in thousands, unaudited) Three Months Ended Q4 2022 Q3 2022 Q2 2022 Q1 2022 Q4 2021 Consumer: Broadband (Data and VoIP) $ 69,002 $ 69,641 $ 67,592 $ 65,911 $ 66,983 Voice services 34,314 36,444 36,643 37,452 39,518 Video services 11,876 13,552 14,359 14,366 15,371 115,192 119,637 118,594 117,729 121,872 Commercial: Data services (includes VoIP) 56,662 56,796 57,113 57,895 57,444 Voice services 34,676 35,484 35,775 36,339 37,303 Other 10,320 9,933 11,287 11,560 11,408 101,658 102,213 104,175 105,794 106,155 Carrier: Data and transport services 33,752 33,878 36,263 33,485 32,659 Voice services 3,685 3,517 3,718 3,852 4,088 Other 338 605 354 391 431 37,775 38,000 40,335 37,728 37,178 Subsidies 13,078 7,187 6,534 6,583 17,671 Network access 26,308 27,277 24,846 26,213 27,846 Other products and services 1,965 2,305 3,906 6,231 7,758 Total operating revenue $ 295,976 $ 296,619 $ 298,390 $ 300,278 $ 318,480 |
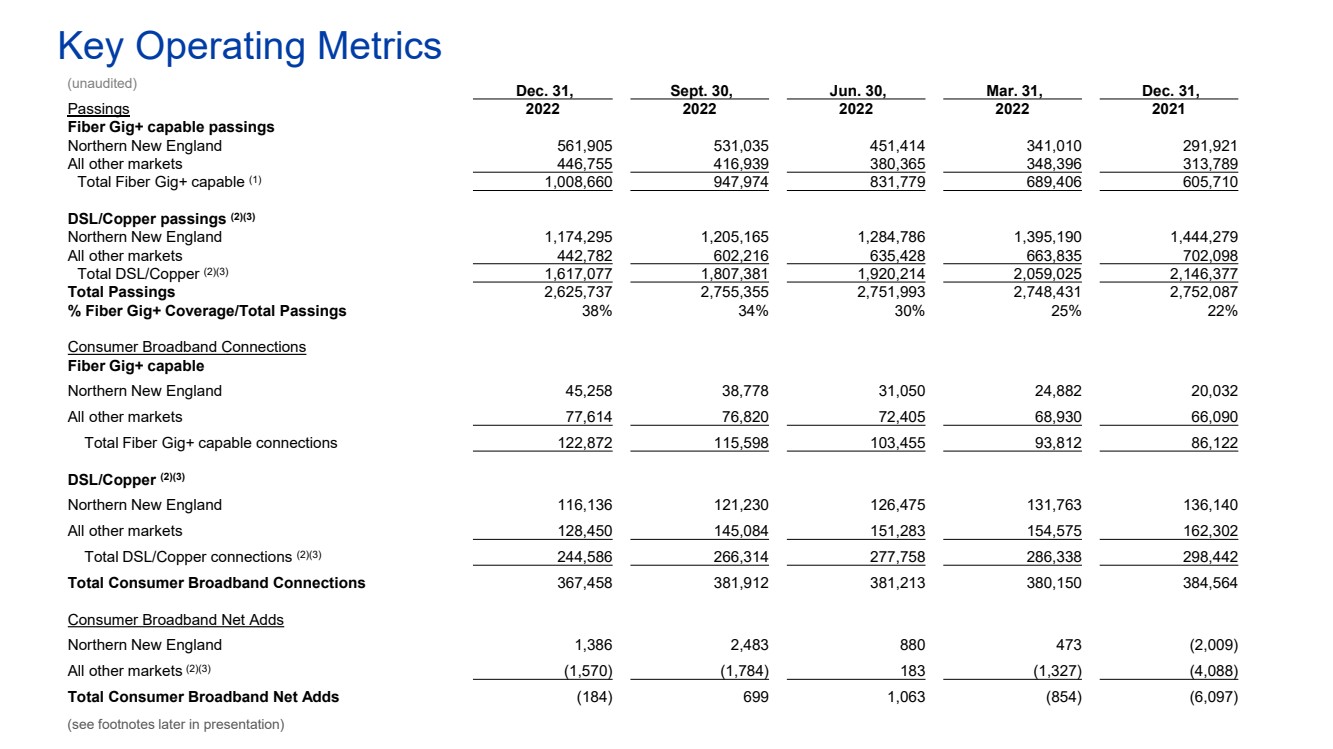
| Key Operating Metrics (unaudited) Dec. 31, Sept. 30, Jun. 30, Mar. 31, Dec. 31, Passings 2022 2022 2022 2022 2021 Fiber Gig+ capable passings Northern New England 561,905 531,035 451,414 341,010 291,921 All other markets 446,755 416,939 380,365 348,396 313,789 Total Fiber Gig+ capable (1) 1,008,660 947,974 831,779 689,406 605,710 DSL/Copper passings (2)(3) Northern New England 1,174,295 1,205,165 1,284,786 1,395,190 1,444,279 All other markets 442,782 602,216 635,428 663,835 702,098 Total DSL/Copper (2)(3) 1,617,077 1,807,381 1,920,214 2,059,025 2,146,377 Total Passings 2,625,737 2,755,355 2,751,993 2,748,431 2,752,087 % Fiber Gig+ Coverage/Total Passings 38% 34% 30% 25% 22% Consumer Broadband Connections Fiber Gig+ capable Northern New England 45,258 38,778 31,050 24,882 20,032 All other markets 77,614 76,820 72,405 68,930 66,090 Total Fiber Gig+ capable connections 122,872 115,598 103,455 93,812 86,122 DSL/Copper (2)(3) Northern New England 116,136 121,230 126,475 131,763 136,140 All other markets 128,450 145,084 151,283 154,575 162,302 Total DSL/Copper connections (2)(3) 244,586 266,314 277,758 286,338 298,442 Total Consumer Broadband Connections 367,458 381,912 381,213 380,150 384,564 Consumer Broadband Net Adds Northern New England 1,386 2,483 880 473 (2,009) All other markets (2)(3) (1,570) (1,784) 183 (1,327) (4,088) Total Consumer Broadband Net Adds (184) 699 1,063 (854) (6,097) (see footnotes later in presentation) |
| Key Operating Metrics Dec. 31, Sept. 30, Jun. 30, Mar. 31, Dec. 31, Consumer Broadband Penetration % 2022 2022 2022 2022 2021 Fiber Gig+ capable Northern New England 8% 7% 7% 7% 7% All other markets 17% 18% 19% 20% 21% Total Fiber Gig+ capable (3) 12% 12% 12% 14% 14% DSL/Copper (2)(3) Northern New England 10% 10% 10% 9% 9% All other markets 29% 24% 24% 23% 23% Total DSL/Copper (2)(3) 15% 15% 14% 14% 14% Total Consumer Broadband Penetration % 14% 14% 14% 14% 14% Consumer Broadband Revenue by Service Type ($ in thousands) Fiber Broadband Revenue (4) $ 24,016 $ 21,558 $ 19,218 $ 17,241 $ 16,152 Copper and Other Broadband Revenue 44,986 48,083 48,374 48,670 50,831 Total Consumer Broadband Revenue by Service Type $ 69,002 $ 69,641 $ 67,592 $ 65,911 $ 66,983 Consumer Average Revenue Per Unit (ARPU) Fiber Broadband ARPU $ 67.14 $ 65.61 $ 64.95 $ 63.88 $ 64.22 Copper Broadband ARPU $ 53.55 $ 53.87 $ 52.36 $ 50.78 $ 50.65 Consumer Voice Connections (3) 276,779 294,441 306,458 316,634 328,849 Video Connections (3) 35,039 51,339 55,225 58,812 63,447 Fiber route network miles (long-haul, metro and FttP) 57,865 57,498 56,093 54,239 52,402 On-net buildings (3) 14,427 15,715 15,618 15,446 14,891 (see footnotes later in presentation) (unaudited) |

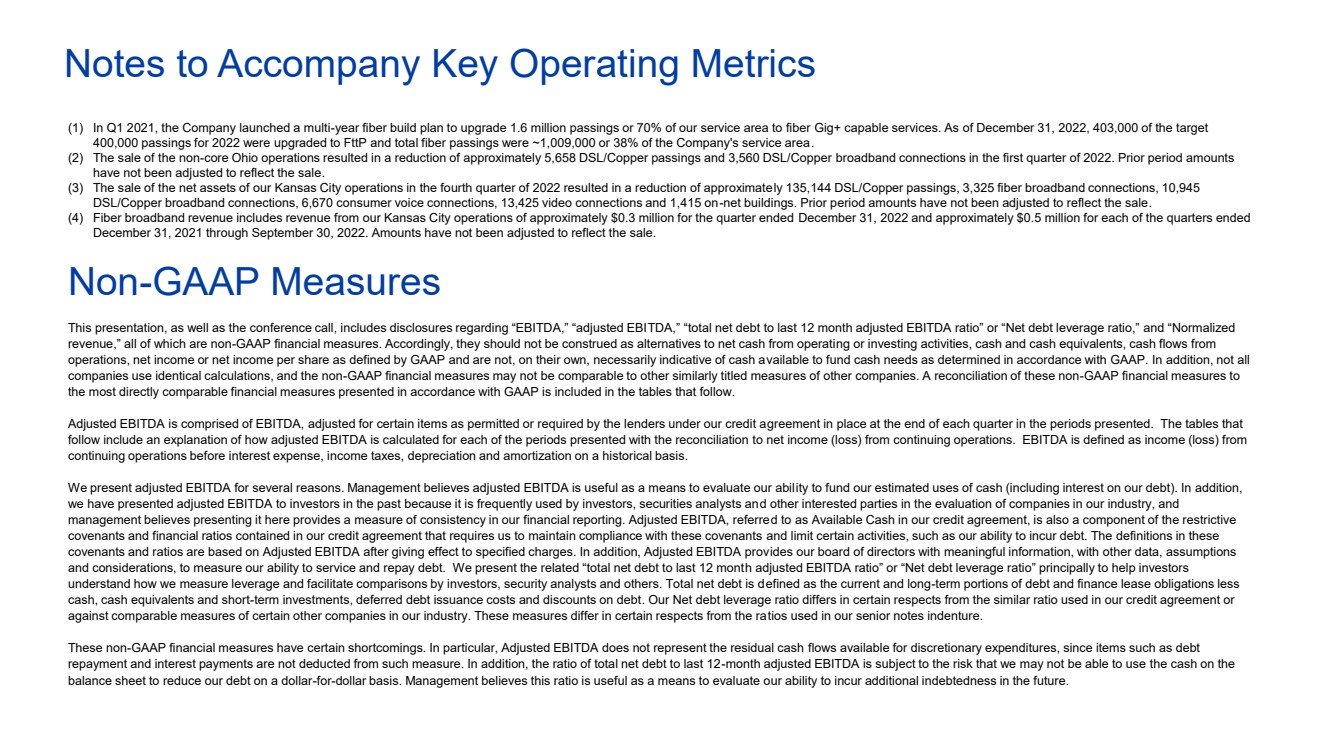
| Notes to Accompany Key Operating Metrics (1) In Q1 2021, the Company launched a multi-year fiber build plan to upgrade 1.6 million passings or 70% of our service area to fiber Gig+ capable services. As of December 31, 2022, 403,000 of the target 400,000 passings for 2022 were upgraded to FttP and total fiber passings were ~1,009,000 or 38% of the Company's service area. (2) The sale of the non-core Ohio operations resulted in a reduction of approximately 5,658 DSL/Copper passings and 3,560 DSL/Copper broadband connections in the first quarter of 2022. Prior period amounts have not been adjusted to reflect the sale. (3) The sale of the net assets of our Kansas City operations in the fourth quarter of 2022 resulted in a reduction of approximately 135,144 DSL/Copper passings, 3,325 fiber broadband connections, 10,945 DSL/Copper broadband connections, 6,670 consumer voice connections, 13,425 video connections and 1,415 on-net buildings. Prior period amounts have not been adjusted to reflect the sale. (4) Fiber broadband revenue includes revenue from our Kansas City operations of approximately $0.3 million for the quarter ended December 31, 2022 and approximately $0.5 million for each of the quarters ended December 31, 2021 through September 30, 2022. Amounts have not been adjusted to reflect the sale. Non-GAAP Measures This presentation, as well as the conference call, includes disclosures regarding “EBITDA,” “adjusted EBITDA,” “total net debt to last 12 month adjusted EBITDA ratio” or “Net debt leverage ratio,” and “Normalized revenue,” all of which are non-GAAP financial measures. Accordingly, they should not be construed as alternatives to net cash from operating or investing activities, cash and cash equivalents, cash flows from operations, net income or net income per share as defined by GAAP and are not, on their own, necessarily indicative of cash available to fund cash needs as determined in accordance with GAAP. In addition, not all companies use identical calculations, and the non-GAAP financial measures may not be comparable to other similarly titled measures of other companies. A reconciliation of these non-GAAP financial measures to the most directly comparable financial measures presented in accordance with GAAP is included in the tables that follow. Adjusted EBITDA is comprised of EBITDA, adjusted for certain items as permitted or required by the lenders under our credit agreement in place at the end of each quarter in the periods presented. The tables that follow include an explanation of how adjusted EBITDA is calculated for each of the periods presented with the reconciliation to net income (loss) from continuing operations. EBITDA is defined as income (loss) from continuing operations before interest expense, income taxes, depreciation and amortization on a historical basis. We present adjusted EBITDA for several reasons. Management believes adjusted EBITDA is useful as a means to evaluate our ability to fund our estimated uses of cash (including interest on our debt). In addition, we have presented adjusted EBITDA to investors in the past because it is frequently used by investors, securities analysts and other interested parties in the evaluation of companies in our industry, and management believes presenting it here provides a measure of consistency in our financial reporting. Adjusted EBITDA, referred to as Available Cash in our credit agreement, is also a component of the restrictive covenants and financial ratios contained in our credit agreement that requires us to maintain compliance with these covenants and limit certain activities, such as our ability to incur debt. The definitions in these covenants and ratios are based on Adjusted EBITDA after giving effect to specified charges. In addition, Adjusted EBITDA provides our board of directors with meaningful information, with other data, assumptions and considerations, to measure our ability to service and repay debt. We present the related “total net debt to last 12 month adjusted EBITDA ratio” or “Net debt leverage ratio” principally to help investors understand how we measure leverage and facilitate comparisons by investors, security analysts and others. Total net debt is defined as the current and long-term portions of debt and finance lease obligations less cash, cash equivalents and short-term investments, deferred debt issuance costs and discounts on debt. Our Net debt leverage ratio differs in certain respects from the similar ratio used in our credit agreement or against comparable measures of certain other companies in our industry. These measures differ in certain respects from the ratios used in our senior notes indenture. These non-GAAP financial measures have certain shortcomings. In particular, Adjusted EBITDA does not represent the residual cash flows available for discretionary expenditures, since items such as debt repayment and interest payments are not deducted from such measure. In addition, the ratio of total net debt to last 12-month adjusted EBITDA is subject to the risk that we may not be able to use the cash on the balance sheet to reduce our debt on a dollar-for-dollar basis. Management believes this ratio is useful as a means to evaluate our ability to incur additional indebtedness in the future. |
| Reconciliation of Historical Revenue by Category to Normalized Revenue by Category (1) These adjustments reflect the removal of operating revenues from divestitures. We completed the sale of the Company's Ohio and Kansas assets on January 31, 2022 and November 30, 2022, respectively. Three Months Ended Three Months Ended December 31, 2022 December 31, 2021 Historical Adjustments (1) Normalized Historical Adjustments (1) Normalized Consumer: Broadband (Data and VoIP) $ 69,002 $ (1,138) $ 67,864 $ 66,983 $ (2,554) $ 64,429 Voice services 34,314 (328) 33,986 39,518 (972) 38,546 Video services 11,876 (1,679) 10,197 15,371 (3,089) 12,282 115,192 (3,145) 112,047 121,872 (6,615) 115,257 Commercial: Data services (includes VoIP) 56,662 (2,952) 53,710 57,444 (4,444) 53,000 Voice services 34,676 (818) 33,858 37,303 (1,642) 35,661 Other 10,320 (179) 10,141 11,408 (305) 11,103 101,658 (3,949) 97,709 106,155 (6,391) 99,764 Carrier: Data and transport services 33,752 (171) 33,581 32,659 (278) 32,381 Voice services 3,685 (2) 3,683 4,088 (5) 4,083 Other 338 (3) 335 431 — 431 37,775 (176) 37,599 37,178 (283) 36,895 Subsidies 13,078 — 13,078 17,671 (250) 17,421 Network access 26,308 (303) 26,005 27,846 (680) 27,166 Other products and services 1,965 (121) 1,844 7,758 (222) 7,536 Total operating revenue $ 295,976 $ (7,694) $ 288,282 $ 318,480 $ (14,441) $ 304,039 ($ in thousands, unaudited) |

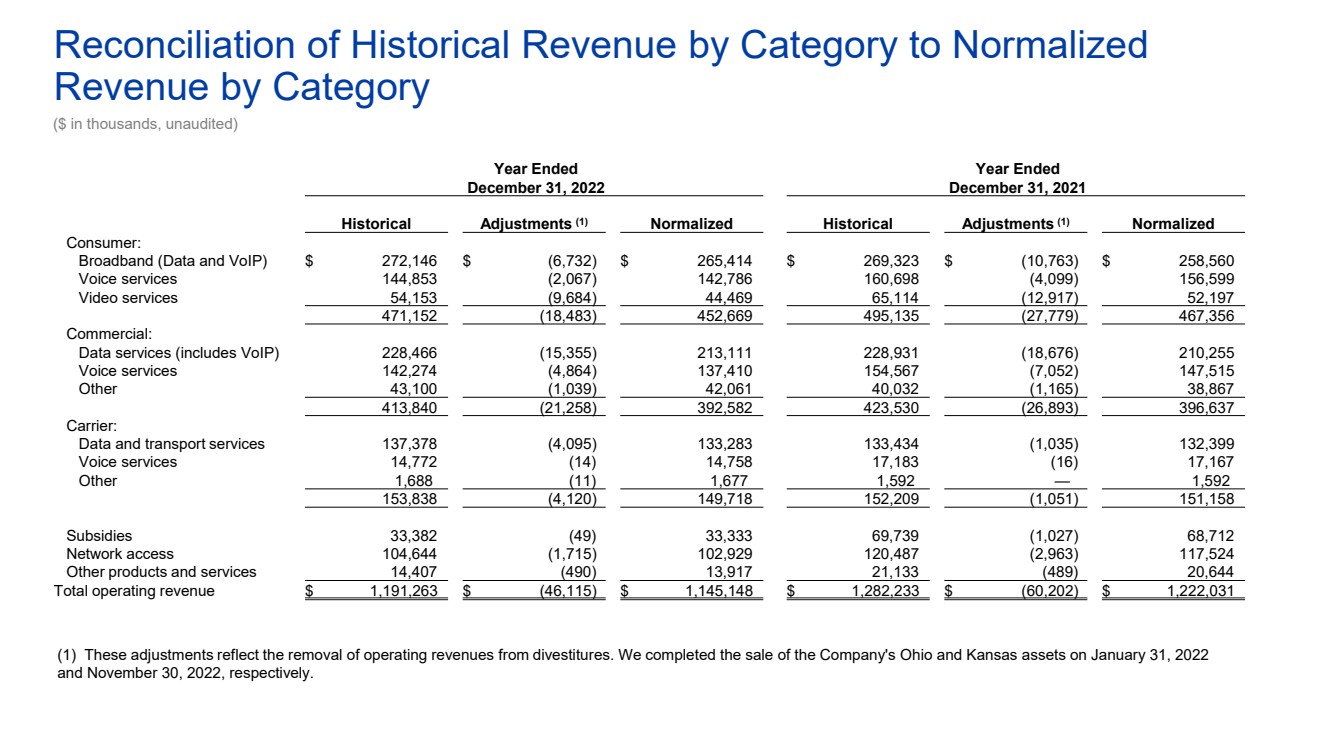
| Reconciliation of Historical Revenue by Category to Normalized Revenue by Category (1) These adjustments reflect the removal of operating revenues from divestitures. We completed the sale of the Company's Ohio and Kansas assets on January 31, 2022 and November 30, 2022, respectively. ($ in thousands, unaudited) Year Ended Year Ended December 31, 2022 December 31, 2021 Historical Adjustments (1) Normalized Historical Adjustments (1) Normalized Consumer: Broadband (Data and VoIP) $ 272,146 $ (6,732) $ 265,414 $ 269,323 $ (10,763) $ 258,560 Voice services 144,853 (2,067) 142,786 160,698 (4,099) 156,599 Video services 54,153 (9,684) 44,469 65,114 (12,917) 52,197 471,152 (18,483) 452,669 495,135 (27,779) 467,356 Commercial: Data services (includes VoIP) 228,466 (15,355) 213,111 228,931 (18,676) 210,255 Voice services 142,274 (4,864) 137,410 154,567 (7,052) 147,515 Other 43,100 (1,039) 42,061 40,032 (1,165) 38,867 413,840 (21,258) 392,582 423,530 (26,893) 396,637 Carrier: Data and transport services 137,378 (4,095) 133,283 133,434 (1,035) 132,399 Voice services 14,772 (14) 14,758 17,183 (16) 17,167 Other 1,688 (11) 1,677 1,592 — 1,592 153,838 (4,120) 149,718 152,209 (1,051) 151,158 Subsidies 33,382 (49) 33,333 69,739 (1,027) 68,712 Network access 104,644 (1,715) 102,929 120,487 (2,963) 117,524 Other products and services 14,407 (490) 13,917 21,133 (489) 20,644 Total operating revenue $ 1,191,263 $ (46,115) $ 1,145,148 $ 1,282,233 $ (60,202) $ 1,222,031 |
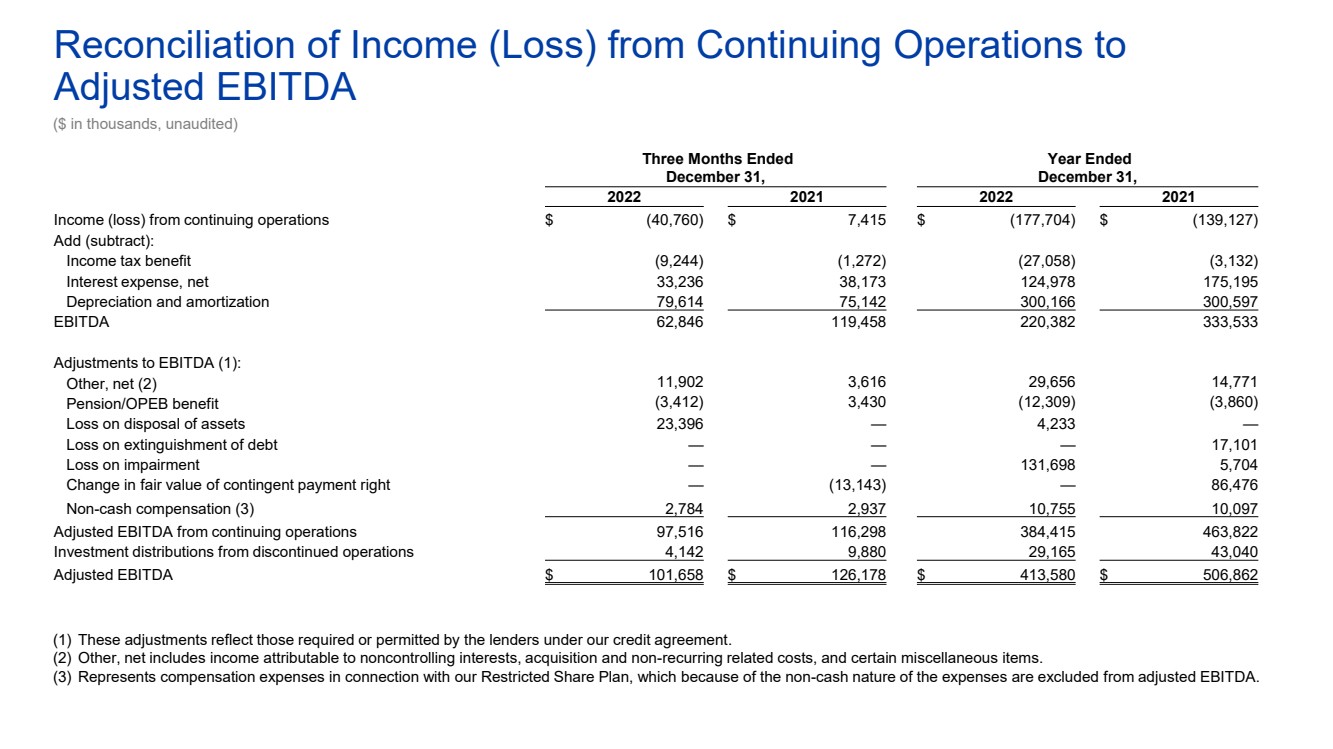
| Reconciliation of Income (Loss) from Continuing Operations to Adjusted EBITDA ($ in thousands, unaudited) (1) These adjustments reflect those required or permitted by the lenders under our credit agreement. (2) Other, net includes income attributable to noncontrolling interests, acquisition and non-recurring related costs, and certain miscellaneous items. (3) Represents compensation expenses in connection with our Restricted Share Plan, which because of the non-cash nature of the expenses are excluded from adjusted EBITDA. Three Months Ended Year Ended December 31, December 31, 2022 2021 2022 2021 Income (loss) from continuing operations $ (40,760) $ 7,415 $ (177,704) $ (139,127) Add (subtract): Income tax benefit (9,244) (1,272) (27,058) (3,132) Interest expense, net 33,236 38,173 124,978 175,195 Depreciation and amortization 79,614 75,142 300,166 300,597 EBITDA 62,846 119,458 220,382 333,533 Adjustments to EBITDA (1): Other, net (2) 11,902 3,616 29,656 14,771 Pension/OPEB benefit (3,412) 3,430 (12,309) (3,860) Loss on disposal of assets 23,396 — 4,233 — Loss on extinguishment of debt — — — 17,101 Loss on impairment — — 131,698 5,704 Change in fair value of contingent payment right — (13,143) — 86,476 Non-cash compensation (3) 2,784 2,937 10,755 10,097 Adjusted EBITDA from continuing operations 97,516 116,298 384,415 463,822 Investment distributions from discontinued operations 4,142 9,880 29,165 43,040 Adjusted EBITDA $ 101,658 $ 126,178 $ 413,580 $ 506,862 |
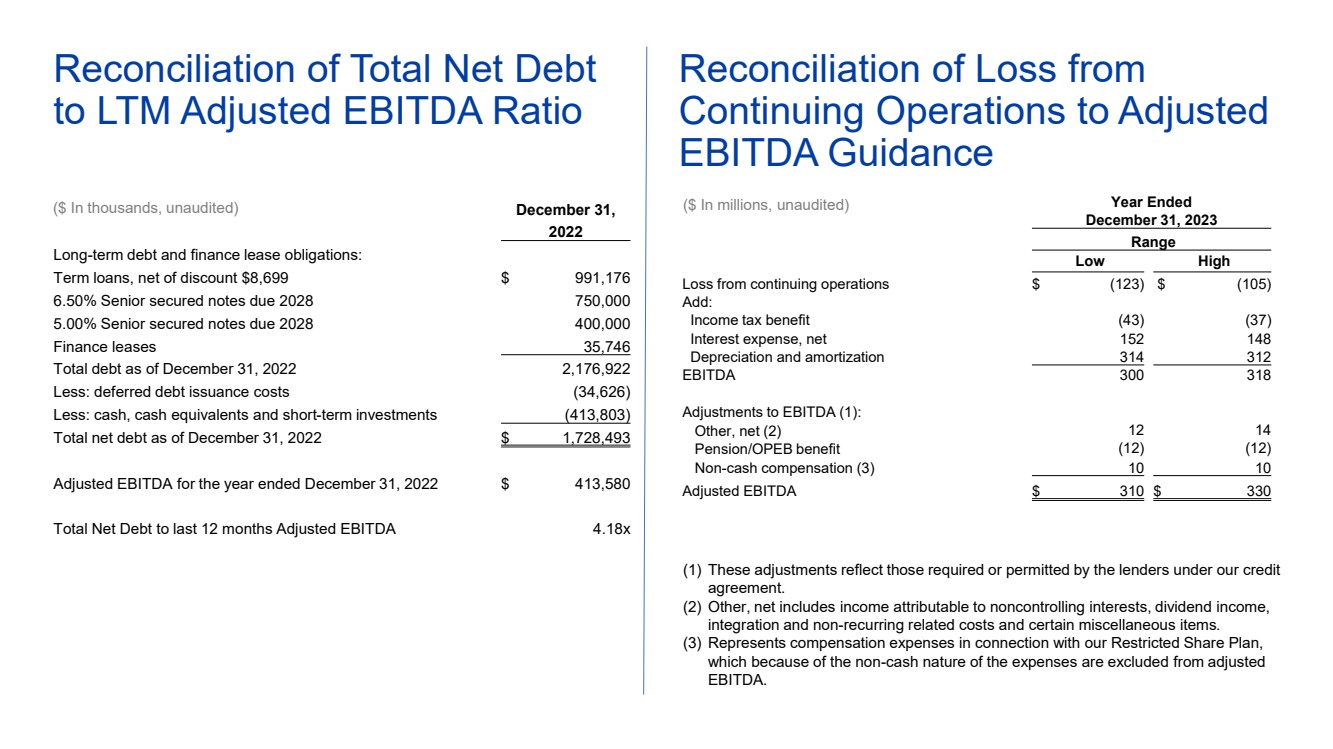
| Reconciliation of Loss from Continuing Operations to Adjusted EBITDA Guidance (1) These adjustments reflect those required or permitted by the lenders under our credit agreement. (2) Other, net includes income attributable to noncontrolling interests, dividend income, integration and non-recurring related costs and certain miscellaneous items. (3) Represents compensation expenses in connection with our Restricted Share Plan, which because of the non-cash nature of the expenses are excluded from adjusted EBITDA. Reconciliation of Total Net Debt to LTM Adjusted EBITDA Ratio Year Ended December 31, 2023 Range Low High Loss from continuing operations $ (123) $ (105) Add: Income tax benefit (43) (37) Interest expense, net 152 148 Depreciation and amortization 314 312 EBITDA 300 318 Adjustments to EBITDA (1): Other, net (2) 12 14 Pension/OPEB benefit (12) (12) Non-cash compensation (3) 10 10 Adjusted EBITDA $ 310 $ 330 ($ In millions, unaudited) ($ In thousands, unaudited) December 31, 2022 Long-term debt and finance lease obligations: Term loans, net of discount $8,699 $ 991,176 6.50% Senior secured notes due 2028 750,000 5.00% Senior secured notes due 2028 400,000 Finance leases 35,746 Total debt as of December 31, 2022 2,176,922 Less: deferred debt issuance costs (34,626) Less: cash, cash equivalents and short-term investments (413,803) Total net debt as of December 31, 2022 $ 1,728,493 Adjusted EBITDA for the year ended December 31, 2022 $ 413,580 Total Net Debt to last 12 months Adjusted EBITDA 4.18x |
|