Filing pursuant to Rule 425 under the
Securities Act of 1933, as amended
Deemed filed under Rule 14a-12 under the
Securities Exchange Act of 1934, as amended
Filer: Crestwood Midstream Partners LP
Subject Company: Crestwood Midstream Partners LP
Commission File No.: 001-35377
|
Connections for America’s Energy™
Investor Presentation
August 2015
Crestwood Midstream Partners LP Crestwood Equity Partners LP
|
Company Information
Crestwood Midstream Partners LP Forward-Looking Statements
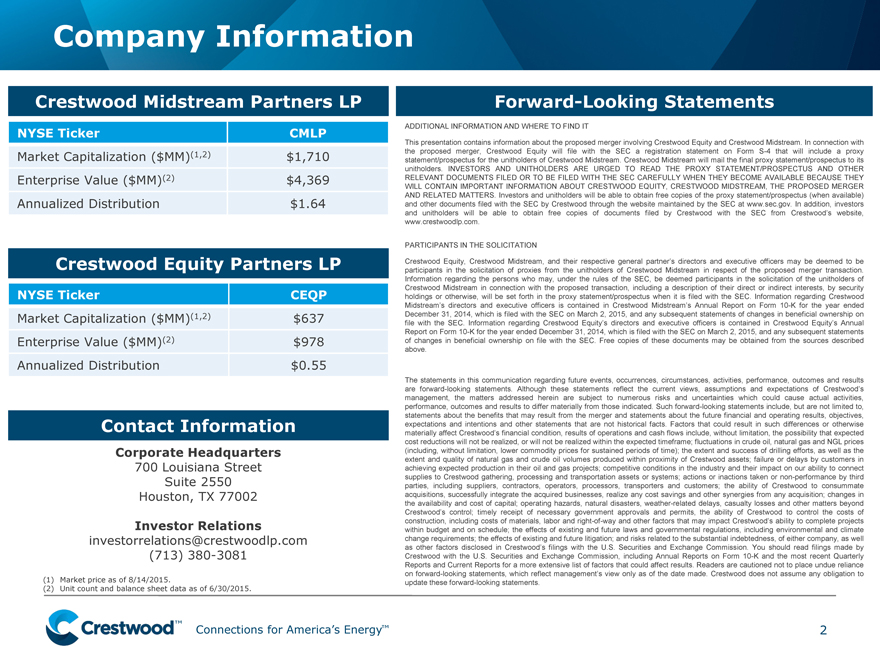
NYSE Ticker CMLP ADDITIONAL INFORMATION AND WHERE TO FIND IT
This presentation contains information about the proposed merger involving Crestwood Equity and Crestwood Midstream. In connection with
Market Capitalization ($MM)(1,2) $1,710 the proposed merger, Crestwood Equity will file with the SEC a registration statement on Form S-4 that will include a proxy
statement/prospectus for the unitholders of Crestwood Midstream. Crestwood Midstream will mail the final proxy statement/prospectus to its
unitholders. INVESTORS AND UNITHOLDERS ARE URGED TO READ THE PROXY STATEMENT/PROSPECTUS AND OTHER
Enterprise Value ($MM)(2) $4,369 RELEVANT DOCUMENTS FILED OR TO BE FILED WITH THE SEC CAREFULLY WHEN THEY BECOME AVAILABLE BECAUSE THEY
WILL CONTAIN IMPORTANT INFORMATION ABOUT CRESTWOOD EQUITY, CRESTWOOD MIDSTREAM, THE PROPOSED MERGER
AND RELATED MATTERS. Investors and unitholders will be able to obtain free copies of the proxy statement/prospectus (when available)
Annualized Distribution $1.64 and other documents filed with the SEC by Crestwood through the website maintained by the SEC at www.sec.gov. In addition, investors
and unitholders will be able to obtain free copies of documents filed by Crestwood with the SEC from Crestwood’s website,
www.crestwoodlp.com.
PARTICIPANTS IN THE SOLICITATION
Crestwood Equity Partners LP participants Crestwood Equity, in the Crestwood solicitation of Midstream, proxies from and the their unitholders respective of general Crestwood partner’s Midstream directors in and respect executive of the officers proposed may merger be deemed transaction. to be
Information regarding the persons who may, under the rules of the SEC, be deemed participants in the solicitation of the unitholders of
Crestwood Midstream in connection with the proposed transaction, including a description of their direct or indirect interests, by security
NYSE Ticker CEQP holdings or otherwise, will be set forth in the proxy statement/prospectus when it is filed with the SEC. Information regarding Crestwood
Midstream’s directors and executive officers is contained in Crestwood Midstream’s Annual Report on Form 10-K for the year ended
Market Capitalization ($MM)(1,2) $637 file December with the 31, SEC. 2014, Information which is filed regarding with the Crestwood SEC on March Equity’s 2, 2015, directors and and any executive subsequent officers statements is contained of changes in Crestwood in beneficial Equity’s ownership Annual on
Report on Form 10-K for the year ended December 31, 2014, which is filed with the SEC on March 2, 2015, and any subsequent statements
Enterprise Value ($MM)(2) $978 of changes in beneficial ownership on file with the SEC. Free copies of these documents may be obtained from the sources described
above.
Annualized Distribution $0.55
The statements in this communication regarding future events, occurrences, circumstances, activities, performance, outcomes and results
are forward-looking statements. Although these statements reflect the current views, assumptions and expectations of Crestwood’s
management, the matters addressed herein are subject to numerous risks and uncertainties which could cause actual activities,
performance, outcomes and results to differ materially from those indicated. Such forward-looking statements include, but are not limited to,
Contact Information expectations statements about and the intentions benefits and that other may statements result from that the merger are not and historical statements facts. about Factors the that future could financial result and in such operating differences results, or objectives, otherwise
materially affect Crestwood’s financial condition, results of operations and cash flows include, without limitation, the possibility that expected
cost reductions will not be realized, or will not be realized within the expected timeframe; fluctuations in crude oil, natural gas and NGL prices
Corporate Headquarters (including, without limitation, lower commodity prices for sustained periods of time); the extent and success of drilling efforts, as well as the
extent and quality of natural gas and crude oil volumes produced within proximity of Crestwood assets; failure or delays by customers in
700 Louisiana Street achieving expected production in their oil and gas projects; competitive conditions in the industry and their impact on our ability to connect
Suite 2550 supplies to Crestwood gathering, processing and transportation assets or systems; actions or inactions taken or non-performance by third
parties, including suppliers, contractors, operators, processors, transporters and customers; the ability of Crestwood to consummate
Houston, TX 77002 acquisitions, successfully integrate the acquired businesses, realize any cost savings and other synergies from any acquisition; changes in
the availability and cost of capital; operating hazards, natural disasters, weather-related delays, casualty losses and other matters beyond
Crestwood’s control; timely receipt of necessary government approvals and permits, the ability of Crestwood to control the costs of
Investor Relations construction, including costs of materials, labor and right-of-way and other factors that may impact Crestwood’s ability to complete projects
within budget and on schedule; the effects of existing and future laws and governmental regulations, including environmental and climate
investorrelations@crestwoodlp.com change requirements; the effects of existing and future litigation; and risks related to the substantial indebtedness, of either company, as well
as other factors disclosed in Crestwood’s filings with the U.S. Securities and Exchange Commission. You should read filings made by
(713) 380-3081 Crestwood with the U.S. Securities and Exchange Commission, including Annual Reports on Form 10-K and the most recent Quarterly
Reports and Current Reports for a more extensive list of factors that could affect results. Readers are cautioned not to place undue reliance
on forward-looking statements, which reflect management’s view only as of the date made. Crestwood does not assume any obligation to
(1) |
| Market price as of 8/14/2015. update these forward-looking statements. |
(2) |
| Unit count and balance sheet data as of 6/30/2015. |
Connections for America’s Energy™
2 |
|
|
Key Investor Highlights
Connections for America’s Energy™
3 |
|
|
Key Investor Highlights
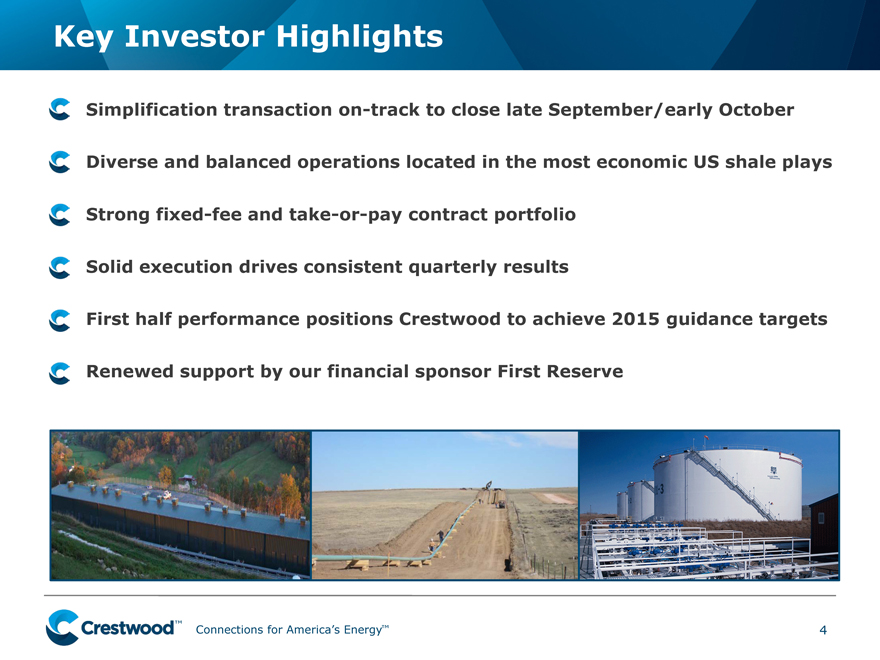
Simplification transaction on-track to close late September/early October Diverse and balanced operations located in the most economic US shale plays Strong fixed-fee and take-or-pay contract portfolio Solid execution drives consistent quarterly results First half performance positions Crestwood to achieve 2015 guidance targets Renewed support by our financial sponsor First Reserve
Connections for America’s Energy™
4 |
|
|
Positioning the Company for Long-Term Success
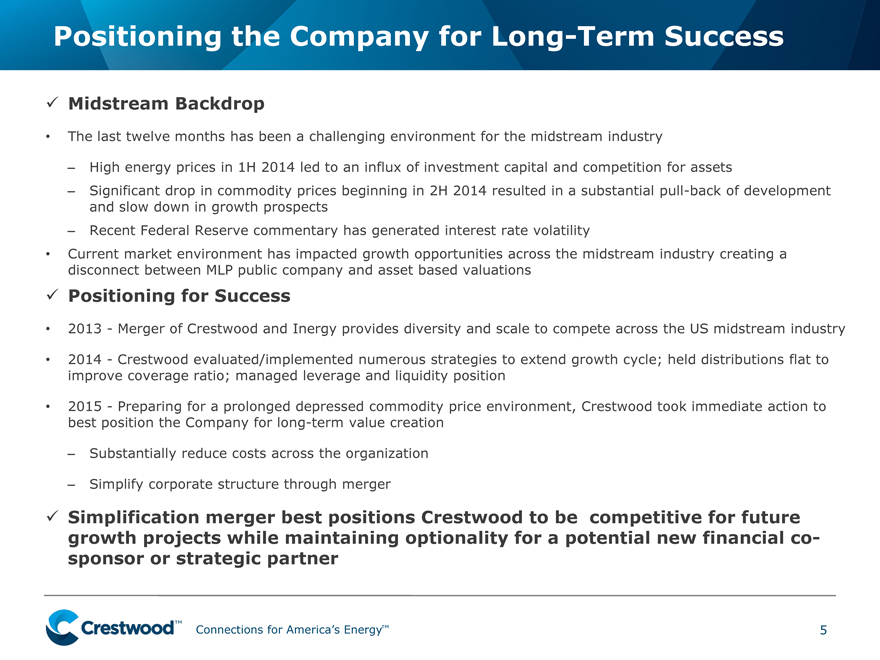
Midstream Backdrop
The last twelve months has been a challenging environment for the midstream industry
High energy prices in 1H 2014 led to an influx of investment capital and competition for assets
Significant drop in commodity prices beginning in 2H 2014 resulted in a substantial pull-back of development and slow down in growth prospects
Recent Federal Reserve commentary has generated interest rate volatility
Current market environment has impacted growth opportunities across the midstream industry creating a disconnect between MLP public company and asset based valuations
Positioning for Success
2013—Merger of Crestwood and Inergy provides diversity and scale to compete across the US midstream industry 2014—Crestwood evaluated/implemented numerous strategies to extend growth cycle; held distributions flat to improve coverage ratio; managed leverage and liquidity position 2015—Preparing for a prolonged depressed commodity price environment, Crestwood took immediate action to best position the Company for long-term value creation
Substantially reduce costs across the organization
Simplify corporate structure through merger
Simplification merger best positions Crestwood to be competitive for future growth projects while maintaining optionality for a potential new financial cosponsor or strategic partner
Connections for America’s Energy™
5 |
|
|
Simplification Merger Overview
Summary
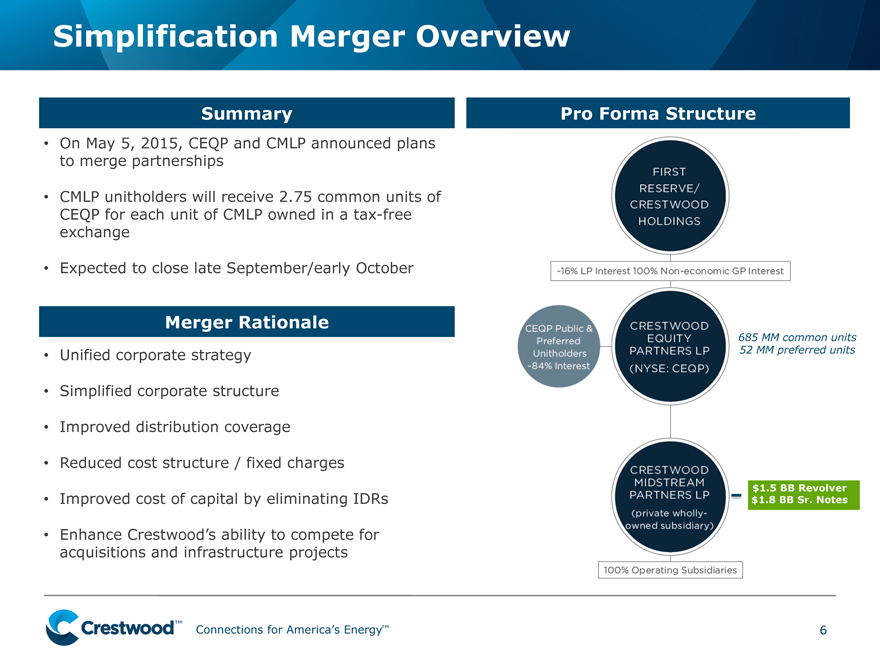
On May 5, 2015, CEQP and CMLP announced plans to merge partnerships
CMLP unitholders will receive 2.75 common units of CEQP for each unit of CMLP owned in a tax-free exchange
Expected to close late September/early October
Merger Rationale
Unified corporate strategy Simplified corporate structure Improved distribution coverage Reduced cost structure / fixed charges Improved cost of capital by eliminating IDRs
Enhance Crestwood’s ability to compete for acquisitions and infrastructure projects
Pro Forma Structure
Connections for America’s Energy™
6 |
|
|
Built Scale and Investing in the Right Places
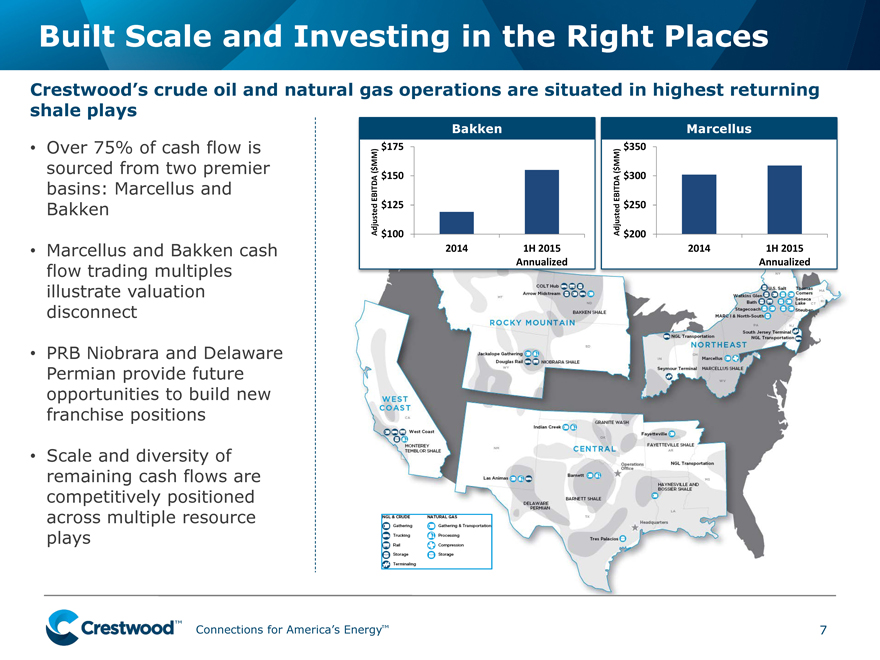
Crestwood’s crude oil and natural gas operations are situated in highest returning shale plays
Over 75% of cash flow is sourced from two premier basins: Marcellus and Bakken
Marcellus and Bakken cash flow trading multiples illustrate valuation disconnect
PRB Niobrara and Delaware Permian provide future opportunities to build new franchise positions
Scale and diversity of remaining cash flows are competitively positioned across multiple resource plays
Bakken Marcellus $175 $350
$ MM) $ MM)
( $150( $300
EBITDAEBITDA
$125 $250
Adjusted $100 Adjusted $200
2014 1H 2015 2014 1H 2015 Annualized Annualized
Connections for America’s Energy™
7 |
|
|
Fixed-Fee Contracts Provide Safety Net
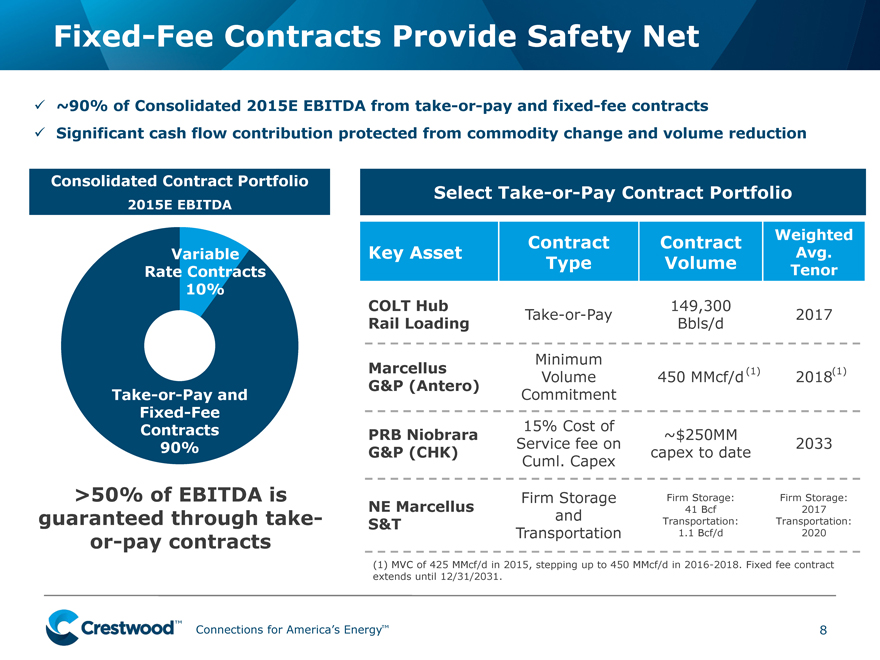
~90% of Consolidated 2015E EBITDA from take-or-pay and fixed-fee contracts
Significant cash flow contribution protected from commodity change and volume reduction
Consolidated Contract Portfolio
Select Take-or-Pay Contract Portfolio
2015E EBITDA
Contract Contract Weighted Variable Key Asset Avg.
Type Volume Tenor
Rate Contracts 10%
COLT Hub 149,300
Take-or-Pay 2017
Rail Loading Bbls/d
Minimum
Marcellus (1) (1)
Volume 450 MMcf/d 2018
G&P (Antero)
Take-or-Pay and Commitment Fixed-Fee Contracts 15% Cost of
PRB Niobrara ~$250MM
90% Service fee on 2033 G&P (CHK) capex to date Cuml. Capex
>50% of EBITDA is Firm Storage Firm Storage: Firm Storage:
NE Marcellus 41 Bcf 2017
guaranteed through take- and Transportation: Transportation:
S&T
or-pay contracts Transportation 1.1 Bcf/d 2020
(1) |
| MVC of 425 MMcf/d in 2015, stepping up to 450 MMcf/d in 2016-2018. Fixed fee contract extends until 12/31/2031. |
Connections for America’s Energy™
8 |
|
|
Solid Execution Continues to Drive Results
Cash Flow Growth
Strengthened Coverage
Exceeding Cost Savings Goals
Guidance Affirmned
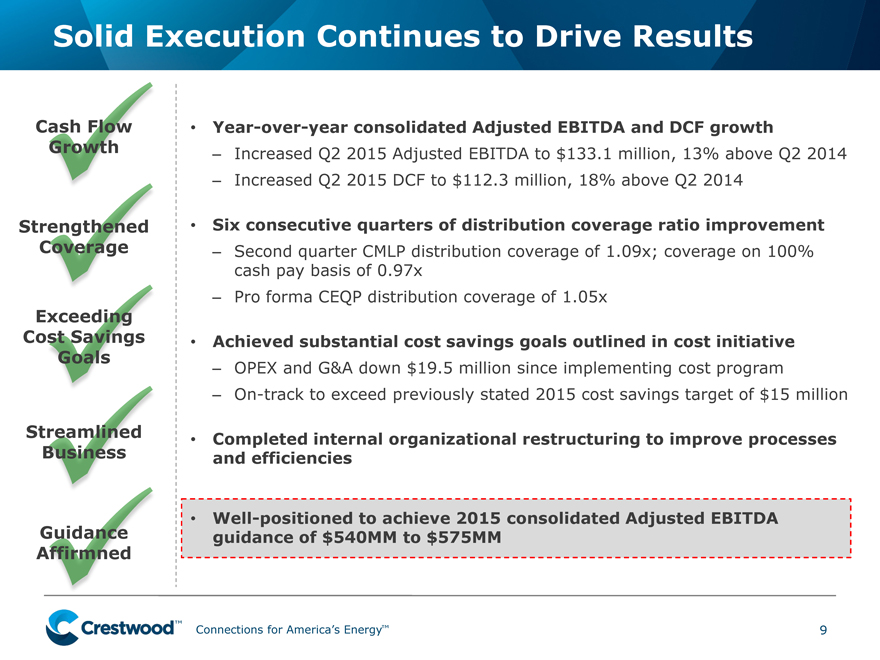
Year-over-year consolidated Adjusted EBITDA and DCF growth
Increased Q2 2015 Adjusted EBITDA to $133.1 million, 13% above Q2 2014
Increased Q2 2015 DCF to $112.3 million, 18% above Q2 2014
Six consecutive quarters of distribution coverage ratio improvement
Second quarter CMLP distribution coverage of 1.09x; coverage on 100% cash pay basis of 0.97x
Pro forma CEQP distribution coverage of 1.05x
Achieved substantial cost savings goals outlined in cost initiative
OPEX and G&A down $19.5 million since implementing cost program
On-track to exceed previously stated 2015 cost savings target of $15 million
internal organizational restructuring to improve processes ncies
oned to achieve 2015 consolidated Adjusted EBITDA f $540MM to $575MM
9
|

Expense / Fixed Charge Reduction Strategy
Taking action to materially reduce expense and fixed charges to improve
margins and distribution coverage
Execution of strategy on-track:
Reduced O&M and Adj. G&A(1) costs by $19.5 MM in Q2 2015 over Q4 2014
2015 cost savings of >$15 MM; 2016+ run-rate savings of $25-30 MM
Results drive greater profitability in the current industry environment
Increased efficiency without sacrificing customer service, safety or compliance
Simplification adds to coverage improvement through fixed charge elimination
YTD Cost Savings
Q4 Q2
($US Millions)
2014 2015 O&M $54.6 $43.9
Adj. G&A(1) $21.1 $12.3 Total $75.7 $56.2 Cost Savings $19.5
Calendar Direct
Year 2015 Contribution Improving to
Run-Rate DCF and
2015 Distribution Coverage
$MM
(2) |
| (3) |
(1) Adj. G&A is defined as general and administrative expenses less unit-based compensation charges and significant transaction and environmental related costa and other items. (2) Represents the incremental retained DCF pro forma for the simplification transaction at CEQP’s current distribution of $0.55 per unit.
(3) |
| Estimated $5 million of reduced administrative expenses through elimination of second publically traded entity. |
Connections for America’s Energy™
10
|
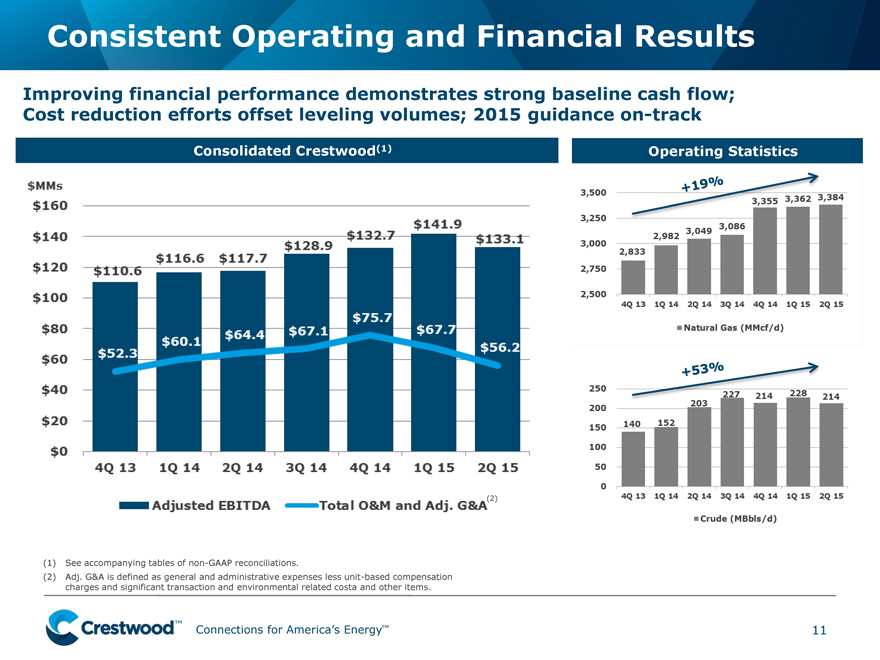
Consistent Operating and Financial Results
Improving financial performance demonstrates strong baseline cash flow; Cost reduction efforts offset leveling volumes; 2015 guidance on-track
Consolidated Crestwood(1) Operating Statistics
(2) |
|
(1) |
| See accompanying tables of non-GAAP reconciliations. |
(2) Adj. G&A is defined as general and administrative expenses less unit-based compensation charges and significant transaction and environmental related costa and other items.
Connections for America’s Energy™
11
|
Core Operations Update
Connections for America’s Energy™
12
|
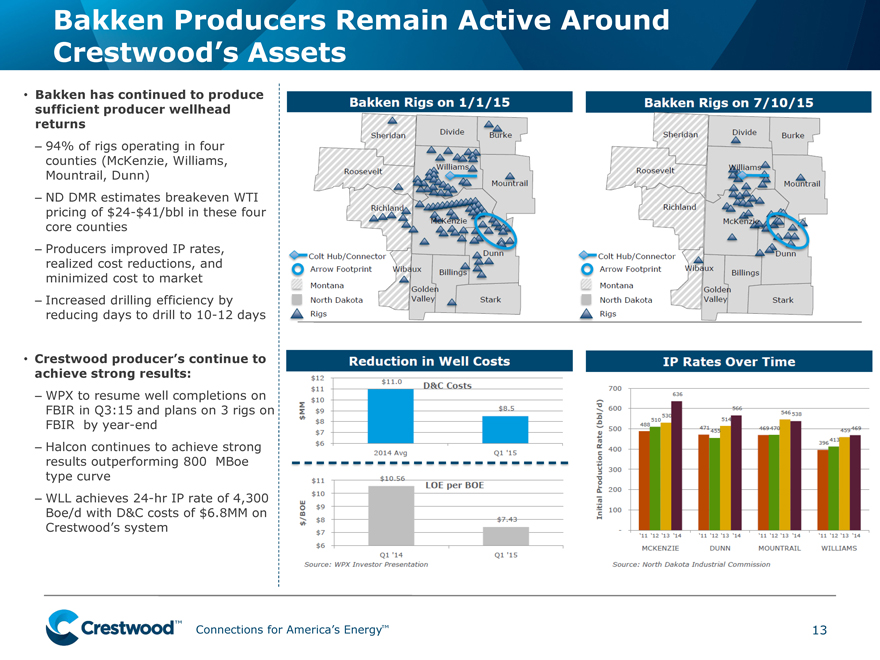
Bakken Producers Remain Active Around Crestwood’s Assets
Bakken has continued to produce
sufficient producer wellhead
returns
94% of rigs operating in four
counties (McKenzie, Williams,
Mountrail, Dunn)
ND DMR estimates breakeven WTI
pricing of $24-$41/bbl in these four
core counties
Producers improved IP rates,
realized cost reductions, and
minimized cost to market
Increased drilling efficiency by
reducing days to drill to 10-12 days
Crestwood producer’s continue to
achieve strong results:
WPX to resume well completions on
FBIR in Q3:15 and plans on 3 rigs on
FBIR by year-end
Halcon continues to achieve strong
results outperforming 800 MBoe
type curve
WLL achieves 24-hr IP rate of 4,300
Boe/d with D&C costs of $6.8MM on
Crestwood’s system
Connections for America’s Energy™
13
|
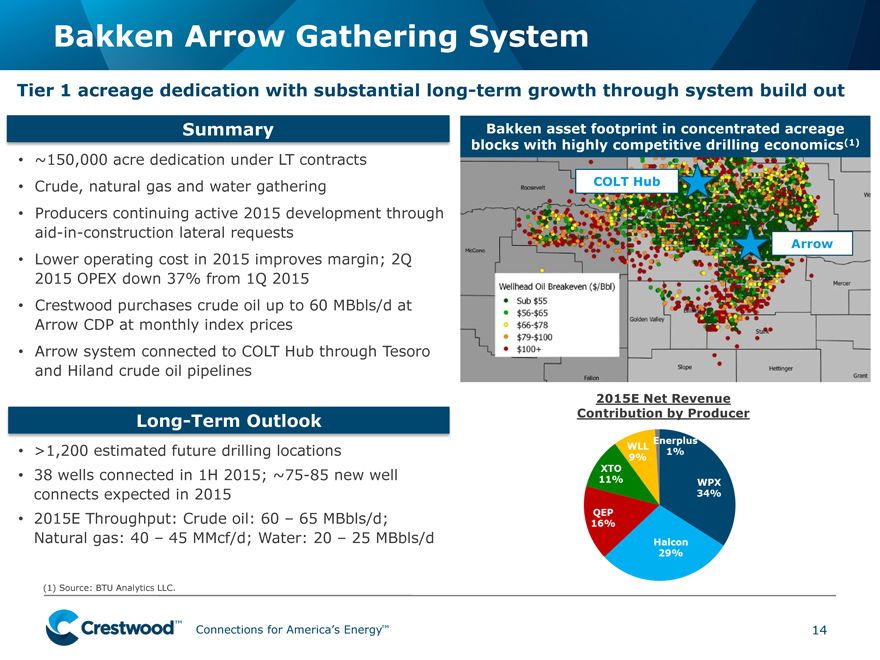
Bakken Arrow Gathering System
Summary
~150,000 acre dedication under LT contracts Crude, natural gas and water gathering
Producers continuing active 2015 development through aid-in-construction lateral requests Lower operating cost in 2015 improves margin; 2Q 2015 OPEX down 37% from 1Q 2015 Crestwood purchases crude oil up to 60 MBbls/d at Arrow CDP at monthly index prices Arrow system connected to COLT Hub through Tesoro and Hiland crude oil pipelines
Long-Term Outlook
>1,200 estimated future drilling locations 38 wells connected in 1H 2015; ~75-85 new well connects expected in 2015 2015E Throughput: Crude oil: 60 – 65 MBbls/d; Natural gas: 40 – 45 MMcf/d; Water: 20 – 25 MBbls/d
(1) |
| Source: BTU Analytics LLC. |
Bakken asset footprint in concentrated acreage blocks with highly competitive drilling economics(1)
COLT Hub
Arrow
2015E Net Revenue Contribution by Producer
Connections for America’s Energy™
14
|
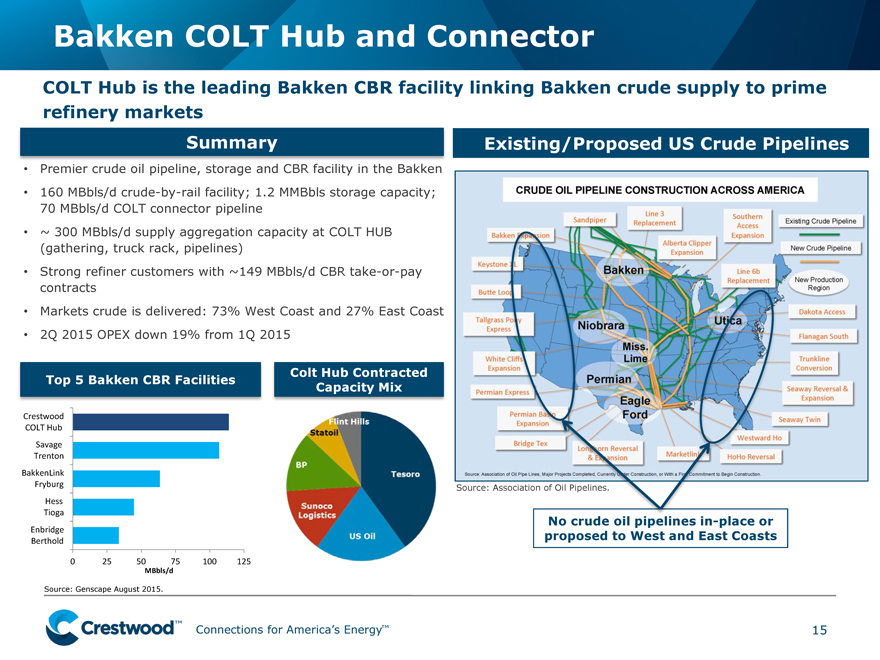
Bakken COLT Hub and Connector
COLT Hub is the leading Bakken CBR facility linking Bakken crude supply to prime refinery markets
Summary
Premier crude oil pipeline, storage and CBR facility in the Bakken
160 MBbls/d crude-by-rail facility; 1.2 MMBbls storage capacity;
70 MBbls/d COLT connector pipeline
~ 300 MBbls/d supply aggregation capacity at COLT HUB
(gathering, truck rack, pipelines)
Strong refiner customers with ~149 MBbls/d CBR take-or-pay
contracts
Markets crude is delivered: 73% West Coast and 27% East Coast
2Q 2015 OPEX down 19% from 1Q 2015
Top 5 Bakken CBR Facilities Colt Hub Contracted
Capacity Mix
Crestwood
COLT Hub
Savage
Trenton
BakkenLink
Fryburg
Hess
Tioga
Enbridge
Berthold
0 25 50 75 100 125
MBbls/d
Source: Genscape August 2015.
Existing/Proposed US Crude Pipelines
Source: Association of Oil Pipelines.
No crude oil pipelines in-place or proposed to West and East Coasts
Connections for America’s Energy™
15
|
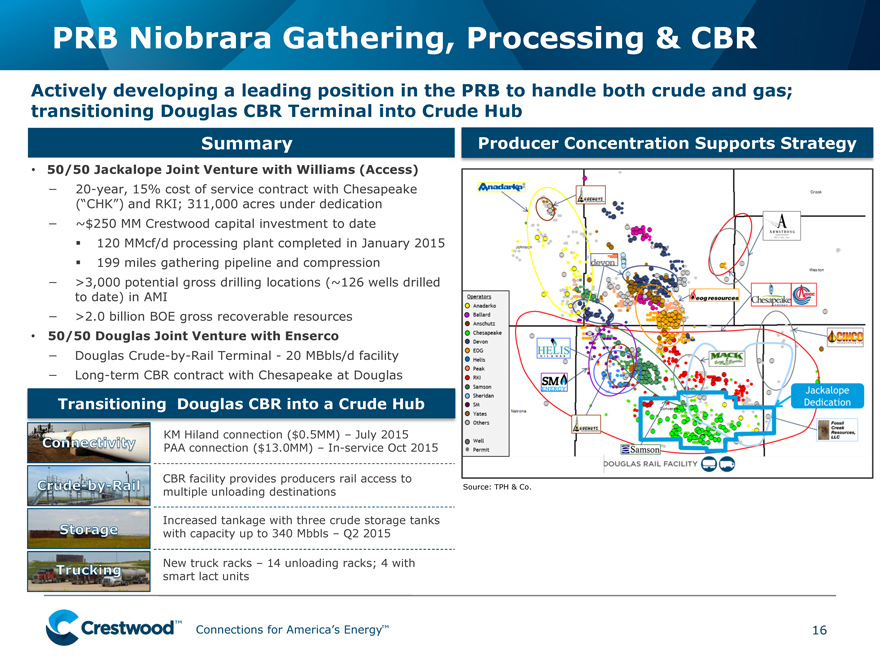
PRB Niobrara Gathering, Processing & CBR
Actively developing a leading position in the PRB to handle both crude and gas;
transitioning Douglas CBR Terminal into Crude Hub
Summary Producer Concentration Supports Strategy
50/50 Jackalope Joint Venture with Williams (Access)
20-year, 15% cost of service contract with Chesapeake
(“CHK”) and RKI; 311,000 acres under dedication
~$250 MM Crestwood capital investment to date
120 MMcf/d processing plant completed in January 2015
199 miles gathering pipeline and compression
>3,000 potential gross drilling locations (~126 wells drilled
to date) in AMI
>2.0 billion BOE gross recoverable resources
50/50 Douglas Joint Venture with Enserco
Douglas Crude-by-Rail Terminal—20 MBbls/d facility
Long-term CBR contract with Chesapeake at Douglas
Transitioning Douglas CBR into a Crude Hub
KM Hiland connection ($0.5MM) – July 2015
PAA connection ($13.0MM) – In-service Oct 2015
CBR facility provides producers rail access to
multiple unloading destinations Source: TPH & Co.
Increased tankage with three crude storage tanks
with capacity up to 340 Mbbls – Q2 2015
New truck racks – 14 unloading racks; 4 with
smart lact units
Connections for America’s Energy™
16
|
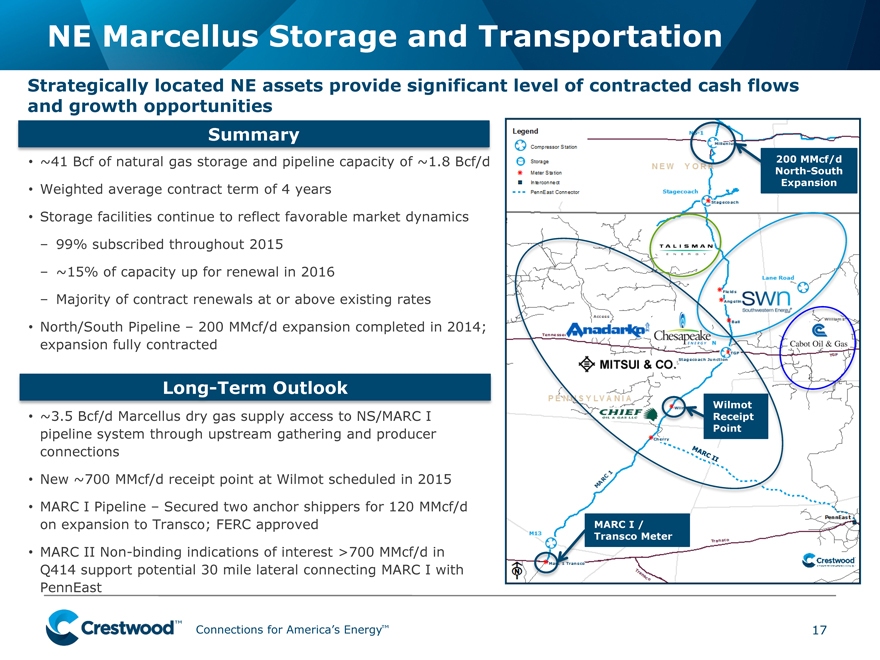
NE Marcellus Storage and Transportation
Strategically located NE assets provide significant level of contracted cash flows
and growth opportunities
Summary
~41 Bcf of natural gas storage and pipeline capacity of ~1.8 Bcf/d 200 MMcf/d
North-South
Weighted average contract term of 4 years Expansion
Storage facilities continue to reflect favorable market dynamics
99% subscribed throughout 2015
~15% of capacity up for renewal in 2016
Majority of contract renewals at or above existing rates
North/South Pipeline – 200 MMcf/d expansion completed in 2014;
expansion fully contracted
Long-Term Outlook
~3.5 Bcf/d Marcellus dry gas supply access to NS/MARC I
pipeline system through upstream gathering and producer
connections
New ~700 MMcf/d receipt point at Wilmot scheduled in 2015
MARC I Pipeline – Secured two anchor shippers for 120 MMcf/d
on expansion to Transco; FERC approved MARC I /
Transco Meter
MARC II Non-binding indications of interest >700 MMcf/d in
Q414 support potential 30 mile lateral connecting MARC I with
PennEast
Connections for America’s Energy™
17
|
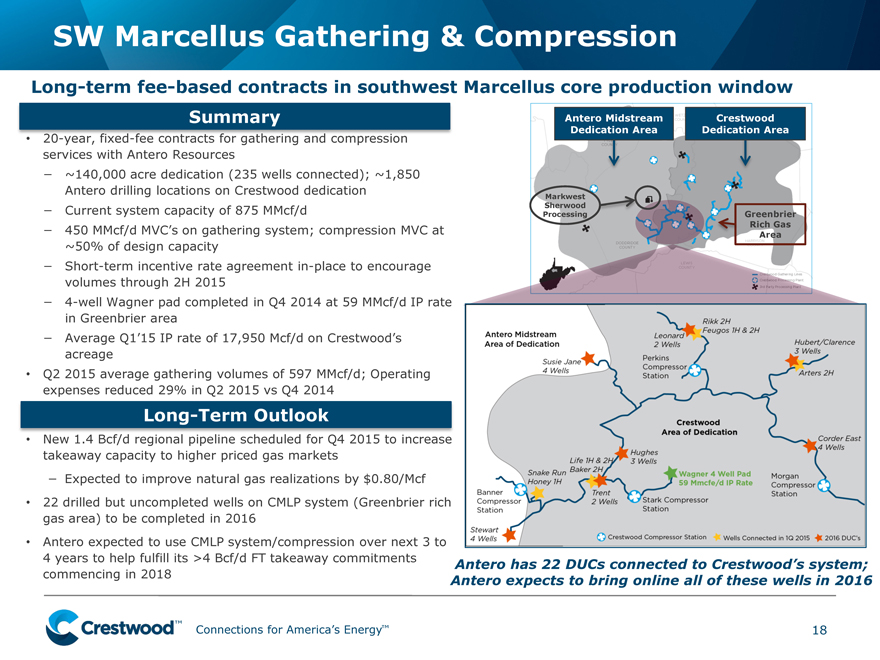
SW Marcellus Gathering & Compression
Long-term fee-based contracts in southwest Marcellus core production window
Summary Antero Midstream Crestwood
20-year, fixed-fee contracts for gathering and compression Dedication Area Dedication Area
services with Antero Resources
~140,000 acre dedication (235 wells connected); ~1,850
Antero drilling locations on Crestwood dedication Markwest
Current system capacity of 875 MMcf/d Processing Sherwood Greenbrier
450 MMcf/d MVC’s on gathering system; compression MVC at Rich Gas
Area
~50% of design capacity
Short-term incentive rate agreement in-place to encourage
volumes through 2H 2015
4-well Wagner pad completed in Q4 2014 at 59 MMcf/d IP rate
in Greenbrier area
Average Q1’15 IP rate of 17,950 Mcf/d on Crestwood’s
acreage
Q2 2015 average gathering volumes of 597 MMcf/d; Operating
expenses reduced 29% in Q2 2015 vs Q4 2014
Long-Term Outlook
New 1.4 Bcf/d regional pipeline scheduled for Q4 2015 to increase
takeaway capacity to higher priced gas markets
Expected to improve natural gas realizations by $0.80/Mcf
22 drilled but uncompleted wells on CMLP system (Greenbrier rich
gas area) to be completed in 2016
Antero expected to use CMLP system/compression over next 3 to
4 |
| years to help fulfill its >4 Bcf/d FT takeaway commitments Antero has 22 DUCs connected to Crestwood’s system; |
commencing in 2018 Antero expects to bring online all of these wells in 2016
Connections for America’s Energy™
18
|
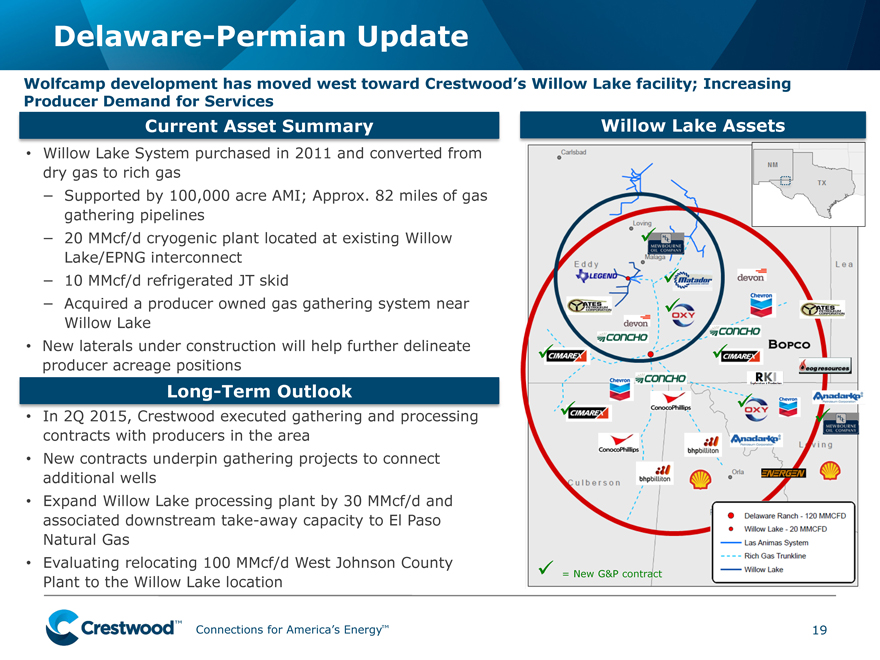
Delaware-Permian Update
Wolfcamp development has moved west toward Crestwood’s Willow Lake facility; Increasing
Producer Demand for Services
Current Asset Summary Willow Lake Assets
Willow Lake System purchased in 2011 and converted from
dry gas to rich gas
Supported by 100,000 acre AMI; Approx. 82 miles of gas
gathering pipelines
20 MMcf/d cryogenic plant located at existing Willow
Lake/EPNG interconnect
10 MMcf/d refrigerated JT skid
Acquired a producer owned gas gathering system near
Willow Lake
New laterals under construction will help further delineate
producer acreage positions
Long-Term Outlook
In 2Q 2015, Crestwood executed gathering and processing
contracts with producers in the area
New contracts underpin gathering projects to connect
additional wells
Expand Willow Lake processing plant by 30 MMcf/d and
associated downstream take-away capacity to El Paso
Natural Gas
Evaluating relocating 100 MMcf/d West Johnson County = New G&P contract
Plant to the Willow Lake location
™
Connections for America’s Energy™
19
|
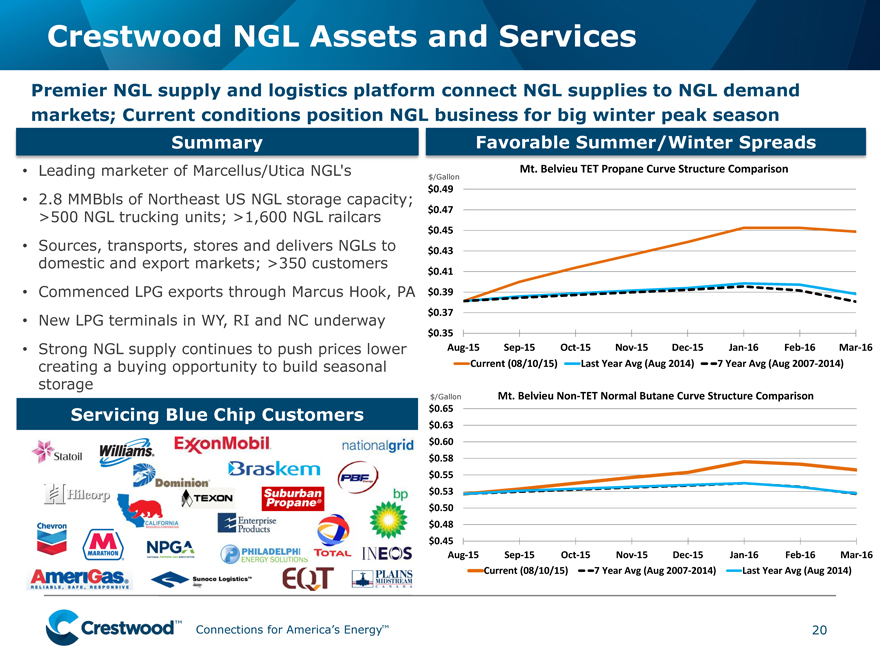
Crestwood NGL Assets and Services
Premier NGL supply and logistics platform connect NGL supplies to NGL demand
markets; Current conditions position NGL business for big winter peak season
Summary Favorable Summer/Winter Spreads
Leading marketer of Marcellus/Utica NGL’s $/Gallon Mt. Belvieu TET Propane Curve Structure Comparison
$0.49
2.8 MMBbls of Northeast US NGL storage capacity;
>500 NGL trucking units; >1,600 NGL railcars $0.47
$0.45
Sources, transports, stores and delivers NGLs to $0.43
domestic and export markets; >350 customers $0.41
Commenced LPG exports through Marcus Hook, PA $0.39
New LPG terminals in WY, RI and NC underway $0.37
$0.35
Strong NGL supply continues to push prices lower Aug-15 Sep-15 Oct-15 Nov-15 Dec-15 Jan-16 Feb-16 Mar-16
creating a buying opportunity to build seasonal Current (08/10/15) Last Year Avg (Aug 2014) 7 Year Avg (Aug 2007-2014)
storage
$/Gallon Mt. Belvieu Non-TET Normal Butane Curve Structure Comparison
Servicing Blue Chip Customers $0.65
$0.63
$0.60
$0.58
$0.55
$0.53
$0.50
$0.48
$0.45
Aug-15 Sep-15 Oct-15 Nov-15 Dec-15 Jan-16 Feb-16 Mar-16
Current (08/10/15) 7 Year Avg (Aug 2007-2014) Last Year Avg (Aug 2014)
Connections for America’s Energy™
20
|
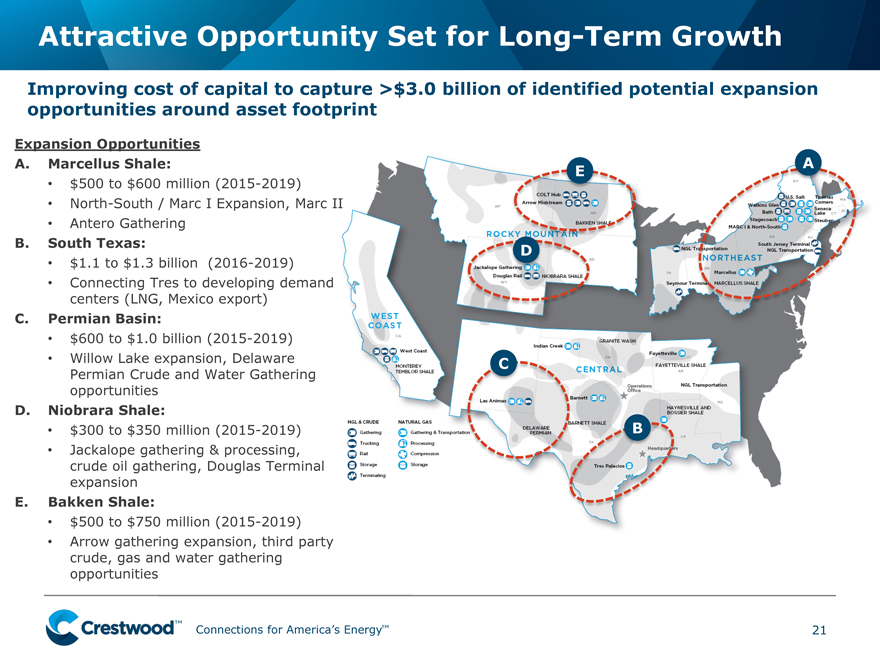
Attractive Opportunity Set for Long-Term Growth
Improving cost of capital to capture >$3.0 billion of identified potential expansion
opportunities around asset footprint
Expansion Opportunities
A Marcellus Shale: A
E
$500 to $600 million (2015-2019)
North-South / Marc I Expansion, Marc II
Antero Gathering
B South Texas: D
$1.1 to $1.3 billion (2016-2019)
Connecting Tres to developing demand
centers (LNG, Mexico export)
C Permian Basin:
$600 to $1.0 billion (2015-2019)
Willow Lake expansion, Delaware C
Permian Crude and Water Gathering
opportunities
D Niobrara Shale:
$300 to $350 million (2015-2019) B
Jackalope gathering & processing,
crude oil gathering, Douglas Terminal
expansion
E Bakken Shale:
$500 to $750 million (2015-2019)
Arrow gathering expansion, third party
crude, gas and water gathering
opportunities
Connections for America’s Energy™
21
|
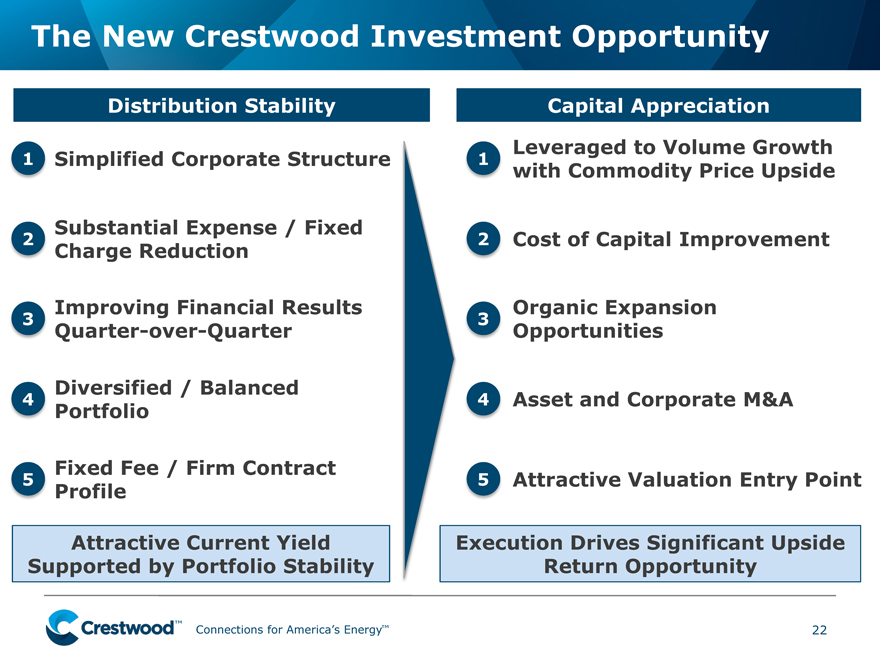
The New Crestwood Investment Opportunity
Distribution Stability Capital Appreciation
Leveraged to Volume Growth
1 |
| Simplified Corporate Structure 1 with Commodity Price Upside |
Substantial Expense / Fixed
2 |
| 2 Cost of Capital Improvement |
Charge Reduction
Improving Financial Results Organic Expansion
3 |
| 3 |
Quarter-over-Quarter Opportunities
Diversified / Balanced
4 |
| 4 Asset and Corporate M&A |
Portfolio
Fixed Fee / Firm Contract
5 |
| 5 Attractive Valuation Entry Point |
Profile
Attractive Current Yield Execution Drives Significant Upside
Supported by Portfolio Stability Return Opportunity
Connections for America’s Energy™
22
|
Non-GAAP Reconciliations
Connections for America’s Energy™
23
|
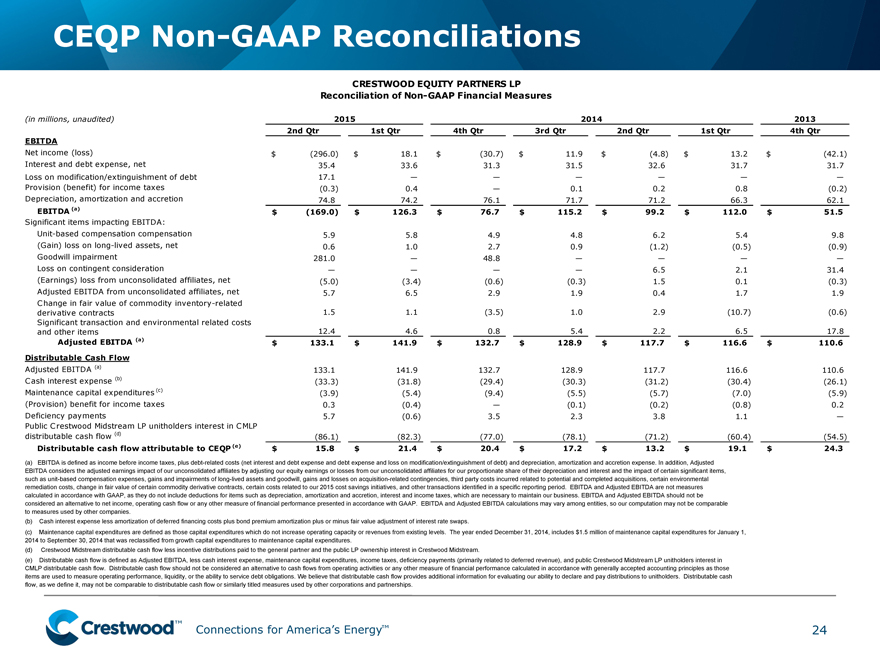
CEQP Non-GAAP Reconciliations
CRESTWOOD EQUITY PARTNERS LP
Reconciliation of Non-GAAP Financial Measures
(in millions, unaudited) 2015 2014 2013
2nd Qtr 1st Qtr 4th Qtr 3rd Qtr 2nd Qtr 1st Qtr 4th Qtr
EBITDA
Net income (loss) $ (296.0) $ 18.1 $ (30.7) $ 11.9 $ (4.8) $ 13.2 $ (42.1)
Interest and debt expense, net 35.4 33.6 31.3 31.5 32.6 31.7 31.7
Loss on modification/extinguishment of debt 17.1 — — — — — —
Provision (benefit) for income taxes (0.3) 0.4 — 0.1 0.2 0.8 (0.2)
Depreciation, amortization and accretion 74.8 74.2 76.1 71.7 71.2 66.3 62.1
EBITDA (a) $ (169.0) $ 126.3 $ 76.7 $ 115.2 $ 99.2 $ 112.0 $ 51.5
Significant items impacting EBITDA:
Unit-based compensation compensation 5.9 5.8 4.9 4.8 6.2 5.4 9.8
(Gain) loss on long-lived assets, net 0.6 1.0 2.7 0.9 (1.2) (0.5) (0.9)
Goodwill impairment 281.0 — 48.8 — — — —
Loss on contingent consideration — — — — 6.5 2.1 31.4
(Earnings) loss from unconsolidated affiliates, net (5.0) (3.4) (0.6) (0.3) 1.5 0.1 (0.3)
Adjusted EBITDA from unconsolidated affiliates, net 5.7 6.5 2.9 1.9 0.4 1.7 1.9
Change in fair value of commodity inventory-related
derivative contracts 1.5 1.1 (3.5) 1.0 2.9 (10.7) (0.6)
Significant transaction and environmental related costs
and other items 12.4 4.6 0.8 5.4 2.2 6.5 17.8
Adjusted EBITDA (a) $ 133.1 $ 141.9 $ 132.7 $ 128.9 $ 117.7 $ 116.6 $ 110.6
Distributable Cash Flow
Adjusted EBITDA (a) 133.1 141.9 132.7 128.9 117.7 116.6 110.6
Cash interest expense (b) (33.3) (31.8) (29.4) (30.3) (31.2) (30.4) (26.1)
Maintenance capital expenditures (c) (3.9) (5.4) (9.4) (5.5) (5.7) (7.0) (5.9)
(Provision) benefit for income taxes 0.3 (0.4) — (0.1) (0.2) (0.8) 0.2
Deficiency payments 5.7 (0.6) 3.5 2.3 3.8 1.1 —
Public Crestwood Midstream LP unitholders interest in CMLP
distributable cash flow (d) (86.1) (82.3) (77.0) (78.1) (71.2) (60.4) (54.5)
Distributable cash flow attributable to CEQP (e) $ 15.8 $ 21.4 $ 20.4 $ 17.2 $ 13.2 $ 19.1 $ 24.3
(a) EBITDA is defined as income before income taxes, plus debt-related costs (net interest and debt expense and debt expense and loss on modification/extinguishment of debt) and depreciation, amortization and accretion expense. In addition, Adjusted
EBITDA considers the adjusted earnings impact of our unconsolidated affiliates by adjusting our equity earnings or losses from our unconsolidated affiliates for our proportionate share of their depreciation and interest and the impact of certain significant items,
such as unit-based compensation expenses, gains and impairments of long-lived assets and goodwill, gains and losses on acquisition-related contingencies, third party costs incurred related to potential and completed acquisitions, certain environmental
remediation costs, change in fair value of certain commodity derivative contracts, certain costs related to our 2015 cost savings initiatives, and other transactions identified in a specific reporting period. EBITDA and Adjusted EBITDA are not measures
calculated in accordance with GAAP, as they do not include deductions for items such as depreciation, amortization and accretion, interest and income taxes, which are necessary to maintain our business. EBITDA and Adjusted EBITDA should not be
considered an alternative to net income, operating cash flow or any other measure of financial performance presented in accordance with GAAP. EBITDA and Adjusted EBITDA calculations may vary among entities, so our computation may not be comparable
to measures used by other companies.
(b) Cash interest expense less amortization of deferred financing costs plus bond premium amortization plus or minus fair value adjustment of interest rate swaps.
(c) Maintenance capital expenditures are defined as those capital expenditures which do not increase operating capacity or revenues from existing levels. The year ended December 31, 2014, includes $1.5 million of maintenance capital expenditures for January 1,
2014 to September 30, 2014 that was reclassified from growth capital expenditures to maintenance capital expenditures.
(d) Crestwood Midstream distributable cash flow less incentive distributions paid to the general partner and the public LP ownership interest in Crestwood Midstream.
(e) Distributable cash flow is defined as Adjusted EBITDA, less cash interest expense, maintenance capital expenditures, income taxes, deficiency payments (primarily related to deferred revenue), and public Crestwood Midstream LP unitholders interest in
CMLP distributable cash flow. Distributable cash flow should not be considered an alternative to cash flows from operating activities or any other measure of financial performance calculated in accordance with generally accepted accounting principles as those
items are used to measure operating performance, liquidity, or the ability to service debt obligations. We believe that distributable cash flow provides additional information for evaluating our ability to declare and pay distributions to unitholders. Distributable cash
flow, as we define it, may not be comparable to distributable cash flow or similarly titled measures used by other corporations and partnerships.
Connections for America’s Energy™
24