QuickLinks -- Click here to rapidly navigate through this document
As filed with the Securities and Exchange Commission on October 27, 2006
Registration No. 333-133949
SECURITIES AND EXCHANGE COMMISSION
WASHINGTON, DC 20549
AMENDMENT No. 4
TO
FORM S-1
REGISTRATION STATEMENT
UNDER
THE SECURITIES ACT OF 1933
ACA Capital Holdings, Inc.
(Exact name of registrant as specified in its charter)
| Delaware (State or other jurisdiction of incorporation or organization) | 6351 (Primary Standard Industrial Classification Code Number) | 75-3170112 (I.R.S. Employer Identification Number) |
140 Broadway
New York, New York 10005
(212) 375-2000
(Address, including zip code, and telephone number, including
area code, of registrant's principal executive offices)
Nora J. Dahlman, Esq.
Managing Director, General Counsel
ACA Capital Holdings, Inc.
140 Broadway
New York, New York 10005
(212) 375-2000
(Name, address, including zip code, and telephone number, including area code, of agent for service)
| Copies to: | ||
| Valerie Ford Jacob, Esq. Stuart H. Gelfond, Esq. Fried, Frank, Harris, Shriver & Jacobson LLP One New York Plaza New York, New York 10004 (212) 859-8000 | Ethan T. James, Esq. Davis Polk & Wardwell 450 Lexington Avenue New York, New York 10017 (212) 450-4000 | |
Approximate date of commencement of proposed sale to the public: As soon as practicable after this Registration Statement becomes effective.
If any of the securities being registered on this form are to be offered on a delayed or continuous basis pursuant to Rule 415 under the Securities Act, check the following box. o
If this form is filed to register additional securities for an offering pursuant to Rule 462(b) under the Securities Act, check the following box and list the Securities Act registration statement number of the earlier effective registration statement for the same offering. o
If this form is a post-effective amendment filed pursuant to Rule 462(c) under the Securities Act, check the following box and list the Securities Act registration statement number of the earlier effective registration statement for the same offering. o
If this form is a post-effective amendment filed pursuant to Rule 462(d) under the Securities Act, check the following box and list the Securities Act registration statement number of the registration statement for the same offering. o .
CALCULATION OF REGISTRATION FEE
| Title of Each Class of Securities to be Registered | Proposed Maximum Aggregate Offering Price(1)(2) | Amount of Registration Fee | ||
|---|---|---|---|---|
| Common Stock, $0.10 par value per share | $238,591,991 | $25,529.35(3) | ||
- (1)
- Estimated solely for the purpose of calculating the registration fee pursuant to Rule 457(o) under the Securities Act of 1933.
- (2)
- Including shares of common stock which may be purchased by the underwriters to cover over-allotments, if any, and proceeds from the sale of shares of common stock by the selling stockholders.
- (3)
- $10,700 of which has been previously paid.
The registrant hereby amends the Registration Statement on such date or dates as may be necessary to delay its effective date until the registrant shall file a further amendment which specifically states that this registration statement shall thereafter become effective in accordance with section 8(a) of the Securities Act of 1933 or until the registration statement shall become effective on such date as the Commission, acting pursuant to said section 8(a), may determine.
The information in this prospectus is not complete and may be changed. We may not sell these securities until the registration statement filed with the Securities and Exchange Commission is effective. This prospectus is not an offer to sell these securities, and we are not soliciting an offer to buy these securities in any jurisdiction where the offer or sale is not permitted.
Subject to completion, dated October 27, 2006
12,204,323 Shares
ACA Capital Holdings, Inc.
Common Stock
We are selling 6,875,000 shares of our common stock and the selling stockholders named in this prospectus are selling 5,329,323 shares. We will not receive any proceeds from the sale of shares by the selling stockholders. Prior to this offering, there has been no public market for our common stock. The initial public offering price is expected to be between $15 and $17 per share. Our common stock has been approved for listing on the New York Stock Exchange under the symbol "ACA" subject to official notice of issuance.
The underwriters have an option to purchase a maximum of 1,830,500 additional shares of our common stock to cover over-allotments of shares.
Investing in our common stock involves risks. See "Risk Factors" starting on page 10.
| | Price to Public | Underwriting Discounts and Commissions | Proceeds to ACA Capital | Proceeds to the Selling Stockholders | ||||||||
|---|---|---|---|---|---|---|---|---|---|---|---|---|
Per Share | $ | $ | $ | $ | ||||||||
| Total | $ | $ | $ | $ | ||||||||
Delivery of the shares of common stock will be made on or about , 2006.
Neither the Securities and Exchange Commission nor any state securities commission has approved or disapproved of these securities or determined if this prospectus is truthful or complete. Any representation to the contrary is a criminal offense.
Credit Suisse | JPMorgan | Bear, Stearns & Co. Inc. |
| Stephens Inc. | Keefe, Bruyette & Woods |
The date of this prospectus is , 2006.
| | Page | |
|---|---|---|
| PROSPECTUS SUMMARY | 1 | |
| RISK FACTORS | 10 | |
| FORWARD-LOOKING STATEMENTS | 28 | |
| USE OF PROCEEDS | 30 | |
| DIVIDEND POLICY | 31 | |
| CAPITALIZATION | 32 | |
| DILUTION | 33 | |
| SELECTED CONSOLIDATED FINANCIAL AND OTHER DATA | 35 | |
| MANAGEMENT'S DISCUSSION AND ANALYSIS OF FINANCIAL CONDITION AND RESULTS OF OPERATIONS | 37 | |
| INDUSTRY OVERVIEW | 103 | |
| BUSINESS | 112 | |
| MANAGEMENT | 142 | |
| COMMITTEES OF THE BOARD OF DIRECTORS | 145 | |
| EXECUTIVE COMPENSATION | 148 | |
| PRINCIPAL AND SELLING STOCKHOLDERS | 154 | |
| CERTAIN RELATIONSHIPS AND RELATED PARTY TRANSACTIONS | 158 | |
| DESCRIPTION OF CAPITAL STOCK | 160 | |
| SHARES ELIGIBLE FOR FUTURE SALE | 164 | |
| MATERIAL U.S. FEDERAL INCOME TAX CONSIDERATIONS | 166 | |
| UNDERWRITING | 170 | |
| LEGAL MATTERS | 176 | |
| EXPERTS | 176 | |
| CHANGE IN INDEPENDENT REGISTERED PUBLIC ACCOUNTING FIRM | 176 | |
| WHERE YOU CAN FIND ADDITIONAL INFORMATION | 176 | |
| INDEX TO CONSOLIDATED FINANCIAL STATEMENTS | F-1 |
In this prospectus, "we," "us" and "our" refer to ACA Capital Holdings, Inc., or ACA Capital, and its subsidiaries and not to the underwriters.
You should rely only on the information contained in this document or to which we have referred you. We have not authorized anyone to provide you with information that is different. This document may only be used where it is legal to sell these securities. The information in this document may only be accurate as of the date specified herein or on the date of this document.
The data included in this prospectus regarding markets and product categories, including, but not limited to, the size of certain markets and product categories, are based on our estimates and definitions, which have been derived from third party sources and management's knowledge and experience in the areas in which the relevant businesses operate. We have given market data for which the most recent information is available, which may be a different time period for different markets. We believe that these sources, in each case, provide reasonable estimates. However, market data is subject to change and cannot be verified with certainty due to limits on the availability and reliability of raw data, the voluntary nature of the data gathering process and other limitations and uncertainties inherent in any statistical survey of market shares. In addition, we may define our markets in a way that may be different from how third parties, including our competitors, define various markets in which we participate.
Until , 2006, all dealers that buy, sell or trade in shares of our common stock, whether or not participating in this offering, may be required to deliver a prospectus. This is in addition to the dealer's obligation to deliver a prospectus when acting as underwriters and with respect to their unsold allotments or subscriptions.
The following summary highlights information contained elsewhere in this prospectus and may not contain all of the information that may be important to you. You should read all of the information in this prospectus, including the consolidated financial statements and related notes, and the risks of investing in our common stock discussed under "Risk Factors," before making an investment decision.
ACA Capital is a holding company engaged in the business of providing financial guaranty insurance products to participants in the global credit derivatives markets, structured finance capital markets and municipal finance capital markets. We also provide asset management services to specific segments of the structured finance capital markets. We participate in our target markets both as a provider of credit protection through the sale of financial guaranty insurance products, for risk-based revenues, and as an asset manager, for fee-based revenues. We conduct our financial guaranty insurance businesses through ACA Financial Guaranty Corporation, our "A" rated, regulated insurance subsidiary. We conduct our asset management business through ACA Management, L.L.C., a subsidiary of ACA Financial Guaranty. As of June 30, 2006, we had insured credit exposure of $31.4 billion and our assets under management for third parties were $12.1 billion. For the six months ended June 30, 2006, we had total revenues of $215.3 million and net income of $26.2 million. As of June 30, 2006, our stockholders' equity was $412.7 million.
We operate through three strategic business units: our two insurance lines of business, Structured Credit and Municipal Finance, and our CDO Asset Management business. Each of these businesses relies on our core competencies of credit analysis, transaction structuring, risk management and surveillance. Applying these competencies across our platform allows us to create efficiencies in our operations and to deliver a wide range of services and products to our institutional customers.
Financial Guaranty Insurance Lines of Business
Structured Credit: As part of our financial guaranty insurance business, we select, structure and sell credit protection through insured credit swaps in the institutional fixed income markets. A credit swap is a derivative instrument, the performance of which is directly related to the performance of an underlying financial obligation, or reference obligation, such as a bond or a loan, issued by a third party, or reference entity. Credit swaps are capital markets products used to manage or transfer credit risk and are freely tradable separately from the obligations of the underlying reference entity. We execute our credit swaps through special purpose vehicles whose obligations under these swaps are insured by ACA Financial Guaranty. Historically, we have generally sold credit protection through insured credit swaps on highly rated layers of risk associated with pools of assets that were either selected by us or held within CDOs of financial assets managed by third parties. The financial assets underlying our insured credit swaps principally include corporate credits, ABS and mortgaged backed securities, or MBS.
We generate revenues in our Structured Credit business through the premiums paid to ACA Financial Guaranty to insure against the risk of default on the assets underlying our credit swaps. Currently our insured credit swap portfolio is constructed primarily of exposures with credit profiles equivalent to "AAA" rated exposures. We executed our first Structured Credit transaction in July 2002 and, as of June 30, 2006, we had completed 121 Structured Credit transactions with 22 different counterparties; 108 of these transactions are currently outstanding, representing $24.4 billion in total outstanding insured credit swaps. As of June 30, 2006 the weighted average premium in our then current insured Structured Credit portfolio was 0.19% per annum.
Municipal Finance: Since 1997, we have provided financial guaranty insurance on municipal and other public finance bonds that guarantee to the investor the timely payment of interest and the ultimate payment of principal on such obligations. Through our "A" ("strong," the sixth highest of 21 rating levels) rated financial guaranty insurance subsidiary by Standard & Poor's Rating Services, or S&P, we target low investment grade, non-investment grade and unrated sectors of the
1
market. Our market segment is underserved by higher rated financial guarantors due to rating agency limitations and company specific risk policy constraints. We also target markets that are underserved by reason of industry sector, credit characteristics or transaction size. We are licensed to provide financial guaranty insurance in all 50 states, the District of Columbia, Guam, Puerto Rico and the U.S. Virgin Islands. The maintenance of our financial guaranty insurance subsidiary also provides us with significant execution flexibility that we utilize across our other business lines.
We generate revenue in our Municipal Finance business through the receipt of premiums for the insurance we provide. As of June 30, 2006 we had $6.3 billion of net par insured in our municipal finance portfolio. As of June 30, 2006 our weighted average premium as a percentage of total debt service on our insured Municipal Finance portfolio was 2.49%.
Other Financial Services
CDO Asset Management: We serve as an asset manager of collateralized debt obligations, or CDOs. A CDO is a securitization of fixed income assets such as bonds, loans, asset backed securities, or ABS, and credit default swaps, or credit swaps. To grow our assets under management, we sponsor CDOs that acquire pools of fixed-income assets that we select and manage. CDO assets are funded by the issuance of various liabilities with credit profiles ranging from "AAA" rated debt to non-rated equity. Our CDOs have a diverse worldwide institutional investor base that includes banks, money managers, non-bank financial institutions, hedge funds, pension funds and insurance companies.
Our CDO Asset Management revenues consist of asset management fees and risk-based revenue in the form of return on our equity investments in our CDOs. Typically, we invest in some portion of the equity of our managed CDOs, currently between 5% to 25% of the total equity offered. These investments increase the marketability of our CDOs by aligning our interests as asset manager with those of our CDO investors and thereby maximizing our CDO assets under management. In 2005 and the first six months of 2006, we invested a total of $16.0 million and $2.9 million, respectively, in the equity of our CDOs while increasing our assets under management by $2.1 billion and $2.2 billion, respectively. We completed our first CDO in January 2002 and, as of June 30, 2006, we had closed 17 CDO transactions and have grown our CDO assets under management from $2.4 billion as of year-end 2002 to $12.1 billion as of June 30, 2006. At June 30, 2006, our weighted average asset management fee was 0.21% per annum on CDO assets under our management. Based on our knowledge of the market, we believe we are one of the largest global CDO managers as ranked by assets under management.
Growth in Our Markets
Our three business lines focus on segments of the credit markets that have experienced rapid growth and/or represent large markets which remain underserved by traditional providers of credit protection products. Our Structured Credit business has benefited from the high rate of growth in the number of transactions and market participants, including banks, broker/dealers, hedge funds and other institutional investors, in the global credit derivatives markets. The total notional outstanding of the credit swaps market has grown from approximately $918.9 billion in 2001 to approximately $26.0 trillion through the first half of 2006, representing a compound annual growth rate of 110.2% during this period. Within our Municipal Finance business we benefit from being the only "A" rated financial guarantor focused on markets that are large and underserved. The total amount of new low investment grade, non-investment grade and non-rated municipal issues in 2005 was $62.4 billion. Excluding the sectors of the municipal finance market in which we currently do not participate based on our underwriting criteria, total new issuance in 2005 was $29.4 billion, of which we had a 1.7% overall market penetration. Our CDO Asset Management products are designed to serve investors' growing demand for structured products. New issue funded CDO volume in the U.S. and European markets increased from $94.4 billion at December 31, 1998 to $271.1 billion at June 30, 2006, representing a compound annual growth rate of 15.1% during this period.
2
Competitive Strengths
We believe that the following competitive strengths enable us to capitalize on opportunities to assume credit exposures through our "A" rated insurance company on select opportunities that meet our risk-adjusted return objectives and to grow our assets under management.
Extensive credit and risk management expertise. We have a proven track record in each of our principal business lines of strong and successful credit analysis and risk management as evidenced by our low loss experience. We apply a rigorous underwriting and credit process to analyze each transaction and its incremental effect on our existing risk portfolio and also employ sophisticated qualitative and quantitative institutional risk management systems to monitor and manage our exposure across our business lines and in our investment portfolio.
- •
- In our Structured Credit business we use proprietary quantitative models to analyze and optimize risk positions in terms of capital usage and risk-adjusted returns. We have significant competence in understanding and assessing relative values between transactional opportunities. Since the establishment of this business line in July 2002, we have made no payments in respect of defaults under our insured credit swaps.
- •
- In our Municipal Finance business we have a seasoned underwriting team with substantial experience in our target markets. Since our inception in September 1997, we have paid $4.9 million of net losses and loss adjustment expenses on our total Municipal Finance portfolio, which represents less than 2% of premiums written.
- •
- In our CDO Asset Management business our strength lies in our asset selection expertise and ongoing management of individual credits included in our CDOs. Since the completion of our first CDO in January 2002, we have not experienced any adverse rating actions or downgrades on any of the debt securities issued by our CDOs.
Our credit assessment, underwriting and monitoring processes are designed to limit loss frequency and severity, however, we anticipate both cyclical and idiosyncratic loss activity across our portfolio of credit exposures. Consequently, we place significant emphasis on managing loss severity should losses occur. We have adopted a formalized underwriting and risk management approach which is designed to ensure that the risk profile of a given credit or transaction meets our credit, profitability and loss tolerance standards, as well as to monitor and limit our exposure across all of our business lines and our own investment portfolio.
Operating flexibility and counterparty security from our insurance subsidiary's "A" financial strength rating. Our insurance subsidiary's "A" financial strength rating enables us to achieve an optimal balance between providing broad operating flexibility for us and providing security for our counterparties and investors in our Structured Credit and Municipal Finance businesses.
- •
- Structured Credit. Our "A" rating affords our Structured Credit business significant flexibility to offer credit protection through our financial guaranty insurance products on any portion of a given capital structure, from "AAA" equivalent exposures through equity, and on a diverse mix of asset classes, as compared to other market participants with higher credit ratings or more limited operating platforms. Though our "A" rating generally eliminates the need to post security on performing transactions, we have the flexibility, unlike other higher rated entities, to post collateral to secure our transactions in the event the transaction performance severely deteriorates or we experience a corporate credit event. Our willingness to provide such security, combined with our "A" rated platform, enhances counterparties' willingness to transact with us.
- •
- Municipal Finance. As the only "A" rated financial guarantor in the municipal finance business, our insurance subsidiary is not only able to guarantee the obligations of lower investment grade issuers, but is the only financial guaranty insurer able to offer significant capacity to non-investment grade and unrated municipal credits. In the municipal finance market, our financial guaranty insurance platform allows us to issue policies for the life of the insured exposure, a significant advantage versus bank letter of credit competition in that market.
3
Diverse revenue sources. Our three business lines provide diverse revenue sources, both risk- and fee-based, from three distinct segments of the credit markets. The Structured Credit business provides risk-based revenue and attractive risk-adjusted returns on capital. The Municipal Finance business generally receives premiums up-front which provide current year cash flow and a predictable stream of longer term revenues as the unearned premiums are recognized as income over the typically 30-year life of the guaranteed bond. We also earn interest income on the investment portfolio of our insurance subsidiary which had invested assets of $536.7 million as of June 30, 2006. The CDO Asset Management business provides a stable and growing source of fee income based on assets under management. We also receive fees related to the origination of CDOs and a return on our equity investments in our CDOs. A significant portion of such revenues is included as investment income in our financial statements since some of our earlier CDOs are consolidated under accounting principles generally accepted in the United States of America, or U.S. GAAP.
Efficient and scalable operations. Our credit analysis, transaction structuring and risk management expertise, together with our quantitative analytical capability and infrastructure of information technology, accounting, legal and other professionals with significant experience in our businesses, allows us to easily and quickly grow our assets under management and expand into new credit-based product lines without incurring significant additional costs.
Management team with significant industry and operating experience. Our senior executive management team has an average of over 22 years of industry experience in fixed income analysis, finance, investment banking, and financial guaranty insurance and reinsurance. Additionally, our Board of Directors consists of members with substantial experience in the financial services industry.
Business Strategy
Our business strategy is to continue to leverage our credit management expertise to generate attractive risk-adjusted returns on our capital in our financial guaranty insurance lines of business through the insurance of targeted credit exposure and to grow our assets under management. We plan to achieve these objectives through the following strategies:
Grow our insured credit exposure and assets under management. We have significantly increased our insured credit exposure and assets under management, and intend to continue to grow our financial guaranty insurance Structured Credit and Municipal Finance businesses and CDO Asset Management business, in terms of number of transactions, size of transactions, as well as the types of asset classes that we insure and manage. For example, in 2005 we insured additional credit exposure in our Structured Credit portfolio of $10.0 billion and added leveraged loan CDOs, or CLOs, and synthetic ABS CDO products. We are also in the process of expanding our Structured Credit and CDO Asset Management businesses internationally.
Target the most attractive risk-adjusted returns in the credit markets. In our financial guaranty insurance business lines, we target those segments of the markets that we believe offer enhanced economic returns. In our Structured Credit business, we currently focus on selling credit protection through our insurance products on layers of exposure with credit profiles equivalent to "AAA" rated exposures, which we believe currently offers the most favorable risk-adjusted returns. However, we have the operating flexibility to assume credit exposures throughout the entire capital structure based on our relative value view of risk and return under changing market conditions. In our Municipal Finance business we will continue to increase penetration in our target markets which we believe offer attractive risk-adjusted returns.
Expand our existing product lines and develop new credit product areas. Our ability to expand existing products into broader geographic areas, asset classes and credit profiles is a function of the flexibility of our execution alternatives and "A" rating of our insurance subsidiary, ACA Financial Guaranty. By using our execution alternatives (insurance policies, insured credit swaps and cash), alone or in combination, we can assume credit exposure in various markets and access opportunities when
4
they emerge. In our Structured Credit business we will continue developing our credit expertise into the evolving ABS, leveraged loan, project finance and MBS credit swap markets. In our Municipal Finance business we plan to utilize our expertise in financing municipal health care, transportation, student housing, and similar revenue-based projects to expand our business into broader financing opportunities for enterprises, tax-exempt or otherwise.
Expand counterparty and other key relationships for our insurance lines of business. Our Structured Credit business is dependent upon our developing and maintaining strong business relationships with other financial institutions that act as counterparties in insured credit swap transactions. We have substantially increased our relationships in recent years, increasing our Structured Credit counterparties to 22 at June 30, 2006, and will continue to focus on building new counterparty relationships. In our Municipal Finance business we intend to strengthen our marketing efforts and expand our relationships with the investment banks and financial advisors most responsible for producing transactions in our target markets.
Sustain the operating flexibility of an "A" financial strength rating for our financial guaranty insurance subsidiary. We believe an "A" rating for our insurance subsidiary is optimal for maximizing our strategic business opportunities. Our objective is to maintain capital adequacy in excess of S&P's requirements for "A" rated insurers so that we have excess rating agency capital to absorb unforeseen losses but to otherwise operate in a manner consistent with the greater operating flexibility afforded to us due to our "A" rating by S&P, which is not afforded to higher rated insurers.
Risks Relating to Our Business and this Offering
We face certain risk factors that could materially affect our business, results of operations or financial condition, which include:
Failure to effectively analyze credit and other risks. Our ability to analyze and manage credit risk is at the core of each of our business lines. All of our business lines will be materially impacted if we fail to do this effectively.
General economic and capital markets factors. Our business is impacted by general economic conditions and capital markets activities that affect demand for our products, including the potential negative impact of recessions and business failures as well as any tightening of credit spreads.
Concentration of liabilities and investments. While we seek diversification across our businesses, in each of our business lines and in our investment portfolio, we face risks to the extent that our aggregate exposure to losses is concentrated geographically, by industry, sector, obligor or type of credit or investment. In the event that a particular industry or region experiences an economic downturn or natural disaster, or we are over-exposed to a business that experiences a credit event, our performance may be materially negatively impacted.
Possibility of negative ratings action. If S&P places us on CreditWatch or downgrades our insurance subsidiary's financial strength rating, it could have a material adverse effect on our ability to compete and on our results of operations.
Adequacy of loss reserves. We establish estimated liabilities, or loss reserves, to reflect the estimated cost of claims incurred that we will ultimately be required to pay in respect of the financial guaranty insurance we have written. If our loss reserves at any time are determined to be inadequate, we would be required to increase loss reserves at the time of such determination. This could cause a material increase in our liabilities and a reduction in our profitability, or possibly an operating loss and reduction of capital.
For more information about these and other risks relating to our Company, see "Risk Factors" beginning on page 10. You should carefully consider these risk factors together with all the other information included in this prospectus.
5
| Common stock offered by ACA Capital | 6,875,000 shares | |
| Common stock offered by selling stockholders | 5,329,323 shares | |
| Common stock to be outstanding after this shares offering(1) | 36,762,281 shares | |
| Use of proceeds | We estimate that our net proceeds from the initial public offering of our common stock, after deducting the underwriting discounts and commissions and our estimated offering expenses, will be approximately $98,300,000 (based on the midpoint of the price range on the cover of this prospectus). We estimate that our net proceeds will be approximately $125,537,840 if the underwriters exercise their over-allotment option in full (based on the midpoint of the price range on the cover of this prospectus). We intend to use the net proceeds of this offering for general corporate purposes. See "Use of Proceeds." We will not receive any of the proceeds from the sale of shares by the selling stockholders. | |
| NYSE symbol | "ACA" | |
| Dividend policy | We do not anticipate paying dividends on our common stock in the foreseeable future. We plan to retain earnings for use in the operation of our business and to fund future growth. |
- (1)
- The number of shares of common stock to be outstanding after this offering reflects a dividend to effect a 6-for-1 split of our outstanding common stock which was effective August 23, 2006 and the conversion of our preferred shares into common stock, in the case of our convertible preferred stock and senior convertible preferred stock, at a conversion rate of 6,000 shares of common stock for each such share of preferred stock and, in the case of series B senior convertible preferred stock, at a conversion rate of six shares of common stock for each such share or preferred stock, all of which will occur concurrently with the closing of this offering. The number of shares of common stock to be outstanding after this offering is based on the number of shares outstanding as of October 3, 2006, the number of shares included in this offering and 239,000 shares of restricted stock that we have granted contingent upon the completion of this offering to certain independent directors and employees at the effective time of this offering and excludes:
- •
- 1,830,500 shares of common stock issuable upon the exercise of the underwriters' over-allotment option;
- •
- 2,973,918 shares of common stock reserved under our Amended and Restated 2006 Stock Incentive Plan but not yet issued as of October 3, 2006 (543,000 shares of which are reserved for issuance pursuant to the exercise of certain options granted contingent upon the completion of this offering); and
- •
- 3,354,054 shares of common stock that may be issued pursuant to options outstanding as of October 3, 2006 at a weighted average exercise price of $11.28 per share.
ACA Capital is a Delaware corporation. Our principal subsidiary through which we currently operate our business is ACA Financial Guaranty Corporation, our "A" rated insurance subsidiary that is organized in the State of Maryland. ACA Service, L.L.C., a wholly-owned indirect subsidiary of ACA Financial Guaranty, is a Delaware limited liability company that owns the majority of the special purpose entities through which we execute our insured credit swaps. ACA Financial Guaranty insures the obligations of the special purpose vehicles in our Structured Credit line of business. Our CDO Asset Management services are conducted through ACA Management, L.L.C., also a wholly-owned indirect subsidiary of ACA Financial Guaranty. ACA Management, L.L.C. is a Delaware limited liability company. ACA Management, L.L.C. is registered with the Securities and Exchange Commission as an investment adviser. In addition to our three operating businesses, we have a fourth line of business that includes insurance products in which we no longer write new business. Our principal executive office is located at 140 Broadway, New York, New York 10005 and our telephone number is (212) 375-2000. We maintain a website at www.aca.com. Information on our website is not a part of this prospectus.
ACA Capital was formed in 1997 and our largest stockholders include Bear Stearns Merchant Banking, SF Holding Corp. (f/k/a Stephens Group, Inc.), the Third Avenue Value Trust, GCC Investments, LLC and AEGON USA Inc.
6
SELECTED CONSOLIDATED FINANCIAL AND OTHER DATA
The following table sets forth our selected consolidated financial data for the periods presented. The consolidated statements of operations for the years ended December 31, 2003, 2004 and 2005 and the consolidated balance sheet data as of December 31, 2004 and 2005 are derived from our audited consolidated financial statements and related notes included elsewhere in this prospectus. The consolidated statements of operations for the years ended December 31, 2001 and 2002 and the consolidated balance sheet data as of December 31, 2001, 2002 and 2003 are derived from our historical consolidated financial statements not included in this prospectus. The selected historical financial data as of and for the six months ended June 30, 2005 and 2006 is derived from our unaudited interim financial statements and includes, in the opinion of management, all adjustments, consisting only of normal recurring adjustments, that we consider necessary for the fair presentation of our financial position and results of operations for these periods. The results of operations for prior accounting periods are not necessarily indicative of the results to be expected for any future accounting periods. You should read this information together with "Management's Discussion and Analysis of Financial Condition and Results of Operations" and our consolidated financial statements and the related notes thereto included elsewhere in this prospectus.
| | Year Ended December 31, | Six Months Ended June 30, | ||||||||||||||||||||||
|---|---|---|---|---|---|---|---|---|---|---|---|---|---|---|---|---|---|---|---|---|---|---|---|---|
| | 2001 | 2002 | 2003 | 2004 | 2005 | 2005 | 2006 | |||||||||||||||||
| | (in thousands, except per share amounts) | |||||||||||||||||||||||
| Statement of Operations Data(a): | ||||||||||||||||||||||||
| Gross premiums written | $ | 23,021 | $ | 53,350 | $ | 60,981 | $ | 44,570 | $ | 41,280 | $ | 17,805 | $ | 20,515 | ||||||||||
| Net premiums written | $ | 5,459 | $ | 45,520 | $ | 57,516 | $ | 45,481 | $ | 41,918 | $ | 18,571 | $ | 20,329 | ||||||||||
| Premiums earned | $ | 6,672 | $ | 12,062 | $ | 18,796 | $ | 29,833 | $ | 33,343 | $ | 16,221 | $ | 13,357 | ||||||||||
| Net insured credit swap revenue | — | 1,557 | 6,841 | 16,018 | 21,571 | 4,543 | 22,111 | |||||||||||||||||
| Net investment income | 11,567 | 20,269 | 52,868 | 126,170 | 254,591 | 114,474 | 160,164 | |||||||||||||||||
| Net realized gains (losses) on investments | 6,511 | 4,138 | 3,188 | (6,547 | ) | (2,777 | ) | (1,223 | ) | (3,223 | ) | |||||||||||||
| Net realized and unrealized gains (losses) on derivative instruments | — | (25,092 | ) | 9,124 | 6,520 | 8,410 | 4,040 | 6,139 | ||||||||||||||||
| Other net credit swap revenue | — | 4,975 | 12,121 | 10,990 | 4,157 | 2,524 | 5,544 | |||||||||||||||||
| Fee income | 194 | 4,236 | 8,898 | 6,091 | 11,110 | 4,366 | 11,073 | |||||||||||||||||
| Other income | — | 676 | 423 | 3,937 | 189 | 295 | 104 | |||||||||||||||||
| Total revenues | 24,944 | 22,821 | 112,259 | 193,012 | 330,594 | 145,240 | 215,269 | |||||||||||||||||
| Loss and loss adjustment expenses | 1,636 | 1,801 | 3,168 | 46,590 | 14,038 | 4,139 | 3,682 | |||||||||||||||||
| Policy acquisition costs | 3,680 | 4,046 | 4,077 | 3,835 | 8,652 | 3,984 | 4,160 | |||||||||||||||||
| Other operating expenses | 16,053 | 18,683 | 29,466 | 38,645 | 37,443 | 14,669 | 23,294 | |||||||||||||||||
| Interest expense | 126 | 9,869 | 39,260 | 101,137 | 214,313 | 95,504 | 137,383 | |||||||||||||||||
| Depreciation and amortization | 730 | 1,081 | 4,115 | 6,935 | 8,583 | 4,064 | 4,717 | |||||||||||||||||
| Total expenses | 22,225 | 35,480 | 80,086 | 197,142 | 283,029 | 122,360 | 173,236 | |||||||||||||||||
| (Income) loss of minority interest | — | — | — | 476 | (3,708 | ) | (1,685 | ) | (2,229 | ) | ||||||||||||||
| Income (loss) before provision (benefit) for income taxes | 2,719 | (12,659 | ) | 32,173 | (3,654 | ) | 43,857 | 21,195 | 39,804 | |||||||||||||||
| Provision (benefit) for income taxes | 110 | (6,318 | ) | 12,206 | 135 | 15,097 | 8,078 | 13,615 | ||||||||||||||||
| Net income (loss) | $ | 2,609 | $ | (6,341 | ) | $ | 19,967 | $ | (3,789 | ) | $ | 28,760 | $ | 13,117 | $ | 26,189 | ||||||||
Share and Per Share Data(b): | ||||||||||||||||||||||||
| Earnings (loss) per share | ||||||||||||||||||||||||
| Basic | $ | 0.42 | $ | (1.01 | ) | $ | 3.18 | $ | (0.61 | ) | $ | 1.26 | $ | 0.58 | $ | 1.15 | ||||||||
| Diluted | $ | 0.22 | $ | (1.01 | ) | $ | 1.51 | $ | (0.61 | ) | $ | 0.96 | $ | 0.44 | $ | 0.87 | ||||||||
| Weighted average number of shares of common stock outstanding | ||||||||||||||||||||||||
| Basic | 6,168 | 6,282 | 6,270 | 6,168 | 22,794 | 22,698 | 22,830 | |||||||||||||||||
| Diluted | 11,868 | 6,282 | 13,260 | 6,168 | 29,886 | 29,682 | 29,846 | |||||||||||||||||
| Book value per share(c) | $ | 13.49 | $ | 12.42 | $ | 15.04 | $ | 12.38 | $ | 13.04 | $ | 12.89 | $ | 13.89 | ||||||||||
7
| | As of December 31, | As of June 30, | |||||||||||||||||||
|---|---|---|---|---|---|---|---|---|---|---|---|---|---|---|---|---|---|---|---|---|---|
| | 2001 | 2002 | 2003 | 2004 | 2005 | 2005 | 2006 | ||||||||||||||
| | (in thousands, except per share amounts and where otherwise noted) | ||||||||||||||||||||
| Summary Balance Sheet Data(a): | |||||||||||||||||||||
| Cash and cash equivalents(d) | $ | 32,355 | $ | 82,361 | $ | 212,511 | $ | 259,000 | $ | 224,605 | $ | 249,345 | $ | 276,771 | |||||||
| Total investments(e) | 199,317 | 726,184 | 3,109,179 | 5,275,699 | 5,418,079 | 5,416,782 | 5,312,037 | ||||||||||||||
| Derivative assets | 0 | 6,752 | 19,343 | 28,460 | 15,250 | 20,108 | 16,868 | ||||||||||||||
| Total assets(d)(e) | 299,062 | 916,966 | 3,463,863 | 5,691,961 | 5,792,200 | 5,808,066 | 5,745,503 | ||||||||||||||
| Unearned premiums | 101,208 | 136,222 | 172,278 | 180,140 | 187,739 | 181,602 | 194,486 | ||||||||||||||
| Reserve for losses and loss adjustment expenses | 3,405 | 6,555 | 4,984 | 36,006 | 34,306 | 27,122 | 37,244 | ||||||||||||||
| Total debt(e) | 825 | 541,470 | 2,964,332 | 4,903,047 | 5,029,348 | 5,077,464 | 4,956,448 | ||||||||||||||
| Derivative liabilities | 0 | 40,010 | 64,045 | 58,755 | 46,538 | 63,618 | 31,628 | ||||||||||||||
| Total liabilities | 128,144 | 757,106 | 3,269,557 | 5,306,424 | 5,385,646 | 5,406,543 | 5,299,658 | ||||||||||||||
| Minority interest | — | — | — | 20,923 | 22,241 | 22,935 | 33,129 | ||||||||||||||
| Accumulated other comprehensive income | 919 | (5,583 | ) | 8,896 | 21,952 | 11,132 | 24,309 | 12,680 | |||||||||||||
| Total stockholders' equity | 170,918 | 159,860 | 194,306 | 364,614 | 384,313 | 378,588 | 412,716 | ||||||||||||||
| Other Data(g): | |||||||||||||||||||||
| Credit exposure(f) (in millions) | $ | 5,563 | $ | 6,378 | $ | 8,563 | $ | 11,296 | $ | 21,467 | $ | 14,017 | $ | 31,406 | |||||||
| CDO assets under management (in millions) | N/A | $ | 2,403 | $ | 5,830 | $ | 7,798 | $ | 9,907 | $ | 8,440 | $ | 12,120 | ||||||||
| Statutory Financial Data (ACA Financial Guaranty)(g): | |||||||||||||||||||||
| Contingency reserve(h) | $ | 13,959 | $ | 21,162 | $ | 31,520 | $ | 46,129 | $ | 74,377 | $ | 61,921 | $ | 90,893 | |||||||
| Policyholders' surplus | 106,802 | 123,635 | 134,565 | 279,985 | 266,108 | 270,485 | 263,444 | ||||||||||||||
| Qualified statutory capital(i) | $ | 120,761 | $ | 144,797 | $ | 166,085 | $ | 326,114 | $ | 340,485 | $ | 332,406 | $ | 354,337 | |||||||
- (a)
- Under U.S. GAAP, we are required to consolidate into our financial statements the income, expense, assets and liabilities related to certain of our CDOs when we are deemed to be the primary beneficiary of the CDO vehicle. Although these CDOs are consolidated, we do not have the right to use the assets of the CDOs for general operations or in satisfaction of our corporate debt obligations. Our investment exposure to our CDOs is therefore limited to the equity we retain, which is the first loss position of the CDO. For a description of the impact of consolidation on our financial statements, see "Management's Discussion and Analysis of Financial Condition and Results of Operations—Critical Accounting Policies and Estimates—Consolidation of Variable Interest Entities (VIEs) and Other Restricted Investments" and "Management's Discussion and Analysis of Financial Condition and Results of Operations—Results by Business Line—CDO Asset Management—Consolidation of VIEs."
- (b)
- Earnings per share and weighted average number of shares of common stock outstanding were restated to reflect the 6-for-1 stock split that was completed on August 23, 2006.
- (c)
- Book value per share is based on total stockholders' equity divided by basic common stock outstanding after giving effect to the August 23, 2006 stock split and gives effect to the conversion of our convertible preferred stock, senior convertible preferred stock and series B senior convertible preferred stock on a post-conversion basis.
- (d)
- Includes cash and cash equivalents related to our consolidated CDOs of $0, $6.1 million, $109.6 million, $141.3 million, $125.2 million, $147.6 million and $187.7 million as of December 31, 2001, 2002, 2003, 2004 and 2005 and June 30, 2005, and 2006 respectively. Also includes restricted cash balances of $0, $22.0 million, $30.9 million, $30.1 million, $50.2 million, $40.3 million and $54.1 million as of December 31, 2001, 2002, 2003, 2004 and 2005 and June 30, 2005 and 2006, respectively. Restricted cash balances relate to cash on deposit for the benefit of various counterparties in our CDO Asset Management and Structured Credit businesses.
- (e)
- Includes investments related to our consolidated CDOs of $0, $382.7 million, $2,711.4 million, $4,732.2 million, $4,810.9 million, $4,818.4 million and $4,709.9 million and a guaranteed investment contract related to our consolidated CDOs of $0, $122.5 million, $122.5 million, $122.6 million, $119.3 million, $122.6 million and $119.3 million both as of December 31, 2001, 2002, 2003, 2004 and 2005, and June 30, 2005 and 2006, respectively. Includes non-recourse debt related to our consolidated CDOs of $0, $494.5 million, $2,804.8 million, $4,728.6 million, $4,833.2 million, $4,882.1 million and $4,762.6 million as of December 31, 2001, 2002, 2003, 2004 and 2005, and June 30, 2005 and 2006, respectively.
8
- (f)
- Equal to the amount of notional and net par outstanding guaranteed by ACA Financial Guaranty.
- (g)
- This information is not derived from our audited consolidated financial statements or unaudited interim consolidated financial statements.
- (h)
- Under statutory accounting practices, or SAP, prescribed or permitted by the Maryland Insurance Administration, we are required to establish contingency reserves based on a specified percentage of either written premiums or insured exposure by bond type. A contingency reserve is an additional liability reserve established to protect the policyholder against the effects of adverse economic developments or cycles or other unforeseen circumstances.
- (i)
- Qualified statutory capital, comprised of the sum of policyholders' surplus and contingency reserve, is a commonly used measure of statutory based equity in the financial guaranty industry.
9
An investment in our common stock involves a number of risks. You should carefully consider the following information about these risks, together with all of the other information in this prospectus, before deciding to invest in our common stock. The risks and uncertainties described below are not the only ones we face. Additional risks that we currently don't know about or deem to be immaterial may also impair our business or results of operations. Any of the risks described below could result in a significant or material adverse effect on our results of operations or financial condition, and a corresponding decline in the market price of our common stock. You could lose part or all of your investment.
Risks Related to Our Business
Our failure to effectively analyze and monitor credit and other risks could have a material adverse effect on our financial condition, results of operations and capital adequacy.
Our ability to analyze, monitor and manage credit risk is at the core of each of our business lines. All of our business lines will be materially impacted if we fail to do this effectively.
In our Structured Credit business, if we fail to accurately analyze the credit and other risks associated with selling credit protection through our financial guaranty insurance products in our Structured Credit line of business, we may suffer unexpected losses, which could materially and adversely affect our results of operations and financial condition.
Our Municipal Finance operations also depend significantly on our ability to effectively analyze and monitor credit risks. We guarantee obligations over an extended period of time, typically up to 30 years, and in riskier credit rating categories and sectors than the other financial guaranty insurance companies. As of June 30, 2006, based on our risk management internal rating systems, 34.9% of our Municipal Finance par exposure was rated non-investment grade. We have also targeted certain industry sectors, such as healthcare and long-term care, which are higher risk credits than those exposures typically taken by other financial guaranty insurers. We have in the past, and expect in the future to, incur losses in our Municipal Finance portfolio. If we do not accurately assess the credit risk and the related security and structural protections in these transactions and effectively monitor and manage these risks on an ongoing basis, we may incur significant losses in excess of our expectations.
Our future success in structuring and managing CDOs will depend on our ability to accurately analyze the financial assets that comprise the CDOs. We attempt to manage our CDO portfolio by selling deteriorating credits in a timely manner in order to mitigate losses as they develop; however, we may not be able to do so. If we do not effectively manage our CDOs, our reputation as a CDO asset manager could be negatively affected, which could materially and adversely affect our ability to originate future CDOs. In some cases, we also bear a portion of the risk associated with credit losses if there are defaults or assets otherwise become ineligible for inclusion in a CDO during the warehousing phase. See "Business—CDO Asset Management—Origination and Structuring of CDOs." Furthermore, since we also own at least some portion, or in our earlier CDOs, all or most, of the first loss or equity tranche in our CDOs, if we experience losses in excess of our modeled expectations we could experience returns below our expectations or lose a portion or all of our equity interests in those CDOs. Our aggregate first loss, or equity, position in our CDOs was $203.4 million as of June 30, 2006.
If S&P lowers the financial strength rating that it has assigned to ACA Financial Guaranty, our ability to generate new business in our Structured Credit and Municipal Finance business lines, as well as our results of operations and liquidity would be materially adversely affected.
ACA Financial Guaranty, our insurance subsidiary, has an "A" financial strength rating from S&P with a "stable" outlook. This rating is crucial to our Structured Credit and Municipal Finance businesses as well as our ongoing business strategy. This rating is subject to periodic review by S&P, and S&P may revise or withdraw its rating at any time at its sole discretion. Such an action may be based on factors which are entirely outside of our control, such as changes in the views or the policies
10
of the rating agencies in relation to the financial guaranty industry, changes to the risk profile of ACA Financial Guaranty's insurance portfolio or to other factors considered by S&P in providing such rating, or adverse developments in the financial condition or results of operations of ACA Financial Guaranty.
In addition, S&P may change its standards for maintaining an "A" rating, including, for instance, by increasing capital requirements. The financial strength rating of financial guaranty companies is based in part on the maintenance of specified amounts of resources available to pay claims. As our business grows, we may need additional capital and we may not be able to raise such capital. We could also face ratings actions by S&P. S&P's stable ratings outlook on ACA Financial Guaranty assumes that our insurance subsidiaries will satisfy S&P's current minimum capital requirement of $300 million. As of June 30, 2006, ACA Financial Guaranty met this capital requirement with paid-in capital and retained earnings of $354.3 million. S&P may revise its capital requirements at any time, and losses in excess of our expectations could diminish our capital below required rating agency levels. For example, we had to raise additional capital in response to an increase in capital requirements by S&P in 2004. See "Management's Discussion and Analysis of Financial Condition and Results of Operations—Overview—Additional Information—2004 Recapitalization." Although we currently intend to operate our business in a manner that maintains our "A" rating, we are under no obligation to do so and we may not be able to do so.
If S&P were to downgrade our financial strength rating, put us on its CreditWatch negative list or change its outlook for us to negative, our reputation in the municipal finance industry would be materially adversely affected, which in turn could materially adversely impact our financial performance. CreditWatch highlights the potential direction of a rating, focusing on identifiable events and short-term trends that cause ratings to be placed under special surveillance by S&P. Ratings appear on CreditWatch negative when such an event or a deviation from an expected trend occurs and S&P needs additional information to evaluate the rating. Even though a listing on CreditWatch negative does not mean a rating change is inevitable, being placed on CreditWatch negative would have a material impact on our reputation and financial performance.
Our Structured Credit business would also be negatively affected by a downgrade of ACA Financial Guaranty's financial strength rating to below "A" or a withdrawal of our rating. Because ACA Financial Guaranty insures our credit swaps and our counterparties rely on ACA Financial Guaranty's financial strength rating, we might be unable to enter into any new credit swap transactions and we could be required to provide collateral in the form of cash or securities securing our obligations under any new credit swaps that we may enter. In addition, under the terms of our credit agreement, to the extent we had outstanding borrowings under this facility, these borrowings would become due immediately, and we would be unable to make future borrowings, if our financial strength rating falls below "A-." Such collateral posting requirements and acceleration of our existing line of credit could severely disrupt our business and materially negatively impact our liquidity and reputation. It could also severely strain our capital resources thereby putting us at a competitive disadvantage.
In our Structured Credit business we have contingent collateral posting requirements that in adverse circumstances may severely strain our liquidity and capital resources.
If ACA Financial Guaranty's financial strength rating is downgraded below "A-," we are required to post collateral with respect to most of our existing credit swaps in the amount of any negative mark to market fair value of the credit swap. Additionally, should credit events or, in some circumstances, credit migration occur with respect to the reference entities included in our various Structured Credit transaction portfolios resulting in losses above pre-agreed-upon levels or, in some circumstances, a downgrade of the "AAA" rated liabilities in the structure, we are generally required to post collateral in an amount that is the lesser of the amount by which actual losses exceed this pre-agreed point and the amount of any negative mark to market value of the credit swap. Posting collateral could materially and adversely impact our liquidity, the adequacy of our capital and our ability to enter into future credit swaps. We may not have sufficient liquidity to meet any posting requirements depending on the size of
11
the negative mark at the time we are required to post collateral. See "Management's Discussion and Analysis of Financial Condition and Results of Operations—Liquidity and Capital Resources."
General economic and market factors may materially adversely affect our loss experience, the demand for our products and our financial results.
Our business is impacted by general economic and market conditions. We could experience decreased demand for our products or incur losses due to extended economic recessions, business failures, interest rate changes or volatility, credit spread volatility, capital markets volatility, or changes in investor perceptions about the value of financial guaranty insurance, or combinations of such factors. Additionally, terrorist attacks of significant scale could cause volatility in the financial markets, particularly in the credit markets, and uncertainty in the economies of the areas in which they occur and in the global economy.
The market for the sale of credit protection under credit swaps and, consequently, related premiums are affected by a number of economic and market factors not within our control. The occurrence of credit events with respect to reference entities, for instance, such as bankruptcy or the failure to pay indebtedness, may be caused by cyclicality of the economy in general, industry cyclicality or credit events within the industry and capital market volatility generally, which may impact the supply and demand conditions in the credit swap market. Our financial results depend to a significant degree upon the premiums that we receive for the sale of our insurance products through our credit swaps. These premiums are established at origination of the transaction and are generally a function of both absolute credit spreads and the level of correlation among credit portfolios and the movement of related spreads, each of which change over time as a result of changes in the overall economy, supply and demand conditions in the credit swap market and other factors affecting the corporate credit market in general. If a low credit swap premiums environment persists, we may not be able to achieve profitable growth, which may have a material adverse effect on our financial condition and our results of operations. We can give no assurance that the credit swap market will continue to grow as it has in recent periods or at all or that it will not decline. Any such decline could have a material adverse effect on our financial condition.
Prevailing interest rates affect demand for financial guaranty insurance in the municipal finance market. Higher interest rates may result in declines in new bond issuances and refunding volumes which may reduce demand for our financial guaranty products. Lower interest rates generally are accompanied by narrower interest rate spreads between insured and uninsured obligations resulting in lower cost savings to issuers from the use of financial guaranty insurance than is the case during periods of higher interest rates. These lower cost savings could be accompanied by a corresponding decrease in demand for financial guaranty insurance.
Specifically, the performance of our CDOs and our ability to originate future CDOs may be materially adversely affected by any of these factors or by a combination of these factors. Changes in the level of credit spreads (i.e., the difference in interest rates between risky securities and risk remote securities, such as U.S. Treasury securities) can affect our ability to acquire financial assets for our CDOs that create sufficient spread in the transaction to pay the CDO liabilities and the fees and expenses of the CDO, including our asset management fees. If we are unable to acquire assets with sufficient spread, we may not be paid all or any portion of our asset management fees and the CDOs may pay returns below our expectations or not pay returns at all on our investment in the equity tranche. Further, we may not be able to continue to originate additional CDOs of the size of our current CDOs or at all. Increasing default rates may also negatively impact our equity returns and the overall performance of our CDOs. Poor performance in our CDOs could also hurt our reputation as an asset manager.
12
We face risks from the concentration of our liabilities and investments.
We face concentration risks in all of our businesses. While we seek diversification across our businesses, in each of our business lines and in our investment portfolio, we face risks to the extent that our aggregate exposure to losses is concentrated geographically, by industry, sector, obligor or type of credit or investment.
Our corporate synthetic CDOs, CLOs and Structured Credit transactions may include concentrations in particular industries or in geographical regions or in highly correlated industries and geographical regions. In the event that a particular industry or region experiences an economic downturn or natural disaster, the performance of our synthetic CDOs or CLOs may be materially negatively impacted. We may also experience significant numbers of credit events in relation to the reference entities included in the portfolios against which we sell protection in our Structured Credit transactions. Should such events occur, we could experience returns below our expectations on, or lose a portion or all of our equity investments in, our CDOs. Such an occurrence could harm our ability to continue to originate CDOs. Each of these events could materially and adversely impact our liquidity position as well as the adequacy of our capital.
In our Municipal Finance business we face default risk from the concentration of our exposure in certain states and in certain industries. As of June 30, 2006, $1,133.4 million, or 18.1%, of our outstanding financial guaranty exposure was concentrated in California-located issuers, and $2,689.7 million, or 42.9%, of our financial guaranty exposure was concentrated in nine additional states. This concentration increases our vulnerability to economic downturns, natural disasters, or terrorist attacks in those states. In addition, as of June 30, 2006, $1,459.1 million, or 23.3% of our financial guaranty exposure, was related to higher education and $1,636.3 million, or 26.1%, of our financial guaranty exposure was in the healthcare and long-term care facilities sector. Both the healthcare and long-term care sectors are facing rising costs and revenue constraints. As a result, healthcare and long-term care are perceived to be higher risks than other segments of the municipal finance market. These factors could undermine the assumptions we made in our credit analysis of the issuers in those sectors and cause actual losses to exceed estimated losses.
A large portion of the financial assets included in our CDOs are residential MBS, or RMBS, which present concentration risk to the national housing market. As of June 30, 2006, there was $7.4 billion of RMBS in our CDO assets under management. Should the country experience an economic decline, mortgage borrowers comprising the security underlying such RMBS may default on their loans which may in turn result in a default on the RMBS and losses to any of our CDOs which purchased such RMBS exposure. Also, some of the mortgages underlying our CDO exposures include interest only payments which are due to reset in the coming years. The reset of these mortgages to include interest plus principal payments may also cause an increase in obligor defaults of these mortgages. In addition, a significant portion of the assets securing the RMBS that we buy are secured by mortgages on properties in California and to a lesser extent in New York and Florida. Should one of those states specifically experience an economic downturn or natural disaster resulting in significant defaults on mortgages issued in that state, certain RMBS purchased into our CDOs may also experience defaults or lower market values. The occurrence of defaults in RMBS, could materially negatively impact the performance of our CDOs generally, making it difficult for us to continue to sponsor CDOs, and cause us to experience returns below our expectations on, or lose a portion or all of, our equity investment in our CDOs. The flattening in appreciation of home values, or depreciation of home prices, either nationally or regionally, particularly in areas where we have concentrated exposure, may increase the severity of the economic impact of this risk. Though to a lesser degree, we also have some exposure to RMBS underlying our credit swaps in our Structured Credit line of business. Should the country experience significant defaults on mortgages, we could also experience an increased number of credit events in our synthetic ABS structured credit transactions.
13
We may need to refinance our existing debt and otherwise require additional capital in the future, which may not be available or may only be available on unfavorable terms.
To the extent that our existing capital or the funds generated from this offering and our operations are insufficient to meet our future requirements, we may need to raise additional funds through financings. If additional funds are unavailable, we may need to curtail our growth, change our business strategy or sell assets. In addition, we will have to refinance our medium term note program, which matures in 2010 and which date is in advance of the maturity date of many of the assets acquired with the proceeds of such issuance. See "Management's Discussion and Analysis of Financial Condition and Results of Operations—Liquidity and Capital Resources—Indebtedness." Any equity or debt financing, if available at all, may be on terms that are not favorable to us. Equity or debt we may issue in the future may have rights, preferences and privileges that are senior to those of the current common stock. In the case of equity financings, our stockholders could experience material dilution.
We may also need to obtain reinsurance in order to comply with state insurance regulatory and rating agency capital requirements and single risk limits as our business grows. Reinsurance allows us to grow our business by reducing our exposure to risks we have reinsured. As of October 3, 2006, we had purchased an aggregate of $42.3 million of facultative reinsurance in respect of 28 of our municipal bond insurance policies in order to reduce our single risk exposure to those credits, and $50 million of catastrophic coverage through an excess of loss reinsurance policy. If we need to seek additional reinsurance, reinsurance may not be available at acceptable terms or at all. This could have an adverse impact on our ability to grow our insurance business and could adversely affect our "A" rating and future results of operations.
We assume construction and completion risk in our Municipal Finance transactions.
In underwriting Municipal Finance transactions, we are willing to assume exposure to the credit during construction or otherwise prior to completion of the related project. While we have strict underwriting standards in assuming this risk and structure and seek to monitor these transactions with the view towards minimizing our potential exposure, the risk of loss on a Municipal Finance transaction is typically most significant during the construction and completion phases. Construction costs may exceed expectations and available funding, and timing delays, which may be caused by construction delays, natural disasters or economic downturn that diminish demand for a project, will delay the production of revenue necessary to pay debt service on the insured bonds. Delays in revenue production may also be caused post construction by delays in the commencement of operations. These delays can be caused by a variety of factors including industry-specific concerns such as obtaining all required regulatory approvals and such delays in the production of revenue may result in our payment of claims until the project may be completed and revenue generated. In the event a project is not completed, a default of the guaranteed bonds may occur resulting in the payment of claims by us. Depending on the status of the construction, our recoveries may be materially less than our claims paid as we rely on our security interest in the land and project itself for recoveries. Such an occurrence could negatively impact our results of operations. Also, should we experience a high level of defaults on these credits, the losses incurred could materially adversely impact our capital adequacy as well as our financial strength rating.
Our failure to accurately set our loss reserves may result in having to increase our loss reserves or make payments in excess of our loss reserves, which could materially and adversely impact our financial condition.
We establish loss reserves on our non-derivative financial guaranty insurance exposures. Setting our loss reserves involves significant reliance upon estimates with regard to the probability, magnitude and timing of losses. Our reserves may prove to be inaccurate, especially during an extended economic downturn. As of June 30, 2006, we have non-specific loss reserves of $19.0 million established in connection with our Municipal Finance line of business and case specific loss reserves of $18.2 million net of anticipated salvage of $7.2 million. If our loss reserves are determined to be inadequate, we will
14
be required to increase our loss reserves which would result in a corresponding reduction in our net income and stockholders' equity in the period in which the deficiency is recognized. Sizable losses could have a material impact on our capital adequacy and, ultimately, S&P financial strength rating. In addition, the Financial Accounting Standards Board, or FASB, is considering whether additional accounting guidance is necessary regarding methods of determining non-specific reserves. We may be required to increase our loss reserves or restate our current reserve allocations as a result of FASB's review. See "Management's Discussion and Analysis of Financial Condition and Results of Operations—Critical Accounting Policies and Estimates." As insured credit swaps constitute derivative instruments and are marked to market in accordance with Financial Accounting Standard ("FAS") No. 133, no loss reserves are recorded in connection with these transactions.
Changes in accounting rules relating to the financial guaranty industry could have a material adverse effect on us and our industry.
In June 2005, the Securities and Exchange Commission, or the SEC, asked the FASB to consider the accounting by financial guaranty insurers for claims liability recognition, premium recognition and deferred policy acquisition costs in addition to a then existing request to review loss reserving accounting policies for the financial guaranty industry. The proposed guidance from this review is expected to be issued later in 2006 and the final guidance is expected to be issued in 2007. When the FASB reaches a conclusion, it is possible that we and the financial guaranty insurance industry may be required to change some aspects of our and the industry's relevant accounting policies. Changes in our accounting policies relating to the timing of premium and expense recognition could have a material effect on us and on our industry. See "Management's Discussion and Analysis of Financial Condition and Results of Operations—Critical Accounting Policies and Estimates—FASB Financial Guaranty Insurance Review."
Certain of our CDOs must be consolidated in accordance with applicable accounting rules which introduces volatility into our balance sheet and statement of operations and may make it difficult to communicate economic trends and factors underlying our business and which may result in negative investor perception of us.
Pursuant to FASB Interpretation No. 46(R), we are required to consolidate into our balance sheet, assets and liabilities related to certain of our CDOs when we are deemed to be the primary beneficiary of the CDO vehicle. In general, this occurs when we own more than 35% of the equity of the vehicle. CDO assets are reflected on our balance sheet as fixed-maturity securities available for sale, at fair value. Although these CDOs are consolidated, we do not have the right to use the assets of the CDOs for general operations or in satisfaction of our corporate debt obligations. Similarly, the liabilities issued by the CDO are reflected on our balance sheet as debt. The consolidation of seven of our CDOs makes it more difficult for us to communicate economic trends and factors underlying our business. Additionally, losses in the asset portfolios that are consolidated could exceed our true economic risk. Our true economic risk is the amount of our equity investment. Losses could occur in connection with defaults in the underlying assets in response to a variety of economic pressures on the underlying obligor or structure. To the extent losses in the CDO asset portfolios exceed our associated equity investment, the financial statement impact is offset at CDO maturity, when the associated liabilities are written off; however, the potential mismatch could cause negative investor perception of us and negatively impact our stock price. See "Management's Discussion and Analysis of Financial Condition and Results of Operations—Critical Accounting Policies and Estimates."
15
Our net income may be volatile because a portion of the credit risk we assume is in the form of credit swaps and a number of our consolidated CDOs utilize interest rate swaps, both of which are derivatives and are accounted for under FAS 133/149, requiring that these instruments be marked to market.
As credit spreads increase or decrease, the spreads on the underlying assets included in our portfolios referenced by our insured credit swaps in our Structured Credit and synthetic CDO transactions will also increase or decrease, which will result in changes to the fair value of the credit swaps. Furthermore, changes in demand for such products, changes in the applicable legal and regulatory environments and over-all growth in this sector can also affect the fair value of our credit swaps. Our insured credit swaps meet the definition of derivatives under Statement of Financial Accounting Standards Nos. 133/149. Derivatives must be accounted for either as assets or liabilities on the balance sheet and measured at fair mark to market value. Although there is no cash flow effect from this "marking to market" as we enter into these insured credit swaps with an intent that they remain outstanding to maturity, changes in the fair value of the derivative are reported in our consolidated statement of operations, together with the fixed premiums payable to us under the contract, in net insured credit swap revenue and other net credit swap revenue and therefore will affect our reported earnings. We use various systems, models and stress test scenarios to monitor and manage market risk. These models include estimates made by management that use current and historic market information. The valuation results from these models could differ materially from amounts that actually are realized in the market. See "Management's Discussion and Analysis of Financial Condition and Results of Operations—Quantitative and Qualitative Disclosures about Market Risk." Volatility in our reported earnings, even if there is no ultimate cash impact, can materially negatively impact our stock price, our ability to secure future financings and our reputation, which is critical to obtaining new business.
Common events that may cause credit spreads to fluctuate on the underlying assets included in the portfolios referenced by our credit swaps include changes in the state of national or regional economic conditions, industry cyclicality, changes in the business or financial assets of a specific issuer of the underlying assets included in a referenced portfolio, such as the issuer's competitive position within an industry, management changes, changes in the ratings of the underlying security, movements in interest rates, default or failure to pay interest, or any other factor leading investors to revise expectations about such issuer's ability to pay principal and interest on its debt obligations. These events are outside of our control. Similarly, common events that may cause credit spreads on an underlying structured security referenced in a credit swap to fluctuate may include the occurrence and severity of collateral defaults, changes in demographic trends impact on the levels of credit enhancement, rating changes, changes in interest rates or prepayment speeds, or any other factor leading investors to revise expectations about the risk of the collateral or the ability of the servicer to collect payments on the underlying assets sufficient to pay principal and interest. For a discussion of the historical fluctuations on the changes in fair value of our insured credit swaps, see "Management's Discussion and Analysis of Financial Condition and Results of Operations—Results of Operations."
In addition, our net income may be volatile due to the inclusion of interest rate swaps in certain of our transactions, which must be marked to market under FAS 133/149. We use interest rate swaps to hedge the exposure to variable interest rates within our CDOs. These interest rate swaps also provide a cost effective form of financing which we use to finance the placement fees and other initial costs of those CDOs. Interest rate swaps are derivatives under FAS 133/149 and are required to be marked to market; however, that portion of the mark to market associated with our financing of placement fees and other initial costs are required to flow through the consolidated statement of operations, and are recorded in net realized and unrealized gains (losses) on derivative instruments rather than being recorded directly in stockholders' equity on our balance sheet where standard interest rate hedges would be recorded. This increases the volatility in our reported earnings which may be confusing to stockholders or, in the case of negative marks, materially adversely impact investors' perception of us
16
which could negatively impact our stock price. See "Management's Discussion and Analysis of Financial Condition and Results of Operations—Overview—Additional Information."
For the six months ended June 30, 2006 and 2005 and the years ended December 31, 2005, 2004 and 2003, net unrealized gains (losses) related to credit swaps were $0.9 million, $(6.9) million, $(6.9) million, $8.4 million and $1.9 million, respectively.
In our Structured Credit business we are dependent on counterparties' perception of our creditworthiness.
Before our counterparties in our Structured Credit business enter into insured credit swaps with us, they analyze our financial condition, particularly the financial condition of ACA Financial Guaranty, our insurance subsidiary, which provides financial guaranty insurance on our credit swaps, and its "A" financial strength rating, and establish credit limits up to which they are willing to assume exposure to us. They monitor the appropriateness of these limits on an ongoing basis to limit the risk that we will be financially unable to make any payments we owe them. Once a counterparty reaches its credit exposure limit to us, the counterparty may not enter into any additional transactions with us until such counterparty's credit limit with us is increased. In the event these counterparty credit limits are not increased as our credit swap portfolio expands or if limits are reduced, our financial performance would suffer. The growth of our Structured Credit business, in particular, will be materially impacted if we cannot increase the lines of credit with our existing counterparties or the number of counterparties willing to transact with us. We can give no assurance that additional financial institutions will become our counterparties.
We operate in competitive environments.
The credit swap market is large, quickly evolving and highly competitive. Most of our competitors are more established, have long-term relationships with market participants and have substantially greater financial resources than we have. Additionally, no significant regulatory impediments necessarily exist for new participants entering the credit swap market under different business models, such as non-insurance business models. To the extent that new participants enter the credit swap market, competition may intensify. We cannot assure you that increased competition will not materially and adversely affect the volume, pricing and the profitability of this business.
The competitive environment for our Municipal Finance business comes from other forms of credit enhancement and the high yield municipal funds that are purchasing an increasing amount of non-investment grade and unrated municipal debt. Continued growth by such competitors may reduce the demand for our financial guaranty insurance product. Currently no other "A" rated entities provide financial guaranty insurance. That could change, which could significantly impact our competitive standing. If other financial guarantors or other third-party credit enhancement providers are able to duplicate our business strategy and compete directly with us by providing comparable forms of credit enhancement to our target markets, our business operations could be materially adversely affected.
The market for CDO Asset Management services is highly competitive with low barriers to entry. Many of our competitors have greater financial strength and are more established and well known in the CDO market than we are. We compete for assets with these competitors. Furthermore, competition for assets of the types and classes in which our CDOs invest may lead to increasing asset prices which may further limit our ability to generate our desired returns. Also, as spreads tighten, the competition to acquire financial assets with sufficient spreads to generate the returns required by our CDO investors will increase, limiting our ability to originate profitable CDOs and to reinvest our current CDOs so as to sustain our historical performance. In addition, some of our competitors may have higher risk tolerances or different risk assessments, which could allow them to consider a wider variety of transactions and establish more relationships than we can. If we are unable to acquire enough assets with sufficient spreads, our performance may suffer compared to our competitors. Should this occur, even for a short period, our financial results may be significantly and quickly negatively impacted.
17
Further, increasing competition in the origination of CDOs generally could negatively impact our ability to attract investors in our CDOs and therefore our ability to continue to generate CDOs and increase our assets under management. In addition, new entrants into the CDO asset management realm may cause a decrease in the rate of fees paid to asset managers and therefore also negatively impact our profitability.
We may experience fluctuations in quarterly and annual results due to the limited number of transactions we enter into in a given period.
During any given year we enter into a limited number of transactions in each of our lines of business and we do not set performance targets based on closing a specified number of transactions or writing a specific notional or par amount in any particular quarter or year. Our targets are based on other metrics, such as aggregate fixed premiums, earned or written premiums or assets under management, as appropriate to our different business lines. This permits us to select only those opportunities, if any, that meet our risk-adjusted expectations, thereby maximizing our profitability. The transactions in which we participate are often highly negotiated and often take significant time to analyze, underwrite and close. Our Structured Credit and Municipal Finance businesses may elect not to transact if attractive opportunities are unavailable. In addition, while we intend to grow our CDO assets under management, we may not be able to sponsor a significantly increasing number of CDOs from year to year due to investor demand, marketing considerations, asset availability and pricing considerations. Accordingly, we can provide no assurance that we will enter into a minimum level of transactions in any given period. As a result, our financial performance and growth will vary significantly depending on market conditions and the timing and closing of opportunities available to our business lines. As a result, our financial performance will likely vary significantly from quarter to quarter and the operating results for any quarter should not be deemed indicative of results for any future period. See "Management's Discussion and Analysis of Financial Condition and Results of Operations—Overview—Executive Summary."
We have a limited operating history and we intend to enter into new product lines and markets.
We and our subsidiaries are relatively new entities with narrow business focuses and limited operating histories. As a result, there is limited historical financial and operating information available to help you evaluate our past performance or to make a decision about an investment in our common stock. For example, we entered into the structured credit market through our insured credit swaps in 2002 and we completed our first CDO in 2002 and have completed a total of 17 through June 30, 2006. Our first CDO will terminate in January 2007, which will be the earliest time that we will be able to finally determine its total performance. In addition, we have not operated our business in a long-term significantly recessionary environment or a long-term inflationary environment. As a result, there is limited historical information available to help you evaluate what our track record may be during such economic cycles. Additionally, as part of our business strategy, we intend to enter into new product lines and markets for which we will have no operating track record. These new products and markets will likely subject us to significant credit risks for which we may have limited experience and may entail risks in addition to those we describe herein. We may also experience delays or regulatory impediments in implementing our business strategy. Each new business line may also require significant additional capital which may not be available or which may limit the capital available for our other business lines.
Future growth into international markets is subject to additional risks that are beyond our control.
Our business strategy contemplates expanding portions of our business into foreign markets. For example, we have formed a subsidiary in Singapore through which we are entering the Asian structured credit markets, and are in the process of licensing an investment manager in the United Kingdom through which we plan to participate in the European CDO asset management markets. While we have obtained the required approvals in Singapore, we are in the process of obtaining the necessary approvals in the United Kingdom. Further, as these operations develop, we may require additional approvals from other Asian or European Union regulators. We may not be able to achieve the desired
18
approvals to implement such strategies and, if we are able, we may not then be successful in developing the necessary business relationships to grow our activities in these jurisdictions. If we are able to implement these strategies, we will be subject to the significant additional risks associated with doing business abroad, including: currency exchange fluctuations; the imposition of new laws and regulations; financial reporting according to the standards of non-U.S. jurisdictions; restrictions on the transfer of funds; changes in local economic conditions; and the ability to integrate our international business and employees separated by large distances and different time zones effectively and efficiently into our overall operations and control systems. Our inability to effectively manage these and other factors that may be beyond our control could have a material adverse effect on our business, financial condition and operations.
Our continued growth into additional product areas and markets could strain our resources.
Since 2001, we have significantly increased the scope of our financial guaranty operations, including expanding into insuring credit swaps, and have entered into markets in which we previously did not conduct business, including the origination, structuring and management of our CDOs. We continue to focus on growing our business lines and building new products, which could place a strain on our management, other personnel, resources and financial reporting systems in future periods. To implement our business strategy, we will need to evaluate continually and, where necessary, upgrade our operating and financial systems, procedures and controls, as well as personnel resources. In addition, as part of our business strategy, we plan on entering into new product areas and markets and we may not effectively anticipate the required resources, relevant risks and management challenges to sustaining these operations. We may not be able to effectively manage new operations or successfully integrate them into our existing operations. We intend to continue to monitor and, where necessary, take steps to improve our controls and systems or increase personnel, but if we are unsuccessful in doing so, our business and results of operations could be materially and adversely affected.
We are a holding company and our cash flow is dependent on payments by our subsidiaries, which are subject to significant limitations.
We are a holding company and, as such, we do not conduct any operations of our own. While we may retain a portion of the proceeds of this offering at the holding company level, we do not expect to have significant operations or assets in the near term, other than our ownership of the shares of our subsidiaries. As a holding company, our cash flow will consist primarily of dividends and other permissible payments from our subsidiaries, plus income on any proceeds of this offering and other potential financings that we retain at the holding company level. We depend on such payments to meet our obligations, including the payment of any dividends to our stockholders and the payment of interest and principal on our debt. Such payments are subject to ACA Financial Guaranty's ability to pay dividends, since we operate all our lines of business through ACA Financial Guaranty. Our cash flow is further constrained because funds available to us from five of our CDOs are pledged as collateral or are used to make required payments in connection with our equity financing on these CDOs. See "Management's Discussion and Analysis of Financial Condition and Results of Operations—Liquidity and Capital Resources."
ACA Financial Guaranty's ability to pay dividends to us is significantly limited due to our need for it to retain sufficient capital to satisfy S&P requirements to maintain its "A" rating as well as provisions of applicable insurance regulatory law. For example, ACA Financial Guaranty may pay extraordinary dividends only out of earned surplus, or positive unassigned surplus, and only with the prior approval of the Maryland Insurance Commissioner. At June 30, 2006, ACA Financial Guaranty had a negative earned surplus of approximately $109.9 million. As a result, ACA Financial Guaranty is currently unable to pay extraordinary dividends. Furthermore, due to the nature of the calculation that assigns surplus to contingency reserves as applied to our business, increases in U.S. GAAP income may not result in positive earned surplus. ACA Financial Guaranty must give ten days' prior notice to the Maryland Insurance Commissioner of its intention to pay any dividend or to make any distribution
19
other than an extraordinary dividend or to make an extraordinary distribution. The Maryland Insurance Commissioner may prevent such a dividend or distribution in certain instances. For more information regarding these restrictions, see "Business—Regulation." ACA Financial Guaranty's Maryland insurance regulators have consented in the past to the payment of dividends sufficient to make interest payments on the debt service of $40 million of indebtedness we have issued. In addition, the Maryland Insurance Commissioner has in the past approved interest payments on a $10 million surplus note which ACA Financial Guaranty issued to us in December 2004. These consents are made by our regulators on an annual basis. We cannot be certain that our insurance regulators will continue to consent to such payments or other similar payments in future. The inability of ACA Financial Guaranty to pay sufficient dividends and to make other permitted payments to us could have a material adverse effect on our ability to satisfy our ongoing operating expenses, debt service and other cash requirements, as well as our ability to pay dividends on our common stock in the future.
Our level of indebtedness could adversely affect our operations and growth and could limit our ability to react to changes in the economy or the markets in which we compete.
As of June 30, 2006, we had approximately $4,956 million of short-term debt, long-term debt and related party debt outstanding, of which approximately $4,833.2 million related to the liabilities of our consolidated CDOs and $193.8 million related to corporate debt outstanding. In addition, we have entered into a $75 million unfunded line of credit. We may also incur additional indebtedness in the future to fund acquisitions, working capital, growth in our business or for other general corporate purposes. Our level of corporate debt increases our vulnerability to competitive pressures, downgrades in our financial strength rating and to general adverse economic, market or industry conditions and reduces the availability of cash flow for working capital and other general corporate purposes. This could limit our ability to compete and our flexibility in planning for, or reacting to, changing business, industry or economic conditions.
We may incur liabilities because of the unconditional nature of our financial guaranty insurance policies.
Issuers whose obligations we insure may default on those obligations because of fraudulent or other intentional misconduct. Financial guaranty insurance is unconditional and does not provide for any exclusion of liability based on fraud or other misconduct. Despite any risk analysis we conduct, it is impossible to predict fraud or other intentional misconduct, or whether or to what extent we will have any remedy against any party in connection with such conduct. Payment of any such claims could have a material adverse effect on our financial condition and results of operations.
If our investments perform poorly, our financial results and ability to conduct business could be harmed.
Our operating results are affected in part by the performance of our non-CDO investment portfolio. For the year ended December 31, 2005 and the six months ended June 30, 2006, approximately $20.7 million and $11.9 million of our revenue, or 6.3% and 5.5%, both respectively, was derived primarily from ACA Financial Guaranty's investment portfolio and cash and cash equivalents.
ACA Financial Guaranty's investment portfolio is subject to:
- •
- market value risk, which may be due to a change in the yields realized on ACA Financial Guaranty's investment portfolio and prevailing market yields for similar assets, an unfavorable change in the liquidity of the investments or an unfavorable change in the financial prospects or a downgrade in the credit rating of the issuers of the securities in ACA Financial Guaranty's investment portfolio;
- •
- default risk, which is the risk that some of the investments will not pay principal or interest owed to us when due; and
20
- •
- reinvestment risk, which is the risk that interest rates and credit spreads will decline and funds reinvested will earn less than expected.
Interest rates and credit spreads are highly sensitive to many factors, including governmental monetary policies, domestic and international economic and political conditions and other factors beyond our control. We may not be able to mitigate these risks effectively.
Hedging transactions may limit our income or result in losses.
While we have not engaged in significant hedging activity to date, we may in the future engage in certain hedging transactions to limit our exposure to changes in credit spreads, interest rates, currency exchange rates and other financial market changes. We may also engage in hedging transactions to manage single risk exposure across our business lines and our investment portfolio. Hedging does not eliminate the possibility of fluctuations or prevent losses, and if structured incorrectly could result in additional losses. Hedging transactions may limit the opportunity for income or gain if rates change favorably. Moreover, it may not be possible to hedge against expected rate fluctuations at an acceptable price. Additionally, ACA Financial Guaranty would have to obtain regulatory approval before entering into such transactions in relation to its investment portfolio and we may not be able to obtain such approval.
We have legacy exposure on manufactured housing bonds we insured.
In 1999, we insured 12 securitized manufactured housing bonds with a collective notional balance of $213.3 million. These bonds had initial ratings of "AA" and/or "Aa" from at least two of S&P, Moody's Investors Service or Fitch Ratings Inc. As of October 3, 2006, five of those bonds, with an aggregate notional balance of $74.5 million, are underperforming and have either been partially written down or are at risk of being written down. As of June 30, 2006, we had a reserve of $23.5 million to cover potential claims on three of these bonds. We are currently paying claims on one bond and expect to begin paying claims on a second bond in mid to late 2007 and on the third in mid to late 2008. The other two of these five bonds have experienced stress; however, pursuant to our modeling we believe a reserve is not currently mandated. Our reserves represent the present value of expected losses, discounted at the applicable treasury rate. These reserves may not prove to be accurate and we may have to pay significantly more money for claims than we have reserved, which could have a material adverse impact on our results of operations and financial condition.
We are also currently paying periodic claims in respect of interest on an additional two of the 12 insured bonds; however, as we expect to receive full recovery of such claims from payments on the underlying loans, we have not taken loss reserves in connection with these exposures. As of June 30, 2006, total claims paid, net of recoveries, on these two bonds were $7.2 million. If, however, loss rates on the underlying portfolio of loans are materially higher than we expect, we may not receive some portion or any of the recoveries as we currently anticipate, which could materially adversely impact our operating performance. The current ratings on several other of the 12 manufactured housing bonds have been materially downgraded and we cannot be certain that these bonds will not continue to deteriorate. We may be required to post additional reserves and we may have to pay claims with respect to such bonds. We may not be able to recover the amount of such payments. See "Management's Discussion and Analysis of Financial Condition and Results of Operations—Overview—Additional Information—Other."
We are highly dependent on information systems and third parties, and systems failures could significantly disrupt our business.
Our business is highly dependent on communications and information systems. Any failure or interruption of our systems could cause delays or other problems in our trading activities and our ongoing credit analysis and risk management assessments. This could have a material adverse effect on our operating results.
21
We are dependent on key executives.
Our future success depends to a significant extent on the efforts of our executive management. We do not have key man insurance policies. We currently have employment agreements with most of these individuals, but employment agreements do not assure retention. We believe that there are a limited number of available, qualified executives with relevant experience in both the insurance and capital markets industries, and our inability to hire additional senior executives or the loss of the services of any of these individuals could adversely affect our business. Failure to retain or attract key personnel could have a material adverse effect on us.
In our Municipal Finance business we insure low investment grade and non-investment grade credit risks which may require significant loss mitigation efforts.
Given the nature of our Municipal Finance credit portfolio, which is constituted of low investment grade and non-investment grade credits, at any given time we are engaged in work-out strategies with a number of our credits to minimize or eliminate the potential for future losses. Such activities may result in increased loss adjustment expense, or LAE, reserves which could materially and adversely impact our results of operations in the periods such reserves are recorded. In addition, our work-outs may not be successful, which could result in our paying claims which could be significant. See "Management's Discussion and Analysis of Financial Condition and Results of Operations—Critical Accounting Policies and Estimates—Loss and Loss Adjustment Expenses."
Our CDO Asset Management business may not perform as we expect and we are subject to termination under the provisions of our investment advisory agreements.
Generally, our services as asset manager may be terminated without cause by a vote of a majority of each class of debt securities and the equity tranche of a CDO. We may also be removed "for cause" upon the occurrence of certain events on the affirmative vote of a majority of the senior debt or a majority vote of the equity. In certain of our investment advisory agreements, substantial employee departures amongst CDO Asset Management and certain other key personnel within, most typically, a 12 month period constitutes a basis for our removal as asset manager. If we are removed as asset manager from one or more of our CDOs, it could have a significant negative impact on our reputation in the market and could have a material adverse effect on our results of operations, our ability to do new CDOs and our ability to be retained as an asset manager for our other CDOs.
We may be precluded from participating in certain opportunities that we otherwise would participate in due to our role as a CDO asset manager and potential conflicts of interest.
In addition to providing management services to CDOs originated and structured by us, we also provide management services to our credit opportunity fund, portfolios structured by third parties and take credit risk directly. Conflicts may exist for us in addressing these various roles and interests. We have developed an allocation policy and intend to act in a manner that is fair and equitable in allocating business opportunities and to follow our conflict resolution process should conflicts occur; however, because of these potential conflicts, we may not be able to participate in certain opportunities on a proprietary basis which opportunities otherwise meet our business objectives. Our inability to pursue certain opportunities due to conflicts of interest could have an adverse impact on our future results of operations.
Risks Related to the Regulation of our Businesses
The regulatory systems under which we operate, and potential changes in regulation, could significantly and adversely affect our business.
We operate in a highly regulated industry, and these regulations can restrict our ability to take actions or conduct our business for the ultimate benefit of our stockholders. Our operations may become subject to increased regulation, and applicable federal and state law or existing regulations may change, which may result in administrative burdens, increased costs or other adverse consequences to
22
us. For example, proposals have been made in Congress to enact legislation that would increase regulation of the credit swap market. We cannot predict what restrictions any such legislation, if adopted, would impose and the effect those restrictions would have on our businesses. In addition, we may not accurately predict the effects of regulation that will be imposed on our business if we enter into international markets. Furthermore, regulatory changes can also impact our counterparties or other persons we do business with and may make our products less attractive to third parties.
We are subject to the insurance holding company laws of Maryland, where ACA Financial Guaranty is organized and domiciled. This law generally requires each domestic insurance company directly or indirectly owned by a holding company to register with the Maryland Insurance Commissioner and to furnish financial and other information annually and periodically upon the occurrence of material events. Generally, all inter-company transactions between us or any affiliate and ACA Financial Guaranty in the holding company system must be fair and, if material, require prior notice to and approval by the Maryland Insurance Commissioner.
ACA Financial Guaranty is licensed, authorized or accredited to write insurance in all 50 states of the United States, the District of Columbia, Puerto Rico, the U.S. Virgin Islands and Guam. State insurance laws regulate many aspects of ACA Financial Guaranty's insurance business and state insurance departments supervise its insurance operations. The purpose of the state insurance regulatory statutes is to protect insureds, not stockholders. Among other things, Maryland regulation requires ACA Financial Guaranty to maintain minimum levels of capital, surplus and liquidity, and imposes restrictions on the payment of dividends and distributions. These statutes and regulations may, in effect, restrict the ability of ACA Financial Guaranty to write new business or, as indicated below, distribute funds to ACA Capital. Also, because we are authorized to act as a foreign insurer in New York, we are also required to comply substantially with any requirement or limitation specified in the Insurance Laws of the State of New York that is applicable to similar domestic insurers in New York. In recent years, the state insurance regulatory framework has come under increased federal scrutiny, and some state legislatures have considered or enacted laws that may alter or increase state authority to regulate insurance companies and insurance holding companies. Although not located or domiciled in the other jurisdictions in which we write business, in order to maintain our licenses in those jurisdictions we are also subject to regulation in those states and territories as well. If we fail to comply with the various state insurance regulations applicable to us, we could experience material fines and potentially have our license withdrawn in the relevant jurisdiction, which could materially interfere with our ability to write insurance policies in the future.
Certain states have financial guaranty insurance statutes that require an insurer to maintain a ratio of investment grade to non-investment grade and unrated financial guaranty policies. In New York, for example, an insurer may insure municipal obligation bonds, special revenue bonds and industrial development bonds that are not investment grade, so long as at least 95% of the insurer's aggregate net liability on those kinds of obligations is investment grade. California has a similar statute. While we believe we are not contravening these statutes, the applicable state regulators may not agree with our interpretation of the application of the statutes. If the regulators of these states do not agree with our interpretation of these statutes, they may prohibit us from writing financial guaranty insurance in that state in the future which could materially and adversely impact our results of operations.
See "Business—Regulation."
If we were required to register as an investment company under the Investment Company Act of 1940, it could limit our growth and increase our costs; maintaining our exempt status may limit our options in the future.
We believe that we are not required to be registered as an "investment company" under the Investment Company Act because we do not meet the definition of an "investment company" under the Investment Company Act. Specifically, we believe that we are not an investment company because, as of June 30, 2006, approximately 90% of our total assets on an unconsolidated basis, exclusive of
23
government securities and cash items, represent our 100% ownership interest in ACA Financial Guaranty, a regulated insurance company. We believe that ACA Financial Guaranty satisfies the requirements to be an "insurance company" as defined in the Investment Company Act and thus does not fall within the definition of an investment company. ACA Financial Guaranty is primarily and predominantly engaged in writing insurance and insurance-related products and is licensed to provide financial guaranty insurance in all 50 states, the District of Columbia, Guam, Puerto Rico and the U.S. Virgin Islands. Our financial guaranty insurance lines of business collectively produce the majority of ACA Financial Guaranty's net income on an unconsolidated basis. ACA Financial Guaranty provides financial guaranty insurance policies for our Municipal Finance business, for the credit swaps in our Structured Credit business and for certain other transactions described in "Other." See "Business—Corporate Structure" and "Business—Regulation."
If we cannot rely on the exemptions or other exclusions from registration as an investment company or our business or financial condition changes in a way that could make us an investment company, we could, among other things, be required either (a) to change the manner in which we conduct some of our operations (including by forgoing otherwise attractive business opportunities) to avoid being required to register as an investment company, (b) to restructure our corporate structure or (c) to register as an investment company. There may be negative financial implications associated with changing our corporate structure or changing the manner in which we conduct our operations to maintain our exempt status under the Investment Company Act. If we were required to register as an investment company, we would have to comply with a variety of restrictions, including limitations on our capital structure, restrictions on our investments, prohibitions on transactions with affiliates and compliance requirements that could limit our growth and increase our costs. There is no assurance that we could function effectively if we were required to register as an investment company.
Our subsidiary, ACA Management, L.L.C., is a registered investment adviser under the Investment Advisers Act of 1940 and if ACA Management fails to comply with applicable related regulation we may not be able to continue to grow our CDO Asset Management business in accordance with our business plan.
Our subsidiary, ACA Management, L.L.C., is a registered investment adviser under the Investment Advisers Act of 1940, and our asset management activities are regulated by the SEC. While we believe that ACA Management is in material compliance with applicable regulation, it is subject to regular examinations and "theme audits" which may be conducted by the SEC at any time. ACA Management's most recent theme audit was completed in July 2005 and no material errors or omissions were reported to us; however, ACA Management's failure to remain in strict compliance with these regulatory requirements could result in disciplinary action which could include material fines or the suspension or revocation of its investment advisers registration. Any such enforcement action may negatively impact the results of our CDO Asset Management business. While not all of ACA Management's activities require registration, the failure to maintain a registration may materially interfere with its flexibility to accept advisory engagements and put it, and therefore us, at a competitive disadvantage.
Our ability to implement, for the fiscal year ended December 31, 2007, the requirements of Section 404 of the Sarbanes-Oxley Act of 2002 in a timely and satisfactory manner could cause the price of our common stock to fall.
We are presently evaluating our existing internal controls with respect to the standards adopted by the Public Company Accounting Oversight Board. We cannot be certain at this time that we will be able to successfully and satisfactorily complete the procedures, certification and attestation requirements of Section 404 of the Sarbanes-Oxley Act of 2002 by the time that we are required to file our Annual Report on Form 10-K for the year ended December 31, 2007, which is the first time that our management and our outside auditors will be required to deliver reports on our internal controls and procedures in accordance with the Sarbanes-Oxley Act of 2002. Uncertainty as to our ability to
24
comply with such requirements or any material weaknesses uncovered as a result of such procedures could have a material adverse effect on the trading price of our common stock. In addition, we may incur increased costs associated with such procedures or a diversion of internal resources necessary to prepare for or comply with such requirements.
Changes in tax laws could affect the demand for our services and products.
Any material change in the U.S. or foreign tax treatment of CDOs or investors in CDOs, credit swaps or municipal securities could adversely affect the demand for our services and products. Future potential changes in U.S. tax laws, such as the imposition of a "flat tax" or the imposition of a national sales tax in lieu of the current federal income tax structure, could adversely affect the market for municipal and public finance obligations and, consequently, reduce the demand for financial guaranty insurance of such obligations.
Risks Related to the Offering and our Common Stock
There is no public market for our common stock and you cannot be certain that an active trading market or a specific share price will be established.
Currently, there is no public trading market for our common stock and it is possible that an active trading market will not develop or continue upon completion of this offering. Our common stock has been approved for listing on the New York Stock Exchange under the symbol "ACA," subject to official notice of issuance. Such a listing does not, however, guarantee that an active and liquid trading market for our common stock will develop. It is also possible that the market price of our common stock will decline below the initial public offering price. The public offering price of our common stock offered by this prospectus will be determined by negotiations between us and the representatives of the underwriters. The price of our common stock after this offering may fluctuate widely. The reasons for these fluctuations may include the investment community's perception of our prospects and our industry in general. Differences between our actual operating results and those expected by investors and analysts and changes in analysts' recommendations or projections could also affect the price of our common stock.
If a substantial number of shares of our common stock become available for sale and are sold in a short period of time, the market price of our common stock could decline.
If our existing stockholders sell substantial number of shares of our common stock in the public market following the consummation of this offering, the market price of our common stock could decrease significantly. The perception in the public market that our existing stockholders might sell shares of our common stock could also depress our market price. Upon consummation of this offering we will have 239,000 restricted shares and 36,523,281 other shares of our common stock outstanding, which could be sold at a later date. Our directors, officers and stockholders holding 21,591,907 shares of common stock will be subject to agreements that restrict their ability to transfer their shares for a period of 180 days from the date of the offering, subject to a few exceptions and extension in certain circumstances. The non-locked up shares could be sold at any time. After all lock-up agreements expire, an aggregate of 21,591,907 additional shares will be eligible for sale in the public market, subject to volume limitations of our affiliates. However, the underwriters may waive the lock-up restrictions and allow these stockholders to sell their shares at any time. Upon the consummation of this offering, the holders of substantially all of the unregistered shares of our common stock and their transferees will have the right to require us to register their common stock under the Securities Act of 1933, or the Securities Act, for sale into the public markets, subject to the 180-day lock-up agreements. Upon the effectiveness of any such registration statement, all shares covered by the registration statement will be freely transferable.
In addition, within 90 days following the consummation of this offering we intend to file one or more registration statements on Form S-8 under the Securities Act to register common stock issued or
25
reserved for issuance under our Amended and Restated 2006 Stock Incentive Plan. Upon filing of the Form S-8, 1,843,076 shares of common stock will be issuable pursuant to vested options and available for sale into the public markets, except for those held by persons subject to the expiration of the 180-day lock-up agreements. The market price of our common stock may drop significantly when the restrictions on resale by our directors, officers and existing stockholders lapse. See "Shares Eligible For Future Sale" and "Underwriting."
If you purchase the common stock sold in this offering, you will experience immediate dilution.
If you purchase our common stock in this offering, you will experience immediate dilution of $2.10 per share (based on the midpoint of the price range on the cover of this prospectus), because the price that you pay will be greater than the net tangible book value per share of the shares you acquire. This dilution is due in large part to the fact that our earlier investors paid substantially less than the initial public offering price when they purchased their shares. You will experience additional dilution upon the exercise of outstanding stock options to purchase shares of our common stock. See "Dilution."
We do not currently intend to pay dividends in the foreseeable future.
It is uncertain when, if ever, we will declare dividends to our stockholders. During the next few years of operations, we expect that we will retain virtually all profit. Our ability to pay dividends may be constrained by our holding company structure under which we are dependent on payments by our subsidiaries, which are subject to limitations imposed on them by Maryland law, in the case of ACA Financial Guaranty, or otherwise with respect to our other subsidiaries. See "Dividend Policy" and "Business—Regulation." You should not rely on an investment in us if you require dividend income. In the foreseeable future, the only possible return on an investment in us would come from an appreciation of our common stock.
Insiders will continue to have substantial control over us after this offering and could limit your ability to influence the outcome of key transactions, including a change of control.
Our directors, executive officers and principal stockholders and entities affiliated with them will own approximately 61% of our outstanding shares of common stock after this offering. As a result, these stockholders, would be able to influence or control matters requiring approval by our stockholders including the election of directors and the approval of mergers or other fundamental transactions. In addition, several of our largest stockholders have entered into a stockholders agreement and have the right to nominate directors to our Board of Directors and its committees. The level of these rights depend on the amount of our common stock that such stockholder holds. These stockholders may thereby exercise significant control and influence in corporate matters. See "Description of Capital Stock—Stockholders Agreement." Such stockholders may also have interests that differ from yours and may vote in a way with which you disagree and which may be adverse to your interests. The concentration of ownership may have the effect of delaying, preventing or deterring a change of control of our company, could deprive our stockholders of an opportunity to receive a premium for their shares of common stock as part of a sale of our company and might ultimately affect the market price of our common stock.
Conflicts of interest may arise because some of our directors are principals of our stockholders.
Our board of directors includes representatives from BSMB/ACA LLC, SF Holding Corp. (f/k/a Stephens Group, Inc.), Chestnut Hill ACA, LLC and Third Avenue Trust. Those stockholders and their respective affiliates may invest in entities that directly or indirectly compete with us or companies in which they are currently invested may already compete with us. As a result of these relationships, when conflicts between the interests of those stockholders or their respective affiliates and the interests of our other stockholders arise, these directors may not be disinterested. Under Delaware law, transactions that we enter into in which a director or officer has a conflict of interest are generally permissible so long as (1) the material facts relating to the director's or officer's relationship or interest
26
as to the transaction are disclosed to our board of directors and a majority of our disinterested directors approves the transaction, (2) the material facts relating to the director's or officer's relationship or interest as to the transaction are disclosed to our stockholders and a majority of our disinterested stockholders approves the transaction, or (3) the transaction is otherwise fair to us. The BSMB/ACA LLC, SF Holding Corp., Chestnut Hill ACA, LLC and Third Avenue Trust representatives on our board of directors and the representatives of certain of our other significant stockholders, should they become members of our board of directors, by the terms of our Certificate of Incorporation, are not required to offer us any transaction opportunity of which they become aware and could take any such opportunity for themselves or offer it to other companies in which they have an investment, unless such opportunity is expressly offered to them solely in their capacity as a director of our company. See "Description of Capital Stock—Corporate Opportunities."
Applicable insurance laws may make it difficult to effect a change of control of our company.
The insurance law of Maryland prevents any person from acquiring control of ACA Capital or of ACA Financial Guaranty unless that person has filed a notification with specified information with the Maryland Insurance Commissioner and has obtained his or her prior approval. Under the Maryland statute, acquiring 10% or more of the voting stock of an insurance company or its parent company is presumptively considered a change of control, although such presumption may be rebutted. Accordingly, any person who acquires, directly or indirectly, 10% or more of the voting securities of ACA Capital without the prior approval of the Maryland Insurance Commissioner will be in violation of this law and may be subject to injunctive action requiring the disposition or seizure of those securities by the Maryland Insurance Commissioner or prohibiting the voting of those securities and to other actions determined by the Maryland Insurance Commissioner. In addition, many U.S. state insurance laws require prior notification to state insurance departments of a change in control of a non-domiciliary insurance company doing business in those states. While these pre-notification statutes do not authorize the state insurance departments to disapprove the change in control, they authorize regulatory action, including revocation of ACA Financial Guaranty's license, in the affected state if particular conditions exist such as undue market concentration. Any future transactions that would constitute a change in control of ACA Capital may require prior notification in those states that have adopted pre-acquisition notification laws. Given the importance of ACA Financial Guaranty's "A" rating to our business, as a practical matter, a change of control would require confirmation in advance from the rating agencies that such transaction would not result in a downgrading of the financial strength rating assigned to ACA Financial Guaranty.
The foregoing legal restrictions will have the effect of rendering more difficult or discouraging unsolicited takeover bids from third parties or the removal of incumbent management.
We have anti-takeover defenses that could impede an acquisition or an attempt to replace or remove our directors, which could diminish the value of our common stock.
Certain provisions of the Delaware General Corporation Law which we did not opt out of and certain provisions of our Certificate of Incorporation and Bylaws may have the effect of discouraging, delaying or preventing hostile takeovers, including those that might result in a premium being paid over the market price of our common stock, and discouraging, delaying or preventing changes in control or our management. See "Description of Capital Stock—Delaware Anti-Takeover Law and Charter and Bylaw Provisions."
Management has discretion to use unallocated net proceeds.
We have not designated a specific use for the net proceeds to our company from the sale of common stock in this offering. We expect to use the net proceeds of this offering for general corporate purposes. Consequently, the Board of Directors and management of our company will have broad discretion in allocating the net proceeds to our company from this offering. See "Use of Proceeds."
27
Some of the statements under "Prospectus Summary," "Risk Factors," "Management's Discussion and Analysis of Financial Condition and Results of Operations," "Business" and elsewhere in this prospectus may include forward-looking statements which reflect our current views with respect to future events and financial performance. These statements include forward-looking statements both with respect to us specifically and the asset management, structured credit and municipal finance industries in general. Statements which include the words "expect," "intend," "plan," "believe," "project," "anticipate," "may," "will," "continue," "further," "seek," and similar words or statements of a future or forward-looking nature identify forward-looking statements for purposes of the federal securities laws or otherwise. In particular, our description of our business strategy, including our entering into new business markets and geographic regions are forward-looking statements.
All forward-looking statements address matters that involve risks and uncertainties. Accordingly, there are or will be important factors that could cause our actual results to differ materially from those indicated in these statements. We believe that these factors include but are not limited to those described under "Risk Factors" above and the following:
- •
- downgrades of the financial strength ratings assigned to our insurance subsidiary by any rating agency to us at any time, which have occurred in the past and may in the future result from a change in circumstances specific to us or more broadly related to the markets in which we operate, from a change in rating agency methodology, or otherwise;
- •
- losses associated with obligations we insure which are more frequent or severe than we anticipate or increases in our loss adjustment expenses relating to our work-out strategies which are greater than anticipated;
- •
- changes in general economic and market conditions, including interest rates and spreads and other factors;
- •
- developments in the world's financial and capital markets that adversely affect our loss experience, the demand for our products or our investment returns;
- •
- changes in regulation or tax laws applicable to us, our subsidiaries or customers;
- •
- downward fee pressures or tightening of interest rate spreads on our various products;
- •
- our inability to execute our business strategy;
- •
- losses in our investment portfolio;
- •
- our ability to identify, hire and retain qualified management and other personnel;
- •
- the effects of any future mergers, acquisitions and divestitures on our results of operations;
- •
- the impact of the actual results differing from the assumptions underlying our reserves, including reserves for the insurance lines in which we no longer participate, included in our "Other" business line;
- •
- changes in accounting policies or practices;
- •
- our inability to obtain additional capital when needed;
- •
- changes in the accounting for our business lines or any of the transaction we enter into;
- •
- loss of any of our key executives;
- •
- increased or changed competition in our markets; and
- •
- management's response to these factors.
28
The foregoing review of important factors should not be construed as exhaustive, and should be read in conjunction with the other cautionary statements and "Risk Factors" that are included in this prospectus. We undertake no obligation to update publicly or review any forward-looking statement, whether as a result of new information, future developments or otherwise.
If one or more of these or other risks or uncertainties materialize, or if our underlying assumptions prove to be incorrect, actual results may vary materially from what we projected. Any forward-looking statements you read in this prospectus reflect our current views with respect to future events and are subject to these and other risks, uncertainties and assumptions relating to our operations, results of operations, growth strategy and liquidity. All subsequent written and oral forward-looking statements attributable to us or to individuals acting on our behalf are expressly qualified in their entirety by this paragraph. You should specifically consider the factors identified in this prospectus that could cause actual results to differ before making an investment decision.
29
We estimate that our net proceeds from the initial public offering of our shares of common stock, after deducting the underwriting discounts and commissions and our estimated offering expenses, will be approximately $98,300,000 (based on the midpoint of the price range on the cover of this prospectus). We estimate that our net proceeds will be approximately $125,537,840 if the underwriters exercise their over-allotment option in full. A $1.00 increase (decrease) in the assumed initial public offering price of $16.00 per share would increase (decrease) the net proceeds to us from this offering by $6,393,750 assuming the number of shares offered by us, as set forth on the cover page of this prospectus, remains the same, after deducting the estimated underwriting discounts and commissions and assuming no exercise of the underwriters' over-allotment option.
We intend to use the net proceeds of this offering for general corporate purposes. While amounts have not been allocated for specific purposes, we believe that raising capital in the amounts offered by this prospectus and under current market conditions will provide sufficient flexibility to our management to dedicate appropriate amounts to suitable opportunities as they arise. We will not receive any of the proceeds from the sale of shares of common stock by the selling stockholders.
30
Following the consummation of this offering, we intend to retain all available funds for use in the operation and expansion of our business and we do not anticipate paying any cash dividends in the foreseeable future. Any determination to pay cash dividends will be at the discretion of our Board of Directors and will be dependent upon our results of operations and cash flows, our financial position and capital requirements, general business conditions, legal, tax, regulatory and any contractual restrictions on the payment of dividends and any other factors our Board of Directors deems relevant.
Our ability to pay dividends depends, in part, on the ability of our subsidiaries to pay dividends to us. Our subsidiaries are subject to significant regulatory and contractual restrictions limiting their ability to declare and pay dividends. As of June 30, 2006, ACA Financial Guaranty, which represents 90% of our assets on an unconsolidated basis, had a negative earned surplus in the amount of $109.9 million primarily due to the formula driven calculations which assign surplus to contingency reserves based on our portfolio of insurance exposures. Applicable insurance laws prohibit ACA Financial Guaranty from paying extraordinary dividends without the approval of the Maryland Insurance Commissioner until it has a positive earned surplus calculated on a SAP basis. The payment of ordinary dividends by ACA Financial Guaranty is also subject to a prior notice requirement. As many of our subsidiaries are held directly by ACA Financial Guaranty, our ability to receive dividends from those subsidiaries may also be subject to the restrictions of Maryland insurance law. See "Business—Regulation—ACA Financial Guaranty Corporation—Insurance Holding Company Law—Dividends" for a description of the definition and calculation of extraordinary dividends and ordinary dividends and the restrictions on our ability to pay dividends. ACA Financial Guaranty also does not intend to pay any dividends to us to the extent it would impact its ability to maintain its "A" rating. Further, we will not be able to use any of the assets of any of the CDOs in which we invest or the credit opportunity fund to pay dividends.
For more information regarding restrictions on the payment of dividends by us and our subsidiaries, see "Management's Discussion and Analysis of Financial Condition and Results of Operations—Liquidity and Capital Resources."
31
The following table sets forth our capitalization as of June 30, 2006:
- •
- on an actual basis; and
- •
- on an as adjusted basis to reflect the conversion of our preferred shares into common stock, in the case of our convertible preferred stock and senior convertible preferred stock, at a conversion rate of 6,000 shares of common stock for each such share of preferred stock and, in the case of series B senior convertible preferred stock, at a conversion rate of six shares of common stock for each such share of preferred stock, all of which will occur concurrently with the closing of this offering; also gives effect to the receipt of approximately $98.3 million in estimated net proceeds from the sale of shares of common stock in this offering, assuming an initial public offering price of $16.00 per share, the midpoint of the range on the cover of this prospectus and assuming no exercise of the underwriters' over-allotment option.
| | June 30, 2006 | |||||||||
|---|---|---|---|---|---|---|---|---|---|---|
| | Actual(1) | As Adjusted(1) | ||||||||
| | (dollars in thousands) | |||||||||
| Debt | ||||||||||
| Corporate debt | $ | 79,899 | $ | 79,899 | ||||||
| CDO debt—operating | 113,940 | 113,940 | ||||||||
| CDO debt—non-recourse, net of discounts | 4,762,609 | 4,762,609 | ||||||||
| Total debt(2) | 4,956,448 | 4,956,448 | ||||||||
| Stockholders' equity: | ||||||||||
| Senior convertible preferred stock | 9,296 | — | ||||||||
| Convertible preferred stock | 54,858 | — | ||||||||
| Series B senior convertible preferred stock | 164,263 | — | ||||||||
| Common stock, $0.10 par value; 100,000,000 shares authorized, 7,106,490 shares issued and fully paid, as adjusted(3) | 710 | 3,641 | ||||||||
| Gross paid-in and contributed capital(4) | 133,558 | 457,344 | ||||||||
| Treasury stock | (12,088 | ) | (12,088 | ) | ||||||
| Notes receivable from stockholders | (3,121 | ) | (3,121 | ) | ||||||
| Deferred compensation | (1,450 | ) | (1,450 | ) | ||||||
| Accumulated other comprehensive income | 12,680 | 12,680 | ||||||||
| Retained earnings | 54,010 | 54,010 | ||||||||
| Total stockholders' equity(4) | 412,716 | 511,016 | ||||||||
| Total capitalization(2)(4) | $ | 5,369,164 | $ | 5,467,464 | ||||||
- (1)
- Excludes the following: 2,973,918 shares of common stock reserved under our Amended and Restated 2006 Stock Incentive Plan but not yet issued as of October 3, 2006, which includes 543,000 shares reserved for issuance pursuant to the exercise of certain options granted contingent upon the completion of this offering; 3,354,054 shares of common stock that may be issued pursuant to outstanding options as of October 3, 2006 at a weighted average exercise price of $11.28 per share; and 239,000 shares of restricted common stock, all granted contingent upon the completion of this offering.
- (2)
- Excluding CDO debt—non-recourse, which consists of debt issued by our CDOs and is solely the obligation of the entities which issue the CDOs' debt, total debt would be $193.8 million and total capitalization would be $606.6 million.
- (3)
- Reflects a 6-for-1 split of our outstanding common stock which was effected August 23, 2006.
- (4)
- A $1.00 increase (decrease) in the assumed initial public offering price of $16.00 per share (based on the midpoint of the price range on the cover of this prospectus) would increase (decrease) each of additional gross paid-in and contributed capital, total stockholders' equity and total capitalization by $6.4 million, assuming the number of shares offered by us, as set forth on the cover page of this prospectus, remains the same and after deducting the estimated underwriting discounts and commissions and estimated offering expenses payable by us.
32
Dilution per share represents the amount by which the price per share paid by purchasers of common stock in this initial public offering exceeds the net tangible book value per share of common stock immediately after the consummation of this offering. Net tangible book value is defined as our total tangible assets, reduced by our total liabilities. Our net tangible book value as of June 30, 2006 was $407.8 million, or approximately $65.20 per common share (as adjusted to reflect the 6-for-1 split of our outstanding common stock which was effected on August 23, 2006 but before giving effect to the conversion of all outstanding convertible preferred stock, senior convertible preferred stock and series B senior convertible preferred stock into shares of common stock concurrently with the consummation of this offering). Pro forma net tangible book value per share gives effect to the conversion of our preferred stock described above and gives effect to the sale of shares of common stock by us in this offering at an assumed initial public offering price of $16.00 per share, the midpoint of the price range set forth on the cover of this prospectus, and after deducting the estimated underwriting discounts and commissions and estimated offering expenses payable by us. Our pro forma net tangible book value as of June 30, 2006 would have been $506.1 million, or approximately $13.90 per share of common stock. This represents an immediate decrease in net tangible book value of $51.30 per share of common stock to existing stockholders and an immediate dilution in pro forma net tangible book value of $2.10 per share to new investors purchasing common stock in this offering.
The following table illustrates this per share dilution:
| Assumed initial public offering price per share | $ | 16.00 | ||||
| Net tangible book value per share as of June 30, 2006 | 65.20 | |||||
| Decrease in net tangible book value per share attributable to the conversion of our outstanding convertible preferred stock, senior convertible preferred stock and series B senior convertible preferred stock | (51.40 | ) | ||||
| Increase per share attributable to this offering | 0.10 | |||||
| Pro forma net tangible book value per share as of June 30, 2006, after this offering | 13.90 | |||||
| Dilution per share to new investors | $ | 2.10 | ||||
A $1.00 increase (decrease) in the assumed initial public offering price of $16.00 per share would increase (decrease) our pro forma net tangible book value by $6.4 million, the pro forma net tangible book value per share after this offering by $0.18 per share and the dilution in pro forma net tangible book value to new investors in this offering by $0.82 per share, assuming the number of shares offered by us, as set forth on the cover page of this prospectus, remains the same and after deducting the estimated underwriting discounts and commissions and estimated offering expenses payable by us.
The following table summarizes, as of June 30, 2006, on the pro forma basis described above, the difference between existing stockholders and new investors with respect to the number of shares of common stock purchased from us, the total consideration paid to us and the average price per share paid by our existing stockholders and by the investors purchasing shares of common stock in this offering. The calculation below is based on an assumed initial public offering price of $16.00 per share
33
before deducting underwriting discounts and commissions and estimated offering expenses payable by us.
| | Shares Purchased | Total Consideration | Average Price | |||||||||
|---|---|---|---|---|---|---|---|---|---|---|---|---|
| | Number | Percent | Amount | Percent | Per Share(1) | |||||||
| | | | (in thousands) | | ||||||||
| Existing stockholders | 29,648 | 81 | % | $ | 348,641 | 76 | % | $ | 11.76 | |||
| New investors | 6,875 | 19 | 110,000 | 24 | $ | 16.00 | ||||||
| Total | 36,523 | 100 | % | $ | 458,641 | 100 | % | |||||
- (1)
- Total average price per share paid by all stockholders is $12.56.
A $1.00 increase (decrease) in the assumed initial public offering price of $16.00 per share would increase (decrease) total consideration paid by new investors, total consideration paid by all stockholders and the average price per share paid by all stockholders by $6,875,000, $6,875,000 and $0.19, respectively, assuming the number of shares offered by us, as set forth on the cover page of this prospectus, remains the same, and without deducting underwriting discounts and commissions and other expenses of this offering.
The share amounts in this table exclude options with respect to 3,354,054 shares of common stock outstanding as of October 3, 2006, with a weighted average exercise price of $11.28, and 2,973,918 shares of common stock available for issuance under our Amended and Restated 2006 Stock Incentive Plan, 543,000 of which have been granted for options and 239,000 of which have been granted for restricted stock, in each case contingent upon the completion of this offering. The amount of shares and exercise price have been adjusted to reflect a 6-for-1 share split. To the extent that any options are exercised, there will be further dilution to new investors. If all of our outstanding options as of June 30, 2006 had been exercised, the pro forma net tangible book value per share after this offering would be $13.68 per share, respresenting an immediate decrease in pro forma net tangible book value of $0.22 per share to our existing stockholders pre-offering and an immediate decrease in the pro forma net tangible book value to our new investors of $2.32 post-offering.
If the underwriters exercise their over-allotment option in full, the number of shares held by new investors will increase to 14,034,823, or 36.6% of the total number of shares of common stock outstanding after this offering and the dilution per share to new investors will be $2.77.
34
SELECTED CONSOLIDATED FINANCIAL AND OTHER DATA
The following table sets forth our selected consolidated financial data for the periods presented. The consolidated statements of operations for the years ended December 31, 2003, 2004 and 2005 and the consolidated balance sheet data as of December 31, 2004 and 2005 are derived from our audited consolidated financial statements and related notes included elsewhere in this prospectus. The consolidated statements of operations for the years ended December 31, 2001 and 2002 and the consolidated balance sheet data as of December 31, 2001, 2002 and 2003 are derived from our historical consolidated financial statements not included in this prospectus. The selected historical financial data as of and for the six months ended June 30, 2005 and 2006 is derived from our unaudited interim financial statements and includes, in the opinion of management, all adjustments, consisting only of normal recurring adjustments, that we consider necessary for the fair presentation of our financial position and results of operations for these periods. The results of operations for prior accounting periods are not necessarily indicative of the results to be expected for any future accounting periods. You should read this information together with "Management's Discussion and Analysis of Financial Condition and Results of Operations" and our consolidated financial statements and the related notes thereto included elsewhere in this prospectus.
| | Year Ended December 31, | Six Months Ended June 30, | ||||||||||||||||||||||
|---|---|---|---|---|---|---|---|---|---|---|---|---|---|---|---|---|---|---|---|---|---|---|---|---|
| | 2001 | 2002 | 2003 | 2004 | 2005 | 2005 | 2006 | |||||||||||||||||
| | (in thousands, except per share amounts) | |||||||||||||||||||||||
| Statement of Operations Data(a): | ||||||||||||||||||||||||
| Gross premiums written | $ | 23,021 | $ | 53,350 | $ | 60,981 | $ | 44,570 | $ | 41,280 | $ | 17,805 | $ | 20,515 | ||||||||||
| Net premiums written | $ | 5,459 | $ | 45,520 | $ | 57,516 | $ | 45,481 | $ | 41,918 | $ | 18,571 | $ | 20,329 | ||||||||||
| Premiums earned | $ | 6,672 | $ | 12,062 | $ | 18,796 | $ | 29,833 | $ | 33,343 | $ | 16,221 | $ | 13,357 | ||||||||||
| Net insured credit swap revenue | — | 1,557 | 6,841 | 16,018 | 21,571 | 4,543 | 22,111 | |||||||||||||||||
| Net investment income | 11,567 | 20,269 | 52,868 | 126,170 | 254,591 | 114,474 | 160,164 | |||||||||||||||||
| Net realized gains (losses) on investments | 6,511 | 4,138 | 3,188 | (6,547 | ) | (2,777 | ) | (1,223 | ) | (3,223 | ) | |||||||||||||
| Net realized and unrealized gains (losses) on derivative instruments | — | (25,092 | ) | 9,124 | 6,520 | 8,410 | 4,040 | 6,139 | ||||||||||||||||
| Other net credit swap revenue | — | 4,975 | 12,121 | 10,990 | 4,157 | 2,524 | 5,544 | |||||||||||||||||
| Fee income | 194 | 4,236 | 8,898 | 6,091 | 11,110 | 4,366 | 11,073 | |||||||||||||||||
| Other income | — | 676 | 423 | 3,937 | 189 | 295 | 104 | |||||||||||||||||
| Total revenues | 24,944 | 22,821 | 112,259 | 193,012 | 330,594 | 145,240 | 215,269 | |||||||||||||||||
| Loss and loss adjustment expenses | 1,636 | 1,801 | 3,168 | 46,590 | 14,038 | 4,139 | 3,682 | |||||||||||||||||
| Policy acquisition costs | 3,680 | 4,046 | 4,077 | 3,835 | 8,652 | 3,984 | 4,160 | |||||||||||||||||
| Other operating expenses | 16,053 | 18,683 | 29,466 | 38,645 | 37,443 | 14,669 | 23,294 | |||||||||||||||||
| Interest expense | 126 | 9,869 | 39,260 | 101,137 | 214,313 | 95,504 | 137,383 | |||||||||||||||||
| Depreciation and amortization | 730 | 1,081 | 4,115 | 6,935 | 8,583 | 4,064 | 4,717 | |||||||||||||||||
| Total expenses | 22,225 | 35,480 | 80,086 | 197,142 | 283,029 | 122,360 | 173,236 | |||||||||||||||||
| (Income) loss of minority interest | — | — | — | 476 | (3,708 | ) | (1,685 | ) | (2,229 | ) | ||||||||||||||
| Income (loss) before provision (benefit) for income taxes | 2,719 | (12,659 | ) | 32,173 | (3,654 | ) | 43,857 | 21,195 | 39,804 | |||||||||||||||
| Provision (benefit) for income taxes | 110 | (6,318 | ) | 12,206 | 135 | 15,097 | 8,078 | 13,615 | ||||||||||||||||
| Net income (loss) | $ | 2,609 | $ | (6,341 | ) | $ | 19,967 | $ | (3,789 | ) | $ | 28,760 | $ | 13,117 | $ | 26,189 | ||||||||
Share and Per Share Data(b): | ||||||||||||||||||||||||
| Earnings (loss) per share | ||||||||||||||||||||||||
| Basic | $ | 0.42 | $ | (1.01 | ) | $ | 3.18 | $ | (0.61 | ) | $ | 1.26 | $ | 0.58 | $ | 1.15 | ||||||||
| Diluted | $ | 0.22 | $ | (1.01 | ) | $ | 1.51 | $ | (0.61 | ) | $ | 0.96 | $ | 0.44 | $ | 0.87 | ||||||||
| Weighted average number of shares of common stock outstanding | ||||||||||||||||||||||||
| Basic | 6,168 | 6,282 | 6,270 | 6,168 | 22,794 | 22,698 | 22,830 | |||||||||||||||||
| Diluted | 11,868 | 6,282 | 13,260 | 6,168 | 29,886 | 29,682 | 29,846 | |||||||||||||||||
| Book value per share(c) | $ | 13.49 | $ | 12.42 | $ | 15.04 | $ | 12.38 | $ | 13.04 | $ | 12.89 | $ | 13.89 | ||||||||||
35
| | As of December 31, | As of June 30, | |||||||||||||||||||
|---|---|---|---|---|---|---|---|---|---|---|---|---|---|---|---|---|---|---|---|---|---|
| | 2001 | 2002 | 2003 | 2004 | 2005 | 2005 | 2006 | ||||||||||||||
| | (in thousands, except per share amounts and where otherwise noted) | ||||||||||||||||||||
| Summary Balance Sheet Data(a): | |||||||||||||||||||||
| Cash and cash equivalents(d) | $ | 32,355 | $ | 82,361 | $ | 212,511 | $ | 259,000 | $ | 224,605 | $ | 249,345 | $ | 276,771 | |||||||
| Total investments(e) | 199,317 | 726,184 | 3,109,179 | 5,275,699 | 5,418,079 | 5,416,782 | 5,312,037 | ||||||||||||||
| Derivative assets | 0 | 6,752 | 19,343 | 28,460 | 15,250 | 20,108 | 16,868 | ||||||||||||||
| Total assets(d)(e) | 299,062 | 916,966 | 3,463,863 | 5,691,961 | 5,792,200 | 5,808,066 | 5,745,503 | ||||||||||||||
| Unearned premiums | 101,208 | 136,222 | 172,278 | 180,140 | 187,739 | 181,602 | 194,486 | ||||||||||||||
| Reserve for losses and loss adjustment expenses | 3,405 | 6,555 | 4,984 | 36,006 | 34,306 | 27,122 | 37,244 | ||||||||||||||
| Total debt(e) | 825 | 541,470 | 2,964,332 | 4,903,047 | 5,029,348 | 5,077,464 | 4,956,448 | ||||||||||||||
| Derivative liabilites | 0 | 40,010 | 64,045 | 58,755 | 46,538 | 63,618 | 31,628 | ||||||||||||||
| Total liabilities | 128,144 | 757,106 | 3,269,557 | 5,306,424 | 5,385,646 | 5,406,543 | 5,299,658 | ||||||||||||||
| Minority interest | — | — | — | 20,923 | 22,241 | 22,935 | 33,129 | ||||||||||||||
| Accumulated other comprehensive income | 919 | (5,583 | ) | 8,896 | 21,952 | 11,132 | 24,309 | 12,680 | |||||||||||||
| Total stockholders' equity | 170,918 | 159,860 | 194,306 | 364,614 | 384,313 | 378,588 | 412,716 | ||||||||||||||
| Other Data(g): | |||||||||||||||||||||
| Credit exposure(f) (in millions) | $ | 5,563 | $ | 6,378 | $ | 8,563 | $ | 11,296 | $ | 21,467 | $ | 14,017 | $ | 31,406 | |||||||
| CDO assets under management (in millions) | N/A | $ | 2,403 | $ | 5,830 | $ | 7,798 | $ | 9,907 | $ | 8,440 | $ | 12,120 | ||||||||
| Statutory Financial Data (ACA Financial Guaranty)(g): | |||||||||||||||||||||
| Contingency reserve(h) | $ | 13,959 | $ | 21,162 | $ | 31,520 | $ | 46,129 | $ | 74,377 | $ | 61,921 | $ | 90,893 | |||||||
| Policyholders' surplus | 106,802 | 123,635 | 134,565 | 279,985 | 266,108 | 270,485 | 263,444 | ||||||||||||||
| Qualified statutory capital(i) | $ | 120,761 | $ | 144,797 | $ | 166,085 | $ | 326,114 | $ | 340,485 | $ | 332,406 | $ | 354,337 | |||||||
- (a)
- Under U.S. GAAP, we are required to consolidate into our financial statements the income, expense, assets and liabilities related to certain of our CDOs when we are deemed to be the primary beneficiary of the CDO vehicle. Although these CDOs are consolidated, we do not have the right to use the assets of the CDOs for general operations or in satisfaction of our corporate debt obligations. Our investment exposure to our CDOs is therefore limited to the equity we retain, which is the first loss position of the CDO. For a description of the impact of consolidation on our financial statements, see "Management's Discussion and Analysis of Financial Condition and Results of Operations—Critical Accounting Policies and Estimates—Consolidation of Variable Interest Entities (VIEs) and Other Restricted Investments" and "Management's Discussion and Analysis of Financial Condition and Results of Operations—Results by Business Line—CDO Asset Management—Consolidation of VIEs."
- (b)
- Earnings per share and weighted average number of shares of common stock outstanding were restated to reflect the 6-for-1 stock split that was completed on August 23, 2006.
- (c)
- Book value per share is based on total stockholders' equity divided by basic common stock outstanding after giving effect to the August 23, 2006 stock split and gives effect to the conversion of our convertible preferred stock, senior convertible preferred stock and series B senior convertible preferred stock on a post-conversion basis.
- (d)
- Includes cash and cash equivalents related to our consolidated CDOs of $0, $6.1 million, $109.6 million, $141.3 million, $125.2 million, $147.6 million and $187.7 million as of December 31, 2001, 2002, 2003, 2004 and 2005 and June 30, 2005, and 2006 respectively. Also includes restricted cash balances of $0, $22.0 million, $30.9 million, $30.1 million, $50.2 million, $40.3 million and $54.1 million as of December 31, 2001, 2002, 2003, 2004 and 2005 and June 30, 2005 and 2006, respectively. Restricted cash balances relate to cash on deposit for the benefit of various counterparties in our CDO Asset Management and Structured Credit businesses.
- (e)
- Includes investments related to our consolidated CDOs of $0, $382.7 million, $2,711.4 million, $4,732.2 million, $4,810.9 million, $4,818.4 million and $4,709.9 million and a guaranteed investment contract related to our consolidated CDOs of $0, $122.5 million, $122.5 million, $122.6 million, $119.3 million, $122.6 million and $119.3 million both as of December 31, 2001, 2002, 2003, 2004 and 2005, and June 30, 2005 and 2006, respectively. Includes non-recourse debt related to our consolidated CDOs of $0, $494.5 million, $2,804.8 million, $4,728.6 million, $4,833.2 million, $4,882.1 million and $4,762.6 million as of December 31, 2001, 2002, 2003, 2004 and 2005, and June 30, 2005 and 2006, respectively.
- (f)
- Equal to the amount of notional and net par outstanding guaranteed by ACA Financial Guaranty.
- (g)
- This information is not derived from our audited consolidated financial statements or unaudited interim consolidated financial statements.
- (h)
- Under statutory accounting practices, or SAP, prescribed or permitted by the Maryland Insurance Administration, we are required to establish contingency reserves based on a specified percentage of either written premiums or insured exposure by bond type. A contingency reserve is an additional liability reserve established to protect the policyholder against the effects of adverse economic developments or cycles or other unforeseen circumstances.
- (i)
- Qualified statutory capital, comprised of the sum of policyholders' surplus and contingency reserve, is a commonly used measure of statutory based equity in the financial guaranty industry.
36
MANAGEMENT'S DISCUSSION AND ANALYSIS OF FINANCIAL CONDITION
AND RESULTS OF OPERATIONS
The following discussion and analysis of our financial condition and results of operations should be read in conjunction with our consolidated financial statements and related notes included elsewhere in this prospectus. Some of the information contained in this discussion and analysis or in other sections of this prospectus may include forward-looking statements especially as they relate to our plans and strategy for our business. Forward-looking statements entail uncertainties and risks. Please see the "Forward-Looking Statements" for more information. You should also review the "Risk Factors" set forth elsewhere in this prospectus for a discussion of important factors that could cause actual results to differ materially from the results described in or implied by the forward-looking statements herein.
OVERVIEW
Executive Summary
We are a holding company engaged in the business of providing financial guaranty insurance products to participants in the global credit derivatives markets, structured finance capital markets and municipal finance capital markets. We also provide asset management services to specific segments of the structured finance capital markets. We participate in our target markets both as a provider of credit protection through the sale of financial guaranty insurance products, for risk-based revenues, and as an asset manager, for fee-based revenues. We conduct our financial guaranty insurance businesses through ACA Financial Guaranty Corporation, our "A" rated, regulated insurance subsidiary. We conduct our asset management business through ACA Management, L.L.C., a subsidiary of ACA Financial Guaranty. As of June 30, 2006, we had credit exposure of $31.4 billion and our assets under management for third parties were $12.1 billion. We apply our core competencies of credit analysis, structuring, risk management and surveillance across our business platform to create efficiencies in our operations and to deliver a wide range of services and product solutions for institutional customers.
Approximately 90% of our assets on an unconsolidated basis represent our 100% ownership interest in ACA Financial Guaranty. ACA Financial Guaranty provides financial guaranty insurance policies for our Municipal Finance business, for the credit swaps in our Structured Credit business and for certain other transactions described in "Other." Our CDO Asset Management business is operated by ACA Management, L.L.C., an SEC registered investment adviser, which is a subsidiary of ACA Financial Guaranty.
We sell credit swaps in the institutional fixed income markets, which are insured by our insurance subsidiary, ACA Financial Guaranty, and provide financial guaranty insurance on municipal and other public finance bonds. We also provide asset management services by selecting and managing pools of fixed income assets for CDOs we create for institutional investors.
Our financial results include three principal operating business lines: Structured Credit and Municipal Finance, which are both financial guaranty insurance lines of business, and our CDO Asset Management business. We have a fourth business line, Other, which encompasses specified insurance transactions in areas in which we are no longer active, including industry loss warranty transactions, trade credit reinsurance and insurance of certain asset-backed securitizations, principally, manufactured housing.
We believe it is more meaningful to analyze our financial performance on an annual, rather than a quarterly, basis in order to give our business lines flexibility to select only those opportunities that meet our risk-adjusted return expectations. We believe this maximizes our profitability and allows our business lines to avoid unfavorable pricing, credit spreads and general market conditions that may occur in any particular quarter. Furthermore, during any given year we enter into a limited number of
37
transactions in each of our lines of business and do not set corporate goals based on closing a specified number of transactions or writing a specific notional or par amount in any particular quarter or year. The transactions in which we participate are often highly negotiated and often take a significant period of time from start to finish, up to one year in Municipal Finance and up to nine months for a CDO. For example, we completed 36, 43, 22 and 16 transactions in our Structured Credit business and entered into 45, 39, 62 and 107 Municipal Finance guarantees for the six months ended June 30, 2006 and years ended December 31, 2005, 2004 and 2003, respectively. Also, our CDO Asset Management business sponsors a limited number of CDOs each year; we closed three CDOs in the first six months of 2006, five in 2005, two in 2004 and four in 2003, and we may not be able to sponsor a significantly increasing number of CDOs each year. Accordingly, our financial performance can vary significantly from quarter to quarter and the operating results for any quarter are not indicative of results for any future period.
As a result, we use performance metrics other than the number of transactions to manage our business and set performance targets. Aggregate fixed insured credit swap premiums payable to us and aggregate notional amount of our insured credit swaps in any given year are the performance metrics we use for analyzing our Structured Credit business. The aggregate fixed insured credit swap premium payments paid to us are presented in our consolidated statement of operations as a component of net insured credit swap revenue. For Municipal Finance, we target a certain level of written premiums, since premiums are earned over up to 30 years per transaction, and therefore do not significantly impact earned premium in any given year on an individual policy basis. In the case of CDO Asset Management, we set targets for Assets Under Management ("AUM") for each year. Additionally, management analyzes the profitability of each transaction relative to our risk-adjusted return expectations and reviews overall performance using a measure known as net economic results. Management believes that analyzing net economic results enhances the understanding of our results of operations by highlighting income attributable to our ongoing operating performance. See "—Net Economic Results."
We seek to maximize revenue which is a function of both the notional or net par amount and the premium for any given transaction based on the level of risk, credit spreads and opportunities associated with the transaction. Since a substantial part of our financial performance in any given period relates to revenues earned for credit swap and Municipal Finance guarantees written in prior periods, and to existing CDO assets under management, our financial performance in any given quarter or year is not highly correlated to the number of transaction in that period.
If we are the primary beneficiary of a CDO as determined under FASB Interpretation No. 46 (revised December 2003), "Consolidation of Variable Interest Entities," or FIN 46(R), we are required to consolidate the CDO on our financial statements. When we entered the CDO Asset Management business in 2002, in order to increase the marketability of our CDOs we retained the entire or the majority of the equity position in our CDOs. Accordingly, we are required to consolidate the seven funded CDOs out of the first nine CDOs we closed. Although these CDOs are consolidated, we do not have the right to use the assets of the CDOs for general operations and the debt liabilities of the CDOs are without recourse to any assets other than those of the CDOs. In addition, we are required to mark to market any derivatives included in the consolidated CDO structures.
Beginning in 2005, we have retained a lesser share of the equity position of our newly issued CDOs and are not deemed a primary beneficiary of those CDOs. Thus, we are not required to consolidate these CDOs based on a FIN 46(R) analysis. Rather, our non-majority investment is recorded as an investment in a single fixed maturity security under the provisions of FAS 115 "Accounting for Certain Investments in Debt and Equity Securities" and Emerging Issues Task Force ("EITF") Issue No. 99-20 "Recognition of Interest Income and Impairment on Purchased and Retained Interests in Securitized Financial Assets." During 2005 and the first six months of 2006 we purchased
38
equity interests in six of the eight newly closed CDOs. We intend to continue to retain a lesser share of the equity position of our future CDOs and therefore do not expect to consolidate those CDOs. Our consolidated CDOs have provisions for call dates commencing from 2005 to 2009, which differ from the stated maturity dates. Once the consolidated CDOs mature or are called, our financial statements will no longer be impacted by CDO consolidation. For a detailed discussion of the impact of consolidation on our financial statements, see "—Critical Accounting Policies and Estimates—Consolidation of Variable Interest Entities (VIEs) and Other Restricted Investments" and "—Results by Business Line—CDO Asset Management—Consolidation of VIEs."
Revenues
Within our Structured Credit business line, our primary source of revenue is:
- •
- revenue from the credit protection that we sell, in the form of insured credit swaps.
Within our Municipal Finance business line, our primary source of revenue is:
- •
- premiums from insuring the obligations of municipalities and other tax-exempt entities, typically received on an upfront basis.
Within our CDO Asset Management business line, our primary sources of revenues include:
- •
- asset management and structuring fees related to CDOs;
- •
- warehouse income, which are fees earned prior to the closing of the CDO while we are accumulating the CDO assets. (During asset accumulation, the CDO assets are owned by the sponsoring investment bank and held in what we call a warehouse facility);
- •
- investment income from our portfolio of consolidated CDO assets, including income from our CDO equity investments;
- •
- credit swap fees from our CDOs; and
- •
- premiums for credit swaps on insured equity tranches of unfunded synthetic CDOs.
While some transactions may be subject to an early call or refunding, generally each of our business lines produce revenues which are fairly predictable. Our Structured Credit transactions generally pay a quarterly premium as a percentage of the notional amount of the credit swap over the life of the credit swap. Municipal Finance transactions generally pay premiums upfront, which are earned in proportion to the expiration of risk, which is par. Premium payable in our Municipal Finance transactions is allocated to each par maturity and earned on a straight-line basis for the period the related par is outstanding. In our CDO Asset Management business line, our management fees are paid on a contractual basis as a percentage of AUM over the life of the transaction.
ACA Capital, through special purpose indirect subsidiaries of ACA Financial Guaranty, enters into credit swap transactions with various financial institutions, which are insured by ACA Financial Guaranty. We enter into the credit swaps with an intent that they remain outstanding for the entire term of the contract. These insured credit swaps are accounted for at fair value since they do not qualify for the financial guarantee scope exception under FAS No. 133 "Accounting for Derivative Instruments and Certain Hedging Activities," as amended ("FAS 133"). Changes in the fair value of these contracts are marked to market under the requirements of FAS 133 and are recorded, together with the related fixed quarterly premium payments payable to us under the insured credit swaps, under the caption net insured credit swap revenue. We expect the fair values of these insured credit swaps to fluctuate primarily based on changes in credit spreads and the credit quality of the underlying referenced entities. When we hold these insured credit swaps for the entire term of the contract the
39
cumulative changes in fair value will net to zero at the end of the term, provided that we do not incur credit losses on the contract. In certain circumstances, we may agree with a counterparty to terminate an insured credit swap transaction prior to its maturity (such as on request of the counterparty or for risk management purposes, for instance in connection with a deterioration of the underlying portfolio). We may experience realized gains or losses in connection with the early termination of insured credit swap transactions.
In addition to the revenue items listed above, all of our business lines are allocated a percentage of the investment income generated by the fixed-income securities in our non-CDO investment portfolio based on each business line's estimated capital utilization. This investment portfolio, including cash and short-term investments, at June 30, 2006 was approximately $536.7 million and resides in our insurance subsidiary, ACA Financial Guaranty.
We also experience net realized gains and losses on investments from the sale or impairment of securities in ACA Financial Guaranty's investment portfolio as well as from the gains and losses on assets from our CDOs. We may also realize gains or losses on derivatives resulting from losses relating to credit event payments made by us under our credit swaps. We also are required to record all of these contracts at fair value under FAS 133. Fair value gains and losses represent changes in the fair value of these derivative contracts. As discussed above, we expect these fair values, and therefore unrealized gains and losses, to fluctuate primarily based on changes in credit spreads and credit quality of the underlying referenced entities and in the case of interest rate swaps and caps, changes in prevailing market interest rates.
Expenses
Our consolidated expenses include six types:
- •
- Loss and loss adjustment expense, or LAE, reserves are established on our non-derivative exposure in an amount equal to our estimate of identified or case-specific reserves and non-specific reserves, including costs of settlement, on the obligations we have insured. LAE reserves relate primarily to our Municipal Finance business, given the low investment grade or non-investment grade exposure that we take in this portion of our business.
- •
- Policy acquisition costs relate to the expenses incurred that vary with and are directly attributable to the generation of insurance premiums, including, but not limited to, premium taxes, personnel and personnel-related expenses of individuals involved in marketing and underwriting, and certain rating agency and legal fees for municipal and non-derivative structured finance business. Policy acquisition costs are deferred and recognized over the period in which the related premiums are earned. The costs associated with the generation of our Structured Credit transactions that are in the form of credit swaps are not deferred; rather, they are expensed as incurred.
- •
- Other operating expenses, not directly attributable to the generation of insurance premiums, primarily consist of employee compensation and general operating expenses, including rent, marketing and advertising and other professional service fees.
- •
- Interest expenses primarily consist of interest payments due on the debt of consolidated CDOs and on debt issued by us.
- •
- Depreciation and amortization expenses primarily consist of the amortization of capitalized debt issuance costs, including rating, legal and banking fees, related to the issuance of our consolidated CDOs and costs of capitalized equipment purchases and leasehold improvements.
- •
- Income tax expenses which are generally a function of our profitability and the applicable tax rate in the various jurisdictions in which we do business.
40
Additional Information
Other
We have a fourth line of business, Other, which encompasses insurance products in which we are no longer active, including industry loss warranty transactions, trade credit reinsurance and insurance of certain classes of assets in asset-backed securitizations, principally manufactured housing. At June 30, 2006, all of the exposure in this business line had either expired or was in run-off. Run-off indicates that while we will not add new exposure, we have some current exposure that has not yet expired.
With respect to the industry loss warranty transactions contained in "Other," we incurred $21.0 million of losses in 2004. We no longer have outstanding exposure to such business, nor do we intend to engage in such transactions in the future and due to changes in applicable financial guaranty insurance law, we are no longer able to engage in such transactions. An industry loss warranty is a reinsurance contract in which the payout is dependent on the occurrence of two triggers. The first trigger is the occurrence of an insured loss of the buyer; the second trigger is the loss to the insurance industry as a whole. Industry loss warranties are primarily used to protect against property risk, property catastrophe, marine, aviation, satellite losses, terrorism and workers' compensation catastrophe.
With respect to the trade credit reinsurance portion of "Other," this business was in run-off at June 30, 2006. Trade credit insurance provides protection against bad debt losses and export trade risks. We did not enter into new trade credit reinsurance contracts during 2005 or the first six months of 2006; however, we have outstanding exposure to contracts entered into during 2003 and 2004 until such exposure expires, generally over the next five years. On a net margin basis, defined as premiums earned less losses and commission and brokerage expenses, the contribution of these trade credit reinsurance contracts to our net income was $(0.4) million, $0.2 million, $0.1 million, $0.7 million and $0.1 million for the six months ended June 30, 2006 and 2005 and each of the years ended December 31, 2005, 2004 and 2003, respectively. We have no plans to enter into new trade credit reinsurance contracts in the future.
Three of a portfolio of 12 securitized manufactured housing bonds that we insured in 1999 experienced losses in 2004 and 2005. In response to an increase in the rate of delinquencies observed in the mortgages underlying each of the related securitizations, we established a case specific reserve in 2004 in the amount of $20.3 million. This reserve represented the present value of expected losses, discounted at the applicable treasury rate. Due to the very long tenor of these bonds, payments are projected to continue through 2033. Each year we increase the reserve for accretion to adjust to the proper present value. While the reserve represents our best estimate at the time of establishment of ultimate losses on a present value basis, facts and circumstances may change such that the estimate is required to be revalued. In the first six months of 2006, we recorded accretion of $0.5 million on this reserve. In 2005, in addition to the $1.0 million we recorded for accretion less the $0.7 million we made in claim payments, we increased the reserve by an additional $2.4 million. As of June 30, 2006, the reserve was $23.5 million.
2004 Recapitalization
In 2004, we recapitalized our balance sheet and reinforced our credit profile with a $169.7 million equity capital investment, including $105.0 million from Bear Stearns Merchant Banking and $64.7 million of incremental capital from pre-existing stockholders, management and an additional institutional stockholder. This capital raise was necessitated by the revised minimum capital requirements established by S&P, which increased requirements had precipitated the placement of ACA Financial Guaranty's financial strength rating on CreditWatch negative by S&P. Following the capital raise, ACA Financial Guaranty was removed from CreditWatch negative and allowed to retain its "A" financial strength rating by S&P, to expand our current businesses and to increase our product offerings
41
from the levels prior to the recapitalization, particularly within our Structured Credit and Municipal Finance businesses.
Restatement
Our consolidated statements of stockholders' equity contains a restatement for 2005. See Note 2 to our consolidated financial statements.
CRITICAL ACCOUNTING POLICIES AND ESTIMATES
We prepare our financial statements in accordance with accounting principles generally accepted in the United States of America, or U.S. GAAP. The following accounting estimates are viewed by management to be critical because they require significant judgment on the part of management. Financial results could be materially different if alternate methodologies were used or if management modified its assumptions.
Financial Guaranty Revenue Recognition
Premiums Earned—Premiums on financial guaranty insurance products in the form of traditional insurance policies are typically received on an upfront basis, although certain policies pay premium in periodic installments. The vast majority of our Municipal Finance business is conducted through the issuance of traditional policies. Traditional policies are those that meet the scope exception of the guidance of FAS 133, "Accounting for Derivative Instruments and Hedging Activities," paragraph 10d, as amended by FAS 149, "Amendment of Statement 133 on Derivative Instruments and Hedging Activities." The scope exception provides that financial guaranty contracts are not subject to FAS 133, if they meet certain specified criteria. In general, premiums from insured municipal obligations are received on an upfront basis. Installment premiums are earned over each installment period, which is generally one year or less. Upfront premiums are earned in proportion to the expiration of risk, which is par. Premium is allocated to each par maturity (e.g., principal payment) included in an insured bond and earned on a straight-line basis for the period the related insured risk is outstanding. Unearned premiums represent that portion of premiums which is applicable to coverage of risk to be provided in the future on policies in-force. When an insured issue is retired or defeased prior to the end of the expected period of coverage, the remaining unearned premiums, less any amount credited to the refunding issue insured by us, are recognized as earned premium. The amounts earned from refundings were approximately $3.5 million and $1.5 million for the first six months of 2006 and 2005, respectively. The amounts earned from refundings were approximately $6.6 million, $1.8 million and $0.4 million, for the years ended December 31, 2005, 2004 and 2003, respectively.
In connection with its review of certain accounting standards for financial guaranty insurance contracts, the FASB is considering potential changes relating to premium revenue recognition. See "—FASB Financial Guaranty Insurance Review" for further explanation of potential changes.
Net Insured Credit Swap Revenue—ACA Financial Guaranty insures the obligations of ACA Capital's affiliated special purpose entities under credit swaps, pursuant to which we sell credit protection. The related insured credit swap premiums are included in net insured credit swap revenue and are generally received in quarterly fixed payments over the life of the related swaps. Obtaining the fair value (as such term is defined in FAS 133) for such instruments requires the use of management judgment. These instruments are valued using pricing models based on the net present value of expected future cash flows and observed prices for other transactions bearing similar risk characteristics. The fair value of these instruments is included in derivative assets or derivative liabilities. We do not believe that our credit swaps meet the scope exception of FAS 133, paragraph 10d, as amended by FAS 149, because there is no contractual requirement that the protection purchaser be exposed to the underlying risk.
42
Net insured credit swap revenue includes insured credit swap premiums received and realized and unrealized gains and losses on such credit swaps.
Derivative Contracts. All derivative instruments are recognized in the consolidated balance sheet as either assets or liabilities depending on the fair value to us as a credit protection seller as of the determination date. All derivative instruments are measured at estimated fair value. We value derivative contracts based on quoted market prices, when available. However, if quoted prices are not available, the fair value is estimated using valuation models specific to the type of credit protection. Valuation models include the use of management estimates and current market information. We utilize both proprietary and vendor based models (including rating agency models) and a variety of market data to provide the best estimate of fair value. Some of the more significant types of market data that influence our models include, but are not limited to, credit ratings, interest rates, credit spreads, default probabilities and recovery rates. If management's underlying assumptions for evaluating fair value prove to be inaccurate, there could be material differences in our consolidated operating results.
Our principal derivative activity arises when we (i) originate synthetic CDOs where we assume the equity or first loss position through the use of a credit swap that is insured by ACA Financial Guaranty, (ii) insure tranches of credit swaps in our Structured Credit business also through ACA Financial Guaranty, and (iii) hedge against interest rate risk and certain financing costs in our consolidated CDOs.
Since our insured credit swap transactions, including any equity tranches that we retain in our CDOs, are not actively traded securities and have no observable market price, we utilize comprehensive internally developed models to estimate changes in fair value. We enter into our insured credit swaps with an intent to hold the contracts to maturity. Therefore, notwithstanding the changes in fair value recorded on our consolidated statement of operations, assuming that we do not incur credit losses on the contracts, the cumulative changes in fair value will net to zero over time.
In prior periods we have also recorded the income received from the credit swaps that constitute the assets of one partially funded consolidated synthetic CDO under one caption, derivative income, separate from the change in fair value and any realized losses or gains associated with these derivatives, which was recorded as realized and unrealized gains (losses) on derivative instruments on our consolidated statement of operations. In order to be consistent with our newly adopted accounting policy on insured credit swap transactions, we have determined to reclassify the derivative income from these derivatives and that portion of net realized and unrealized gains (losses) on derivative instruments that relates to these derivatives, and present them in our consolidated statement of operations on a net basis as other net credit swap revenues.
We enter into interest rate swaps to hedge our exposure to variable interest rates within our asset-backed CDOs. The value of the swaps will vary with changes in interest rates. Any ineffective portion of the cash flow hedge in those CDOs that are consolidated on our books have their change in fair value recorded in our consolidated statement of operations, while the effective portion is recorded to accumulated other comprehensive income. Ineffectiveness within the cash flow hedges occurs because certain upfront expenses of our CDOs are financed through these interest rate swaps. Effective July 1, 2005, we met the documentation standards of FAS 133 to qualify these swaps as cash flow hedges for accounting purposes on a prospective basis. Prior to July 1, 2005, we did not meet the documentation standard to achieve cash flow hedge accounting as required by FAS 133. As a result, these derivative contracts were not designated as cash flow hedges and the associated mark to market adjustments were included in our historical statements of operations. Cash flow hedges are hedges of the exposures to variable cash flows.
Policy Acquisition Costs. Policy acquisition costs include those expenses that relate primarily to and vary with premium production. Such costs are comprised primarily of premium taxes, personnel and personnel related expenses of individuals involved in underwriting, and certain rating-agency and
43
legal fees for municipal and non-derivative structured finance business. Anticipated claims and claim adjustment expenses are considered in determining the recoverability of acquisition costs. Net acquisition costs are deferred and amortized over the period in which the related premiums are earned. In connection with its review of certain accounting standards for financial guaranty insurance contracts, the FASB is considering potential changes relating to deferred policy acquisition costs. See "—FASB Financial Guaranty Insurance Review" for further explanation of potential changes.
Loss and Loss Adjustment Expenses. Financial guaranty loss and loss adjustment expense reserves are established on our non-derivative exposure in an amount equal to our estimate of identified or case-specific reserves and non-specific reserves, including cost of settlement, on the obligations ACA Financial Guaranty has incurred. In determining our accounting policy for loss reserves, we rely primarily on FAS 60, "Accounting and Reporting by Insurance Enterprises." However, FAS 60 was adopted when the financial guaranty industry was just beginning. As a result, FAS 60 did not contemplate the specific attributes of financial guaranty insurance as distinct from other forms of insurance. In particular, financial guaranty insurance is considered a short-duration insurance product, however, it has features that are more akin to long-duration contracts in that the term of some insured obligations can be as long as 30 years or more and the contracts are generally irrevocable. Under FAS 60, accounting for losses differs for short-duration and long-duration contracts. Because of this inconsistency, we also apply FAS 5, "Accounting for Contingencies," in the determination of our loss reserves. Specifically, FAS 5 requires the establishment of reserves when it is probable that a liability has been incurred at the reporting date, but only to the extent the loss can be reasonably estimated. We understand that methods of determining non-specific reserves vary within the financial guaranty industry. FASB is considering additional accounting guidance to address the financial guaranty industry. In connection with its review of certain accounting standards for financial guaranty insurance contracts, the FASB is considering additional accounting guidance to address the financial guaranty insurance industry's loss reserving accounting policies. See "—FASB Financial Guaranty Insurance Review" for further explanation of potential changes.
The financial guaranty insurance policies we issued insure scheduled payments of principal and interest due on various types of financial obligations against a payment default on such payments by the issuers of the obligations. Active surveillance of our insured portfolio tracks the performance of insured obligations from period to period. We establish loss and LAE reserves based on surveillance group reports, the latest available industry data, and analysis of historical default and recovery experience for the relevant sectors of the fixed-income market. Together the case reserves and non-specific reserves represent management's estimate of incurred losses on our non-derivative insured portfolio exposures.
Case specific reserves are those obligations identified as currently or likely to be in default, and represent the present value, discounted at the U.S. Treasury Note rate applicable to the term of the underlying insured obligations, of the expected LAE payments, net of estimated recoveries (under salvage and subrogation rights). Gross case-specific reserves, net of salvage, were $18.2 million and $17.7 million as of June 30, 2006 and December 31, 2005, respectively. We take into account a number of variables that depend primarily on the nature of the underlying insured obligation when we establish case specific reserves for individual policies. These variables include the nature and creditworthiness of the underlying issuer of the insured obligation, whether the obligation is secured or unsecured and the expected recovery rates on the insured obligation, the projected cash flow or market value of any assets that support the insured obligation and the historical and projected loss rates on such assets. The state of the economy, rates of inflation and the salvage values of specific collateral, among other factors, may affect the actual ultimate realized losses for any policy. We do not believe that changes to these factors would materially change the amount of our case basis loss reserves, with the exception of significant changes in salvage values of specific collateral. However, we do not believe that significant changes in salvage values of specific collateral are reasonably likely to occur. Additionally, case reserves are continually reviewed to ensure that they incorporate all relevant current facts and circumstances.
44
Beginning in 2004, the non-specific reserve is derived from the calculation of expected loss, which we estimate using a Monte Carlo simulation. A Monte Carlo simulation is a technique that is commonly used to estimate the probability of certain mathematical outcomes. It randomly selects values to create scenarios of outcomes and this random selection process is repeated many times to create multiple scenarios. Each time a value is randomly selected, it forms one possible scenario and outcome. Together, these scenarios give a range of possible outcomes, some of which are more probable and some less probable. By definition, the average solution will give the most likely potential outcome. Our risk management area typically runs at least 100,000 trials in order to determine future expected losses. The model uses the current ratings and default frequency (net of recovery) applied to each transaction with outstanding exposure to determine the expected probability distribution of loss. Default frequency and recovery amounts are published periodically by each of the major rating agencies. From the model output, we can estimate a range of expected loss. The amount of non-specific reserve recorded in the financial statements is based on the loss ratio resulting from the calculation of total losses, including past incurred losses and expected future losses divided by premium. For this purpose, premium is defined as total written premium to date plus future installment premium on closed transactions. This derived loss ratio is applied to total earned premiums to date. Case specific reserves are subtracted from this amount to arrive at net non-specific reserves. The table below shows our case and non-specific reserves as of June 30, 2006 and December 31, 2005.
| | June 30, | December 31, | ||||
|---|---|---|---|---|---|---|
| | 2006 | 2005 | ||||
| | (in thousands) | |||||
| Case specific reserves | $ | 18,207 | $ | 17,672 | ||
| Non-specific reserves | 19,037 | 16,634 | ||||
| Total | $ | 37,244 | $ | 34,306 | ||
Prior to 2004, non-specific reserves were established on non-derivative financial guaranty business using a constant loss ratio factor as opposed to a derived loss ratio factor. The constant loss factor was determined based upon an independent rating agency study of historical corporate and municipal defaults rates and our portfolio characteristics and history. The methodology change in 2004 resulted in a change in our accounting estimate of these reserves.
Our total loss reserves of $37.2 million at June 30, 2006 represented a small fraction of our outstanding non-derivative net debt service insured of $11,875 million. However, management believes that these reserves are adequate to cover ultimate net losses.
FASB Financial Guaranty Insurance Review. In January and February 2005, the SEC staff discussed with several financial guaranty industry participants the differences in loss reserve recognition practices in the industry. In June 2005, at the request of the SEC, the FASB added a project to their agenda to review and codify accounting standards for financial guaranty insurance contracts as they relate to loss reserving policies and later added a review of accounting policies in the financial guaranty insurance industry as they relate to premium recognition and deferred policy acquisition costs. Proposed guidance is expected to be issued by the FASB later in 2006 and final guidance is expected to be issued in 2007. When the FASB reaches a conclusion, we and the financial guaranty insurance industry may have to change certain aspects of our, and the industry's, relevant accounting policies. We cannot predict how the FASB will resolve this issue or the resulting impact on our financial statements. The impact, however, could be material. Until the issue is resolved, we will continue to apply our existing accounting policies as disclosed in our audited financial statements as of December 31, 2005 and 2004 and for the years ended December 31, 2005, 2004 and 2003. We believe that any new guidance would principally impact our Municipal Finance business.
Investments. The components of our investment portfolio are the fixed maturity securities of ACA Financial Guaranty and our CDO investments. As per FAS 115, management determines the
45
appropriate classification of these securities at the time of purchase. As of December 31, 2005 and 2004, all investments in fixed maturity securities were designated as available-for-sale and were carried at fair value. Unrealized gains and losses, the difference between fair value and amortized cost of available for sale securities, are included in the accumulated other comprehensive income component of stockholders' equity, net of applicable deferred income tax. The fair values of these securities are based on independent market quotations or, when such quotations are not readily available because the securities are infrequently traded in the public market, from internal valuation models. The valuation results from these models could differ materially from amounts realizable in an open market sale or exchange.
Bond discounts and premiums are amortized over the remaining terms of the securities using the effective-yield method. Investment income is recorded as earned. For mortgaged-backed securities and any other holdings for which there is prepayment risk, prepayment assumptions are evaluated at least annually and revised as necessary. Any adjustments required due to the resulting change in effective yields and maturities are recognized currently in our statement of operations.
Realized gains and losses on the sale of investments are determined on the basis of specific identification and are included in net income. Additionally, we regularly monitor investments where fair value is less than amortized cost in order to assess whether such a decline in value is other than temporary and, therefore, should be reflected as a realized loss in net income. Our process for this involves the consideration of several factors. These factors include (i) the duration of a significant decline in value, (ii) the liquidity, business prospects and overall financial condition of the issuer, (iii) the magnitude of the decline, (iv) the collateral structure and other credit support, as applicable, (v) our intent and ability to hold the investment until the values recover, and (vi) for asset backed securities, the estimated cash flows. When the analysis of the above factors results in a conclusion that a decline in fair values is other than temporary, the cost of the security is written down to fair value as of the reporting date and any previously unrealized loss is realized in the period such a determination is made. This adjustment is recorded as realized losses in our statement of operations. As of June 30, 2006, we determined that unrealized losses on our investments were attributable to changes in interest rates and not credit quality and that we have the ability and intent to hold the investments until a recovery of fair value, which may be maturity. This assessment requires management to exercise judgment as to whether an investment is impaired based on market conditions and trends and the financial condition of the issuer.
Consolidation of Variable Interest Entities (VIEs) and Other Restricted Investments. From an accounting perspective, funded and partially funded CDOs are deemed to be issued out of VIEs. As such, each time a CDO is formed that includes the issuance of debt instruments to third parties and the purchase of investment assets, we perform an analysis to determine whether we are the primary beneficiary and thus required to consolidate the CDO under the provisions of FIN 46(R). Prior to 2005, we retained all or most of the equity position in our CDOs, and these CDOs are therefore consolidated in our financial statements (a total of seven CDOs are consolidated). Although the VIE is consolidated, we do not have the right to use the assets of the VIE for general operations and the debt liabilities of the VIE are without recourse to any assets other than those of the VIE. Our investment exposure to our CDOs is therefore limited to our equity investment, which is a first loss position of the CDO. In the instances that we own less than 100% of the CDO VIE's equity, but are the primary beneficiary and thus consolidate the CDO VIE, we establish minority interests for the unowned portion. Total non-recourse debt of the CDOs included on our balance sheet at June 30, 2006 and December 31, 2005 were $4.8 billion and $4.8 billion, respectively. Fixed maturity securities, a guaranteed investment contract and cash related to consolidated CDOs included on our balance sheet at June 30, 2006 and December 31, 2005 were $5.0 billion and $5.1 billion, respectively.
Beginning in 2005, we have retained a lesser share of the equity position of our newly issued CDOs. Based on analyses under FIN 46(R), we are not deemed to be the primary beneficiary of these
46
VIEs. As a result, these CDOs are not consolidated in our financial statements. Rather, our non-majority investment is recorded as an investment in a single fixed maturity security under the provisions of FAS 115 and EITF 99-20. During the first six months of 2006, we closed three CDOs and purchased an equity interest in two. During 2005, we closed five CDOs and purchased equity interests in four of the five CDOs. We were not determined to be the primary beneficiary in any of these CDOs and therefore do not consolidate them.
In the second quarter of 2006, we closed our credit opportunity fund (credit fund) in the amount of $25 million. The credit fund was created to leverage our expertise in the capital and credit markets and as an asset manager. The credit fund invests in fixed maturity securities, particularly in the asset-backed sector. The credit fund had assets under management of $25.0 million as of June 30, 2006, of which we invested $16.4 million and third party investors invested the remaining $8.6 million. In addition to receiving a return on our investment in the credit fund, we are paid a management fee to select and manage the assets. Although the credit fund is consolidated, we do not have the right to use the assets for general operations. See "—Results by Business Line—Structured Credit."
47
RESULTS OF OPERATIONS
Summary of Consolidated Results
The following table presents highlights of our consolidated financial results for the years ended December 31, 2005, 2004 and 2003 and the six months ended June 30, 2006 and 2005.
| | Six Months Ended June 30, | Year Ended December 31, | ||||||||||||||||
|---|---|---|---|---|---|---|---|---|---|---|---|---|---|---|---|---|---|---|
| | 2006 | 2005 | 2005 | 2004 | 2003 | |||||||||||||
| | (in thousands) | |||||||||||||||||
| REVENUES: | ||||||||||||||||||
| Gross premiums written | $ | 20,515 | $ | 17,805 | $ | 41,280 | $ | 44,570 | $ | 60,981 | ||||||||
| Less premiums ceded | (186 | ) | 766 | 638 | 911 | (3,465 | ) | |||||||||||
| Net premiums written | 20,329 | 18,571 | 41,918 | 45,481 | 57,516 | |||||||||||||
| Increase in unearned premium reserve—net | (6,972 | ) | (2,350 | ) | (8,575 | ) | (15,648 | ) | (38,720 | ) | ||||||||
| Premiums earned | 13,357 | 16,221 | 33,343 | 29,833 | 18,796 | |||||||||||||
| Net insured credit swap revenue | 22,111 | 4,543 | 21,571 | 16,018 | 6,841 | |||||||||||||
| Net investment income | 160,164 | 114,474 | 254,591 | 126,170 | 52,868 | |||||||||||||
| Net realized gains (losses) on investments | (3,223 | ) | (1,223 | ) | (2,777 | ) | (6,547 | ) | 3,188 | |||||||||
| Net realized and unrealized gains on derivative instruments | 6,139 | 4,040 | 8,410 | 6,520 | 9,124 | |||||||||||||
| Other net credit swap revenue | 5,544 | 2,524 | 4,157 | 10,990 | 12,121 | |||||||||||||
| Fee income | 11,073 | 4,366 | 11,110 | 6,091 | 8,898 | |||||||||||||
| Other income | 104 | 295 | 189 | 3,937 | 423 | |||||||||||||
| Total revenues | 215,269 | 145,240 | 330,594 | 193,012 | 112,259 | |||||||||||||
EXPENSES: | ||||||||||||||||||
| Loss and loss adjustment expenses | 3,682 | 4,139 | 14,038 | 46,590 | 3,168 | |||||||||||||
| Policy acquisition costs | 4,160 | 3,984 | 8,652 | 3,835 | 4,077 | |||||||||||||
| Other operating expenses | 23,294 | 14,669 | 37,443 | 38,645 | 29,466 | |||||||||||||
| Interest expense | 137,383 | 95,504 | 214,313 | 101,137 | 39,260 | |||||||||||||
| Depreciation and amortization | 4,717 | 4,064 | 8,583 | 6,935 | 4,115 | |||||||||||||
| Total expenses | 173,236 | 122,360 | 283,029 | 197,142 | 80,086 | |||||||||||||
| (Income) loss of minority interest | (2,229 | ) | (1,685 | ) | (3,708 | ) | 476 | — | ||||||||||
| Income (loss) before income tax expense | 39,804 | 21,195 | 43,857 | (3,654 | ) | 32,173 | ||||||||||||
| Provision for income tax expense | 13,615 | 8,078 | 15,097 | 135 | 12,206 | |||||||||||||
| Net income (loss) | $ | 26,189 | $ | 13,117 | $ | 28,760 | $ | (3,789 | ) | $ | 19,967 | |||||||
Total Revenues and Total Expenses
Total revenues for the six months ended June 30, 2006 were $215.3 million compared with $145.2 million for the same period in 2005, a $70.1 million increase. The growth in total revenues was primarily due to increases in investment income as a result of the impact of rising short-term interest rates, an increase in insured credit swap premiums received in our Structured Credit line of business attributable to our growing volume of business in this area and fee income in our CDO Asset Management line of business as a result of increased assets under management and the increase in deals closed in 2006 to date compared to the same period in 2005. Total expenses for the six months ended June 30, 2006 were $173.2 million compared with $122.4 million for the same period in 2005, a $50.8 million increase. This increase was primarily due to a corresponding increase in interest expense and an increase in other operating expenses commensurate with the growth of our Structured Credit and CDO Asset Management lines of business. Net income for the six months ended June 30, 2006 was $26.2 million compared to $13.1 million for the same period in 2005, an increase of $13.1 million.
48
Total revenues for 2005 were $330.6 million compared with $193.0 million in 2004, a $137.6 million increase. The growth in total revenues was primarily due to increases in insured credit swap premiums received from Structured Credit transactions and investment income. Insured credit swap premiums increased as a result of our growing book of Structured Credit business while premiums earned increased in our Municipal Finance business. Investment income increased in 2005 compared to 2004 primarily as a result of the full year effect of earnings on consolidated CDO assets added in the fourth quarter of 2004 and the impact of rising short-term interest rates. Total expenses for 2005 were $283.0 million compared with $197.1 million in 2004, an $85.9 million increase. This increase was primarily due to an increase in interest expense partially offset by improved loss experience. The majority of the increase in interest expense was related to full year effect of payments on consolidated CDO liabilities added in the fourth quarter of 2004 and an additional $20.6 million of trust preferred debt issued by us in December 2004. Net income for 2005 was $28.8 million compared with a net loss of $3.8 million in 2004.
Total revenues for 2004 were $193.0 million compared with $112.3 million in 2003, an $80.7 million increase. The growth in total revenues was primarily due to increases in Structured Credit insured credit swap premiums received and investment income. Total expenses for 2004 were $197.1 million compared with $80.1 million in 2003, a $117.0 million increase. This increase was primarily due to an increase in interest expense and loss and loss adjustment expenses. The majority of the increase in interest expense was related to the full year effect of payments on consolidated CDO liabilities added in 2003, and additional $41.2 million of debt issued by us in 2003. Increased loss and LAE expenses were the result of adverse loss experience in 2004, the majority of which occurred in the "Other" line of business in which we are no longer active. Net loss for 2004 was $3.8 million compared with net income of $20.0 million in 2003.
Comparison of Six Months Ended June 30, 2006 and June 30, 2005
Gross Premiums Written. Gross premiums written for the six months ended June 30, 2006 were $20.5 million compared with $17.8 million for the same period in 2005, an increase of $2.7 million. The vast majority of the increase came from our Municipal Finance business and was primarily due to the higher volume of transactions completed since June 30, 2005 and was partially offset by decreased premium written in our "Other" businesses. Because we do not use reinsurance extensively, net premiums written of $20.3 million and $18.6 million approximated gross premiums written for the six months ended June 30, 2006 and 2005, respectively.
| | For the six months ended June 30, | |||||||
|---|---|---|---|---|---|---|---|---|
| | 2006 | 2005 | ||||||
| | (in thousands) | |||||||
| Gross premiums written | ||||||||
| Structured Credit | $ | 470 | $ | 1,861 | ||||
| Municipal Finance | 19,383 | 12,696 | ||||||
| Other | 662 | 3,248 | ||||||
| Total gross premiums written | $ | 20,515 | $ | 17,805 | ||||
Premiums Earned. Premiums earned for the six months ended June 30, 2006 were $13.4 million compared with $16.2 million for the six months ended June 30, 2005, a decrease of $2.8 million. Municipal Finance premiums earned increased $1.4 million due primarily to the increase in refunding activity for the six months ended June 30, 2006 compared to the same period in 2005. Premiums earned from refundings in 2006 were $3.5 million compared to $1.5 million 2005. Premiums earned related to our Structured Credit business decreased as a result of our shift in focus to the insurance of
49
credit swaps in this line of business. We also experienced a decline in premiums earned from transactions classified in Other, which are in run-off.
| | Six months ended June 30, | |||||||
|---|---|---|---|---|---|---|---|---|
| | 2006 | 2005 | ||||||
| | (in thousands) | |||||||
| Premiums earned | ||||||||
| Structured Credit | $ | 506 | $ | 1,771 | ||||
| Municipal Finance | 11,752 | 10,324 | ||||||
| Other | 1,099 | 4,126 | ||||||
| Total premiums earned | $ | 13,357 | $ | 16,221 | ||||
Net Insured Credit Swap Revenue. Net insured credit swap revenue for the six months ended June 30, 2006 was $22.1 million compared with $4.5 million for the six months ended June 30, 2005, an increase of $17.6 million. Our net insured credit swap revenue is the sum of the premium earned on our insured credit swaps, net realized gains (losses) and unrealized gains (losses) resulting from the changes in fair value of these insured credit swaps.
Insured credit swap premiums earned related to our Structured Credit business increased $10.3 million due to an increase in transactions closed in the second half of 2005, the revenue of which was recognized in the six months ended June 30, 2006. Municipal Finance insured credit swap premiums earned were $0.3 million due to the completion of a transaction in the first quarter of 2006 that is in the form of a credit swap.
Unrealized gains (losses) on insured credit swaps for the six months ended June 30, 2006 were a loss of $1.2 million compared to a loss of $5.9 million for the six months ended June 30, 2005, an improvement of $4.7 million. Our net unrealized gains (losses) on insured credit swaps are the result of the change in fair value of our insured credit swaps. For the first six months of 2006 compared to the same period in 2005, a net tightening of credit spreads in the portfolios underlying certain of our transactions caused valuation gains for the insured credit swaps in our Structured Credit business. The insured credit swap transaction completed in our Municipal Finance business in the first quarter of 2006 is in the form of a credit swap and, as a result, is also marked to market. Unrealized losses were also recorded for our synthetic equity transactions in our CDO Asset Management business principally because these transactions are in a net gain position and as they approach maturity, those unrealized gains reverse, resulting in unrealized losses. There are two such insured credit swaps and each will expire by mid-2008.
50
For the six months ended June 30, 2006, we realized gains of approximately $2.0 million in our Structured Credit business as a result of the termination of three insured credit swap transactions. No termination gains or losses were recognized in the first six months of 2005.
| | Six months ended | ||||||||
|---|---|---|---|---|---|---|---|---|---|
| | June 30, 2006 | June 30, 2005 | |||||||
| | (in thousands) | ||||||||
| Insured credit swap premiums earned | |||||||||
| Structured Credit | $ | 18,831 | $ | 8,570 | |||||
| Municipal Finance | 262 | — | |||||||
| CDO Asset Management | 2,189 | 1,895 | |||||||
| Total insured credit swap premiums earned | 21,282 | 10,465 | |||||||
| Unrealized gains (losses) on insured credit swaps | |||||||||
| Structured Credit | (401 | ) | (5,702 | ) | |||||
| Municipal Finance | 370 | — | |||||||
| CDO Asset Management | (1,149 | ) | (220 | ) | |||||
| Total unrealized gains (losses) on insured credit swaps | (1,180 | ) | (5,922 | ) | |||||
| Realized gains (losses) on insured credit swaps | |||||||||
| Structured Credit | 2,009 | — | |||||||
| Municipal Finance | — | — | |||||||
| CDO Asset Management | — | — | |||||||
| Total realized gains (losses) on insured credit swaps | 2,009 | — | |||||||
| Net insured credit swap revenue | |||||||||
| Structured Credit | 20,439 | 2,868 | |||||||
| Municipal Finance | 632 | — | |||||||
| CDO Asset Management | 1,040 | 1,675 | |||||||
| Total net insured credit swap revenue | $ | 22,111 | $ | 4,543 | |||||
Net Investment Income. Net investment income for the six months ended June 30, 2006 was $160.2 million compared with $114.5 million for the six months ended June 30, 2005, an increase of $45.7 million. This increase was primarily due to the impact of rising short-term interest rates, namely one and three month LIBOR. We experienced a similar increase in interest expense. We earned $147.9 million of investment income for the six months ended June 30, 2006 on consolidated CDO assets as compared with $104.9 million for the six months ended June 30, 2005. The balance of our net investment income, $12.3 million in the six months ended June 30, 2006 and $9.6 million in the same period in 2005, consisted of interest on fixed-income securities and cash equivalents primarily in our ACA Financial Guaranty investment portfolio net of investment expenses. For the six months ended June 30, 2006, the effective yield, defined as investment income divided by average invested assets, on our non-CDO investment portfolio increased to 4.6% from 3.8% for the same period in 2005. Net
51
investment income is recorded net of investment management, accounting and custody fees of $0.5 million and $0.6 million for the six months ended June 30, 2006 and 2005, respectively.
| | Six months ended June 30, | ||||||||
|---|---|---|---|---|---|---|---|---|---|
| | 2006 | 2005 | |||||||
| | (in thousands) | ||||||||
| Net investment income | |||||||||
| Investment income—non-VIE | $ | 12,784 | $ | 10,168 | |||||
| Investment income—VIE | 147,925 | 104,945 | |||||||
| Total investment income | 160,709 | 115,113 | |||||||
| Investment expenses | (545 | ) | (639 | ) | |||||
| Total net investment income | $ | 160,164 | $ | 114,474 | |||||
Net Realized and Unrealized Gains (Losses) on Investments. Net realized losses on investments for the six months ended June 30, 2006 were $3.2 million compared with $1.2 million for the six months ended June 30, 2005, an increase of $2.0 million. Our net realized loss for the six months ended June 30, 2006 was primarily the result of a sector reallocation of bonds within our ACA Financial Guaranty portfolio and impairments in our consolidated CDOs. We realized net losses on the sale of securities of $1.3 million for the six months ended June 30, 2006 and net losses of $0.3 million for the same period in 2005. Other than temporary impairments, or OTTI, totaled $1.9 million for the six months ended June 30, 2006 and $0.9 million for the same period in 2005 and was entirely attributable to our consolidated CDOs.
| | Six months ended June 30, | ||||||||
|---|---|---|---|---|---|---|---|---|---|
| | 2006 | 2005 | |||||||
| | (in thousands) | ||||||||
| Net realized gains (losses) on investments | |||||||||
| VIE Portfolio | |||||||||
| Other than temporary impairments | $ | (1,861 | ) | $ | (934 | ) | |||
| Net realized losses on sales | (84 | ) | 34 | ||||||
| Net realized losses | (1,945 | ) | (900 | ) | |||||
Non-VIE Portfolio | |||||||||
| Net realized gains (losses) on sales | (1,258 | ) | (323 | ) | |||||
| Net unrealized losses | (20 | ) | — | ||||||
| Total net realized and unrealized gains (losses) | $ | (3,223 | ) | $ | (1,223 | ) | |||
Net Realized and Unrealized Gains (Losses) on Derivative Instruments. Net realized and unrealized gains (losses) on derivative instruments for the six months ended June 30, 2006 were a gain of $6.1 million compared to a gain of $4.0 million for the six months ended June 30, 2005, an increase of $2.1 million. Our net unrealized gains (losses) on derivatives are the result of the fair market valuation of derivative contracts related to our CDO Asset Management business, namely interest rate swaps and interest rate caps.
52
Each six month period included gains on our interest rate swaps, as higher rates positively impact the fair value of these swaps.
| | Six months ended June 30, | |||||||||
|---|---|---|---|---|---|---|---|---|---|---|
| | 2006 | 2005 | ||||||||
| | (in thousands) | |||||||||
| CDO Asset Management | ||||||||||
| Unrealized: | ||||||||||
| Interest rate swaps | $ | 5,670 | $ | 4,670 | ||||||
| Interest rate caps | 469 | (630 | ) | |||||||
| Total unrealized | $ | 6,139 | $ | 4,040 | ||||||
| Net unrealized and realized gains on derivatives—CDO Asset Management | $ | 6,139 | $ | 4,040 | ||||||
Other Net Credit Swap Revenue. Other net credit swap revenue for the six months ended June 30, 2006 was $5.5 million compared with $2.5 million for the six months ended June 30, 2005, an increase of $3.0 million. Approximately $5.3 million of this revenue was credit swap fees from a partially funded consolidated CDS CDO, in which the underlying instruments are credit swaps sold by the CDO to third parties. The 2006 increase came from distributions to the equity holders of two synthetic CDOs, totaling approximately $1.6 million. No comparable distributions to equity holders were made in 2005. Other net credit swap revenue also includes realized and unrealized gains and losses associated with these credit swaps.
| | Six months ended June 30, | |||||||
|---|---|---|---|---|---|---|---|---|
| | 2006 | 2005 | ||||||
| | (in thousands) | |||||||
| Other net credit swap revenue | ||||||||
| Credit swap fees | $ | 5,253 | $ | 3,530 | ||||
| Realized gains (losses) on credit swaps | — | — | ||||||
| Unrealized gains (losses) on credit swaps | 291 | (1,006 | ) | |||||
| Total other net credit swap revenue | $ | 5,544 | $ | 2,524 | ||||
Fee Income. Fee income is generally received and earned on a quarterly basis. Fee income for the six months ended June 30, 2006 was $11.1 million compared with $4.4 million for the six months ended June 30, 2005, an increase of $6.7 million. This increase was primarily the result of increased asset management, structuring and warehousing fees related to our structuring and management of five CDOs completed in 2005 and three CDOs completed in the first six months of 2006. Asset management fees and structuring fees, and fees earned from managing assets during the warehouse period, are recognized when services are rendered as fee income in our consolidated results and are the primary factor contributing to the 2006 increase in our asset management fees of $3.7 million. Warehousing fees are the result of selecting and managing assets in the warehouse phase of the CDO. We receive structuring fees for our role in structuring the CDO. Other fee income is a result of our collection of fees in connection with waivers and consents granted to municipal bond obligors as well as to reimburse us for costs incurred in connection with our insuring municipal secondary market
53
transactions, primarily rating agency costs, and other miscellaneous fees. We recognize these fees as fee income and the associated costs as other operating expenses when the transaction closes.
| | Six months ended June 30, | ||||||
|---|---|---|---|---|---|---|---|
| | 2006 | 2005 | |||||
| | (in thousands) | ||||||
| Fee income | |||||||
| Asset management fees | $ | 5,705 | $ | 2,042 | |||
| Warehousing fees | 2,974 | 1,142 | |||||
| Structuring fees | 2,273 | 1,177 | |||||
| Other | 121 | 5 | |||||
| Total fee income | $ | 11,073 | $ | 4,366 | |||
Provision for Loss and Loss Adjustment Expenses. Provision for loss and LAE for the six months ended June 30, 2006 was $3.7 million compared with $4.1 million for the six months ended June 30, 2005, a decrease of $0.4 million. This decrease is attributable to a decrease in "Other" reserves, commensurate with the run-off of this business.
| | Six months ended June 30, | |||||||
|---|---|---|---|---|---|---|---|---|
| | 2006 | 2005 | ||||||
| | (in thousands) | |||||||
| Beginning: reserve for loss and LAE, net of reinsurance | $ | 34,306 | $ | 36,006 | ||||
| Add: provision for case losses | 1,279 | 2,113 | ||||||
| Add: provision for general reserve | 2,403 | 2,026 | ||||||
| Total provision for loss and LAE | 3,682 | 4,139 | ||||||
| Less: paid losses | 744 | 13,023 | ||||||
| Reserve for loss and LAE, net of reinsurance | 37,244 | 27,122 | ||||||
| Reinsurance recoverable on unpaid losses | — | — | ||||||
| End: reserve for loss and LAE, gross of reinsurance | $ | 37,244 | $ | 27,122 | ||||
Policy Acquisition Costs. Policy acquisition costs for the six months ended June 30, 2006 were $4.2 million compared with $4.0 million for the six months ended June 30, 2005, an increase of $0.2 million. This increase is consistent with the increase in municipal finance premiums earned.
Other Operating Expenses. Other operating expenses for the six months ended June 30, 2006 were $23.3 million compared with $14.7 million for the six months ended June 30, 2005, an increase of $8.6 million. This change results primarily from an increase in 2006 in employee compensation, benefits and premium taxes. Employee compensation and benefits increased in 2006 due to an increase in our workforce to support our growing lines of business and an increase in incentive compensation on the expectation that certain 2006 performance targets will be achieved. The increase in premium taxes is a result of increased premiums written compared to 2005.
Interest Expense. Interest expense for the six months ended June 30, 2006 was $137.4 million compared with $95.5 million for the six months ended June 30, 2005, an increase of $41.9 million. This
54
increase was a result of rising short-term interest rates. We experienced a similar increase in investment income.
| | Six months ended June 30, | ||||||
|---|---|---|---|---|---|---|---|
| | 2006 | 2005 | |||||
| | (in thousands) | ||||||
| Interest expense | |||||||
| Corporate debt | $ | 3,459 | $ | 2,681 | |||
| CDO debt—operating | 3,617 | 3,133 | |||||
| CDO debt—non-recourse | 130,307 | 89,690 | |||||
| Total interest expense | $ | 137,383 | $ | 95,504 | |||
Depreciation and Amortization. Depreciation and amortization expenses for the six months ended June 30, 2006 were $4.7 million compared with $4.1 million for the six months ended June 30, 2005, an increase of $0.6 million. This increase was primarily the result of increased amortization expense related to capitalized debt issuance costs.
Provision for Income Taxes. The provision for income taxes for the six months ended June 30, 2006 was $13.6 million compared with $8.1 million for the six months ended June 30, 2005, resulting in an effective tax rate of 34.2% and 38.1%, respectively. The decline in the effective tax rate is due to our strategy to invest a portion of ACA Financial Guaranty's investment portfolio in tax-exempt bonds as well as lower state income tax expense.
Net Income Net income for the six months ended June 30, 2006 was $26.2 million compared with a $13.1 million for the six months ended June 30, 2005, an increase of $13.1 million.
Comparison of Years Ended December 31, 2005 and December 31, 2004
Gross Premiums Written. Gross premiums written for the year ended December 31, 2005 were $41.3 million compared with $44.6 million for the year ended December 31, 2004, a decrease of $3.3 million. The growth of $8.0 million of gross premiums written in our Municipal Finance business in 2005 was driven by increased market acceptance of our insurance product in our target markets due to the completion of our recapitalization following the negative ratings actions in 2004. The decrease in Other is commensurate with our intention to no longer engage in those types of transactions. Because we do not use reinsurance extensively, net premiums written of $41.9 million and $45.5 million approximated gross premiums written for the years ended December 31, 2005 and 2004, respectively.
| | Year ended December 31, | ||||||
|---|---|---|---|---|---|---|---|
| | 2005 | 2004 | |||||
| | (in thousands) | ||||||
| Gross premiums written | |||||||
| Structured Credit | $ | 2,637 | $ | 4,669 | |||
| Municipal Finance | 34,231 | 26,255 | |||||
| Other | 4,412 | 13,646 | |||||
| Total gross premiums written | $ | 41,280 | $ | 44,570 | |||
Premiums Earned. Premiums earned for the year ended December 31, 2005 were $33.3 million compared with $29.8 million for the year ended December 31, 2004, an increase of $3.5 million. Municipal Finance premiums earned increased $10.0 million due primarily to the increase in recognition of premiums written during 2004 and the acceleration of premiums earned as a result of
55
several refundings, which totaled $6.6 million for the year ended December 31, 2005 and $1.8 million for the year ended December 31, 2004.
| | Year ended December 31, | ||||||
|---|---|---|---|---|---|---|---|
| | 2005 | 2004 | |||||
| | (in thousands) | ||||||
| Premiums earned | |||||||
| Structured Credit | $ | 2,548 | $ | 6,161 | |||
| Municipal Finance | 23,889 | 13,930 | |||||
| Other | 6,906 | 9,742 | |||||
| Total premiums earned | $ | 33,343 | $ | 29,833 | |||
Net Insured Credit Swap Revenue. Net insured credit swap revenue for the year ended December 31, 2005 was $21.6 million compared with $16.0 million for the year ended December 31, 2004, an increase of $5.6 million. Our net insured credit swap revenue is the sum of the premium earned on our insured credit swaps, net realized gains (losses) and unrealized gains (losses) resulting from the fair market valuation of these insured credit swaps.
Insured credit swap premiums earned related to our Structured Credit business increased $16.7 million due to the increased number of transactions completed in 2005 as a result of increases in available credit from existing counterparties and the addition of new counterparties as well as premium received on a full year basis for those contracts originated during 2004. We added eight new Structured Credit counterparties in 2005, for a total of 21 counterparties as of December 31, 2005.
Unrealized gains (losses) on insured credit swaps for the year ended December 31, 2005 were a loss of $5.7 million compared to a gain of $6.2 million for the year ended December 31, 2004, a decrease of $11.9 million. Our net unrealized gains (losses) on insured credit swaps were the result of changes in the fair market valuation of our insured credit swaps during the year. In 2005, a net widening of credit spreads in the portfolios underlying certain of our transactions caused valuation losses for both our Structured Credit business and two synthetic CDO equity investments, in the form of insured credit swaps. In 2004, we recognized decreases in the valuation of our portfolio of Structured Credit transactions. In 2004 we recognized valuation gains with respect to our synthetic equity participations in our CDO Asset Management business related to a general tightening of credit spreads within those portfolios.
56
| | Year ended December 31, | ||||||||
|---|---|---|---|---|---|---|---|---|---|
| | 2005 | 2004 | |||||||
| | (in thousands) | ||||||||
| Insured credit swap premiums earned | |||||||||
| Structured Credit | $ | 23,130 | $ | 6,444 | |||||
| Municipal Finance | 13 | — | |||||||
| CDO Asset Management | 4,091 | 3,414 | |||||||
| Total insured credit swap premiums earned | 27,234 | 9,858 | |||||||
Unrealized gains (losses) on insured credit swaps | |||||||||
| Structured Credit | (2,588 | ) | (828 | ) | |||||
| Municipal Finance | — | — | |||||||
| CDO Asset Management | (3,075 | ) | 6,988 | ||||||
| Total unrealized gains (losses) on insured credit swaps | (5,663 | ) | 6,160 | ||||||
| Net insured credit swap revenue | |||||||||
| Structured Credit | 20,542 | 5,617 | |||||||
| Municipal Finance | 13 | — | |||||||
| CDO Asset Management | 1,016 | 10,401 | |||||||
| Total net insured credit swap revenue | $ | 21,571 | $ | 16,018 | |||||
Net Investment Income. Net investment income for the year ended December 31, 2005 was $254.6 million compared with $126.2 million for the year ended December 31, 2004, an increase of $128.4 million. This increase was primarily due to the full year effect of earnings on consolidated CDO assets added in the fourth quarter of 2004 and the impact of rising short term interest rates over the course of 2005. We earned $233.9 million of investment income for the year ended December 31, 2005 on consolidated CDO assets as compared with $113.1 million for the year ended December 31, 2004. The balance of our net investment income, $20.7 million in 2005 and $13.1 million in 2004, consisted of interest on fixed-income securities and cash equivalents primarily in our ACA Financial Guaranty investment portfolio. This increase was primarily the result of the increase in invested assets of $75.1 million. In 2005, the effective yield, defined as investment income divided by average invested assets, on our non-CDO investment portfolio increased to 4.1% from 3.4% in 2004. Net investment income is recorded net of investment management, accounting and custody fees of $1.1 million for the year ended December 31, 2005 and $1.4 million for the year ended December 31, 2004.
| | Year ended December 31, | ||||||||
|---|---|---|---|---|---|---|---|---|---|
| | 2005 | 2004 | |||||||
| | (in thousands) | ||||||||
| Net investment income | |||||||||
| Investment income—non-VIE | $ | 21,827 | $ | 14,475 | |||||
| Investment income—VIE | 233,902 | 113,080 | |||||||
| Total investment income | 255,729 | 127,555 | |||||||
| Investment expenses | (1,138 | ) | (1,385 | ) | |||||
| Total net investment income | $ | 254,591 | $ | 126,170 | |||||
Net Realized Gains (Losses) on Investments. Net realized losses on investments for the year ended December 31, 2005 were $2.8 million compared with $6.5 million for the year ended December 31, 2004, a decrease of $3.7 million. Our net realized loss for the year ended December 31, 2005 was primarily the result of impairments in our consolidated CDOs and, to a lesser extent, in the investment
57
portfolio of ACA Financial Guaranty. Other than temporary impairments, or OTTI, totaled $2.5 million in 2005 and $7.4 million in 2004. We realized net losses on the sale of securities of $0.3 million in 2005 and net gains of $0.8 million in 2004.
| | Year ended December 31, | ||||||||
|---|---|---|---|---|---|---|---|---|---|
| | 2005 | 2004 | |||||||
| | (in thousands) | ||||||||
| Net realized gains (losses) on investments | |||||||||
| VIE Portfolio | |||||||||
| Other than temporary impairments | $ | (1,949 | ) | $ | (6,870 | ) | |||
| Net realized gains (losses) on sales | 55 | 567 | |||||||
| Net realized gains (losses) | (1,894 | ) | (6,303 | ) | |||||
Non-VIE Portfolio | |||||||||
| Other than temporary impairments | (546 | ) | (535 | ) | |||||
| Net realized gains (losses) on sales | (337 | ) | 291 | ||||||
| Net realized gains (losses) | (883 | ) | (244 | ) | |||||
Total net realized gains (losses) | $ | (2,777 | ) | $ | (6,547 | ) | |||
Net Realized and Unrealized Gains on Derivative Instruments. Net realized and unrealized gains on derivative instruments for the year ended December 31, 2005 were a gain of $8.4 million compared to a gain of $6.5 million for the year ended December 31, 2004, an increase of $1.9 million. Our net unrealized gains (losses) on derivatives are the result of the fair market valuation of derivative contracts related to our CDO Asset Management business, namely interest rate swaps, interest rate caps and, prior to 2005, warehouse facility forward purchase commitments.
Higher interest rates caused valuation gains on our interest rate swaps. A substantial portion of our unrealized gains result from interest rate swaps included in our consolidated CDOs. Although these swaps act as hedges economically, we were not able to account for them as cash flow hedges due to the contemporaneous documentation requirement of FAS 133. As a result, all mark to market activity flowed through our statement of operations for the first half of 2005 and all of 2004. Effective July 1, 2005, we properly designated the swaps as cash flow hedges, which means that a significant portion of the mark to market adjustment after that date is recorded to accumulated other comprehensive income.
Rising interest rates in 2004 caused valuation gains on our interest rate swaps and caps. The $0.6 million realized loss on warehouse facilities primarily resulted from the termination of warehouse arrangements when we closed two consolidated CDOs in 2004. This realized loss is the result of lower net asset market values at the time that these CDOs closed relative to the acquisition values at which
58
they were placed into the warehouse facility, while the unrealized loss of $0.6 million on warehouse facilities was based on the change in the valuation of warehoused assets prior to closing.
| | Year ended December 31, | |||||||||
|---|---|---|---|---|---|---|---|---|---|---|
| | 2005 | 2004 | ||||||||
| | (in thousands) | |||||||||
| Net realized and unrealized gains (losses) on derivatives | ||||||||||
| CDO Asset Management | ||||||||||
| Unrealized: | ||||||||||
| Interest rate swaps | $ | 8,730 | $ | 8,736 | ||||||
| Interest rate caps | (320 | ) | (975 | ) | ||||||
| Warehouse facilities (asset forward purchase commitments) | — | (646 | ) | |||||||
| Total unrealized | 8,410 | 7,115 | ||||||||
| Realized: | ||||||||||
| Warehouse facilities (asset forward purchase commitments) | — | (595 | ) | |||||||
| Total realized | — | (595 | ) | |||||||
| Net unrealized and realized gains on derivatives—CDO Asset Management | $ | 8,410 | $ | 6,520 | ||||||
Other Net Credit Swap Revenue. Other net credit swap revenue for the year ended December 31, 2005 was $4.2 million compared with $11.0 million for the year ended December 31, 2004, a decrease of $6.8 million. Approximately $8.6 million and $8.8 million of this revenue for the years ended December 31, 2005 and 2004, respectively, was credit swap fees from a partially funded consolidated CDS CDO in which the underlying instruments are credit swaps sold by the CDO to third parties. Other net credit swap revenue also includes realized and unrealized gains and losses associated with these credit swaps. The realized loss of $3.3 million in 2005 was a result of a credit event under a single credit swap included in our partially funded consolidated CDS CDO.
| | Year ended December 31, | ||||||
|---|---|---|---|---|---|---|---|
| | 2005 | 2004 | |||||
| | (in thousands) | ||||||
| Other net credit swap revenue | |||||||
| Credit swap fees | $ | 8,623 | $ | 8,830 | |||
| Realized gains (losses) on credit swaps | (3,295 | ) | — | ||||
| Unrealized gains (losses) on credit swaps | (1,171 | ) | 2,160 | ||||
| Total other net credit swap revenue | $ | 4,157 | $ | 10,990 | |||
Fee Income. Fee income is generally received and earned on a quarterly basis. Fee income for the year ended December 31, 2005 was $11.1 million compared with $6.1 million for the year ended December 31, 2004, an increase of $5.0 million. This increase was primarily the result of increased asset management, structuring and warehousing fees related to our structuring and management of five CDOs completed in 2005. Asset management fees and structuring fees, including fees earned from managing assets during the warehouse period, are recognized when services are rendered. In 2005, the four new CDOs we closed in which we purchased equity interests are not consolidated because we own only a small percentage of the equity in each of these CDOs, and as a result we are not deemed to be the primary beneficiary under FIN 46(R). Because we are not deemed to be the primary beneficiary, asset management fees for these unconsolidated CDOs are reflected as fee income in our consolidated results and are the primary factor contributing to the 2005 increase in our asset management fees of $3.0 million. Warehousing fees are the result of selecting and managing assets in the warehouse phase of the CDO. We receive structuring fees for our role in structuring the CDO. Other fee income is a
59
result of our collection of fees in connection with waivers and consents granted to municipal bond obligors as well as to reimburse us for costs incurred in connection with our insuring municipal secondary market transactions, primarily rating agency costs, and other miscellaneous fees. We recognize these fees as fee income and the associated costs as other operating expenses when the transaction closes.
| | Year ended December 31, | ||||||
|---|---|---|---|---|---|---|---|
| | 2005 | 2004 | |||||
| | (in thousands) | ||||||
| Fee income | |||||||
| Asset management fees | $ | 6,051 | $ | 3,021 | |||
| Warehousing fees | 2,408 | 1,434 | |||||
| Structuring fees | 2,276 | 1,126 | |||||
| Other | 375 | 510 | |||||
| Total fee income | $ | 11,110 | $ | 6,091 | |||
Provision for Loss and Loss Adjustment Expenses. Provision for loss and LAE for the year ended December 31, 2005 was $14.0 million compared with $46.6 million for the year ended December 31, 2004, a decrease of $32.6 million. This was a direct result of a decrease in case specific loss reserves in 2005, partially offset by an increase in non-specific reserves. Incurred losses for case specific activity for 2005 was $7.7 million compared to $44.7 million for the year ended December 31, 2004. Non-specific reserves for the year ended December 31, 2005 increased $6.3 million as compared with $1.9 million for the year ended December 31, 2004. The case specific reserve activity in 2005 was related primarily to the additional reserves of $3.4 million, including $1.0 million in accretion, related to a portfolio of insured securitized manufactured housing bonds; in 2004 we recorded an increase in case specific reserves of $20.3 million relating to the same securities. We also recorded losses incurred on our runoff trade credit business in the amount of $3.2 million in 2005. Finally, losses incurred for the Municipal Finance line of business were $1.0 million in 2005, consisting of loss adjustment expenses on several credits as well as the write-off of certain salvage assets.
In 2004 incurred losses for case specific reserves were related to the initial establishment of reserves in connection with a portfolio of securitized manufactured housing bonds. The loss incurred in 2004 for this portfolio of bonds was $20.3 million and was based on an increase in the rate of delinquencies and losses observed in the mortgages underlying each of the related securitizations. 2004 also included $21.0 million in losses incurred and $1.0 million for industry loss warranty and trade credit businesses included in our Other business line. The industry loss warranty losses were excess of loss contracts that had losses related to the effects of extreme hurricane activity in 2004. Losses paid in connection with this business were $10.0 million in 2005 and $11.0 million in 2004. The increase in our non-specific reserve was a direct result of the increase in premiums earned and application of our non-specific loss reserving model, and represents management's estimate of losses on our insured book
60
of business. For a detailed description of how we establish our reserve for losses and LAE see "—Critical Accounting Policies and Estimates" above.
| | Year ended December 31, | |||||||
|---|---|---|---|---|---|---|---|---|
| | 2005 | 2004 | ||||||
| | (in thousands) | |||||||
| Beginning: reserve for loss and LAE, net of reinsurance | $ | 36,006 | $ | 3,812 | ||||
| Add: provision for case losses | 7,726 | 44,641 | ||||||
| Add: provision for general reserve | 6,312 | 1,949 | ||||||
| Total provision for loss and LAE | 14,038 | 46,590 | ||||||
| Less: paid losses | 15,738 | 14,396 | ||||||
| Reserve for loss and LAE, net of reinsurance | 34,306 | 36,006 | ||||||
| Reinsurance recoverable on unpaid losses | — | — | ||||||
| End: reserve for loss and LAE, gross of reinsurance | $ | 34,306 | $ | 36,006 | ||||
Policy Acquisition Costs. Policy acquisition costs for the year ended December 31, 2005 were $8.7 million compared with $3.8 million for the year ended December 31, 2004, an increase of $4.9 million. This increase is consistent with the increase in Municipal Finance premiums earned and the amortization of deferred expenses.
Other Operating Expenses. Other operating expenses for the year ended December 31, 2005 were $37.4 million compared with $38.6 million for the year ended December 31, 2004, a decrease of $1.2 million. This change results from a decrease in general corporate overhead expenses of $7.0 million, owing to the absence of certain legal, accounting and other costs incurred in 2004 in connection with our recapitalization, partially offset by an increase in 2005 of employee compensation, benefits and litigation expenses of $5.9 million. Employee compensation and benefits increased in 2005 due to an increase in our workforce to support our growing lines of business and an increase in incentive compensation due to the achievement of certain performance targets.
Interest Expense. Interest expense for the year ended December 31, 2005 was $214.3 million compared with $101.1 million for the year ended December 31, 2004, an increase of $113.2 million. This increase was a result of the full year effect of payments on consolidated CDO liabilities (CDO debt—non-recourse) added in 2004 as well as rising short-term interest rates throughout the year. Interest expense also included interest expense on debt incurred to finance our CDO equity investments (CDO debt—operating). We had $116.2 million of debt related, directly or indirectly, to the financing of CDO equity. We also had interest on an aggregate of $59.2 million of corporate debt issued in 2002 and 2003 and on $20.6 million of corporate debt issued in December 2004.
| | Year ended December 31, | ||||||
|---|---|---|---|---|---|---|---|
| | 2005 | 2004 | |||||
| | (in thousands) | ||||||
| Interest expense | |||||||
| Corporate debt | $ | 5,735 | $ | 3,305 | |||
| CDO debt—operating | 5,855 | 3,802 | |||||
| CDO debt—non-recourse | 202,723 | 94,030 | |||||
| Total interest expense | $ | 214,313 | $ | 101,137 | |||
Depreciation and Amortization. Depreciation and amortization expenses for the year ended December 31, 2005 were $8.6 million compared with $6.9 million for the year ended December 31,
61
2004, an increase of $1.7 million. This increase was primarily the result of the full year of expense amortization related to the capitalized debt issuance costs of two consolidated CDOs closed in 2004.
Provision for Income Taxes. The provision for income taxes for the year ended December 31, 2005 was $15.1 million compared with $0.1 million for the year ended December 31, 2004, resulting in an effective tax rate of 34.4% and 3.6%, respectively. We incurred tax expense in 2004 in spite of recognizing net losses. This tax expense was the result of operating losses recognized in 2004 at our then Bermuda based holding company which were not deductible for federal income tax purposes because we were not a U.S. taxpayer at that time. We also incurred state tax expense as a result of growth in our CDO asset management business. We re-domesticated our holding company from Bermuda to Delaware, making us a U.S. taxpayer effective September 15, 2004.
Net Income (Loss). Net income for the year ended December 31, 2005 was $28.8 million compared with a net loss of $3.8 million for the year ended December 31, 2004, an increase of $32.6 million.
Comparison of Years Ended December 31, 2004 and December 31, 2003
Gross Premiums Written. Gross premiums written for the year ended December 31, 2004 were $44.6 million compared with $61.0 million for the year ended December 31, 2003, a decrease of $16.4 million. The decrease was primarily related to a decrease of $22.7 million in Municipal Finance gross premiums written. The decrease in our Municipal Finance business was a direct result of the negative ratings actions of S&P and Fitch Ratings with respect to ACA Financial Guaranty's financial strength rating in 2004. The increase in our Other gross premiums written was due to our industry loss warranty and trade credit businesses. Beginning in the second half of 2004, we have not written these types of transactions.
On a net basis, we wrote $45.5 million and $57.5 million of premiums for the years ended 2004 and 2003, respectively. The difference between gross and net premiums written is the amount of premiums ceded or premiums recaptured during the period. For the year ended December 31, 2004, we recaptured Municipal Finance premiums of $3.5 million. We recaptured premiums as a result of the cancellation of three reinsurance arrangements in 2004. The reinsurance provided by this arrangement was no longer required based on our improved capital position. The premiums ceded in 2004 were the purchase of reinsurance protection on our industry loss warranty business, all of which has expired. We are not actively engaged in this insurance product. For the year ended December 31, 2003, we ceded premiums of $3.5 million. In 2003, we ceded premiums under various contractual arrangements with third parties on first loss and excess of loss bases, which were designed to provide protection against unexpected levels of losses. In addition, in 2003 we ceded premiums under reinsurance arrangements when our insured exposure to any single credit exceeded the amount allowed by internal policies, the rating agencies and regulators.
62
| | Year ended December 31, | ||||||
|---|---|---|---|---|---|---|---|
| | 2004 | 2003 | |||||
| | (in thousands) | ||||||
| Gross premiums written | |||||||
| Structured Credit | $ | 4,669 | $ | 5,585 | |||
| Municipal Finance | 26,255 | 48,919 | |||||
| Other | 13,646 | 6,477 | |||||
| Total gross premiums written | $ | 44,570 | $ | 60,981 | |||
Premiums Earned. Premiums earned for the year ended December 31, 2004 were $29.8 million compared with $18.8 million for the year ended December 31, 2003, an increase of $11.0 million. Municipal Finance premiums earned increased $5.1 million in 2004 compared to 2003 due to the increase in recognition of premiums written during 2003 and lower reinsurance cessions for the year ended December 31, 2004. Premiums earned in our Other business increased $4.9 million primarily due to increased industry loss warranty and trade credit business. Beginning in the second half of 2004, we no longer write these types of transactions.
| | For the year ended December 31, | ||||||
|---|---|---|---|---|---|---|---|
| | 2004 | 2003 | |||||
| | (in thousands) | ||||||
| Premiums earned | |||||||
| Structured Credit | $ | 6,161 | $ | 5,171 | |||
| Municipal Finance | 13,930 | 8,795 | |||||
| Other | 9,742 | 4,830 | |||||
| Total premiums earned | $ | 29,833 | $ | 18,796 | |||
Net Insured Credit Swap Revenue. Net insured credit swap revenue for the year ended December 31, 2004 was $16.0 million compared with $6.8 million for the year ended December 31, 2003, an increase of $9.2 million. Our net insured credit swap revenue is the sum of the premium earned on our insured credit swaps, net realized gains (losses) and unrealized gains (losses) resulting from the change in fair value of these insured credit swaps.
Insured credit swap premiums earned related to our Structured Credit business increased $3.5 million due to an increase in number of transactions completed in 2004 as a result of increases in available credit from existing counterparties and the addition of new counterparties, as well as insured credit swap premium earned on a full year basis for those contracts originated during 2003. We added seven new Structured Credit counterparties in 2004, for a total of 14 counterparties as of December 31, 2004.
Unrealized gains (losses) on insured credit swaps for the year ended December 31, 2004 were a gain of $6.2 million compared to a gain of $1.8 million for the year ended December 31, 2003, an increase of $4.7 million. Our net unrealized gains (losses) on insured credit swaps are the result of the change in fair value of our insured credit swaps during the year. In 2004 we recognized decreases in the valuation of our Structured Credit transactions, while in 2003, we recognized valuation gains. In 2004 we recognized valuation gains with respect to our synthetic equity participations, in the form of insured credit swaps, in our CDO Asset Management business. The general tightening of credit spreads caused a portion of the gain. In 2003, valuation gains were recorded for our synthetic CDO equity investments due to the tightening of credit spreads over the course of the year.
63
| | Year ended December 31, | |||||||
|---|---|---|---|---|---|---|---|---|
| | 2004 | 2003 | ||||||
| | (in thousands) | |||||||
| Insured credit swap premiums earned | ||||||||
| Structured Credit | $ | 6,444 | $ | 2,964 | ||||
| Municipal Finance | — | — | ||||||
| CDO Asset Management | 3,414 | 2,076 | ||||||
| Total insured credit swap premiums earned | 9,858 | 5,040 | ||||||
| Unrealized gains (losses) on insured credit swaps | ||||||||
| Structured Credit | (828 | ) | 943 | |||||
| Municipal Finance | — | — | ||||||
| CDO Asset Management | 6,988 | 858 | ||||||
| Total unrealized gains (losses) on insured credit swaps | 6,160 | 1,801 | ||||||
| Net insured credit swap revenue | ||||||||
| Structured Credit | 5,617 | 3,907 | ||||||
| Municipal Finance | — | — | ||||||
| CDO Asset Management | 10,401 | 2,934 | ||||||
| Total net insured credit swap revenue | $ | 16,018 | $ | 6,841 | ||||
Net Investment Income. Net investment income for the year ended December 31, 2004 was $126.2 million compared with $52.9 million for the year ended December 31, 2003, an increase of $73.3 million. This increase was primarily due to the closing of two consolidated CDOs in 2004, coupled with the full year effect of earnings on consolidated CDO assets added with respect to the consolidation of three CDOs closed in 2003 and the impact of rising short term interest rates over the course of 2004. We earned $113.1 million of investment income for the year ended December 31, 2004 on consolidated CDO assets as compared with $42.7 million in 2003. CDO assets under management increased to $7.8 billion at December 31, 2004 from $5.8 billion at December 31, 2003. The balance of our net investment income, $13.1 million in 2004 and $10.2 million in 2003, consisted of interest on fixed-income securities and cash equivalents primarily in ACA Financial Guaranty's investment portfolio. This increase resulted from an increase in invested assets of $152.0 million, which primarily was a direct result of our recapitalization in 2004. The effective yield, defined as investment income divided by average invested assets, on our non-CDO investment portfolio was 3.4% in 2004 and 3.4% in 2003. Net investment income is recorded net of investment management, accounting and custody fees of $1.4 million and $1.4 million for each of the years ended December 31, 2004 and 2003, respectively.
| | Year ended December 31, | ||||||||
|---|---|---|---|---|---|---|---|---|---|
| | 2004 | 2003 | |||||||
| | (in thousands) | ||||||||
| Net investment income | |||||||||
| Investment income—non-VIE | $ | 14,475 | $ | 11,563 | |||||
| Investment income—VIE | 113,080 | 42,664 | |||||||
| Total investment income | 127,555 | 54,227 | |||||||
| Investment expenses | (1,385 | ) | (1,359 | ) | |||||
| Total net investment income | $ | 126,170 | $ | 52,868 | |||||
Net Realized Gains (Losses) on Investments. Net realized losses on investments for the year ended December 31, 2004 were $6.5 million compared with net realized gains of $3.2 million for the year
64
ended December 31, 2003, a decrease of $9.7 million. Our net realized loss for the year ended December 31, 2004 was the result of impairments in our consolidated CDOs and, to a lesser extent, ACA Financial Guaranty's investment portfolio. OTTI totaled $7.4 million in 2004 and $0.8 million in 2003. We realized net gains on the sale of securities of $0.8 million in 2004 and $4.0 million in 2003. Net gains in 2003 were the result of the decision at the time to realize, through sales activity, a portion of the portfolio appreciation that occurred in the invested assets of ACA Financial Guaranty due to steadily declining interest rates throughout the year.
| | Year ended December 31, | ||||||||
|---|---|---|---|---|---|---|---|---|---|
| | 2004 | 2003 | |||||||
| | (in thousands) | ||||||||
| Net realized gains (losses) on investments | |||||||||
| VIE Portfolio | |||||||||
| Other than temporary impairments | $ | (6,870 | ) | $ | (837 | ) | |||
| Net realized gains (losses) on sales | 567 | (661 | ) | ||||||
| Net realized gains (losses) | (6,303 | ) | (1,498 | ) | |||||
Non-VIE Portfolio | |||||||||
| Other than temporary impairments | (535 | ) | — | ||||||
| Net realized gains (losses) on sales | 291 | 4,686 | |||||||
| Net realized gains (losses) | (244 | ) | 4,686 | ||||||
| Total net realized gains (losses) | $ | (6,547 | ) | $ | 3,188 | ||||
Net Realized and Unrealized Gains (Losses) on Derivative Instruments. Net realized and unrealized gains (losses) on derivative instruments for the year ended December 31, 2004 were a gain of $6.5 million compared with a gain of $9.1 million for the year ended December 31, 2003, a decrease of $2.6 million. Our net unrealized gains (losses) on derivatives are the result of the fair market valuation of derivative contracts, including those related to our CDO Asset Management business, namely interest rate swaps, interest rate caps and warehouse facility forward purchase commitments. For these years, net realized gains (losses) were due to the termination of warehouse facilities when certain of our CDOs closed.
Rising interest rates in 2004 caused valuation gains on our interest rate swaps but losses on our interest rate caps in both 2004 and 2003. A substantial portion of the unrealized gain (loss) results from interest rate swaps was included in our consolidated CDOs. Although these swaps act as economic hedges, we were not able to account for them as cash flow hedges due to the contemporaneous documentation requirement of FAS 133. As a result, we had to mark to market such activity, which flowed through our statement of operations for 2004 and 2003. The $0.6 million realized loss on warehouse facilities primarily resulted from the termination of warehouse arrangements when we closed two consolidated CDOs in 2004. This realized loss was the result of lower asset market values at the time that these CDOs closed relative to the acquisition values at which they were placed into the warehouse facility, while the unrealized loss of $0.6 million on warehouse facilities was based on the change in the valuation of warehoused assets as of the end of the year. The $4.3 million gain in 2003 on warehouse facilities primarily resulted from the valuation of warehouse arrangements that existed during the year. This gain was the result of higher asset market values during the warehouse
65
phase relative to the acquisition values of the underlying assets when they were placed into the warehouse facility.
| | Year ended December 31, | |||||||||
|---|---|---|---|---|---|---|---|---|---|---|
| | 2004 | 2003 | ||||||||
| | (in thousands) | |||||||||
| Net realized and unrealized gains (losses) on derivatives | ||||||||||
| CDO Asset Management | ||||||||||
| Unrealized: | ||||||||||
| Interest rate swaps | $ | 8,736 | $ | 4,981 | ||||||
| Interest rate caps | (975 | ) | (167 | ) | ||||||
| Warehouse facilities (asset forward purchase commitments) | (646 | ) | 3,870 | |||||||
| Total unrealized | 7,115 | 8,684 | ||||||||
Realized: | ||||||||||
| Warehouse facilities (asset forward purchase commitments) | (595 | ) | 440 | |||||||
| Total realized | (595 | ) | 440 | |||||||
| Total net realized and unrealized gains (losses on derivatives) | $ | 6,520 | $ | 9,124 | ||||||
Other Net Credit Swap Revenue. Other credit swap revenue for the year ended December 31, 2004 was $11.0 million compared with $12.1 million for the year ended December 31, 2003, a decrease of $1.1 million. This decrease was in part the result of a reduction in the average net spread on the underlying portfolio of credit swaps on our one partially funded consolidated synthetic CDO. Other credit swap revenue also includes net realized and unrealized gains (losses) on the associated credit swaps.
| | Year ended December 31, | ||||||
|---|---|---|---|---|---|---|---|
| | 2004 | 2003 | |||||
| | (in thousands) | ||||||
| Other net credit swap revenue | |||||||
| Credit swap fees | $ | 8,829 | $ | 11,972 | |||
| Realized gains (losses) on credit swaps | — | — | |||||
| Unrealized gains (losses) on credit swaps | 2,161 | 149 | |||||
| Total other net credit swap revenue | $ | 10,990 | $ | 12,121 | |||
Fee Income. Fee income for the year ended December 31, 2004 was $6.1 million compared with $8.9 million for the year ended December 31, 2003, a decrease of $2.8 million. This decrease was primarily driven by the decrease in warehousing fees earned in 2004 as a result of closing two fewer CDOs in 2004 as compared to 2003, partially offset by higher management and structuring fees received. Other fee income is a result of revenue we receive to reimburse us for costs incurred in connection with our insurance of municipal secondary market transactions, primarily rating agency
66
costs, and other miscellaneous fees. We recognize these fees as fee income and the associated costs as other operating expenses when the transaction closed.
| | Year ended December 31, | ||||||
|---|---|---|---|---|---|---|---|
| | 2004 | 2003 | |||||
| | (in thousands) | ||||||
| Fee income | |||||||
| Asset management fees | $ | 3,021 | $ | 2,537 | |||
| Warehousing fees | 1,434 | 4,604 | |||||
| Structuring fees | 1,126 | 675 | |||||
| Other | 510 | 1,082 | |||||
| Total fee income | $ | 6,091 | $ | 8,898 | |||
Provision for Loss and Loss Adjustment Expenses. Provision for loss and LAE for the year ended December 31, 2004 was $46.6 million compared with $3.2 million for the year ended December 31, 2003, an increase of $43.4 million. Incurred losses for case specific reserves for the year ended December 31, 2004 were $44.7 million, which were partially offset by a decrease in non-specific reserves. We established no case specific reserves for the year ended December 31, 2003. In 2004 we established case specific reserves in connection with a portfolio of securitized manufactured housing bonds in the amount of $20.3 million, which were reflected as a loss on our statement of operations which was based on an increase in the rate of delinquencies observed in the mortgages underlying each of the related securitizations. 2004 also included $21.0 million in losses incurred and $1.0 million for industry loss warranty and trade credit businesses included in our Other business line, respectively. The industry loss warranty losses were excess of loss contracts that had losses related to the effects of extreme hurricane activity in 2004. Losses paid in connection with this business were $11.0 million in 2004. The increase in our non-specific reserve was a direct result of the increase in premiums earned and application of our non-specific loss reserving model and represents management's estimate of losses on our insured book of business. For a detailed description of how we establish our reserve for loss and LAE, see "—Critical Accounting Policies and Estimates" above.
| | Year ended December 31, | ||||||
|---|---|---|---|---|---|---|---|
| | 2004 | 2003 | |||||
| | (in thousands) | ||||||
| Beginning: reserve for loss and LAE, net of reinsurance | $ | 3,812 | $ | 2,904 | |||
| Add: provision for case losses | 44,641 | — | |||||
| Add: provision for general reserve | 1,949 | 3,168 | |||||
| Total provision for loss and LAE | 46,590 | 3,168 | |||||
| Less: paid losses | 14,396 | 2,260 | |||||
| Reserve for loss and LAE, net of reinsurance | 36,006 | 3,812 | |||||
| Reinsurance recoverable on unpaid losses | — | 1,172 | |||||
| End: reserve for loss and LAE, gross of reinsurance | $ | 36,006 | $ | 4,984 | |||
Policy Acquisition Costs. Policy acquisition costs for the year ended December 31, 2004 were $3.8 million compared with $4.1 million for the year ended December 31, 2003, a decrease of $0.3 million.
Other Operating Expenses. Other operating expenses for the year ended December 31, 2004 were $38.6 million compared with $29.5 million for the year ended December 31, 2003, an increase of $9.1 million. This change resulted from an increase in general corporate overhead expenses of $7.0 million, primarily a result of certain legal, accounting and other costs incurred in 2004 in
67
connection with our recapitalization. We also incurred an increase in employee compensation and benefits expense of $1.0 million related to severance payments to certain terminated employees.
Interest Expense. Interest expense for the year ended December 31, 2004 was $101.1 million compared with $39.3 million for the year ended December 31, 2003, an increase of $61.8 million. This increase was primarily due to the closing of two consolidated CDOs in 2004 plus the full year effect of payments on consolidated CDO liabilities (CDO debt—non-recourse) added in 2003 as well as rising short-term interest rates. Interest expense also included interest expense on debt incurred to finance our CDO equity investments (CDO debt—operating). We had $100.3 million of debt related to the financing of CDO equity and the interest on an aggregate of $59.2 million of debt issued to the trust preferred vehicle in 2002 and 2003.
| | Year ended December 31, | ||||||
|---|---|---|---|---|---|---|---|
| | 2004 | 2003 | |||||
| | (in thousands) | ||||||
| Interest expense | |||||||
| Corporate debt | $ | 3,305 | $ | 1,338 | |||
| CDO debt—operating | 3,802 | 2,572 | |||||
| CDO debt—non-recourse | 94,030 | 35,350 | |||||
| Total interest expense | $ | 101,137 | $ | 39,260 | |||
Depreciation and Amortization. Depreciation and amortization expenses for the year ended December 31, 2004 were $6.9 million compared with $4.1 million for the year ended December 31, 2003, an increase of $2.8 million. This increase was primarily due to the capitalization of closing costs for two CDOs completed in 2004 coupled with the full year of expense amortization related to the capitalized debt issuance costs of three consolidated CDOs closed in 2003.
Provision for Income Taxes. Provision for income taxes for the year ended December 31, 2004 was $0.1 million compared with $12.2 million for the year ended December 31, 2003. We incurred tax expense in 2004 in spite of recognizing net losses. This tax expense was the result of operating losses recognized in 2004 at our then Bermuda-based holding company which were not deductible for federal income tax purposes because we were not a U.S. taxpayer at that time. We also incurred state tax expense as a result of growth in our CDO asset management business. We re-domesticated our holding company from Bermuda to Delaware, making us a U.S. taxpayer effective September 15, 2004.
Net Income (Loss). The net loss for the year ended December 31, 2004 was $3.8 million compared with net income of $20.0 million for the year ended December 31, 2003, a decrease of $23.8 million.
RESULTS BY BUSINESS LINE
The accounting policies of the business lines are the same as those described in the summary of significant accounting policies (see Note 2 of our financial statements). Reportable business line results are presented net of material inter-line transactions. Our two financial guaranty insurance lines of business, Structured Credit and Municipal Finance, are presented separately. Items of income and expense that are directly attributable to an operating business line are so recorded. Items not directly attributable are allocated to each operating business line. Allocated items include non-CDO investment income and realized gains and losses, which are allocated based on each business line's estimated capital utilization, and operating expenses, which are allocated based on time studies and headcount.
68
Where determinable, we specifically assign assets to each business line. Otherwise, we allocate assets based on estimates. For example, deferred policy acquisition costs are assigned to the Municipal Finance business line since only expenses related to non-derivative financial guaranty activity are included in this asset. Conversely, the non-VIE investment portfolio is allocated to each business line based on its estimated capital utilization. The vast majority of Structured Credit and CDO Asset Management premium is derivative in form.
The following table summarizes our operations and allocation of assets as of and for the six months ended June 30, 2006 and 2005:
| | Six Months Ended June 30, 2006 | ||||||||||||||||
|---|---|---|---|---|---|---|---|---|---|---|---|---|---|---|---|---|---|
| | Structured Credit | Municipal Finance | CDO Asset Management(1) | Other | Consolidated Totals | ||||||||||||
| | (in thousands) | ||||||||||||||||
| Revenues | |||||||||||||||||
| Premiums earned | $ | 506 | $ | 11,752 | $ | — | $ | 1,099 | $ | 13,357 | |||||||
| Net insured credit swap revenue | 20,439 | 632 | 1,040 | — | 22,111 | ||||||||||||
| Net investment income | 1,734 | 8,004 | 148,577 | 1,849 | 160,164 | ||||||||||||
| Net realized and unrealized losses on investments | (171 | ) | (817 | ) | (2,046 | ) | (189 | ) | (3,223 | ) | |||||||
| Net realized and unrealized gains on derivative instruments | — | — | 6,139 | — | 6,139 | ||||||||||||
| Other net credit swap revenue | (25 | ) | — | 5,569 | — | 5,544 | |||||||||||
| Fee and other income | 283 | 152 | 10,742 | — | 11,177 | ||||||||||||
| Total revenues | 22,766 | 19,723 | 170,021 | 2,759 | 215,269 | ||||||||||||
| Expenses | |||||||||||||||||
| Loss and loss adjustment expenses | — | 2,915 | — | 767 | 3,682 | ||||||||||||
| Policy acquisition costs | — | 3,790 | — | 370 | 4,160 | ||||||||||||
| Other operating expenses | 8,663 | 4,404 | 10,227 | — | 23,294 | ||||||||||||
| Interest expense | 173 | 830 | 136,207 | 173 | 137,383 | ||||||||||||
| Depreciation and amortization | 367 | 309 | 4,041 | — | 4,717 | ||||||||||||
| Total expenses | 9,203 | 12,248 | 150,475 | 1,310 | 173,236 | ||||||||||||
| (Income) of minority interest | (7 | ) | — | (2,222 | ) | — | (2,229 | ) | |||||||||
| Income before income taxes | $ | 13,556 | $ | 7,475 | $ | 17,324 | $ | 1,449 | 39,804 | ||||||||
| Provision for income taxes | 13,615 | ||||||||||||||||
| Net income | $ | 26,189 | |||||||||||||||
| Segment assets | $ | 56,390 | $ | 452,947 | $ | 5,139,289 | $ | 96,877 | $ | 5,745,503 | |||||||
- (1)
- Includes operations and allocation of CDO assets that we consolidate under U.S. GAAP. For a description of the impact of consolidation on our financial statements, see "Management's Discussion and Analysis of Financial Condition and Results of Operations—Critical Accounting Policies and Estimates—Consolidation of Variable Interest Entities (VIEs) and Other Restricted Investments" and "Management's Discussion and Analysis of Financial Condition and Results of Operations—Results by Business Line—CDO Asset Management—Consolidation of VIEs."
69
| | Six Months Ended June 30, 2005 | ||||||||||||||||
|---|---|---|---|---|---|---|---|---|---|---|---|---|---|---|---|---|---|
| | Structured Credit | Municipal Finance | CDO Asset Management(1) | Other | Consolidated Totals | ||||||||||||
| | (in thousands) | ||||||||||||||||
| Revenues | |||||||||||||||||
| Premiums earned | $ | 1,771 | $ | 10,324 | $ | — | $ | 4,126 | $ | 16,221 | |||||||
| Net insured credit swap revenue | 2,868 | — | 1,675 | — | 4,543 | ||||||||||||
| Net investment income | 386 | 6,459 | 106,085 | 1,544 | 114,474 | ||||||||||||
| Net realized losses on investments | (13 | ) | (217 | ) | (941 | ) | (52 | ) | (1,223 | ) | |||||||
| Net realized and unrealized gains on derivative instruments | — | — | 4,040 | — | 4,040 | ||||||||||||
| Other net credit swap revenue | — | — | 2,524 | — | 2,524 | ||||||||||||
| Fee and other income | 241 | 37 | 4,383 | — | 4,661 | ||||||||||||
| Total revenues | 5,253 | 16,603 | 117,766 | 5,618 | 145,240 | ||||||||||||
| Expenses | |||||||||||||||||
| Loss and loss adjustment expenses | — | 2,087 | — | 2,052 | 4,139 | ||||||||||||
| Policy acquisition costs | — | 3,073 | — | 911 | 3,984 | ||||||||||||
| Other operating expenses | 3,010 | 3,845 | 7,814 | — | 14,669 | ||||||||||||
| Interest expense | 53 | 762 | 94,505 | 184 | 95,504 | ||||||||||||
| Depreciation and amortization | 97 | 244 | 3,691 | 32 | 4,064 | ||||||||||||
| Total expenses | 3,160 | 10,011 | 106,010 | 3,179 | 122,360 | ||||||||||||
| (Income) of minority interest | — | — | (1,685 | ) | — | (1,685 | ) | ||||||||||
| Income before provision for income taxes | $ | 2,093 | $ | 6,592 | $ | 10,071 | $ | 2,439 | 21,195 | ||||||||
| Provision for income taxes | 8,078 | ||||||||||||||||
| Net income | $ | 13,117 | |||||||||||||||
| Segment assets | $ | 35,528 | $ | 441,521 | $ | 5,236,130 | $ | 94,887 | $ | 5,808,066 | |||||||
- (1)
- Includes operations and allocation of CDO assets that we consolidate under U.S. GAAP. For a description of the impact of consolidation on our financial statements, see "Management's Discussion and Analysis of Financial Condition and Results of Operations—Critical Accounting Policies and Estimates—Consolidation of Variable Interest Entities (VIEs) and Other Restricted Investments" and "Management's Discussion and Analysis of Financial Condition and Results of Operations—Results by Business Line—CDO Asset Management—Consolidation of VIEs."
70
The following table summarizes our operations and allocation of assets as of and for the years ended December 31, 2005, 2004 and 2003:
| | Year Ended December 31, 2005 | ||||||||||||||||
|---|---|---|---|---|---|---|---|---|---|---|---|---|---|---|---|---|---|
| | Structured Credit | Municipal Finance | CDO Asset Management(1) | Other | Consolidated Totals | ||||||||||||
| | (in thousands) | ||||||||||||||||
| Revenues | |||||||||||||||||
| Premiums earned | $ | 2,548 | $ | 23,889 | $ | — | $ | 6,906 | $ | 33,343 | |||||||
| Net insured credit swap revenue | 20,542 | 13 | 1,016 | — | 21,571 | ||||||||||||
| Net investment income | 828 | 13,862 | 236,591 | 3,310 | 254,591 | ||||||||||||
| Net realized losses on investments | (35 | ) | (591 | ) | (2,010 | ) | (141 | ) | (2,777 | ) | |||||||
| Net realized and unrealized gains on derivative instruments | — | — | 8,410 | — | 8,410 | ||||||||||||
| Other net credit swap revenue | — | — | 4,157 | — | 4,157 | ||||||||||||
| Fee and other income | 632 | 307 | 10,351 | 9 | 11,299 | ||||||||||||
| Total revenues | 24,515 | 37,480 | 258,515 | 10,084 | 330,594 | ||||||||||||
| Expenses | |||||||||||||||||
| Loss and loss adjustment expenses | — | 7,459 | — | 6,579 | 14,038 | ||||||||||||
| Policy acquisition costs | — | 6,970 | — | 1,682 | 8,652 | ||||||||||||
| Other operating expenses | 7,430 | 7,201 | 19,049 | 3,763 | 37,443 | ||||||||||||
| Interest expense | 115 | 1,663 | 212,134 | 401 | 214,313 | ||||||||||||
| Depreciation and amortization | 235 | 596 | 7,674 | 78 | 8,583 | ||||||||||||
| Total expenses | 7,780 | 23,889 | 238,857 | 12,503 | 283,029 | ||||||||||||
| (Income) of minority interest | — | — | (3,708 | ) | — | (3,708 | ) | ||||||||||
| Income (loss) before income taxes | $ | 16,735 | $ | 13,591 | $ | 15,950 | $ | (2,419 | ) | 43,857 | |||||||
| Provision for income taxes | 15,097 | ||||||||||||||||
| Net income | $ | 28,760 | |||||||||||||||
| Segment assets | $ | 36,062 | $ | 483,794 | $ | 5,169,575 | $ | 102,769 | $ | 5,792,200 | |||||||
- (1)
- Includes operations and allocation of CDO assets that we consolidate under U.S. GAAP. For a description of the impact of consolidation on our financial statements, see "Management's Discussion and Analysis of Financial Condition and Results of Operations—Critical Accounting Policies and Estimates—Consolidation of Variable Interest Entities (VIEs) and Other Restricted Investments" and "Management's Discussion and Analysis of Financial Condition and Results of Operations—Results by Business Line—CDO Asset Management—Consolidation of VIEs."
71
| | Year Ended December 31, 2004 | ||||||||||||||||
|---|---|---|---|---|---|---|---|---|---|---|---|---|---|---|---|---|---|
| | Structured Credit | Municipal Finance | CDO Asset Management(1) | Other | Consolidated Totals | ||||||||||||
| | (in thousands) | ||||||||||||||||
| Revenues | |||||||||||||||||
| Premiums earned | $ | 6,161 | $ | 13,930 | $ | — | $ | 9,742 | $ | 29,833 | |||||||
| Net insured credit swap revenue | 5,617 | — | 10,401 | — | 16,018 | ||||||||||||
| Net investment income | 524 | 8,770 | 114,782 | 2,094 | 126,170 | ||||||||||||
| Net realized losses on investments | (10 | ) | (163 | ) | (6,335 | ) | (39 | ) | (6,547 | ) | |||||||
| Net realized and unrealized gains on derivative instruments | — | — | 6,520 | — | 6,520 | ||||||||||||
| Other net credit swap revenue | — | — | 10,990 | — | 10,990 | ||||||||||||
| Fee and other income | 644 | 4,057 | 5,184 | 143 | 10,028 | ||||||||||||
| Total revenues | 12,936 | 26,594 | 141,542 | 11,940 | 193,012 | ||||||||||||
| Expenses | |||||||||||||||||
| Loss and loss adjustment expenses | $ | — | $ | 4,310 | $ | — | $ | 42,280 | $ | 46,590 | |||||||
| Policy acquisition costs | — | 2,238 | — | 1,597 | 3,835 | ||||||||||||
| Other operating expenses | 8,870 | 7,148 | 18,910 | 3,717 | 38,645 | ||||||||||||
| Interest expense | 66 | 958 | 99,882 | 231 | 101,137 | ||||||||||||
| Depreciation and amortization | 190 | 482 | 6,200 | 63 | 6,935 | ||||||||||||
| Total expenses | 9,126 | 15,136 | 124,992 | 47,888 | 197,142 | ||||||||||||
| Loss of minority interest | — | — | 476 | — | 476 | ||||||||||||
| Income (loss) before income taxes | $ | 3,810 | $ | 11,458 | $ | 17,027 | $ | (35,948 | ) | (3,654 | ) | ||||||
| Provision for income taxes | 135 | ||||||||||||||||
| Net loss | $ | (3,789 | ) | ||||||||||||||
| Segment assets | $ | 33,029 | $ | 430,063 | $ | 5,136,008 | $ | 92,861 | $ | 5,691,961 | |||||||
- (1)
- Includes operations and allocation of CDO assets that we consolidate under U.S. GAAP. For a description of the impact of consolidation on our financial statements, see "Management's Discussion and Analysis of Financial Condition and Results of Operations—Critical Accounting Policies and Estimates—Consolidation of Variable Interest Entities (VIEs) and Other Restricted Investments" and "Management's Discussion and Analysis of Financial Condition and Results of Operations—Results by Business Line—CDO Asset Management—Consolidation of VIEs."
72
| | Year Ended December 31, 2003 | |||||||||||||||
|---|---|---|---|---|---|---|---|---|---|---|---|---|---|---|---|---|
| | Structured Credit | Municipal Finance | CDO Asset Management(1) | Other | Consolidated Totals | |||||||||||
| | (in thousands) | |||||||||||||||
| Revenues | ||||||||||||||||
| Premiums earned | $ | 5,171 | $ | 8,795 | $ | — | $ | 4,830 | $ | 18,796 | ||||||
| Net insured credit swap revenue | 3,907 | — | 2,934 | — | 6,841 | |||||||||||
| Net investment income | 408 | 6,837 | 43,991 | 1,632 | 52,868 | |||||||||||
| Net realized gains (losses) on investments | 186 | 3,136 | (883 | ) | 749 | 3,188 | ||||||||||
| Net realized and unrealized gains on derivative instruments | — | — | 9,124 | — | 9,124 | |||||||||||
| Other net credit swap revenue | 1,213 | — | 10,908 | — | 12,121 | |||||||||||
| Fee and other income | 1,113 | 383 | 7,772 | 53 | 9,321 | |||||||||||
| Total revenues | 11,998 | 19,151 | 73,846 | 7,264 | 112,259 | |||||||||||
| Expenses | ||||||||||||||||
| Loss and loss adjustment expenses | — | 1,377 | — | 1,791 | 3,168 | |||||||||||
| Policy acquisition costs | — | 3,788 | — | 289 | 4,077 | |||||||||||
| Other operating expenses | 4,847 | 7,072 | 16,222 | 1,325 | 29,466 | |||||||||||
| Interest expense | 26 | 388 | 38,752 | 94 | 39,260 | |||||||||||
| Depreciation and amortization | 36 | 92 | 3,975 | 12 | 4,115 | |||||||||||
| Total expenses | 4,909 | 12,717 | 58,949 | 3,511 | 80,086 | |||||||||||
| Income before income taxes | $ | 7,089 | $ | 6,434 | $ | 14,897 | $ | 3,753 | 32,173 | |||||||
| Provision for income taxes | 12,206 | |||||||||||||||
| Net income | $ | 19,967 | ||||||||||||||
| Segment assets | $ | 31,703 | $ | 317,757 | $ | 3,046,037 | $ | 68,366 | $ | 3,463,863 | ||||||
- (1)
- Includes operations and allocation of CDO assets that we consolidate under U.S. GAAP. For a description of the impact of consolidation on our financial statements, see "Management's Discussion and Analysis of Financial Condition and Results of Operations—Critical Accounting Policies and Estimates—Consolidation of Variable Interest Entities (VIEs) and Other Restricted Investments" and "Management's Discussion and Analysis of Financial Condition and Results of Operations—Results by Business Line—CDO Asset Management—Consolidation of VIEs."
73
Structured Credit
Comparison of Six Months Ended June 30, 2006 and June 30, 2005
Premiums Earned Premiums earned declined to $0.5 million for the six months ended June 30, 2006 from $1.8 million for the same period of 2005. The decrease was the result of our shift in focus from traditional financial guaranty insurance to the insurance of credit swaps in this line of business.
Net Insured Credit Swap Revenue. The vast majority of revenue received from Structured Credit transactions is insured credit swap premiums, recorded as net insured credit swap revenue. Insured credit swap premiums earned for the six months ended June 30, 2006 was $18.8 million compared with $8.6 million for the six months ended June 30, 2005, an increase of $10.2 million. The increase was attributable to the increase in outstanding notional exposure. We added nine new Structured Credit counterparties in 2005 and the first six months of 2006, for a total of 22 counterparties as of June 30, 2006. Net realized and unrealized gains (losses) on insured credit swaps for the six months ended June 30, 2006 were a gain of $1.6 million compared to a loss of $5.7 million for the six months ended June 30, 2005, an increase of $7.3 million. Our net unrealized gains (losses) on insured credit swaps are the result of our transactions, in the form of credit swaps, which are marked to fair value at each reporting date. We also occasionally realize gains or losses upon the termination of credit swap transactions. For the six months ended June 30, 2006, we recognized gains of approximately $2.0 million from the termination of three transactions offset by a net widening of credit spreads which caused us to have a mark to market loss in the first half of 2006.
Operating Expenses. Operating expenses for the six months ended June 30, 2006 were $8.7 million compared with $3.0 million for the six months ended June 30, 2005, an increase of $5.7 million. The increase is attributable to a reallocation of internal resources, effective January 1, 2006, to support the growth in this line of business.
(Income) of Minority Interest. With the closing of our credit fund in May 2006, we recognized net income of $19.0 thousand which includes minority interest (income) in the amount of $(7.2) thousand related to third party investors whose investments we consolidate.
Income Before Income Taxes. Income before income taxes for the six months ended June 30, 2006 was $13.6 million compared with $2.1 million for the six months ended June 30, 2005, an increase of $11.5 million.
Comparison of Years Ended December 31, 2005 and December 31, 2004
Premiums Earned Premiums earned declined to $2.5 million for the year ended December 31, 2005 from $6.2 million for the year ended December 31, 2004. The decrease was the result of our shift in focus from traditional financial guaranty insurance to the insurance of credit swaps in this line of business.
Net Insured Credit Swap Revenue. We record insured credit swap premiums earned from Structured Credit transactions as net insured credit swap revenue. For the years ended December 31, 2005 and 2004, we earned insured credit swap premiums in the amount of $23.1 million and $6.4 million, respectively, in this business line. The increase of $16.7 million of insured credit swap premiums received in our Structured Credit business was primarily due to the higher volume of transactions completed resulting from increases in available credit from existing counterparties and the addition of new counterparties, and the annual revenues from business written in 2004. We added eight new Structured Credit counterparties in 2005, for a total of 21 counterparties as of December 31, 2005.
Net realized and unrealized gains (losses) on insured credit swaps for the year ended December 31, 2005 were a loss of $2.6 million compared to a loss of $0.8 million for the year ended December 31, 2004, a decrease of $1.8 million. Our net unrealized gains (losses) on insured credit swaps were the result of our transactions which are generally in the form of credit swaps. In 2005, a net
74
credit spread widening in the portfolios underlying certain of our transactions caused the valuation losses. In 2004 we also recognized valuation losses.
Operating Expenses. Operating expenses for the year ended December 31, 2005 were $7.4 million compared with $8.9 million for the year ended December 31, 2004, a decrease of $1.5 million. The decrease was related to the absence of expenses resulting from the negative ratings actions experienced by ACA Financial Guaranty in 2004 and the resulting reorganization, which did not recur in 2005.
Income (Loss) Before Income Taxes. Income before income taxes for the year ended December 31, 2005 was $16.7 million compared with $3.8 million for the year ended December 31, 2004, an increase of $12.9 million.
Comparison of Years Ended December 31, 2004 and December 31, 2003
Net Insured Credit Swap Revenue. For the years ended December 31, 2004 and 2003, we earned insured credit swap premiums in the amount of $6.4 million and $3.0 million, respectively. The increase of $3.4 million of insured credit swap premiums in our Structured Credit business was primarily due to the higher volume of transactions completed resulting from increases in available credit from existing counterparties and the addition of new counterparties, and the annual revenues from business written in 2004. We added seven new credit counterparties in 2004, for a total of 14 counterparties as of December 31, 2004.
Net realized and unrealized losses on insured credit swaps for the year ended December 31, 2004 were $0.8 million compared with gains of $0.9 million for the year ended December 31, 2003, a decrease of $1.4 million. Our net unrealized gains (losses) on insured credit swaps were the result of the valuation of our transactions which are generally in the form of credit swaps. In 2004, a decrease in valuation of our transactions caused losses, while in 2003 we experienced valuation gains.
Operating Expenses. Operating expenses for the year ended December 31, 2004 were $8.9 million compared with $4.8 million for the year ended December 31, 2003, an increase of $4.1 million. The increase was primarily related to expenses resulting from the negative ratings actions experienced by ACA Financial Guaranty and the resulting reorganization in 2004.
Income Before Income Taxes. Income before income taxes for the year ended December 31, 2004 was $3.8 million compared with $7.1 million for the year ended December 31, 2003, decrease of $3.3 million.
Municipal Finance
Comparison of Six Months Ended June 30, 2006 and June 30, 2005
Premiums Earned. Premiums from municipal finance are generally paid to us on an upfront basis and are earned over the life of the insured obligation. Net earned premium for the six months ended June 30, 2006 was $11.8 million compared with $10.3 million for the six months ended June 30, 2005, an increase of $1.5 million. The increase is due to a higher level of refunding activity in the six months ended June 30, 2006 as compared to the same period in 2005.
Provision for Loss and Loss Adjustment Expenses. Provision for loss and LAE for the six months ended June 30, 2006 was $3.7 million compared with $4.1 million for the six months ended June 30, 2005, a decrease of $0.4 million, which is primarily attributable to a decrease in "Other" incurred losses commensurate with the run-off of this business.
Net Policy Acquisition Costs. Policy acquisition costs for the six months ended June 30, 2006 were $3.8 million compared with $3.1 million for the six months ended June 30, 2005, an increase of $0.7 million. This increase was consistent with the increase in Municipal Finance premiums earned.
Operating Expenses. Operating expenses for the six months ended June 30, 2006 were $4.4 million compared with $3.8 million for the six months ended June 30, 2005, an increase of $0.6 million.
75
Income Before Income Taxes. Income before income taxes for the six months ended June 30, 2006 was $7.5 million compared with $6.6 million for the six months ended June 30, 2005, an increase of $0.9 million.
Comparison of Years Ended December 31, 2005 and December 31, 2004
Premiums Earned. Premiums from municipal finance are generally paid to us on an upfront basis and are earned over the life of the insured obligation. Net earned premium for the year ended December 31, 2005 was $23.9 million compared with $13.9 million for the year ended December 31, 2004, an increase of $10.0 million. The increase was due to the increase in recognition of premiums earned in respect of premiums written in 2004 and the acceleration of premiums earned as a result of several refundings, which totaled $6.6 million for the year ended December 31, 2005 and $1.8 million for the year ended December 31, 2004.
Provision for Loss and Loss Adjustment Expenses. Provision for loss and LAE for the year ended December 31, 2005 was $7.5 million compared with $4.3 million for the year ended December 31, 2004, an increase of $3.2 million resulting from an increase of $4.4 million in the provision for non-specific reserves which was partially offset by a decrease in incurred losses for case specific reserves. Increases to non-specific reserves for the year ended December 31, 2005 were $6.3 million compared with $1.9 million for the year ended December 31, 2004. The increase in our non-specific reserve was a direct result of the increase in premiums earned and application of our non-specific reserve model, and represents management's estimate of losses on our insured book of business. Incurred losses for case specific reserves for the year ended December 31, 2005 were $1.1 million and included the provision of loss adjustment expenses on several credits. Incurred losses for case specific reserves in 2004 was $2.4 million and included the reassumption of a previously ceded reserve on a single municipal credit in the amount of $1.2 million, as well as additional loss development on that credit in the amount of $1.2 million.
Net Policy Acquisition Costs. Policy acquisition costs for the year ended December 31, 2005 were $7.0 million compared with $2.2 million for the year ended December 31, 2004, an increase of $4.8 million. This increase was consistent with the increase in Municipal Finance premiums earned and the amortization of deferred expenses.
Operating Expenses. Operating expenses for the year ended December 31, 2005 were $7.2 million compared with $7.1 million for the year ended December 31, 2004, an increase of $0.1 million.
Income Before Income Taxes. Income before income taxes for the year ended December 31, 2005 was $13.6 million compared with $11.5 million for the year ended December 31, 2004, an increase of $2.1 million.
Comparison of Years Ended December 31, 2004 and December 31, 2003
Premiums Earned. Net earned premium for the year ended December 31, 2004 was $13.9 million compared with $8.8 million for the year ended December 31, 2003, an increase of $5.1 million. The increase was due to the increase in recognition of premiums written in prior periods and, to a lesser extent, the acceleration of premiums earned as a result of several refundings. Premiums related to refundings totaled $1.8 million for the year ended December 31, 2004 and $0.4 million for the year ended December 31, 2003.
Provision for Loss and Loss Adjustment Expenses. Provision for loss and LAE for the year ended December 31, 2004 was $4.3 million compared with $1.4 million for the year ended December 31, 2003, an increase of $2.9 million. In 2004, the provision for losses included the reassumption of a previously ceded case reserve on a single municipal credit in the amount of $1.2 million, as well as additional loss development of $1.2 million on that insured credit. Also, non-specific reserves increased by $1.9 million in 2004. The entire increase in 2003 reserves was related to non-specific reserves. The increase in our
76
non-specific reserve in both 2004 and 2003 was a direct result of the increase in premiums earned and the application of our non-specific reserving model and represented management's estimate of losses on our insured book of business.
Net Policy Acquisition Costs. Policy acquisition costs for the year ended December 31, 2004 were $2.2 million compared with $3.8 million for the year ended December 31, 2003, a decrease of $1.6 million.
Operating Expenses. Operating expenses for the years ended December 31, 2004 and December 31, 2003 were $7.1 million and $7.1 million, respectively.
Income Before Income Taxes. Income before income taxes for the year ended December 31, 2004 was $11.5 million compared with $6.4 million for the year ended December 31, 2003, an increase of $5.1 million.
CDO Asset Management
CDO Structures and Related Revenue Recognition.
The impact of a CDO on our financial statements depends on the structure of the CDO (fully funded, partially funded or unfunded), whether or not the CDO is consolidated and the nature of the underlying assets and liabilities.
Fully funded CDOs contain investments in interest bearing financial assets such as fixed maturity securities or guaranteed investment contracts. We have six fully funded CDOs and one partially funded CDO. The assets and liabilities of these CDOs are included on our balance sheets. The income generated by the investments is reflected in net investment income in the consolidated statements of operations. The debt liabilities issued in the form of notes pay interest that is included in interest expense in the consolidated statements of operations. A management fee is paid by the CDO to ACA Management, L.L.C. but is eliminated in consolidation. Our return on our equity investment is the net of the CDO's revenues (interest income) and expenses, including the management fee paid to ACA Management, L.L.C.
Partially funded synthetic, or CDS, CDOs sell credit protection on referenced assets by entering into credit swaps with various protection buyers in the market. The CDO also issues securities, both liabilities and equity, in order to use the proceeds from the sale of these securities to collateralize the CDO's obligations under its credit swaps, except with respect to the most senior tranche of the CDO's credit exposure, in connection with which a partially funded CDO typically purchases credit protection rather than issuing funded liability securities. The proceeds of the securities issued by the partially funded CDO are invested in a guaranteed investment contract, or GIC. We consolidate one partially funded CDS CDO. From this consolidated CDO, we consolidate investment income, relating to the return on the GIC, and interest expense in connection with the liability securities issued by the CDO. We also consolidate derivative income relating to net revenues from the fixed fees payable to the CDO under the terms of the credit swaps pursuant to which the CDS CDO sold credit protection on referenced assets and the fixed fees payable by the CDO on the credit protection that it purchased. This income is reflected in the consolidated statements of operations as other net credit swap revenue. This income is used to pay the interest on the liabilities of the CDO and other expenses of the CDO, including the management fee. Similar to the fully funded and consolidated CDOs, all management fees in this partially funded CDS CDO are paid to ACA Management, but eliminated in consolidation. Our return on our equity investment is the net of the CDO's revenues (interest income and other credit swap income) and the CDO's expenses, including the management fee paid to ACA Management, L.L.C.
For funded unconsolidated CDOs, we reflect management fees and investment income in our consolidated statements of operations. In these instances, the investment income recorded is only on the equity investment made by us as compared to all of the assets in a consolidated CDO. Partially
77
funded, unconsolidated CDOs in which we invest in the funded equity securities are reflected in our financial statements in the same way as funded unconsolidated CDOs.
We originated a fully synthetic, or unfunded, CDS CDO in each of 2002 and 2003. In these transactions, we act as asset manager, and, through ACA Financial Guaranty, insure the equity or first loss position of the CDO. No variable interest entities, or VIEs, exist in these structures; rather, the sponsoring investment bank acts as the counterparty to the various credit swaps that constitute the assets and liabilities of the synthetic CDO. CDOs that do not use VIEs are not subject to consolidation under FIN 46(R). For our various roles in the unfunded CDS CDOs, we receive structuring fees, management fees, premium and residual equity returns. On our consolidated statements of operations, these revenues are reflected as fee income, net insured credit swap revenue and other net derivative income. Net insured credit swap revenue also includes the changes in fair value of the related credit swaps. Our combined equity position in our two unfunded CDS CDOs, which is the aggregate notional balance of our credit swaps insuring the equity tranches of these two CDOs, was $47.5 million at December 31, 2005 and 2004.
In certain funded CDOs, we issued liabilities in the form of notes in order to fund our equity purchases. These borrowings were accomplished through the issuance of non-recourse notes by our subsidiaries. These notes are insured as to the repayment of principal and interest by ACA Financial Guaranty. The premium on the policy insuring the notes payable to ACA Financial Guaranty is payable by our subsidiary that invested in the preferred shares. These subsidiaries and ACA Financial Guaranty are wholly owned by us and therefore this inter-company premium eliminates in consolidation.
In structuring our CDOs, we collaborate with sponsoring investment banks to develop the type of CDO, either fully funded, partially funded or unfunded, to meet the demand of market participants. At any given time, different types of CDOs may be attractive to different potential investors. Whether a CDO is consolidated is a function of the amount of our equity position in the CDO and the related accounting rules. See "—Consolidation of VIEs." Whether or not a CDO will be consolidated onto our financial statements is not a factor that we consider in determining the types of CDOs that we agree to manage.
We do not view our equity positions in our CDOs as a revenue generating strategy but rather assume such positions as an opportunity to attract investors and thereby grow our assets under management by aligning our interests with those of the investors in the CDO. While in early transactions we either invested in or sold credit protection through insured credit swaps on 100% of the equity tranches of our CDOs, and therefore consolidate those CDOs (to the extent the accounting rules require such consolidation), beginning in 2005 we have been able to assume reduced amounts of equity in the CDOs that we manage and therefore have not been consolidating CDO originated since that time. We do not anticipate consolidating new CDOs in the future. See "Business—CDO Asset Management" for a further explanation of our business strategy in this line of business.
Consolidation of VIEs
As described above and under "Critical Accounting Policies and Estimates—Consolidation of Variable Interest Entities (VIEs) and Other Restricted Investments," from an accounting perspective, funded and partially funded CDOs are deemed to be issued out of VIEs. As such, each time a CDO is formed through the issuance of debt instruments to third parties and the purchase of investment assets, we perform an analysis to determine whether we are the primary beneficiary and thus required to consolidate the CDO under the provisions of FIN 46(R). Prior to 2005, we retained all or most of the equity position in our CDOs, and these CDOs are therefore consolidated in our financial statements (a total of seven CDOs are consolidated). Although the VIEs are consolidated, we do not have the right to use the assets of the VIEs for general operations and the debt liabilities of the VIEs are without recourse to any assets other than those of the VIEs. Our investment exposure to our CDOs is therefore limited to our retained equity, which is the first loss position of the CDO. In the instances that we own less than 100% of the CDO VIE's equity, but are deemed to be the primary beneficiary
78
and thus consolidate the CDO VIE, we establish minority interests for the unowned portion. Total non-recourse debt of the CDOs included on our balance sheet at June 30, 2006 and December 31, 2005 were $4.8 billion and $4.8 billion, respectively. Fixed maturity securities, a guaranteed investment contract and cash related to consolidated CDOs included on our balance sheet at June 30, 2006 and December 31, 2005 were $5.0 billion and $5.1 billion, respectively.
Beginning in 2005, we have retained a lesser share of the equity position of our newly issued CDOs and based on FIN 46(R) analyses we are not deemed to be the primary beneficiary. As a result, these CDOs are not consolidated in our financial statements. Rather, our non-majority investment is recorded as an investment in a single fixed maturity security under the provisions of FAS 115 and EITF 99-20. During 2005 and the first six months of 2006, we closed eight CDOs and purchased equity interests in 6, and were not determined to be the primary beneficiary in any of the six CDOs. The fair value of our total investment in unconsolidated CDOs at June 30, 2006 was $18.4 million, not including synthetic CDOs in which we take derivative exposure but make no investment.
The following table summarizes our outstanding CDO transactions as of June 30, 2006:
| Year Deal Closed | CDO Name | Transaction Type | Collateral Type(1) | Consolidated | Current AUM (in millions) | Original Investment in Retained Equity (in millions) | Retained Equity % | First Optional Call Date | Maturity Date | |||||||||||
|---|---|---|---|---|---|---|---|---|---|---|---|---|---|---|---|---|---|---|---|---|
| 2002 | ACA CDS 2001-1 | Unfunded | Investment Grade—Corp | No | $ | 975 | $ | 22.5 | 100 | % | N/A | 04/10/07 | ||||||||
| 2002 | ACA CDS 2002-1 | Partially funded | Investment Grade—Corp | Yes | 965 | 22.0 | 100 | N/A | 07/15/08 | |||||||||||
| 2002 | ACA ABS 2002-1 | Funded | Investment Grade—ABS | Yes | 260 | 18.0 | 100 | 08/01/05 | 08/01/37 | |||||||||||
| 2003 | ACA CDS 2002-2 | Unfunded | Investment Grade—Corp | No | 1,000 | 25.0 | 100 | N/A | 03/31/08 | |||||||||||
| 2003 | ACA ABS 2003-1 | Funded | Investment Grade—ABS | Yes | 404 | 18.0 | 100 | 06/10/07 | 06/10/38 | |||||||||||
| 2003 | Grenadier Funding Ltd | Funded | High-Grade—ABS | Yes | 1,493 | 22.5 | 100 | 08/05/08 | 08/05/38 | |||||||||||
| 2003 | ACA ABS 2003-2 | Funded | Investment Grade—ABS | Yes | 732 | 33.5 | 100 | 12/10/07 | 12/10/38 | |||||||||||
| 2004 | ACA ABS 2004-1 | Funded | Investment Grade—ABS | Yes | 440 | 10.0 | 61 | 07/10/07 | 07/10/39 | |||||||||||
| 2004 | Zenith Funding | Funded | High-Grade—ABS | Yes | 1,511 | 13.0 | 52 | 12/06/09 | 12/06/39 | |||||||||||
| 2005 | ACA ABS 2005-1 | Funded | Investment Grade—ABS | No | 452 | 4.4 | 24 | 04/05/08 | 04/05/40 | |||||||||||
| 2005 | Argon 49 | Funded | Investment Grade—Corp | No | 64 | (2) | 0 | 0 | N/A | 06/20/15 | ||||||||||
| 2005 | ACA CLO 2005-1 | Funded | Non-Investment Grade—Leveraged Loans | No | 306 | 5.0 | 21 | 10/15/09 | 10/15/17 | |||||||||||
| 2005 | ACA ABS 2005-2 | Funded | Investment Grade—ABS | No | 454 | 2.1 | 10 | 09/06/09 | 12/06/44 | |||||||||||
| 2005 | Khaleej II | Partially funded | Investment Grade—ABS | No | 750 | 4.5 | 14 | 09/20/09 | 09/20/40 | |||||||||||
| 2006 | Lancer Funding | Funded | High-Grade ABS | No | 1,500 | 1.5 | 10 | 07/06/10 | 04/06/46 | |||||||||||
| 2006 | Argon 57 | Funded | Investment Grade—Corp | No | 64 | (2) | 0 | 0 | N/A | 06/20/13 | ||||||||||
| 2006 | ACA ABS 2006-1 | Funded | Investment Grade—ABS | No | 750 | 1.4 | 5 | 06/10/13 | 06/10/41 | |||||||||||
| Total: | $ | 12,120 | $ | 203.4 | ||||||||||||||||
- (1)
- Investment grade collateral is rated "BBB–" or better; however certain of our investment grade CDOs include the ability to invest a minority portion (20% or less) in non-investment grade assets. High-grade is "A-" or better.
- (2)
- The original notional deal sizes for Argon 49 and Argon 57 were €50 million each. For purposes of this chart, we have converted the amounts to U.S. dollars at the prevailing currency exchange rates on June 30, 2006.
CDOs can be issued in funded, unfunded or partially funded form. Funded CDOs issue debt instruments and purchase investment assets, while unfunded CDOs synthetically acquire assets and issue liabilities synthetically (i.e., assets and liabilities are in derivative form). Partially funded CDOs are a combination of these two forms. From an accounting perspective, funded and partially funded CDOs are issued out of VIEs.
Because of the requirement to consolidate VIEs where we are the primary beneficiary under FIN 46(R), we may experience increased volatility in our financial statements which is not related to the underlying economic value of our investment in these CDOs. This may make the evaluation of our financial statements more difficult. Our investment exposure to our CDOs is limited to our equity interest; however, we record fluctuations in the fair value of the assets and liabilities of our consolidated CDOs. These valuation fluctuations, in the form of unrealized mark to market adjustments, which are recorded in Accumulated Other Comprehensive Income, have exceeded our economic exposure in the form of our equity investment in the past and could exceed our economic exposure in the future. These valuation adjustments reverse themselves over time, to the extent the gains or losses are not realized by sales or other than temporary impairments. We may have realized losses from the assets (from sales and other than temporary impairments) in our consolidated CDOs
79
and those losses could exceed the amount of our equity exposure. These losses are recorded in our consolidated statement of operations as realized losses. When there are realized losses in the CDO asset portfolios, other CDO investors will bear those losses to the extent the losses exceed our equity exposure to that CDO. When this occurs, the financial statement impact of the realized losses is offset at CDO maturity, when the associated non-recourse liabilities are written off. For example, if we had a $400 million CDO in which we owned 100% of $20 million in equity in the form of preference shares, we would consolidate the CDO, including all of its income, expenses, gains, losses and mark to market valuations. Third party investors would own the $380 million in debt securities issued by the CDO. The maximum economic loss we could sustain on the CDO is $20 million, however, as we consolidated the CDO in our financial statements, we could record realized losses, for example, greater than $20 million, should they occur in the $400 million asset portfolio of the CDO. The reversal of those losses above our $20 million share would be recorded in our statement of operations at the CDO's maturity as the CDO writes down the principal amount of liabilities. Third party investors would sustain those losses as they would not receive all of their principal investment back in this scenario.
Accounting for a Consolidated CDO as Compared to an Unconsolidated CDO
When we consolidate a typical funded CDO, for accounting purposes the CDO issuing vehicle is treated essentially as a wholly owned operating subsidiary of ACA. "Funded" means that at the CDO's closing, it issues liabilities in the form of debt and equity and the assets are purchased out of a warehouse facility with the proceeds from the issuance. The following shows the balance sheet impact of consolidating a hypothetical $400 million asset-backed CDO at the closing date, assuming we purchase the entire equity position of $20 million for cash:
| | CDO VIE | ACA Funding Company(1) | ACA Management(2) | Eliminations | ACA Consolidated | |||||||||||
|---|---|---|---|---|---|---|---|---|---|---|---|---|---|---|---|---|
| | (in thousands) | |||||||||||||||
| Balance Sheet | ||||||||||||||||
| Cash | $ | — | $ | (20,000 | ) | $ | — | $ | — | $ | (20,000 | ) | ||||
| Fixed maturity securities | 400,000 | 20,000 | — | (20,000 | ) | 400,000 | ||||||||||
| Total assets | $ | 400,000 | $ | — | $ | — | $ | (20,000 | ) | $ | 380,000 | |||||
Long-term debt | $ | 380,000 | $ | — | $ | — | $ | — | $ | 380,000 | ||||||
| Total liabilities | 380,000 | — | — | — | 380,000 | |||||||||||
| Equity | 20,000 | — | — | (20,000 | ) | — | ||||||||||
| Total liabilities and equity | $ | 400,000 | $ | — | $ | — | $ | (20,000 | ) | $ | 380,000 | |||||
- (1)
- The purchaser of the equity. For illustration purposes we assume the purchase of equity is made with cash, although we typically finance our purchases of equity.
- (2)
- The entity that earns management fees.
For purposes of this hypothetical CDO, we assume we do not earn warehouse and structuring fees, which we do on a number of our CDOs. This example also excludes the effects of any mark to market adjustments on derivatives contained within the CDO vehicle. Following the closing of this hypothetical CDO, we record the activity on the assets and liabilities, and ongoing expenses of a typical CDO as
80
follows, assuming one year has passed and we have realized a 10% return on our $20 million equity position:
| | CDO VIE | ACA Funding Company | ACA Management | Eliminations | ACA Consolidated | |||||||||||
|---|---|---|---|---|---|---|---|---|---|---|---|---|---|---|---|---|
| | (in thousands) | |||||||||||||||
| Statement of Operations | ||||||||||||||||
| Investment income | $ | 27,320 | (1) | $ | — | $ | — | $ | — | $ | 27,320 | |||||
| Management fees | (1,800 | ) | — | 1,800 | — | — | ||||||||||
| Residual equity return | — | 2,000 | — | (2,000 | ) | — | ||||||||||
| Total revenues | 25,520 | 2,000 | 1,800 | (2,000 | ) | 27,320 | ||||||||||
Interest expense | 22,820 | (2) | — | — | — | 22,820 | ||||||||||
| Operating expenses | 700 | — | — | — | 700 | |||||||||||
| Total expenses | 23,520 | — | — | — | 23,520 | |||||||||||
| Pre-tax income | $ | 2,000 | $ | 2,000 | $ | 1,800 | $ | (2,000 | ) | $ | 3,800 | |||||
| Balance Sheet | ||||||||||||||||
| Cash | $ | 2,000 | $ | (20,000 | ) | $ | 1,800 | $ | — | $ | (16,200 | ) | ||||
| Fixed maturity securities | 400,000 | 22,000 | — | (22,000 | ) | 400,000 | ||||||||||
| Total assets | $ | 402,000 | $ | 2,000 | $ | 1,800 | $ | (22,000 | ) | $ | 383,800 | |||||
Long term debt | $ | 380,000 | $ | — | $ | — | $ | — | $ | 380,000 | ||||||
| Total liabilities | 380,000 | — | — | — | 380,000 | |||||||||||
| Equity | 22,000 | 2,000 | 1,800 | (22,000 | ) | 3,800 | ||||||||||
| Total liabilities and equity | $ | 402,000 | $ | 2,000 | $ | 1,800 | $ | (22,000 | ) | $ | 383,800 | |||||
- (1)
- Based on a hypothetical investment rate of LIBOR + 2%.
- (2)
- Based on a hypothetical liability cost of LIBOR + 1%.
This presentation is proper from a U.S. GAAP reporting perspective. When management considers the financial performance of the CDO in relation to the economic benefit to the Company, management considers the income that the CDO generates in the following two component parts:
| | After One Year | ||
|---|---|---|---|
| | (in thousands) | ||
| Management fees | $ | 1,800 | |
| Residual equity return | 2,000 | ||
| Total revenues | 3,800 | ||
| Total expenses | — | ||
| Pre-tax Income | $ | 3,800 | |
These line items, however, do not appear in our financial statements because of the U.S. GAAP rules of consolidation.
81
Conversely, if we were to close the same hypothetical CDO, but only purchase 10% of the equity, we would not be deemed the primary beneficiary and therefore would not be required to consolidate. Our balance sheet on the date of closing would then include the following:
| | At Closing | |||
|---|---|---|---|---|
| | (in thousands) | |||
| Cash | $ | (2,000 | ) | |
| Fixed maturity securities | 2,000 | |||
| Total assets | — | |||
Total liabilities | — | |||
| Equity | — | |||
| Total liabilities and equity | — | |||
After one year, assuming the same return rates as in the consolidated example, our statement of operations would include the following from this CDO:
| | After One Year | ||
|---|---|---|---|
| | (in thousands) | ||
| Fee income | $ | 1,800 | |
| Investment income | 200 | ||
| Total revenues | 2,000 | ||
Total expenses | — | ||
| Pre-tax income | $ | 2,000 | |
We would view the component parts of this CDO as follows:
| | After One Year | ||
|---|---|---|---|
| | (in thousands) | ||
| Management fees | $ | 1,800 | |
| Equity return | 200 | ||
| Total revenues | 2,000 | ||
Total expenses | — | ||
| Pre-tax income | $ | 2,000 | |
Management evaluates the revenue generation of our CDO business on an unconsolidated basis as an alternative measure since management believes it is important to evaluate the revenue associated with each aspect of the business that relates to our investment or our contractual rights to payment and exclude those revenues that relate to other investors' economic rights. The table below sets forth the economic impact of our CDOs assuming all CDOs were unconsolidated for the years ended December 31, 2005, 2004 and 2003 and the six months ended June 30, 2006 and 2005. Investors should
82
not place undue reliance on this presentation or use it as a substitute for our segment financial statements which are prepared in accordance with U.S. GAAP.
| | Six months ended June 30, | Year ended December 31, | ||||||||||||||
|---|---|---|---|---|---|---|---|---|---|---|---|---|---|---|---|---|
| | 2006 | 2005 | 2005 | 2004 | 2003 | |||||||||||
| | (in thousands, except where otherwise noted) | |||||||||||||||
| Assets under management (in millions) | $ | 12,120 | $ | 8,440 | $ | 9,907 | $ | 7,798 | $ | 5,830 | ||||||
| Management and other fees(1) | 12,176 | 8,683 | $ | 19,729 | $ | 14,143 | $ | 8,486 | ||||||||
| Warehouse and structuring fees(2) | 4,587 | 1,783 | 3,161 | 2,135 | 5,236 | |||||||||||
| Equity returns(3) | 10,421 | 7,620 | 12,885 | 5,487 | 8,143 | |||||||||||
| CDO asset management revenue, unconsolidated basis | $ | 27,184 | $ | 18,086 | $ | 35,775 | $ | 21,765 | $ | 21,865 | ||||||
Reconciliation to CDO Asset Management pre-tax income: | ||||||||||||||||
| CDO asset management revenue, unconsolidated basis | $ | 27,184 | $ | 18,086 | $ | 35,775 | $ | 21,765 | $ | 21,865 | ||||||
| Net realized and unrealized gains (losses) on CDO related derivatives(4) | 5,281 | 2,814 | 4,164 | 15,668 | 10,427 | |||||||||||
| Allocated investment income(5) | 985 | 1,253 | 2,690 | 1,702 | 1,327 | |||||||||||
| Allocated expenses(5)(5a) | (9,276 | ) | (6,666 | ) | (16,297 | ) | (16,750 | ) | (14,122 | ) | ||||||
| Allocated interest expenses(5)(5b) | (2,283 | ) | (1,680 | ) | (3,556 | ) | (2,050 | ) | (830 | ) | ||||||
| Allocated depreciation(5)(5c) | (360 | ) | (260 | ) | (636 | ) | (1,076 | ) | (1,209 | ) | ||||||
| Allocated realized (losses) gains(5)(5d) | (101 | ) | (42 | ) | (115 | ) | 58 | 658 | ||||||||
| Interest expense—operating(6) | (3,617 | ) | (3,133 | ) | (5,855 | ) | (3,802 | ) | (2,572 | ) | ||||||
| Minority interest (mark to market portion)(7) | (529 | ) | (161 | ) | (468 | ) | 1,200 | — | ||||||||
| Other | 40 | (140 | ) | 248 | 311 | (377 | ) | |||||||||
| Total CDO Asset Management pre-tax income—U.S. GAAP | $ | 17,324 | $ | 10,071 | $ | 15,950 | $ | 17,026 | $ | 15,167 | ||||||
- (1)
- Represents the sum of management fees for all CDOs paid by CDO entities to ACA Management, LLC, whether the CDO is consolidated or unconsolidated. For CDOs that we consolidate, management fees are eliminated from our consolidated financial statements.
- (2)
- Represents fees received during or at the end of the warehouse, or asset accumulation, phase of the CDO.
- (3)
- Represents the return on our CDO equity investments. For consolidated CDOs, this is based on the investment income of the CDO less direct interest expense, direct realized losses, operating expenses, amortization expense and management fees. For unconsolidated CDOs, equity return is the amount of income recorded on the related unconsolidated investment.
- (4)
- Represents the sum of net unrealized gains and losses included in net insured credit swap revenue, net realized and unrealized gains (losses) on derivative instruments and other net credit swap revenue. See tables on pages 52, 58 and 65 for a description of the calculation of the net unrealized gains (losses) included in net insured credit swap revenue; pages 54, 60 and 67 for a description of the calculation of the net unrealized gains (losses) included in net realized and unrealized gains (losses) on derivative instruments and pages 54, 60 and 67 for a description of the calculation of the net unrealized gains (losses) included in other net credit swap revenue. This adjustment (subtracts) adds back mark to market gains (losses) on derivatives and realized gains (losses) on warehouse facilities because they represent non-cash adjustments that are expected to reverse themselves over time as the related contracts mature or expire. In 2005, the realized loss on our synthetic equity in the amount of $3.3 million is included as a reduction of our equity return in that year, since it represented a cash loss that will not be recovered and, accordingly, is excluded from this adjustment.
- (5)
- Represents adjustments for the investment income and expenses which are allocated to the CDO Asset Management segment but do not relate to the direct economics of our managed CDOs.
- (5a)
- Direct expenses of our consolidated CDOs are included above as a reduction of our equity return and include items such as ongoing rating agency CDO expenses, trustee fees, accounting fees, etc. Direct expenses equal total segment expense less allocated amounts. Direct CDO expenses were $2.7 million, $2.1 million and $2.1 million for the years ended December 31, 2005, 2004 and 2003, respectively and $1.1 million and $1.1 million for the six months ended June 30, 2006 and 2005,
83
- (5b)
- Represents a portion of our corporate debt interest expense allocated to this business line. This allocated interest expense, combined with CDO debt-operating and CDO debt-non-recourse, equals total segment interest expense. See the tables related to "interest expense" on pages 53, 58 and 64.
- (5c)
- Represents a portion of corporate depreciation and amortization expense allocated to this business line. Direct amortization of debt issuance costs of consolidated CDOs is included above as a reduction of equity returns (see note 3 above) and totaled $7.0 million, $5.1 million and $2.8 million for the years ended December 31, 2005, 2004 and 2003, respectively and $3.7 million and $3.4 million for the six months ended June 30, 2006 and 2005, respectively.
- (5d)
- Represents a portion of our corporate realized (losses) gains allocated to this business line. Direct realized losses including impairments were $1.8 million, $6.4 million and $1.5 million for the years ended December 31, 2005, 2004 and 2003, respectively and $1.9 million and $0.9 million for the six months ended June 30, 2006 and 2005, respectively. These direct realized losses are included above as a reduction of our equity return.
respectively. When we consider the results related to our managed CDOs, allocated expenses are excluded and must be added back in order to reconcile to segment based income before taxes.
- (6)
- Represents interest expense incurred in connection with the financing of our equity purchases. See the tables related to "interest expense" on pages 53, 58 and 64. We view these costs as indirect costs of our CDO Asset Management business and exclude them when we consider direct results of this segment. Therefore, management subtracts them to arrive at segment income before taxes.
- (7)
- Represents the minority interest portion of net unrealized gains (losses) on derivatives for two consolidated CDOs in which we own less than 100% of the equity. We exclude this item when we examine the results related to our managed CDOs.
Comparison of Six Months Ended June 30, 2006 and June 30, 2005
CDO assets under management increased to $12.1 billion at June 30, 2006 compared to $8.4 billion at June 30, 2005.
Net Insured Credit Swap Revenue. Our CDO Asset Management business receives insured credit swap premiums from the two synthetic CDOs we closed in 2003 and 2002 in which our insurance subsidiary, ACA Financial Guaranty, insured the equity tranche of each CDO. Insured credit swap premium received for the six months ended June 30, 2006 was $2.2 million compared with $1.9 million for the six months ended June 30, 2005, an increase of $0.3 million. Net insured credit swap revenue includes net unrealized gains and losses related to fair value adjustments on these insured credit swaps required by FAS 133. With respect to our insured credit swaps included in our CDO Asset Management line of business, for the first six months of 2006, we recorded a net unrealized loss. This occurred because as of June 30, 2006, our insured credit swap equity transactions were in a net gain position. As they approach expiration, the net gains reverse, resulting in net unrealized losses.
Net Investment Income. Net investment income for the six months ended June 30, 2006 was $148.6 million compared with $106.1 million for the six months ended June 30, 2005, an increase of $42.5 million. This increase was primarily due to rising short-term rates, namely one and three month LIBOR, which increased the yield on our variable rate CDO assets under management.
Net Realized Gains (Losses) on Investments. Net realized losses on investments for the six months ended June 30, 2006 were $2.0 million compared with $0.9 million for the six months ended June 30, 2005, an increase of $1.1 million. Our net realized losses for the six months ended June 30, 2006 and June 30, 2005 include the result of consolidated CDO net losses from other than temporary impairments of $1.1 million and $0.4 million, respectively.
Net Realized and Unrealized Gains (Losses) on Derivative Instruments. Net realized and unrealized gains on derivative instruments for the six months ended June 30, 2006 were a gain of $6.1 million compared to a gain of $4.0 million for the six months ended June 30, 2005, an increase of $2.1 million. Our net unrealized gains on derivatives are the result of the valuation of derivative contracts, including interest rate swaps and interest rate caps. Higher interest rates caused valuation gains on the interest rate swaps and caps underlying the consolidated CDOs. With respect to interest rate swaps, prior to July 1, 2005, the Company had not met the documentation standards to achieve cash flow hedge
84
accounting as required by FAS 133. As a result, these derivative contracts were not designated as cash flow hedges and the associated mark to market adjustments were included in the Company's statement of operations. Subsequent to July 1, 2005, the documentation standards were met and these derivative contracts were redesignated as cash-flow hedges. After that date, the highly effective portion of these hedges is included in accumulated other comprehensive income.
Other Net Credit Swap Revenue. Other net credit swap revenue for the six months ended June 30, 2006 was $5.6 million compared with $2.5 million for the six months ended June 30, 2005, an increase of $3.1 million. Approximately $5.3 million and $3.5 million of the credit swap revenue in each of the periods in 2006 and 2005, respectively, is attributable to fees from a partially funded consolidated synthetic CDO in which the underlying assets are credit swaps. The increase in 2006 was attributable to two synthetic equity CDO transactions in which we received residual equity distributions in a total amount of $1.6 million for the six months ended June 30, 2006 compared to $0 for the six months ended June 30, 2005. Also included in this item are net unrealized gains and losses arising from fair value adjustments on those credit swaps required to be recorded by FAS 133. Net unrealized gains (losses) were recorded in the amount of $0.3 million and $(1.0) million for the six months ended June 30, 2006 and 2005, respectively.
Fee and Other Income. Other revenues for the six months ended June 30, 2006 were $10.7 million compared with $4.4 million for the six months ended June 30, 2005, an increase of $6.3 million. This increase was primarily the result of increased asset management, structuring and warehousing fees related to the structuring and management of five CDOs completed in 2005 and 3 CDOs completed in the first six months of 2006.
Operating Expenses. Operating expenses for the six months ended June 30, 2006 were $10.2 million compared with $7.8 million for the six months ended June 30, 2005, an increase of $2.4 million.
Interest Expense. Interest expense for the six months ended June 30, 2006 was $137.4 million compared with $95.5 million for the six months ended June 30, 2005, an increase of $41.7 million. This increase was primarily the result of rising short-term interest rates, namely one and three month LIBOR, over the course of 2005 and 2006. Interest expense also included interest expense on debt incurred to finance our CDO equity investments.
Depreciation and Amortization. Depreciation and amortization expenses for the six months ended June 30, 2006 were $4.0 million compared with $3.7 million for the six months ended June 30, 2005, an increase of $0.3 million. This increase was primarily the result of increased amortization of capitalized debt issuance costs.
(Income) of Minority Interest. The income of minority interest for the six months ended June 30, 2006 was $(2.2) million compared with income of minority interest of $(1.7) million for the six months ended June 30, 2005, an increase of $0.5 million. (Income) or loss of minority interest results from the fact that we consolidate two CDOs in which we own less than 100% of the equity. Minority interest reflected in the statement of operations represents the third party ownership interest in the (income) or loss of the CDO. In the first six months of 2006 and 2005, the two CDOs recognized net income and as a result we recorded minority interest (income) to reduce our net income.
Income Before Provision for Income Taxes. Income before income taxes for the six months ended June 30, 2006 was $17.3 million compared with $10.1 million for the six months ended June 30, 2005, an increase of $7.2 million.
Comparison of Years Ended December 31, 2005 and December 31, 2004
CDO assets under management increased to $9.9 billion at December 31, 2005 compared to $7.8 billion at December 31, 2004.
85
Net Insured Credit Swap Revenue. Our CDO Asset Management business receives insured credit swap premiums from the two synthetic CDOs we closed in 2003 and 2002 in which our insurance subsidiary, ACA Financial Guaranty, insured the equity tranche, or first loss layer of each CDO. Insured credit swap premium for the year ended December 31, 2005 was $4.1 million compared with $3.4 million for the year ended December 31, 2004, an increase of $0.7 million. Net insured credit swap revenue includes net unrealized gains and losses related to fair value adjustments on these insured credit swaps as required by FAS 133. In 2005, a widening of credit spreads caused valuation losses on our insured credit swaps included in our CDO Asset Management business line. In 2004, we recognized valuation gains with respect to our insured credit swaps as a result of the general tightening of credit spreads.
Net Investment Income. Net investment income for the year ended December 31, 2005 was $236.6 million compared with $114.8 million for the year ended December 31, 2004, an increase of $121.8 million. This increase was primarily due to the full year effect of earnings on consolidated CDO assets added in the fourth quarter of 2004, as well as rising short-term rates. We earned $233.9 million of investment income for the year ended December 31, 2005 on consolidated CDO assets as compared with $113.1 million for the year ended December 31, 2004. The balance of our net investment income, $2.7 million in 2005 and $1.7 million in 2004, is the allocated portion of the net investment income from our non-VIE investment portfolio.
Net Realized Losses on Investments. Net realized losses on investments for the year ended December 31, 2005 were $2.0 million compared with $6.3 million for the year ended December 31, 2004, a decrease of $4.3 million. Our net realized losses for the year ended December 31, 2005 and December 31, 2004 were primarily the result of consolidated CDO net losses from other than temporary impairments of $2.0 million and $6.9 million, respectively.
Net Realized and Unrealized Gains on Derivative Instruments. Net realized and unrealized gains on derivative instruments for the year ended December 31, 2005 were a gain of $8.4 million compared to a gain of $6.5 million for the year ended December 31, 2004, an increase of $1.9 million. Our net unrealized gains on derivatives are the result of the valuation of certain derivative contracts, including interest rate swaps, interest rate caps and warehouse facility forward purchase commitments. Higher interest rates caused valuation gains on the interest rate swaps and caps underlying the consolidated CDOs.
The $0.6 million realized loss on warehouse facilities primarily resulted from the termination of warehouse arrangements at the time of closing of two consolidated CDOs in 2004. This loss was the result of lower asset market values at the time that these CDOs closed relative to the acquisition values at which the assets were placed into the warehouse facility, while the unrealized loss of $0.6 million on warehouse facilities was based on the change in the valuation of warehoused assets prior to closing.
Other Net Credit Swap Revenue. Other net credit swap revenue for the year ended December 31, 2005 was $4.2 million compared with $11.0 million for the year ended December 31, 2004, a decrease of $6.8 million. Substantially all of the other net credit swap revenue in 2005 and 2004 was the result of fees paid on our one partially funded consolidated synthetic CDO in which the underlying assets are credit swaps. Other net credit swap revenue also includes realized gains and losses, if any, and unrealized gains and losses arising from fair value adjustments on those credit swaps required to be recorded by FAS 133. Net unrealized gains (losses) from changes in fair value to the credit swaps included in this CDO were $(1.2) million and $2.2 million for the years ended December 31, 2005 and 2004, respectively. In 2005, a realized loss of $3.3 million was incurred as a result of a credit event in a single credit swap. No such losses were realized in 2004.
Fee and Other Income. Other revenues for the year ended December 31, 2005 were $10.4 million compared with $5.2 million for the year ended December 31, 2004, an increase of $5.2 million. This
86
increase was primarily the result of increased asset management, structuring and warehousing fees related to the structuring and management of five CDOs completed in 2005.
Operating Expenses. Operating expenses for the year ended December 31, 2005 were $19.0 million compared with $18.9 million for the year ended December 31, 2004, an increase of $0.1 million.
Interest Expense. Interest expense for the year ended December 31, 2005 was $212.1 million compared with $99.9 million for the year ended December 31, 2004, an increase of $112.2 million. This increase was a result of the full year effect of payments on consolidated CDO liabilities added in the fourth quarter of 2004 and the impact of rising short-term interest rates over the course of 2005. Interest expense also included interest expense on debt incurred to finance our CDO equity investments. We had $116.2 million of debt related to the financing of CDO equity and the allocation of interest payments in 2005 on debt issued to four trust preferred vehicles, and in 2004 on the debt issued to three trust preferred vehicles.
Depreciation and Amortization. Depreciation and amortization expenses for the year ended December 31, 2005 were $7.7 million compared with $6.2 million for the year ended December 31, 2004, an increase of $1.5 million. This increase was primarily the result of the full year of expense amortization related to the capitalized debt issuance costs of two consolidated CDOs closed in 2004.
(Income) Loss of Minority Interest. The minority interest (income) for the year ended December 31, 2005 was $(3.7 million) compared with a minority interest loss of $0.5 million for the year ended December 31, 2004, a decrease of $4.2 million. Minority interest (income) or loss results from the fact that we consolidate two CDOs in which we own less than 100% of the equity. Minority interest on the statement of operations represents the share of the (income) or loss of the CDO that represents the third party equity ownership interests. In 2005, the two CDOs recognized net income and as a result we recorded minority interest (income) to reduce our net income. Conversely, in 2004, on a net basis, the two CDOs recorded a loss due to the termination of their associated warehouse facilities at a time when the valuation of the assets were less than the acquisition costs of such assets. As a result, we recorded minority interest loss in 2004 which increased our net income.
Income Before Income Taxes. Income before income taxes for the year ended December 31, 2005 was $16.0 million compared with $17.0 million for the year ended December 31, 2004, a decrease of $1.0 million.
Comparison of Years Ended December 31, 2004 and December 31, 2003
CDO assets under management increased to $7.8 billion at December 31, 2004 from $5.8 billion at December 31, 2003.
Net Insured Credit Swap Revenue. Our CDO Asset Management business receives insured credit swap premiums from the two synthetic CDOs we closed in 2003 and 2002 in which our insurance subsidiary, ACA Financial Guaranty, insured the equity tranche, or first loss layer of each CDO. Insured credit swap premium received for the year ended December 31, 2004 was $3.4 million compared with $2.1 million for the year ended December 31, 2003, an increase of $1.3 million. This difference occurred because one synthetic CDO closed in July 2003 and in 2004 we realized a full year of revenue on that transaction. Net insured credit swap revenue also includes realized gains and losses, if any, and net unrealized gains and losses from changes in fair values of the related insured credit swaps. No realized gains or losses were recognized in 2004 and 2003, and in 2004 we recognized valuation, or unrealized, gains with respect to our insured credit swaps. The general tightening of credit spreads caused a portion of the gain. In 2003, valuation, or unrealized, gains were recorded for our insured credit swaps due to the tightening of credit spreads over the course of the year.
Net Investment Income. Net investment income for the year ended December 31, 2004 was $114.8 million compared with $44.0 million for the year ended December 31, 2003, an increase of $70.8 million. This increase was primarily due to the closing of two additional consolidated CDOs in
87
2004, coupled with the full year effect of earnings on the assets of three CDOs closed and consolidated in 2003 and rising short-term interest rates. We earned $113.1 million of investment income for the year ended December 31, 2004 on consolidated CDO assets as compared with $42.7 million in 2003. The balance of our net investment income, $1.7 million in 2004 and $1.3 million in 2003, is the allocated portion of the net investment income from our non-VIE investment portfolio.
Net Realized and Unrealized Gains on Derivative Instruments. Net realized and unrealized gains on derivative instruments for the year ended December 31, 2004 were a gain of $6.5 million compared with $9.1 million for the year ended December 31, 2003, a decrease of $2.6 million. Our net unrealized gains (losses) on derivatives are the result of the valuation of certain derivative contracts, including interest rate swaps, interest rate caps and warehouse facility forward purchase commitments.
Rising interest rates in 2004 caused valuation gains on our interest rate swaps and caps. The $0.6 million realized loss on warehouse facilities primarily resulted from the termination of warehouse arrangements at the time of closing of two consolidated CDOs in 2004. This loss was the result of lower asset market values at the time that these CDOs closed relative to the acquisition values at which the assets were placed into the warehouse facility, while the unrealized loss of $0.6 million on warehouse facilities was based on the change in the valuation of warehoused assets prior to closing. The $4.3 million gain in 2003 on warehouse facilities primarily resulted from the valuation of warehouse arrangements that existed during the year. This gain was the result of higher asset market values during the warehouse phase relative to the acquisition values of the underlying assets when they were placed into the warehouse facility.
Other Net Credit Swap Revenue. Other net credit swap revenue for the year ended December 31, 2004 was $11.0 million compared with $10.9 million for the year ended December 31, 2003, an increase of $0.1 million. No realized gains or losses were recognized in 2004 and 2003. Net unrealized gains included in other net credit swap revenue are $2.2 million and $0.1 million for the years ended December 31, 2004 and 2003, respectively.
Other Revenues. Other revenues for the year ended December 31, 2004 were $5.2 million compared with $7.8 million for the year ended December 31, 2003, a decrease of $2.6 million. This decrease was primarily driven by the decreased amount of warehousing fees earned in 2004 due to closing two fewer CDOs in 2004 as compared to 2003.
Operating Expenses. Operating expenses for the year ended December 31, 2004 were $18.9 million compared with $16.2 million for the year ended December 31, 2003, an increase of $2.7 million. This change resulted from an increase in the employee compensation and other related overhead expenses in support of our CDO Asset Management business.
Interest Expense. Interest expense for the year ended December 31, 2004 was $99.9 million compared with $38.8 million for the year ended December 31, 2003, an increase of $61.1 million. This increase was primarily due to the closing of two additional consolidated CDOs in 2004, coupled with the full year effect of interest payments on the liabilities of three CDOs closed and consolidated in 2003 and the impact of rising short term interest rates over the course of 2004. Interest expense also included the allocation of interest payments on debt issued to three trust preferred vehicles.
Depreciation and Amortization. Depreciation and amortization expenses for the year ended December 31, 2004 were $6.2 million compared with $4.0 million for the year ended December 31, 2003, an increase of $2.2 million. The increase was due to the addition of two consolidated CDOs in 2004 and the full year impact of a consolidated CDO that closed in November 2003.
(Income) Loss of Minority Interest. The minority interest loss for the year ended December 31, 2004 was $0.5 million. Minority interest (income) or loss results from the fact that we consolidate two CDOs in which we own less than 100% of the equity. Minority interest on the statement of operations represents the share of the (income) or loss of the CDO that represents the third party equity
88
ownership interests. In 2004, on a net basis, the two CDOs recorded losses due to the termination of their associated warehouse facilities. As a result, we recorded minority interest loss in 2004 which increases our net income. There was no minority interest (income) loss in 2003, as we owned 100% of the equity in all consolidated CDOs in that year.
Income Before Income Taxes. Income before income taxes for the year ended December 31, 2004 was $17.0 million compared with $14.9 million for the year ended December 31, 2003, an increase of $2.1 million.
Other
Other consists of insurance businesses in which we are no longer active. Those businesses include industry loss warranty transactions, trade credit reinsurance and insurance of securitized manufactured housing bonds. For the six months ended June 30, 2006, we recognized total revenues of $2.8 million compared to $5.6 million for the same period in 2005. This decline is expected since the transactions are expiring or approaching expiration. For the year ended December 31, 2005, we recognized total revenues of $10.1 million compared to $11.9 million in 2004 and $7.3 million in 2003. Revenue principally consists of earned premium and allocated investment income.
For the six months ended June 30, 2006, total expenses of $1.3 million were recorded compared to $3.2 million for the same period in 2005. In 2005, total expenses including losses incurred of $6.6 million were recorded. Losses incurred include the increase in loss provision of $3.4 million to the $20.3 million case reserve established in 2004 for a portfolio of insured securitized manufactured housing bonds and $3.2 million in expected losses for the trade credit portfolio. Included in operating expenses in 2005 is a $3.7 million provision for a legal reserve established in connection with litigation involving a former executive of ours. This litigation concluded in May 2006 and all judgments have been paid.
In 2004, total expenses were $47.9 million including losses incurred of $42.3 million. The vast majority of losses incurred resulted from claims activity in connection with the industry loss warranty transactions of $21.0 million and probable losses on a portfolio of insured securitized manufactured housing bonds totaling $20.3 million. The loss incurred in 2004 for the insured securitized manufactured housing bonds was based on an increase in the rate of delinquencies observed in the mortgages underlying each of the related securitizations. The industry loss warranty losses were excess of loss contracts that had losses related to the effects of extreme hurricane activity in 2004. Losses paid in connection with this business were $10.0 million in 2005 and $11.0 million in 2004.
In 2003, total expenses were $3.5 million, including losses incurred of $1.8 million.
89
In managing our business and assessing its growth and profitability from a strategic and financial planning perspective, management and our Board of Directors considers our U.S. GAAP net income results as well as a measurement called net economic results. We believe that net economic results enhances the understanding of our results of operations by highlighting income attributable to our ongoing operating performance. However, net economic results is not a measurement of financial performance or liquidity under U.S. GAAP. It should not be considered in isolation or as a substitute for net income, cash flows from operating, investing or financing activities, or any other measure calculated in accordance with U.S. GAAP.
We define net economic results as net income excluding the after-tax effects of:
- •
- unrealized gains (losses) on derivatives included in:
- •
- net insured credit swap revenue;
- •
- net realized and unrealized gains (losses) on derivative instruments; and
- •
- other net credit swap revenue;
- •
- realized gains (losses) on non-CDO investments;
- •
- the portion of interest expense related to the principal payments on borrowings that were financed with derivatives; and
- •
- results from material non-financial guaranty businesses in which we no longer participate.
We exclude unrealized gains (losses) on derivatives because (i) they widely vary with changes in the credit market and interest rate environment and are not necessarily indicative of the performance of our underlying businesses and (ii) we intend to hold our positions to the derivative contracts' expiration, at which time the mark to market values would revert to zero, to the extent no realized derivative gains or losses had occurred. We exclude realized gains (losses) on non-CDO investments because our investment strategy is focused on the preservation of capital and generation of current income as opposed to the generation of trading gains and losses. We also exclude a portion of interest expense on borrowings that were financed with interest rate swaps to pay the upfront issuance costs of some of our consolidated CDOs. FAS 133 requires that all payments made under the interest rate swaps, representing both principal and interest, be recorded as interest expense. In order to approximate our economic expense on these borrowings, we exclude the portion of interest expense related to what would be principal payments if these borrowings had been financed with debt obligations. Lastly, we also exclude losses from material non-financial guaranty businesses in which we no longer participate since this is not representative of our underlying business. In 2004 we incurred losses from industry loss warranty transactions, which is not a credit risk line of business, in which all of our exposure has expired. By excluding these figures, net economic results provide a useful, and we believe more meaningful, alternative view of long-term trends in our profitability.
For the six months ended June 30, 2006 and 2005, we had $(0.8) million and $(3.8) million of unrealized gains (losses), respectively, on insured credit swaps included in net insured credit swap revenue. For the six months ended June 30, 2006 and 2005, we had $3.7 million and $2.5 million of unrealized gains (losses), respectively, on our derivatives included in net realized and unrealized gains (losses) on derivative instruments. For the six months ended June 30, 2006 and 2005, we had $0.2 million and $(0.7) million of unrealized gains (losses), respectively, on our credit swaps included in other net credit swap revenue. For the six months ended June 30, 2006 and 2005, we had realized gains (losses) of $(0.8) million and $(0.2) million, respectively, on our non-CDO investments. For the six months ended June 30, 2006 and 2005, we had $2.0 million and $2.2 million of expenses, respectively, which effectively constituted principal payments on our interest rate swaps.
In the years ended December 31, 2005, 2004 and 2003, we had $(3.7) million, $4.0 million and $1.2 million of after-tax unrealized gains (losses), respectively, on our insured credit swaps included in net insured credit swap revenue. In the years ended December 31, 2005, 2004 and 2003, we had
90
$5.2 million, $5.3 million and $5.6 million of after-tax unrealized gains, respectively, on our derivatives included in net realized and unrealized gains (losses) on derivative instruments. For the years ended December 31, 2005, 2004 and 2003, we had $(0.8) million, $1.4 million and $0.1 million of unrealized gains (losses), respectively, on our credit swaps included in other net credit swap revenue. In the years ended December 31, 2005, 2004 and 2003, we had realized gains (losses) of $(0.6) million, $(0.1) million and $2.6 million, respectively, on our non-CDO investments. In the years ended December 31, 2005, 2004 and 2003, we had $4.3 million, $4.3 million and $1.0 million of after-tax expenses, respectively, which effectively constituted principal payments on our interest rate swaps. Lastly, in the year ended December 31, 2004, we incurred losses of $21.0 million, or $13.7 million after tax, from material non-financial guaranty business in which we no longer participate.
LIQUIDITY AND CAPITAL RESOURCES
We are a holding company, and as such, have no direct operations of our own. Our liquidity, both on a short-term basis (for the next 12 months) and a long-term basis (beyond the next 12 months) is largely dependent upon the ability of our operating subsidiaries, which excludes our consolidated CDO entities, to pay dividends or make other payments to us and our ability to incur indebtedness and otherwise access the capital markets. Our outstanding indebtedness is described under "—Indebtedness." We may also incur additional indebtedness in the future to fund acquisitions, working capital, growth in our business or for other general corporate purposes. Our principal uses of liquidity are for the payment of interest on our debt and operating expenses. We also may require liquidity to make periodic capital investments in our operating subsidiaries. We do not currently intend to pay dividends. In the ordinary course of our business, we evaluate our liquidity needs and capital resources in light of holding company expenses and debt-related expenses, as well as rating agency considerations. Based on the amount of dividends we expect to receive from our subsidiaries, the proceeds from this offering and availability under our revolving credit facility, management believes that we will have sufficient liquidity to satisfy our needs over the next 12 months. Beyond the next 12 months, the ability of our operating subsidiaries to declare and pay dividends may be influenced by a variety of factors including market conditions, insurance and rating agencies regulations and general economic conditions. Consequently, although management believes that we will continue to have sufficient liquidity to meet our debt service and other obligations over the long term, we can not guarantee that we will not be required to seek external debt or equity financing in order to meet our operating expenses and debt service obligations.
We anticipate that a major source of our liquidity, for the next 12 months and for the longer term, will be amounts paid by our operating subsidiaries as dividends to us and our ability to access the capital markets. At June 30, 2006, approximately 90% of our assets on an unconsolidated basis represent our 100% ownership interest in ACA Financial Guaranty, our insurance subsidiary through which we operate all our lines of business. ACA Financial Guaranty is subject to restrictions under state insurance law on its ability to pay dividends until it has a positive earned surplus calculated on a SAP basis. See "Business—Regulation." As of June 30, 2006, ACA Financial Guaranty had negative unassigned surplus of $109.9 million. In May 2005, the Maryland Insurance Commissioner approved ACA Financial Guaranty's request to pay a dividend in an amount equal to the interest payments on $40 million of the $80 million of our trust preferred issuance outstanding through the year ended December 31, 2005. In addition, the Maryland Insurance Commissioner approved ACA Financial Guaranty's issuance of a $10 million surplus note to us. Accordingly, during 2005 ACA Financial Guaranty paid dividends of $2.1 million for the ultimate benefit of its parent, ACA Capital, and $0.5 million in interest on the surplus note. ACA Financial Guaranty paid no dividends in 2003 and 2004. In January 2006, ACA Financial Guaranty received approval from the Maryland Insurance Commissioner to make dividend payments to ACA Capital in an amount equal to the interest due in 2006 on $40 million of trust preferred debt, the proceeds of which were initially contributed by ACA Capital into ACA Financial Guaranty. The Maryland Insurance Commissioner also approved interest
91
payments by ACA Financial Guaranty on the $10 million surplus note in January 2006. We have not received dividends from our operating subsidiaries other than ACA Financial Guaranty.
If the rating agencies were to reduce ACA Financial Guaranty's financial strength rating to below the "A" category, we would be severely limited in our ability to insure additional municipal bonds or insure additional Structured Credit transactions. In addition, if the financial strength rating was reduced below "A-", we could be required to provide collateral in the form of cash or securities to back certain of our Structured Credit transactions. In the case of certain credit swaps, if the underlying portfolio deteriorates below a pre-agreed point, we are generally required to post collateral in an amount that is the lesser of the amount by which actual losses exceed this pre-agreed point and the amount of any negative mark to market value of the credit swap. If any of these events occurred, it could materially hurt our financial performance and liquidity and severely strain our capital resources. See "—Quantitative and Qualitative Disclosures About Market Risk."
We expect that the proceeds of this offering will permit us to continue to implement our business strategy. We expect our existing capital base and the associated earnings, along with the proceeds of this offering, to be sufficient to operate our business. However, we can give no assurance that we will not need to raise additional capital in the future.
Liquidity at our operating subsidiaries is used to pay operating expenses, claim payments and income taxes. Positive cash flow at ACA Financial Guaranty is only available to pay operating expenses of other operating subsidiaries subject to the approval of the Maryland Insurance Commissioner as described above. In addition, certain of our operating subsidiaries may be required to post collateral in connection with credit derivatives. We had $52.2 million of collateral posted related to four synthetic equity transactions in our CDO Asset Management and Structured Credit businesses as of June 30, 2006. On an ongoing basis, our sources of funds at our operating subsidiaries primarily result from premiums written, asset management fees, investment income and proceeds from the sale and redemption of investments. Cash is used primarily to pay losses and loss expenses, policy acquisition costs, other operating expenses and interest expenses. Our cash flow from operations generally represents the difference between premiums collected along with the investment income realized, and investment earnings realized and the losses and loss expenses paid, policy acquisition and other operating expenses and investment losses realized. Cash flow from operations may differ substantially from net income. To date, we have invested all cash flow that is not required for operating purposes. Management believes that our subsidiaries' operating needs generally can be met from operating cash flow.
See "—Indebtedness."
Cash Flows for the Six Months Ended June 30, 2006
For the six months ended June 30, 2006, we generated positive net operating cash flow of $38.2 million, primarily related to premiums written, insured credit swap revenue and investment income. During the same period, we had net proceeds from invested assets of $84.0 million. We had net cast outflows of $74.0 million related to financing activities, and as of June 30, 2006, had a cash balance of $222.7 million.
Cash Flows for the Six Months Ended June 30, 2005
For the six months ended June 30, 2005, we generated positive net operating cash flow of $31.9 million, primarily related to premiums written, insured credit swap revenue and investment income. During the same period, we invested a net cash amount of $184.4 million. We generated a net cash amount of $172.9 million through financing activities, and as of June 30, 2005, had a cash balance of $249.3 million.
In March 2005, one of our subsidiaries, ACA Parliament Funding, L.L.C, or ACA Parliament, entered into an agreement with an investment trust created by Bear, Stearns & Co. Inc., pursuant to which $99 million was deposited in a fund that is maintained and invested by ACA Parliament. ACA
92
Parliament is required to make quarterly interest payments at a rate equal to the three-month LIBOR plus 125 basis points and the maturity date of the note is 2010.
Cash Flows for the Year Ended December 31, 2005
In the year ended December 31, 2005, we generated positive net operating cash flow of $64.4 million, primarily related to premiums written, insured credit swap revenue and investment income. During the same period, we invested a net cash amount of $244.1 million. We generated a net cash amount of $125.1 million through financing activities, and as of December 31, 2005, had a cash balance of $174.4 million.
In March 2005, one of our subsidiaries, ACA Parliament Funding, L.L.C, or ACA Parliament, entered into an agreement with an investment trust created by Bear, Stearns & Co. Inc., pursuant to which $99 million was deposited in a fund that is maintained and invested by ACA Parliament. ACA Parliament is required to make quarterly interest payments at a rate equal to the three-month LIBOR plus 125 basis points and the maturity date of the note is 2010.
Cash Flows for the Year Ended December 31, 2004
In the year ended December 31, 2004, we generated a net operating cash inflow of $25.1 million, primarily relating to premiums written, insured credit swap revenue and investment income. During the same period, we invested a net cash amount of $2.1 billion. We generated a net cash amount of $2.1 billion through financing activities, and as of December 31, 2004 had a cash and cash equivalents balance of $228.9 million.
On December 29, 2004, we privately placed $20.0 million of trust preferred debt which was issued by a subsidiary trust holding $20.6 million aggregate principal amount of a 30-year subordinated note of ACA Capital Holdings. Net proceeds were $19.4 million. Through a surplus note approved by ACA Financial Guaranty's state of domicile, ACA Capital Holdings provided a $10 million capital infusion to ACA Financial Guaranty and used the remainder of the net proceeds for general corporate purposes.
Cash Flows for the Year Ended December 31, 2003
In the year ended December 31, 2003, we generated a net operating cash inflow of $66.0 million, primarily relating to premiums written, insured credit swap revenue and investment income. During the same period, we invested a net cash amount of $2.4 billion. We generated a net cash amount of $2.4 billion through financing activities, and as of December 31, 2003 had a cash and cash equivalents balance of $181.6 million.
On October 29, 2003, we privately placed $20.0 million of trust preferred debt which was issued by a subsidiary trust holding $20.6 million aggregate principal amount of a 30-year subordinated note of ACA Capital Holdings. Net proceeds were $19.4 million. ACA Capital Holdings provided a $10.0 million capital infusion to its direct subsidiary, ACA Financial Guaranty, and used the remainder of the net proceeds for general corporate purposes.
On May 15, 2003, we privately placed $20.0 million of trust preferred debt which was issued by a subsidiary trust holding $20.6 million aggregate principal amount of a 30-year subordinated note of ACA Capital Holdings. Net proceeds were $19.4 million. ACA Capital Holdings provided a $10.0 million capital infusion to its direct subsidiary, ACA Financial Guaranty, and used the remainder of the net proceeds for general corporate purposes.
Capital Expenditures
We did not make any significant capital expenditures for the six months ended June 30, 2006 or during the years ended December 31, 2005, 2004 and 2003. In 2006, we anticipate capital expenditures of approximately $2.0 million in connection with the establishment of our offices in the United Kingdom and Singapore.
93
Off-Balance Sheet Arrangements
We do not have any "off-balance sheet arrangements" (as such term is defined in Item 303 of Regulation S-K) that are reasonably likely to have a current or future effect on our financial condition, changes in financial condition, revenues or expenses, results of operations, liquidity, capital expenditures or capital resources. We do, however, have off-balance sheet exposure in the form of our financial guaranty exposure or par in force. Par in force at December 31, 2005 was $21.5 billion and includes exposure to Municipal Finance, Structured Credit and CDO Asset Management and other transactions in which ACA Financial Guaranty has issued insurance policies. Par in force at December 31, 2004, was $11.3 billion.
Contractual Obligations
The following table summarized our contractual obligations as of June 30, 2006(1):
| | Total | Less Than One Year | 1-3 Years | 4-5 Years | After 5 Years | ||||||||||||
|---|---|---|---|---|---|---|---|---|---|---|---|---|---|---|---|---|---|
| | (in thousands) | ||||||||||||||||
| Debt | |||||||||||||||||
| Corporate debt | $ | 79,899 | $ | — | $ | — | $ | — | $ | 79,899 | |||||||
| CDO debt—operating | 113,940 | — | 101,720 | — | 12,220 | ||||||||||||
| CDO debt—non-recourse, net of discounts(2) | 4,762,609 | 2,674,305 | 103,146 | — | 1,985,158 | ||||||||||||
| Total debt | 4,956,448 | 2,674,305 | 204,866 | — | 2,077,277 | ||||||||||||
| Lease obligations | 7,278 | 1,985 | 3,970 | 1,323 | — | ||||||||||||
| Loss reserves(3) | 37,244 | 2,166 | (2,655 | ) | 2,207 | 35,525 | |||||||||||
| Total | $ | 5,000,970 | $ | 2,678,456 | $ | 206,181 | $ | 3,530 | $ | 2,112,802 | |||||||
- (1)
- Does not include any potential borrowings under our new credit facility, described below under "—Indebtedness."
- (2)
- Represents debt incurred by our CDOs that are consolidated under U.S. GAAP that are without recourse to any assets other than those of the CDO.
- (3)
- The loss and loss adjustment expenses payments due by period in the table above are based upon the present value of loss and loss adjustment expenses estimates as of December 31, 2005 and are not contractual liabilities with specified times of payment. Our contractual liability is to provide benefits under our policies. As a result, our calculation of loss and loss adjustment expenses payments due by period is subject to the same uncertainties associated with determining the level of unpaid loss and loss adjustment expenses reserves generally and to the additional uncertainties arising from the difficulty of predicting when claims (including claims that have not yet been reported to us) will be paid. For a discussion of our unpaid loss and loss adjustment expenses reserves process, see "—Critical Accounting Policies and Estimates—Loss and Loss Adjustment Expenses." Actual payments of losses and loss adjustment expenses by period will vary, perhaps materially, from the above table to the extent that current estimates of loss and loss adjustment expenses vary from actual ultimate claims and amounts and as a result of variations between expected and actual payout patterns. See "Risk Factors—Risks Related to Our Business." Our failure to accurately set our loss reserves may result in having to increase our loss reserves or make payments in excess of our loss reserves, which could materially and adversely impact our financial condition.
Restricted Balances
Our insurance subsidiary, ACA Financial Guaranty, has assets on deposits with various regulatory authorities. At June 30, 2006, such assets on deposit were in the amount of $5.2 million. In connection with our CDO Asset Management and Structured Credit businesses, we had on deposit $52.2 million for the benefit of various counterparties. These funds revert back to us upon the expiration of the related risk and in certain instances may be used to pay losses should they be incurred. We also hold $1.9 million in collateral, through one of our consolidated CDOs, for the benefit of the CDO debt holders.
94
Indebtedness
Credit Facility
We entered into a credit agreement dated May 1, 2006 with J.P. Morgan Securities Inc., as Arranger, JPMorgan Chase Bank, N.A., as Administrative Agent, and the Lenders from time to time party thereto. The credit agreement provides for a 364-day senior unsecured revolving credit facility in an aggregate principal amount of up to $75 million.
We may borrow cash under the revolving credit facility bearing interest based on the London Inter Bank Offering Rate, or LIBOR, or the Alterative Base Rate, or ABR. The interest rate on loans borrowed and bearing interest at LIBOR, or LIBOR Loans, varies depending upon our ratio of debt to debt plus stockholders' equity, excluding all other comprehensive income, which we call the Leverage Ratio, and fluctuations in LIBOR. Any debt of a consolidated CDO is excluded from the numerator and dominator in calculating the Leverage Ratio. As of May 1, 2006 the applicable margin for LIBOR Loans was equal to 0.500% per annum. The applicable margin for loans borrowed and bearing interest at ABR is zero. We also have the right to solicit fixed or floating rate competitive bids for loans from members of the syndicate of lenders party to the credit agreement.
We also agreed to pay a facility fee payable quarterly in arrears and calculated as a percentage of the total commitments under the revolving credit facility. Such facility fee varies based on our Leverage Ratio and ranges between 0.100% up to 0.175% per annum. In addition, we also agreed to pay a utilization fee payable quarterly in arrears and at a rate of 0.125% per annum on the average daily amount of the outstanding principal under the revolving credit facility, but only payable whenever such outstanding principal amount exceeds 50% of the commitments under the revolving credit facility.
The facility's financial covenants require us to maintain (i) a minimum net worth set initially at 80% of our actual reported net worth, increased quarterly by 60% of net income, and increased by 60% of all new equity proceeds, (ii) a Leverage Ratio of not greater than 35%, and (iii) a minimum financial strength rating from S&P of "A-" for ACA Financial Guaranty. The facility also includes customary negative covenants including: limitations on liens, mergers, consolidations, liquidations and dissolutions, sales of assets, dividends and other payments to third parties in respect of our capital stock, transactions with affiliates, changes in fiscal year, debt incurred by our subsidiaries (but excluding non-recourse debt and certain wrapped debt), and changes in line of business. There are no prepayment penalties under the facility. We are in compliance with these covenants.
Trust Preferred Securities
We issued floating rate junior subordinated deferrable interest debentures, structured as trust preferred securities, of $20.6 million, $20.6 million, $20.6 million and $18.0 million on December 29, 2004, October 29, 2003, May 15, 2003, and December 4, 2002, respectively. The trust preferred debt securities have an initial stated term of 30 years with a call provision at five years from the date of each issuance. The current interest rates on the $79.9 million of outstanding trust preferred debt securities range from 8.68% to 9.27% at June 30, 2006. The effective interest rate of these securities is calculated based on three-month LIBOR plus a margin of 3.35% to 4.1% per annum subject to certain interest rate caps during the lives of the securities.
The indentures governing the debentures limit our ability to pay dividends and incur other indebtedness. Events of default under the indentures include failure to make timely principal or interest payments, continuation of a breach of the indentures 60 days after proper notice, bankruptcy, liquidation and dissolution.
Other Financings
In order to finance our purchase of a portion of the equity of our CDOs, we issue notes. These notes are debt obligations backed by our equity interest in the CDO and insured as to the repayment of principal and interest by ACA Financial Guaranty. The notes generally may be redeemed prior to
95
the scheduled maturity date at our option as issuer and collateral manager, or in connection with an event of default pursuant to indenture agreements.
In March 2005, one of our subsidiaries, ACA Parliament, entered into an agreement with an investment trust created by Bear, Stearns & Co. Inc., pursuant to which $99 million was deposited in a fund that is maintained and invested by ACA Parliament. ACA Parliament is required to make quarterly interest payments at a rate equal to the three-month LIBOR plus 125 basis points and the maturity date of the note is 2010. We will have to refinance this medium term note program upon maturity in 2010 since the maturity date is in advance of the maturity date of many of the assets acquired with the proceeds of such issuance.
Notes outstanding in connection with the financing of our equity purchases, including the medium term note, totaled $113.9 million at June 30, 2006 and $116.2 million at December 31, 2005.
INVESTMENT PORTFOLIO
As of June 30, 2006, our investment portfolio consisted of $5.2 billion of fixed maturity securities, of which $4.7 billion were from VIEs that we consolidate under FIN 46(R), $18.4 million from our unconsolidated CDOs and $536.7 million were held in our insurance company investment portfolio. The vast majority of our fixed maturity securities are designated as available for sale in accordance with FAS 115 "Accounting for Certain Investments in Debt and Equity Securities." The remaining fixed maturity securities are designated as part of a trading portfolio. These securities were purchased in connection with the launching of our credit opportunity fund (credit fund). The credit fund was created to leverage our expertise in the capital and credit markets and as an asset manager. The fund invests in fixed maturity securities, particularly in the asset-backed sector. The fund had assets under management of $25.0 million as of June 30, 2006, of which we had invested $16.4 million. The remaining $8.6 million was invested by third party investors. In addition to receiving a return on investment in the credit fund, we are paid a management fee to select and manage the assets of the fund. For accounting purposes, the credit fund is consolidated in our financial statements as of June 30, 2006 and its financial results are recorded in the Structured Credit line of business. Fixed maturity securities available for sale are reported at fair value in accordance with FAS 115, and the change in fair value is reported as part of accumulated other comprehensive income in stockholders' equity while changes in the fair value of trading securities are recorded in the income statement. Other than temporary impairments on our VIE and non-VIE investments are recorded in net income as realized losses.
The following table summarizes our investment portfolio as of June 30, 2006:
| | Amortized Cost | Gross Unrealized Gains | Gross Unrealized Losses | Estimated Fair Value | |||||||||
|---|---|---|---|---|---|---|---|---|---|---|---|---|---|
| | | (in thousands) | | ||||||||||
| Available for sale-non-VIE: | |||||||||||||
| U.S. treasury securities | $ | 33,597 | $ | — | $ | (1,262 | ) | $ | $32,335 | ||||
| Federal-agency securities | 70,782 | — | (2,501 | ) | 68,281 | ||||||||
| Obligations of sales and political subdivisions | 121,037 | 241 | (3,079 | ) | 118,199 | ||||||||
| Corporate securities | 116,248 | 19 | (5,589 | ) | 110,678 | ||||||||
| Asset-backed securities | 13,761 | — | (182 | ) | 13,579 | ||||||||
| Mortgage-backed securities | 146,582 | 10 | (6,864 | ) | 139,728 | ||||||||
| Total non-VIE securities | 502,007 | 270 | (19,477 | ) | 482,800 | ||||||||
| Available for sale VIE asset-backed securities | 4,684,804 | 37,153 | (15,508 | ) | 4,706,449 | ||||||||
| Total available for sale | 5,186,811 | 37,423 | (34,985 | ) | 5,189,249 | ||||||||
| Held for trading—Credit Fund | 3,468 | — | (20 | ) | 3,448 | ||||||||
| Total | 5,190,279 | 37,423 | (35,005 | ) | 5,192,697 | ||||||||
96
The amortized cost and estimated fair value of fixed maturity securities available for sale and held for trading as of June 30, 2006, by contractual maturity, are shown below. Expected maturities will differ from contractual maturities because borrowers may have the right to call or prepay obligations with or without penalties.
| | Non-VIE Securities | VIE Securities | Total | ||||||||||||||||
|---|---|---|---|---|---|---|---|---|---|---|---|---|---|---|---|---|---|---|---|
| | Amortized Cost | Estimated Fair Value | Amortized Cost | Estimated Fair Value | Amortized Cost | Estimated Fair Value | |||||||||||||
| | (in thousands) | ||||||||||||||||||
| Available for sale(1): | |||||||||||||||||||
| Due in one year or less | $ | 21,313 | $ | 21,158 | $ | — | $ | — | $ | 21,313 | $ | 21,158 | |||||||
| Due after one year through five years | 86,439 | 84,105 | 139,484 | 140,825 | 225,923 | 224,930 | |||||||||||||
| Due after five years through ten years | 157,064 | 150,982 | 367,750 | 371,751 | 524,814 | 522,733 | |||||||||||||
| Due after ten years | 237,192 | 226,555 | 4,177,569 | 4,193,873 | 4,414,761 | 4,420,428 | |||||||||||||
| Total available for sale | 502,008 | 482,800 | 4,684,803 | 4,706,449 | 5,186,811 | 5,189,249 | |||||||||||||
| Held for trading—Credit Fund(1): | |||||||||||||||||||
| Due after ten years | — | — | 3,468 | 3,448 | 3,468 | 3,448 | |||||||||||||
| Total | $ | 502,008 | $ | 482,800 | $ | 4,688,271 | $ | 4,709,897 | $ | 5,190,279 | $ | 5,192,697 | |||||||
- (1)
- Actual maturities could differ from contractual maturities because borrowers have the right to call or prepay certain obligations which may or may not include call or prepayment penalties.
Fair value of the fixed maturity securities is based upon quoted market prices provided by either independent pricing services or, when such prices are not available, by reference to broker or underwriter bid indications. For a detailed description of our valuation of investments, see "—Critical Accounting Policies and Estimates" above.
We review our investment portfolio on at least a quarterly basis for possible impairment losses. For additional information, see "—Critical Accounting Policies and Estimates" above.
The following table summarizes the ratings distributions of the fixed maturity securities in our investment portfolio as of June 30, 2006 and 2005 and the investment portfolio of our consolidated VIEs as of June 30, 2006 and December 31, 2005:
| | ||||||
|---|---|---|---|---|---|---|
| Rating(1) | June 30, 2006 | December 31, 2005 | ||||
| | (in thousands) | |||||
| AAA or equivalent | $ | 344,099 | $ | 344,383 | ||
| AA | 51,684 | 41,057 | ||||
| A | 51,901 | 58,884 | ||||
| BBB | 25,293 | 35,393 | ||||
| Below investment grade and non-rated | 9,823 | 8,057 | ||||
| Total non-VIE securities | 482,800 | 487,774 | ||||
| VIE securities | 4,706,449 | 4,810,965 | ||||
| Held for trading—Credit Fund | 3,448 | — | ||||
| Total | $ | 5,192,697 | $ | 5,298,739 | ||
- (1)
- Ratings are represented by the lower of the S&P and Moody's Investors Service classifications.
97
The following table summarizes the unrealized losses in our investment portfolio by type of security and the length of time such securities have been in a continuous unrealized loss position as of June 30, 2006:
| | Less than 12 months | 12 months or more | | | |||||||||||||||
|---|---|---|---|---|---|---|---|---|---|---|---|---|---|---|---|---|---|---|---|
| | Fair Value | Unrealized Loss | Fair Value | Unrealized Loss | Total Fair Value | Total Unrealized Loss | |||||||||||||
| | (in thousands) | ||||||||||||||||||
| Available for sale-non-VIE: | |||||||||||||||||||
| U.S. treasury securities | $ | 23,090 | $ | (941 | ) | $ | 9,245 | $ | (321 | ) | $ | 32,335 | $ | (1,262 | ) | ||||
| Federal-agency securities | 62,350 | (2,420 | ) | 5,931 | (81 | ) | 68,281 | (2,501 | ) | ||||||||||
| Obligations of states and political subdivisions | 69,563 | (1,700 | ) | 31,635 | (1,379 | ) | 101,198 | (3,079 | ) | ||||||||||
| Corporate securities | 72,435 | (3,950 | ) | 25,995 | (1,639 | ) | 98,430 | (5,589 | ) | ||||||||||
| Asset-backed securities | 9,764 | (131 | ) | 3,815 | (51 | ) | 13,579 | (182 | ) | ||||||||||
| Mortgage-backed securities | 60,198 | (3,279 | ) | 70,977 | (3,585 | ) | 131,175 | (6,864 | ) | ||||||||||
| Total non-VIE securities | 297,400 | (12,421 | ) | 147,598 | (7,056 | ) | 444,998 | (19,477 | ) | ||||||||||
| Available for sale-VIE—asset-backed securities | 784,715 | (8,286 | ) | 319,422 | (7,222 | ) | 1,104,137 | (15,508 | ) | ||||||||||
| Total | $ | 1,082,115 | $ | (20,707 | ) | $ | 467,020 | $ | (14,278 | ) | $ | 1,549,135 | $ | (34,985 | ) | ||||
The unrealized losses on the Company's investments were caused by interest rate increases. Because the decline in market value of these securities is attributable to changes in interest rates and not credit quality, and because the Company has the ability and intent to hold these investments until a recovery of fair value, which may be maturity, it does not consider these investments to be other-than-temporarily-impaired at June 30, 2006.
Included above are 454 fixed maturity securities, 216 in the non-VIE portfolios, and 238 in the VIE portfolios. At June 30, 2006, there are 4 fixed maturity securities whose amortized cost exceeded its respective fair value by greater than 20%. In addition, over 98% of these securities are rated investment grade in the non-VIE portfolios while 95% are rated investment grade in the VIE portfolios. Management has assessed these and other factors and concluded that there were no other than temporarily impaired fixed maturity securities included in the above table as of June 30, 2006.
NEW ACCOUNTING PRONOUNCEMENTS
In December 2004, the FASB issued FAS 123(R), "Share Based Payment." FAS 123(R) is a revision of FAS 123, "Accounting for Stock Based Compensation" and supersedes APB 25, "Accounting for Stock Issued to Employees." FAS 123(R) requires the Company to expense the fair value of employee stock options and other forms of stock-based compensation. Effective January 1, 2006, the Company adopted the requirements of FAS 123(R) using the prospective application as permitted by FAS 123(R). Accordingly, prior period amounts have not been restated. Under this application, the Company is required to record compensation expense for all awards granted after the date of adoption. Awards granted prior to the date of adoption of FAS 123(R) continue to be accounted for under APB 25, the Company's prior accounting method for stock based compensation. For the six months ended June 30, 2006, the Company recognized compensation expense under FAS 123(R) of $0.4 million.
In May 2005, the FASB issued FAS 154, "Accounting Changes and Error Corrections." This pronouncement changes the requirements for the accounting and reporting of a change in accounting principle. This statement applies to all voluntary changes in accounting principle as well as to changes required by an accounting pronouncement that does not include specific transition provisions. This statement eliminates the requirement in APB No. 20, "Accounting Changes," to include the cumulative effect of changes in accounting principle in the statement of operations in the period of change. Instead, to enhance the comparability of prior period financial statements, FAS 154 requires that changes in accounting principle be retroactively applied, with the cumulative effect of the accounting principle reflected as an asset or liability and an offsetting adjustment to retained earnings in the first period presented as if that accounting principle had always been used. Each subsequent period
98
presented is then adjusted to reflect the period specific effects of applying the change. The implementation of this statement did not have a material impact on our financial statements.
In November 2005, the FASB released Staff Position Nos. FAS 115-1 and FAS 124-1, "The Meaning of Other-Than-Temporary Impairment and Its Application to Certain Investments." This pronouncement addresses the determination as to when an investment is considered impaired, whether that impairment is other than temporary, and the measurement of an impairment loss. It also includes accounting considerations subsequent to the recognition of an other-than-temporary impairment and requires certain disclosures about unrealized losses that have not been recognized as other-than-temporary impairments. The implementation of this pronouncement did not have a material impact on our financial statements.
In September 2005, the AICPA issued Statement of Position, or SOP, 05-1, "Accounting by Insurance Enterprises for Deferred Acquisition Costs in Connection with Modifications or Exchanges of Insurance Contracts." SOP 05-1 provides guidance on accounting by insurance enterprises for deferred acquisition costs on internal replacements of many types of insurance and investment contracts, including those covered by FAS No. 60. Contract modifications meeting all of the conditions set out in SOP 05-1 result in a replacement contract that is substantially unchanged from the replaced contract and a contract that is accounted for as a continuation of the replaced contract, otherwise the modifications trigger accounting as if the original contract was extinguished and replaced by a new contract, with unamortized deferred acquisition costs, unearned revenue liabilities and deferred sales inducements associated with the original contract recognized currently in income. The implementation of this pronouncement did not have a material impact on our financial statements.
In February 2006, the FASB issued FAS 155, "Accounting for Certain Hybrid Financial Instruments," an amendment of FAS 133 and 140. FAS 155 (i) permits fair value remeasurement for any hybrid financial instrument that contains an embedded derivative that otherwise would require bifurcation, (ii) clarifies which interest-only strips and principal-only strips are not subject to the requirements of FAS 133, (iii) clarifies that concentrations of credit risk in the form of subordination are not embedded derivatives and, (iv) amends FAS 140 to eliminate the exemption from applying the requirements of FAS 133 on a qualifying special-purpose entity from holding a derivative financial instrument that pertains to a beneficial interest other than another derivative financial instrument. FAS 155 is effective for all financial instruments acquired or issued after the beginning of an entity's first fiscal year that begins after September 15, 2006. Management will implement the requirements of FAS 155 after its effective date, as applicable. Since this guidance is applicable to future transactions, its effect on the financial statements cannot be estimated.
In March 2006, the FASB issued FAS 156, "Accounting for Servicing of Financial Assets," an amendment of FAS No. 140, "Accounting for Transfers and Servicing of Financial Assets and Extinguishments of Liabilities." FAS 156 requires all separately recognized servicing assets and servicing liabilities be initially measured at fair value, if practicable, and permits for subsequent measurement using either fair value measurement with changes in fair value reflected in earnings or the amortization and impairment requirements of FAS 140. The subsequent measurement of separately recognized servicing assets and servicing liabilities at fair value eliminates the necessity for entities that manage the risks inherent in servicing assets and servicing liabilities with derivatives to qualify for hedge accounting treatment and eliminates the characterization of declines in fair value as impairments or direct write-downs. FAS 156 is effective for an entity's first fiscal year beginning after September 15, 2006. The implementation of this pronouncement is not expected to have a material impact on the Company's financial statements.
In July 2006, the FASB issued FASB Interpretation No. 48, "Accounting for Uncertainty in Income Taxes" ("FIN 48"). FIN 48 prescribes a recognition threshold and measurement attribute for the financial statement recognition and measurement of a tax position taken or expected to be taken in a tax return. The interpretation also provides guidance on de-recognition, classification, interest and penalties, accounting in interim periods, disclosure, and transition. FIN 48 is effective in fiscal years beginning after December 15, 2006. The provisions of FIN 48 are to be applied to all tax positions
99
upon initial adoption, with the cumulative effect adjustment reported as an adjustment to the opening balance of retained earnings. Management is currently evaluating the potential impact, if any, which the adoption of FIN 48 will have on the Company's consolidated financial statements.
In April 2006, the FASB issued FSP FIN 46(R)-6, "Determining the Variability to Be Considered in Applying FASB Interpretation No. 46(R)" ("FSP FIN 46(R)-6"). FSP FIN 46(R)-6 addresses whether certain arrangements associated with variable interest entities (VIEs) should be treated as variable interests or considered as creators of variability, and indicates that the variability to be considered shall be based on an analysis of the design of the entity. FSP FIN 46(R)-6 is required to be applied prospectively to all entities with which the Company first becomes involved and to all entities previously required to be analyzed under FIN 46(R) upon the occurrence of certain events, beginning the first day of the first reporting period after June 15, 2006. Management is currently evaluating the potential impact, if any, that the adoption of FSP FIN 46(R)-6 will have on the Company's consolidated financial statements, including disclosures.
In September 2006, the FASB also issued FAS 157, "Fair Value Measurements." FAS 157 enhances existing guidance for measuring assets and liabilities using fair value, such as emphasizing that fair value is a market-based measurement, not an entity-specific measurement, and sets out a fair value hierarchy with the highest priority being quoted prices in active markets. FAS 157 is effective for financial statements issued for fiscal years beginning after November 15, 2007, and interim periods within those fiscal years. Management is currently evaluating the potential impact, if any, which the adoption of FAS 157 will have on the Company's consolidated financial statements.
In September 2006, the FASB issued FAS 158, "Employers' Accounting for Defined Benefit Pension and Other Postretirement Plans—an amendment of FASB Statements No. 87, 88, 106 and 132(R)." FAS 158 requires companies that sponsor a defined benefit pension plan to fully recognize, as an asset or liability, the overfunded or underfunded status of its benefit plan(s) in their balance sheets. FAS 158 is effective for companies with publicly traded equity securities for fiscal years ending after December 15, 2006. The implementation of this pronouncement is not expected to have a material impact on the Company's financial statements.
In June 2005, at the request of the Securities Exchange Commission, the FASB added a project to their agenda to review and codify accounting standards for financial guaranty insurance contracts. It is possible that as a result of the FASB's deliberations, the financial guaranty industry, including the Company, may have to change certain aspects of its accounting policies. Any proposed guidance is expected to be issued later in 2006. The Company will continue to apply the accounting policies as disclosed in its audited financials statements as of December 31, 2005 and 2004 and for the years ended December 31, 2005, 2004 and 2003.
QUANTITATIVE AND QUALITATIVE DISCLOSURES ABOUT MARKET RISK
Market Risk
Market risk represents the potential for losses that may result from changes in the value of a financial instrument as a result of changes in market conditions. The primary market risks that impact our financial instruments are due to interest rates, credit spreads, asset correlation, asset-backed security prepayments, CDO reinvestment and CDO commercial paper refunding. Each of these risks and the specific types of financial instruments which they impact are described below. Senior managers in our risk management department are responsible for monitoring risk limits and applying risk measurement methodologies. The estimation of potential losses arising from adverse changes in market conditions is a key element in managing market risk. We use various systems, models and stress test scenarios to monitor and manage market risk. These models include estimates made by management that use current and historic market information. The valuation results from these models could differ materially from amounts that actually are realized in the market. See "—Critical Accounting Policies and Estimates—Investments" and "—Critical Accounting Policies and Estimates—Derivative Contracts" above.
100
Interest Rate Risk
Interest rate risk is the risk that the fair value of our interest rate sensitive assets or liabilities will change with changes in market interest rates. We own both fixed rate and floating rate bonds in our non-CDO investment portfolio and consolidated CDO portfolios. Also, our unconsolidated CDO equity investments have fair values that are sensitive to yield curve movements.
We use interest rate swaps and caps to hedge differences in the cash flow of assets and liabilities within many of our CDOs. These hedges also act to reduce the net sensitivity to fair value changes. We do not hedge the interest rate risk of our non-CDO investment portfolio since we prefer the income from this portfolio be predominantly fixed coupon. As interest rates go up or down, the yield of that investment portfolio will be fairly stable, however, the fair value will fluctuate. While this portfolio holds both fixed-and floating-rate debt obligations, it is predominantly fixed rate. Conversely, our funded CDO assets are primarily comprised of floating rate securities. While the values of these securities are not sensitive to interest rate movements, the associated yields are sensitive to changes in interest rates.
The following table shows the change in fair value for all business activities with significant interest rate risk. We employ proprietary cash flow models to derive these values.
| Business Activity | Fair Value at June 30, 2006 | +100 bps per annum Shift | -100 bps per annum Shift | |||||||
|---|---|---|---|---|---|---|---|---|---|---|
| | (in millions) | |||||||||
| Non-CDO investment portfolio | $ | 482.8 | $ | (23.9 | ) | $ | 26.3 | |||
| CDOs | 4,709.9 | (20.2 | ) | 20.7 | ||||||
| Interest rate swaps | (7.5 | ) | 14.9 | (15.8 | ) | |||||
| $ | 5,185.2 | $ | (29.2 | ) | $ | 31.2 | ||||
Credit Spread Risk
Credit spread risk is the risk that the fair value of our credit sensitive assets or other risk exposure will change with changes in the credit spreads of the referenced entities. Roughly speaking, the "credit spread" is the additional yield above the risk-free benchmark yield that a borrower must pay to its lenders. The credit spread increases as the perceived risk of default of the borrower increases. Fluctuations of credit spreads behave like movements in the market yield curve (interest rate risk) for simple fixed-income investments and impact fixed- and floating-rate debt equally. Our credit swap exposure in our Structured Credit and CDO Asset Management transactions, is generally more sensitive to movements in credit spreads than to movements in interest rates since the mathematical models that determine fair value use changing spreads as a signal of a changing likelihood of default in the future.
The following table shows the change in fair value for all business activities with significant credit spread risk. We employ proprietary cash flow and stochastic default models to derive these values.
| Business Activity | Fair Value at June 30, 2006 | +25 bps per annum Credit Spread Shift | -25 bps per annum Credit Spread Shift | ||||||
|---|---|---|---|---|---|---|---|---|---|
| | (in millions) | ||||||||
| Non-CDO investment portfolio | $ | 482.8 | $ | (7.5 | ) | $ | 7.5 | ||
| CDOs | 4,709.9 | (40.7 | ) | 39.5 | |||||
| Structured Credit | (2.0 | ) | (6.5 | ) | 5.9 | ||||
| $ | 5,190.7 | $ | (54.7 | ) | $ | 52.9 | |||
We chose stresses of plus or minus 25 basis points per annum for the credit spread risk sensitivity, as opposed to a larger value, since many of the underlying spreads are less than 100 basis points per annum.
101
Asset Correlation Risk
For a hypothetical portfolio of debt instruments, the correlation among the positions does not affect the fair value of the portfolio. For portfolios of debt instruments that are divided into risk layers (i.e., "AAA" through equity) or tranches, however, the correlation among the risk positions is significant because higher correlations could lead to greater or lower risk of default based on the position of the given risk layer. Such risk exists primarily in our CDO Asset Management and Structured Credit businesses. The industry measures this correlation as "asset correlation," which is defined as the correlation of the enterprise value of one firm to another. We perform proprietary mathematical calculations and assign asset correlation values to all corporate, asset-backed, mortgage-backed, and municipal risk positions in order to generate fair value and risk-related results.
The following table shows the change in fair value for these two business activities with significant asset correlation risk. We employ proprietary cash flow, asset correlation, and stochastic default models to derive these values.
| Business Activity | Fair Value at June 30, 2006 | +5% Shift in Asset Correlation | -5% Shift in Asset Correlation | |||||||
|---|---|---|---|---|---|---|---|---|---|---|
| | (in millions) | |||||||||
| CDOs | $ | 4,709.9 | $ | 1.0 | $ | (0.0 | ) | |||
| Structured Credit | (2.0 | ) | (5.3 | ) | (0.2 | ) | ||||
| $ | 4,707.9 | $ | (4.3 | ) | $ | (0.2 | ) | |||
Other Market Risks
In addition to the above-mentioned risks, the ultimate return we realize on our equity investments in our CDOs is impacted by several other market risks. These risks are ABS prepayment risk, reinvestment risk and commercial paper refunding risk. Because our equity exposure behaves like a floating-rate obligation, our equity return depends on the leverage of the transaction (total portfolio size divided by the equity tranche size). Early prepayments on the ABS underlying the CDO would delever the transaction and, thus, diminish the returns to the equity holders. This risk is mitigated somewhat by the fact that the majority of the underlying CDO ABS pay interest based on floating rate, making them less sensitive to prepayments. Our non-CDO investment portfolio could also be impacted by prepayments. We limit this exposure by imposing limits on the amount of such securities held in this portfolio.
Seven of our funded CDO transactions are currently in the "reinvestment period." This means that as the asset-backed securities (in six CDOs) or the leveraged loans (in one CDO) return principal to the CDO portfolios, we re-invest the principal proceeds rather than repay CDO debt. Since the CDO liability cost is frozen at inception (either as a fixed coupon, or, more typically, as a fixed spread to LIBOR), we, as equity investor bear the risk that reinvestment spreads will decrease. Conversely, increasing reinvestment spreads benefit our equity investment.
In two of our consolidated CDO transactions, the senior liability (of approximately $1.3 billion in each as at June 30, 2006) is comprised of commercial paper. Hence, our balance sheet carries approximately $2.7 billion of short-term debt or commercial paper as at June 30, 2006 that we refund, on average, monthly. The typical yield cost of this commercial paper (including dealer cost) is LIBOR-flat. Our risk is that future issuances may give the commercial paper a positive spread to LIBOR. There is no guarantee that investors will continue to buy this CDO commercial paper at LIBOR-flat. Alternatively, this future commercial paper funding could fall below LIBOR. We manage this refunding risk by negotiating into the CDO transaction, caps on the spread to LIBOR. As a result, the commercial paper, or CP, yield cannot exceed LIBOR +40 basis points per annum due to the presence of put option contracts. An increase in the spread above LIBOR directly impacts our equity investment. When the CP spread widens (tightens), we receive lesser (greater) cash distributions.
102
We participate within two distinct market segments within the fixed income capital markets, the structured finance and municipal finance markets. Within the structured finance markets, we participate as both a provider of financial guaranty insurance products where we assume structured credit exposure principally through credit swaps issued by special purpose subsidiaries whose obligations are insured by our financial guaranty insurance subsidiary, ACA Financial Guaranty, and as an asset manager of our sponsored CDOs. Within the municipal finance markets, we participate as a provider of credit protection primarily through the issuance of financial guaranty insurance policies on newly issued municipal finance obligations by third party governmental and not-for-profit entities.
Structured Finance Markets
Within the structured finance markets, our products and services are focused on two high growth areas that are commonly referred to as the global credit derivatives market and CDO market. Within the global credit derivatives market, the principal product is a credit swap which is an agreement by one party (the protection seller) to another (the protection buyer) to make a payment if a third party (the reference credit) experiences a credit event such as bankruptcy or default on its debt obligations. As a result, a credit swap transfers credit risk without the transfer of an actual asset. A typical credit swap provides for reimbursement by the protection seller to the protection buyer for any loss of par of the associated asset in the event of a default or upon the occurrence of another specified credit event. Financial guaranty insurance companies typically execute transactions in the global credit derivatives market by selling protection under credit swaps entered into by wholly-owned special purpose vehicles, and issuing insurance policies through their financial guaranty insurance subsidiaries guaranteeing the obligations of the special purpose vehicles under those swaps. The CDO market is a subset of the securitization market. A securitization is a process by which a stream of payments derived from specified assets is repackaged as a security and sold into the capital markets. A CDO is a securitization of financial assets. For example, cash flow CDOs, or funded CDOs, such as ABS CDOs, are a repackaging of ABS. Another form of cash flow CDO, a collateralized loan obligation, or CLO, is a repackaging of leveraged loans. A synthetic CDO, or unfunded CDO or CDS CDO, is a repackaging of credit swaps. CDOs are usually combined with cash equivalent income bearing liabilities or securities issued by the CDO and paid from the cash flow on the underlying assets.
The Global Credit Derivatives Market Overview
Our Structured Credit business provides insurance protection products to market participants in the global credit derivatives markets. We generally assume credit exposures in the form of insured credit swaps. Credit swaps represent the largest segment of the global credit derivatives markets and represent the financial underpinning of substantially all credit derivative structured transactions. The global credit derivatives market has developed from a small, niche segment of the capital markets to a global market that is rapidly growing with diversified product applications and a wide range of participants. Total notional outstanding of the credit swaps market has grown from approximately $918.9 billion in 2001 to $26.0 trillion through the first half of 2006 representing a 110.2% compound annual growth rate during this period, according to the International Swaps and Derivatives Association.
103
Credit Swaps Outstanding, 2001-1H 2006
(in trillions)
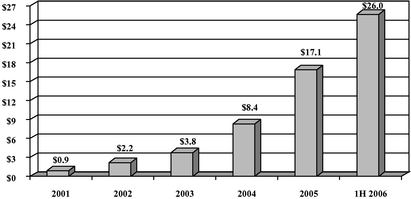
Source: International Swaps and Derivatives Association, "ISDA Market Survey."
According to industry analysts, the growth in the number of market participants and market volume is being driven primarily by the significant contribution that credit swaps are making to efficient risk management and rational credit pricing. Participants in the global credit derivatives market have grown and diversified to include a wide range of financial institutions. Commercial and investment banks are the most active participants in the global credit derivatives market. Commercial banks use credit swaps to manage the regulatory and economic capital required to support their credit origination and lending operations. Non-bank participants in the global credit derivatives market have expanded rapidly to include insurance companies, investment funds and non-financial corporations. Financial institutions and corporations continuously evaluate their portfolios against regulatory and economic guidelines and rebalance their portfolios through the use of credit swaps based on the various trade-offs among client demands, capital requirements and risk-adjusted returns.
Credit Swap Overview
Credit swaps are a capital markets product used by institutions and investment funds to manage or transfer credit risk exposures. Credit swaps are a derivative instrument, the performance of which is directly related to the performance of an underlying financial obligation, or reference obligation, such as a bond or a loan issued by a third party known as a reference entity. In a standard credit swap contract, the protection buyer purchases credit protection from the protection seller for a pre-agreed aggregate credit risk exposure, referred to as a notional amount, on a senior obligation of a reference entity. For this protection, the protection buyer pays a regular fixed payment to the protection seller. The fixed fee is generally paid quarterly in arrears, but may be paid in full upfront. Generally, if a credit event with respect to a reference entity, such as bankruptcy or failure of the reference entity to make a required payment on certain of its debt, occurs during the term of the credit swap, the protection seller either pays the protection buyer the notional amount and takes delivery of the reference entity's obligation in a par amount equal to the notional amount of the credit swap, or makes a cash payment to its counterparty to the credit swap in an amount representing the decline in the market value below par value of such reference entity's senior debt. The method of settlement is agreed by the parties at the beginning of the transaction and set forth in the transaction documentation. Financial guaranty insurance companies typically enter into credit swaps through special purpose vehicles whose obligations are insured by a financial guaranty insurance policy. In these transactions, payments required in connection with the occurence of a credit event are guaranteed and payable by the insurance company under the insurance policy.
104
The basic transaction structure for insured credit swaps is as follows:
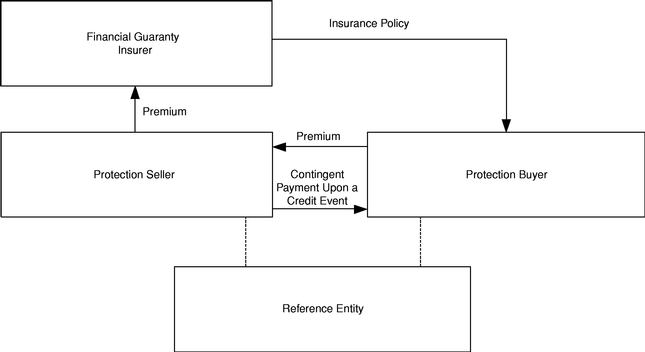
The application of credit swaps has evolved since their inception from single reference entities to baskets of reference entities, or portfolio credit swaps. In a portfolio credit swap, a protection buyer purchases protection from the protection seller on a basket of reference entities. The parties agree to the maximum exposure that a protection seller will assume in respect of each reference entity included in the portfolio, or a reference entity notional, and on an aggregate basis with respect to the entire basket. Upon occurrence of a credit event in respect of any reference entity included in the portfolio, in the event of a physically settled transaction, the protection seller will pay the protection buyer the amount of the reference entity notional and the protection buyer will deliver to the protection seller a senior obligation of that reference entity in a par amount equal to the reference entity notional. In the event of cash settlement, like in the single name credit swap, the protection seller will pay the protection buyer the amount of the decline in the market value of the reference entity's reference obligation (based on a par amount equal to the reference entity notional). Portfolio credit swaps redistribute the credit risk of a credit swap portfolio across different layers in the capitalization structure, known as tranches. Each tranche represents a different level of risk of loss, with some tranches assuming the first losses and others assuming further losses after the first loss tranche is exhausted. Primary examples of portfolio credit swaps include synthetic CDOs and single tranche transactions, which are collectively referred to as collateralized synthetic obligations, or CSOs.
- •
- Synthetic CDOs, or CDS CDOs, involve the structuring and selling of fully capitalized transactions that match the notional amount of the underlying credit swaps with income bearing liabilities. Synthetic CDOs are structured by dealers and asset managers and sold to investors through private offerings. Investors, or protection sellers, assume the risk of a particular layer of the capitalization structure by entering into a credit swap requiring payment at such time as losses associated with certain credit events on the underlying referenced assets reach an agreed-upon level, referred to as an attachment point.
- •
- In single tranche transactions, the risk of only one layer of the capitalization structure is placed with a protection seller by means of a credit swap. These transactions are generally structured by dealers and custom tailored for their investors.
105
Credit swaps have several distinct structural features that make them particularly suitable for credit risk management applications.
- •
- Credit swaps are documented using standard forms of contracts. The forms are generally accepted throughout the financial marketplace. Standard documentation has significantly increased the liquidity of credit swaps.
- •
- Credit swaps define, separate and isolate credit risk from the other risks, such as interest rate risk, of an underlying obligation, allowing for a practical mechanism to manage credit risk efficiently by buying credit protection. The reference entity which is the subject of the credit swap does not need to be a party to, or aware of, the credit swap because the credit swap is not "attached" to an underlying obligation of the reference entity.
- •
- Credit swaps can be custom-tailored to cover only a portion of the period during which a debt obligation is outstanding. Counterparties can thereby hedge specific investments in their portfolios against credit risks in ways that are not otherwise readily available in the capital markets.
CDO Market Overview
Although the first CDOs were issued in the late 1980s, annual aggregate issuance remained below $1.5 billion until 1996, when issuance volume increased to approximately $15 billion. From December 31, 1998 to June 30, 2006, CDO issuance volume in the U.S. and European markets grew from approximately $94.4 billion to $271.1 billion, representing a compound annual growth rate of 15.1% during this period. Investors in general have been attracted to structured investment products, such as CDOs, due to the strong collateral performance and the ability to use leverage to take advantage of attractive asset and liability spreads compared to alternative investments. Investors have also been attracted to the diversification of CDOs, the ability to invest at different risk levels in the structure, the availability of experienced collateral managers and the benefits of a maturing and more sophisticated market.
The following table depicts CDO issuance in the United States and European markets from December 31, 1998 through June 30, 2006:
| U.S. CDO Funded Issuance 1998-1H 2006 ($ in billions) | European CDO Funded Issuance 1998-1H 2006 ($ in billions) | |
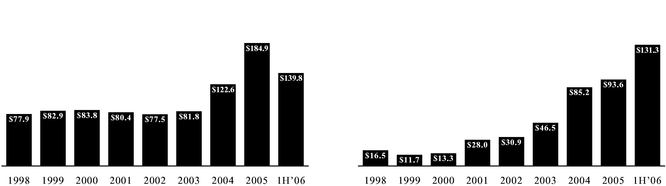 | ||
| Note: Data does not reflect the unfunded portion of the CDO market. Source: Bear, Stearns & Co. Inc., "CDO Perspectives: July 2006." | Note: Data does not reflect the unfunded portion of the CDO market. Source: Bear, Stearns & Co. Inc., "CDO Perspectives: July 2006." | |
CDOs are created and structured by dealers and portfolio managers to provide their clients and investors leveraged investments in diversified asset portfolios. The managed aspect of CDOs allows new classes of investors to participate in diversified classes of assets, in which they would not otherwise invest due to the costs of information gathering, structuring and analyzing and valuing the underlying
106
assets. The investor base for both funded CDOs and unfunded CDOs presently is comprised largely of banks, money managers, hedge funds, pension funds and insurance companies.
CDO Structures
CDOs are bankruptcy remote, special purpose investment entities formed to acquire, monitor and, to varying degrees, manage a pool of assets. A cash flow CDO issues different classes of securities, the proceeds of which are used to purchase assets. The repayment of these securities is linked to the performance of the underlying collateral. These securities are generally divided into different classes of rated liabilities and unrated equity to appeal to different investor groups with varying appetites for risk, which we refer to as tranches. The senior classes of debt issued by a cash flow CDO have a priority claim on the available cash from the underlying assets and are typically rated in one of the two highest ratings categories by one or more rating agencies. The mezzanine debt classes are typically rated in the third or lower rating categories and have a claim that is subordinated to the senior classes on the CDO cash flows. The most junior class of securities, typically structured as preferred shares, is generally unrated and represents the most subordinated, or the first loss, position in the CDO which we call the CDO equity. The holders of the CDO equity receive a payment from any residual interest proceeds or principal proceeds generated by the underlying collateral after payment of expenses and debt service on the liabilities of the CDO.
If a CDO is actively managed, the portfolio manager will direct the selection and acquisition of the assets and will monitor the credit performance of the CDO assets for compliance with the CDO's requirements for diversification and asset quality, replacing poorly performing assets when necessary and practicable. In addition, many CDOs have revolving periods where distributions from the underlying assets are re-invested in additional assets.
The following chart illustrates the typical structure of a cash flow CDO:
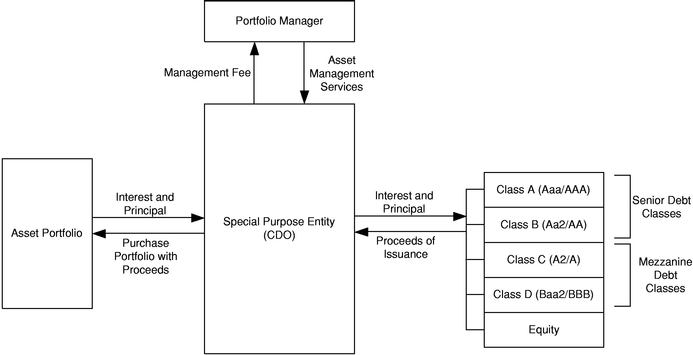
CDS CDOs do not actually purchase assets but rather assume the credit risk on a portfolio of assets by entering into credit swaps that reference such assets. A CDS CDO may be either partially funded or unfunded. A partially funded CDS CDO collateralizes its obligations as the protection seller to pay the protection buyer upon the occurrence of certain credit events under these credit swaps by issuing tranches of liabilities and depositing the proceeds into a credit protection account.
107
One important structural difference of a partially funded CDS CDO as compared to a cash flow CDO is that the most senior liability in the structure, which is commonly referred to as the super-senior tranche, typically takes the form of an unfunded credit swap. The CDO entity and the super-senior investor enter into a credit swap whereby the CDO entity agrees to pay an ongoing premium to the super-senior investor in return for a commitment by the super-senior investor to compensate the CDO vehicle for defaults in the reference portfolio after the credit protection account, or other form of subordination, is depleted. Since the credit protection account provides the first loss protection, the risk taken by the super-senior investor is remote (the credit risk is typically equivalent to a "AAA" rating level by one or more rating agencies). Because of this remoteness, the CDO vehicle enters into the super-senior swap on an unfunded basis. This means that the super-senior investor is not required to make any initial commitment of capital. In return for accepting the risk of the super-senior swap, the investor is paid a fixed quarterly fee. The unfunded nature of the super-senior tranche allows a partially funded CDS CDO to have a large notional amount of reference credits while requiring its investors to fund a much smaller amount.
The following chart illustrates the typical structure of a partially funded CDS CDO:
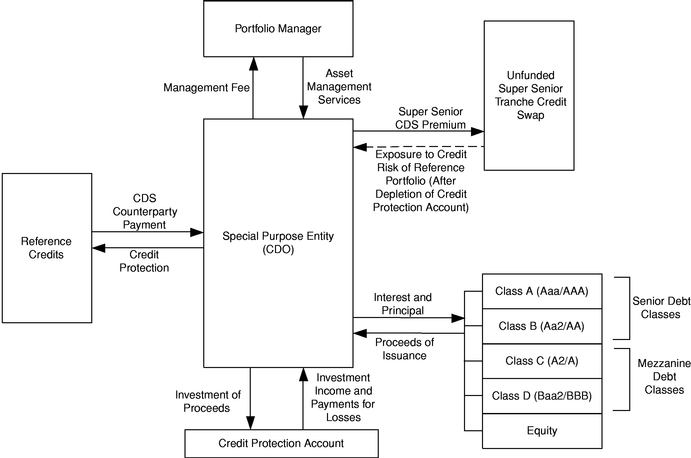
An unfunded, fully synthetic, CDS CDO secures its obligations as a protection seller to pay the protection buyer upon the occurrence of certain credit events on the referenced assets under the credit swaps by purchasing credit protection in the form of insurance through insured credit swaps, uninsured credit swaps or credit linked notes from creditworthy entities. In an unfunded CDS CDO, the providers of this protection to the CDS CDO will be required to make a payment to the CDO only in the event of the occurrence of a credit event which gives rise to a payment obligation by the CDO on a referenced asset on which the CDS CDO sold protection.
An important structural distinction of an unfunded, or fully synthetic, CDS CDO as compared to a cash flow, or fully funded, CDO, and as compared to a partially funded CDS CDO, is that no special
108
purpose vehicle is used. In a fully synthetic CDS CDO, the sponsoring investment bank acts as the protection seller counterparty to the protection buyers in order to accumulate assets synthetically and is also the entity that purchases credit protection in order to secure its obligations as a protection seller on those referenced assets.
The following chart illustrates the typical structure of an unfunded CDS CDO:
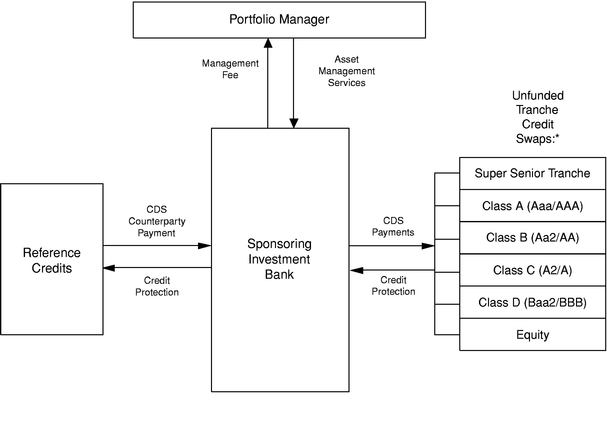
- *
- Each layer of credit protection becomes available to the sponsoring investment bank only after the notional balance of the credit swaps subordinate in the capital structure is depleted.
CDOs are structured by investment banks and asset managers as cash flow, or fully funded CDOs, partially funded CDS CDOs or unfunded CDS CDOs in order to meet the demands of the various investors that participate in the CDO market.
The Municipal Finance Market
The U.S. municipal finance market includes taxable and tax-exempt bonds, notes and other forms of indebtedness issued primarily by states, political subdivisions (e.g., cities, counties and towns) and various public authorities (e.g., electric and other utilities, transportation authorities and housing authorities). Municipal finance obligations are generally supported by either funds available from taxes or the underlying obligors' ability to collect fees or assessments for certain projects or public services. More recently, the municipal finance market has expanded to include structured and project finance issues for public infrastructure projects.
Financial guaranty insurance is a form of credit enhancement that benefits both the issuer and the investor. Issuers of municipal finance obligations insured by financial guaranty insurance policies benefit because their insured obligations are sold with a higher credit rating than the obligations would carry without insurance, which results in interest cost savings to the issuer. In addition, for the obligations of issuers that are not well known the insurance provides increased marketability, and therefore liquidity to the investor. When comparing insured bonds to uninsured bonds issued by the same obligor, insured
109
bonds have fared significantly better in terms of price stability through times of stress (e.g., recessionary periods when credit spreads widen). Investors benefit from this greater secondary market price stability as well as from the active credit surveillance and protection from loss associated with issuer defaults that is at the core of this occurrence. Financial guarantors are typically paid premiums on insurance policies guaranteeing municipal finance obligations upfront and they are non-refundable, even in the event of a prepayment of the insured obligations. Premiums are charged typically as a percentage of principal and interest scheduled to come due during the stated term of the insured obligation.
The following table sets forth certain information regarding long-term (longer than 12 months) U.S. municipal finance new issues sold and insured during the periods indicated:
U.S. Municipal Finance Long-Term Market, 1996-2005(1)
| Year | New Total Volume | New Insured Volume | New Insured Volume as Percent of New Total Volume | ||||||
|---|---|---|---|---|---|---|---|---|---|
| | (in billions) | | |||||||
| 1996 | $ | 185.2 | $ | 83.3 | 45.0 | % | |||
| 1997 | 220.7 | 106.0 | 48.0 | ||||||
| 1998 | 286.7 | 146.0 | 50.9 | ||||||
| 1999 | 227.6 | 105.4 | 46.3 | ||||||
| 2000 | 200.7 | 79.4 | 39.6 | ||||||
| 2001 | 288.2 | 131.0 | 45.5 | ||||||
| 2002 | 358.8 | 177.6 | 49.5 | ||||||
| 2003 | 383.7 | 190.7 | 49.7 | ||||||
| 2004 | 360.1 | 194.1 | 54.0 | ||||||
| 2005 | 407.0 | 228.4 | 56.1 | ||||||
- (1)
- Information is based on data provided in The Bond Buyer, January 9, 2006. Volume is expressed in terms of par insured.
Insurance of municipal finance obligations historically has been the largest portion of the financial guaranty insurance industry. The issuance of municipal finance obligations is predominantly driven by the prevailing interest rate environment but is also subject to the timing of the financing needs of certain issuers. Both total new issuance of municipal finance obligations and refundings of previously issued municipal finance obligations increased from 1996 to 2005, except for in 1999 and 2000, primarily due to lower interest rates. In 1999, rising interest rates caused a decrease in refundings, and therefore a decline in total issuance that year. The year 2000 saw a further decline in both total municipal finance obligation issuance and the percentage of municipal finance obligation par insurance. This was attributable in part to the effect of budget surpluses reducing municipal borrowing needs, as well as the strengthened credit ratings of municipal issuers. In recent years, insured penetration has increased and, since 2001, 40% to 50% of all new U.S. municipal finance obligations utilized financial guaranty insurance.
The market for "A" rated insurance of new issues of municipal finance obligations, such as that provided by ACA Financial Guaranty, is a portion of the overall municipal finance market and consists of lower investment grade and below investment grade or unrated issues. Historically, this segment of the municipal finance market has not been served by financial guarantors with "AAA" credit ratings since the rating agencies categorically prohibit those companies from insuring non-investment grade obligations and internal risk policies limit exposure on lower investment grade obligations. While the only "AA" rated financial guarantor has some rating agency and risk policy flexibility to participate in
110
this part of the municipal finance market, its actual activity has been limited to the lower investment grade portion. The following table sets forth certain information regarding long-term U.S. municipal finance new issues sold by low investment grade, non-investment grade or non-rated issuers during the periods indicated:
Municipal New Issues Low Investment Grade(1)
and Non-Investment Grade/Non-Rated(2)
| Year | Par Amount | Number Of Issues | |||
|---|---|---|---|---|---|
| | (in billions) | | |||
| 1996 | $ | 28.2 | 4,453 | ||
| 1997 | 40.4 | 5,435 | |||
| 1998 | 49.4 | 6,463 | |||
| 1999 | 56.7 | 6,608 | |||
| 2000 | 47.0 | 5,362 | |||
| 2001 | 46.4 | 5,223 | |||
| 2002 | 45.2 | 5,092 | |||
| 2003 | 44.6 | 4,848 | |||
| 2004 | 61.4 | 5,116 | |||
| 2005 | 62.4 | 5,125 | |||
- (1)
- Low investment grade includes any issue rated in the "BBB" category by a nationally recognized statistical rating organization.
- (2)
- Source: Securities Data Corp. as of May 4, 2006.
111
Overview
ACA Capital is a holding company engaged in the business of providing financial guaranty insurance products to participants in the global credit derivatives markets, structured finance capital markets and municipal finance capital markets. We also provide asset management services to specific segments of the structured finance capital markets. We participate in our target markets both as a provider of credit protection through the sale of financial guaranty insurance products, for risk-based revenues, and as an asset manager, for fee-based revenues. We conduct our financial guaranty insurance businesses through ACA Financial Guaranty Corporation, our "A" rated, regulated insurance subsidiary. We conduct our asset management business through ACA Management, L.L.C., a subsidiary of ACA Financial Guaranty. Our business model seeks to combine the operational leverage of our core credit and asset management capabilities with the financial leverage provided by our "A" rated financial guaranty insurance platform. As of June 30, 2006, we had insured credit exposure of $31.4 billion and our assets under management for third parties were $12.1 billion. For the six months ended June 30, 2006, we had total revenues of $215.3 million and net income of $26.2 million. As of June 30, 2006, our stockholders' equity was $412.7 million.
Our core competency is selecting, analyzing, structuring and managing credit risk in a variety of fixed income financial asset classes, including investment grade and non-investment grade corporate obligations (including bonds and loans), ABS (including MBS and other asset classes) and municipal finance securities. Throughout our businesses we generally assume credit risk to the scheduled maturity of the underlying credit, including credit risks that are of low investment grade quality or non-investment grade. We apply a rigorous underwriting and credit process to analyze each transaction and its incremental effect on our existing credit portfolio, and have adopted a risk management approach which is designed to ensure that the risk profile of a given credit or transaction meets our credit, profitability and loss tolerance standards.
We operate through three strategic business units, our two insurance lines of business, Structured Credit and Municipal Finance, and our CDO Asset Management business. Each of these businesses relies on our core competencies of credit analysis, transaction structuring, risk management and surveillance. Applying these competencies across our platform allows us to create efficiencies in our operations and to deliver a wide range of services and product solutions for our institutional customers.
Financial Guaranty Insurance Lines of Business
Structured Credit: As a part of our financial guaranty insurance business, we select, structure and sell credit protection, through insured credit swaps in the institutional fixed income markets. A credit swap is a derivative instrument, the performance of which is directly related to the performance of an underlying financial obligation, or reference obligation, such as a bond or a loan, issued by a third party, or reference entity. As an alternative execution method to traditional financial guaranty insurance, credit protection can be provided through credit swaps backed by financial guaranty insurance policies. We execute our credit swaps through special purpose vehicles whose obligations under these swaps are insured by ACA Financial Guaranty. Historically we have generally sold credit protection through insured credit swaps on highly rated layers of risk associated with pools of assets that were either selected by us or held within CDOs of financial assets managed by third parties. The financial assets underlying our insured credit swaps principally include corporate credits, ABS and MBS.
We generate revenues in our Structured Credit business through the premiums paid to ACA Financial Guaranty to insure against the risk of default on the assets underlying our credit swaps. Currently our insured credit swap portfolio is constructed primarily of exposures with credit profiles equivalent to "AAA" rated exposures. We executed our first Structured Credit transaction
112
in July 2002 and completed 16, 22, 43 and 36 Structured Credit transactions in 2003, 2004 and 2005 and the first six months of 2006, respectively. As of June 30, 2006, we had $24.4 billion in total outstanding insured credit swaps and had 22 different counterparty relationships. As of June 30, 2006, the weighted average premium in our then current insured Structured Credit portfolio was 0.19% per annum.
Municipal Finance: Since 1997, we have provided financial guaranty insurance on municipal and other public finance bonds that guarantee to the investor the timely payment of interest and ultimate payment of principal on such obligations. Through our "A" rated financial guaranty insurance subsidiary by S&P we target low investment grade, non-investment grade and unrated sectors of the market. Our market segment is underserved by higher rated financial guarantors due to rating agency limitations and company specific risk policy constraints. We also target markets that are underserved by reason of industry sector, credit characteristics or transaction size. We are licensed to provide financial guaranty insurance in all 50 states, the District of Columbia, Guam, Puerto Rico and the U.S. Virgin Islands. The maintenance of our financial guaranty insurance subsidiary also provides us with significant execution flexibility that we utilize across our other business lines. Depending on the demands of our customers, we can use credit swaps or financial guarantees to provide credit protection.
We generate revenue in our Municipal Finance business through the receipt of premiums for the insurance we provide. As of June 30, 2006 we had $6.3 billion of net par insured in our municipal finance portfolio. As of June 30, 2006 our weighted average premium as a percentage of total debt service on our insured Municipal Finance portfolio was 2.49%
Other Financial Services
CDO Asset Management: We serve as an asset manager of collateralized debt obligations, or CDOs. A CDO is a securitization of fixed income assets such as bonds, loans, ABS and credit swaps. To grow our assets under management, we sponsor CDOs that acquire pools of fixed-income assets that we select and manage. CDO assets are funded by the issuance of various liabilities with credit profiles ranging from "AAA" rated debt to non-rated equity. Our CDOs have a diverse worldwide institutional investor base that includes banks, money managers, non-bank financial institutions, hedge funds, pension funds and insurance companies.
Our CDO Asset Management revenues consist of asset management fees and risk-based revenue in the form of return on our equity investments in our CDOs. Typically, we invest in some portion of the equity of our managed CDOs, currently between 5% to 25% of the total equity offered. These investments increase the marketability of our CDOs by aligning our interests as asset manager with those of our CDO investors and thereby maximizing our CDO assets under management. In 2005 and the first six months of 2006, we invested $18.9 million in the equity of our eight new CDOs while increasing our assets under management by $4.3 billion. We completed our first CDO in January 2002 and as of June 30, 2006, we had closed 17 CDO transactions consisting of 11 ABS CDOs, 5 corporate synthetic CDOs and 1 CLO. We have grown our CDO assets under management from $2.4 billion as of year-end 2002 to $12.1 billion as of June 30, 2006. At June 30, 2006, our weighted average asset management fee was 0.21% on CDO assets under our management. Based on our knowledge of the market, we believe we are one of the largest global CDO managers as ranked by assets under management. Through our Structured Credit line of business, we have taken exposure at the most senior level in two of our CDOs. We do not credit enhance any portion of our CDO liabilities for investors.
113
Corporate Structure
We are a holding company and operate our lines of business through our subsidiaries. Approximately 90% of our assets on an unconsolidated basis represent our 100% ownership interest in ACA Financial Guaranty Corporation, a regulated insurance company. ACA Financial Guaranty is an established "A" rated financial guarantor in the markets that it serves. ACA Financial Guaranty provides financial guaranty insurance policies for our Municipal Finance business, for the credit swaps in our Structured Credit business and for certain other transactions described in "Other." Our CDO Asset Management business is operated by ACA Management, L.L.C., an SEC-registered investment adviser, which is owned by ACA Financial Guaranty.
Competitive Strengths
We believe that the following competitive strengths enable us to capitalize on opportunities to assume credit exposures through our "A" rated insurance company on select opportunities that meet our risk-adjusted return objectives and to grow our assets under management.
Extensive credit and risk management expertise. We have a proven track record in each of our principal business lines of strong and successful credit analysis and risk management as evidenced by our low loss experience. Our accomplished team of analysts and underwriters, together with senior management, participate in a rigorous underwriting and credit process in structuring specific transactions and managing credit risk. We also employ sophisticated qualitative and quantitative institutional risk management systems to monitor and manage our exposure across our business lines and in our investment portfolio.
- •
- In our Structured Credit business we use proprietary quantitative models to analyze and optimize risk positions in terms of capital usage and risk-adjusted returns. We have significant competence in understanding and assessing relative values between transactional opportunities. Since the establishment of this business line in July 2002, we have made no payments in respect of defaults under our insured credit swaps.
- •
- In our Municipal Finance business, we have a seasoned underwriting team with substantial experience in our target markets. Since our inception in September 1997, we have paid $4.9 million of net losses and loss adjustment expenses, which represents less than 2% of premiums written, on our total Municipal Finance portfolio.
- •
- In our CDO Asset Management business our strength lies in our asset selection expertise and ongoing management of individual credits included in our CDOs. Our experience and active portfolio review allow us to manage negative developments through timely trading and hedging techniques for the benefit of equity and debt investors in our CDOs. Since the completion of our first CDO in January 2002, we have not experienced any adverse rating actions or downgrades on any of the debt securities issued by our CDOs.
Operating flexibility and counterparty security from our insurance subsidiary's "A" financial strength rating. Our insurance subsidiary's "A" financial strength rating enables us to achieve an optimal balance between providing broad operating flexibility for us and providing security for our counterparties and investors in our Structured Credit and Municipal Finance businesses.
- •
- Structured Credit. Our "A" rating affords our Structured Credit business significant flexibility to offer credit protection through our financial guaranty insurance products on any portion of a given capital structure, from "AAA" equivalent exposures through equity, and on a diverse mix of asset classes, as compared to other market participants with higher credit ratings or more limited operating platforms. Though our "A" rating generally eliminates the need to post security on performing transactions, we have the flexibility, unlike other higher rated entities, to post collateral to secure our transactions in the event the transaction performance severely
114
- •
- Municipal Finance. As the only "A" rated financial guarantor in the municipal finance business, our insurance subsidiary is not only able to guarantee the obligations of lower investment grade issuers, but is the only financial guaranty insurer able to offer significant capacity to non-investment grade and unrated municipal credits. In the municipal finance market, our financial guaranty insurance platform allows us to issue policies for the life of the insured exposure, a significant advantage versus bank letter of credit competition in that market. The demand for our financial guarantees is driven by specific funding needs of projects and not by interest rate cycles.
deteriorates or we experience a corporate credit event. Our willingness to provide such security, combined with our "A" rated platform, enhances counterparties' willingness to transact with us.
Diverse revenue sources. Our three business lines provide diverse revenue sources, both risk and fee-based, from three distinct segments of the credit markets. The Structured Credit business provides risk-based revenue and attractive risk-adjusted returns on capital. The Municipal Finance business generally receives premiums up-front which provide current year cash flow and a predictable stream of longer term revenues as the unearned premiums are recognized as income over the typically 30-year life of the guaranteed bond. We also earn interest income on the investment portfolio of our insurance subsidiary which was $536.7 million as of June 30, 2006. The CDO Asset Management business provides a stable and growing source of fee income based on assets under management. We also receive fees related to the origination of CDOs and a return on our equity investments in our CDOs. A significant portion of such revenues is included as investment income in our financial statements since some of our earlier CDOs are consolidated under U.S. GAAP. We invest in a portion of our CDO equity tranches, currently between 5% and 25%. These investments are not a revenue strategy, but rather an opportunity to increase the marketability of our CDOs by aligning our interests as manager with those of our CDO investors and thereby maximize our CDO assets under management.
Efficient and scalable operations. Our credit analysis, transaction structuring and risk management expertise, together with our quantitative analytical capability and infrastructure of information technology, accounting, legal and other professionals with significant experience in our businesses, allows us to easily and quickly grow our assets under management and expand into new credit-based product lines without incurring significant additional costs.
Management team with significant industry and operating experience. Our management team is led by our President and Chief Executive Officer, Alan S. Roseman. Prior to joining ACA Capital in May 2004, Mr. Roseman was the Executive Vice President and Co-Chief Operating Officer of ACE Financial Solutions, and also served in senior management at Capital Re Corporation, a financial guaranty reinsurance company. Mr. Roseman is supported by senior executive management with substantial experience in investment banking, fixed income analysis, finance and financial guaranty, including Edward Gilpin, Executive Vice President and Chief Financial Officer, William Tomljanovic, Executive Vice President—Head of Credit, Joseph Pimbley, Executive Vice President—Head of Institutional Risk Management, Ruben Selles, Executive Vice President—Head of Municipal Finance, James Rothman, Senior Managing Director—Head of Structured Credit, Laura Schwartz, Senior Managing Director—Head of CDO Asset Management and Nora Dahlman—Managing Director and General Counsel. Our senior executive management team has an average of over 22 years of industry experience in fixed income analysis, finance, investment banking, and financial guaranty insurance and reinsurance. Additionally, our Board of Directors consists of members with substantial experience in the financial services industry.
Business Strategy
Our business strategy is to continue to leverage our credit management expertise to generate attractive risk-adjusted returns on our capital in our financial guaranty insurance lines of business
115
through the insurance of targeted credit exposure and to grow our assets under management. We plan to achieve these objectives through the following strategies:
Grow our insured credit exposure and assets under management. We have significantly increased our insured credit exposure and assets under management, and intend to continue to grow our financial guaranty insurance and CDO Asset Management businesses, in terms of number of transactions, size of transactions, and the types of asset classes that we insure and manage. For example, in 2005 we insured additional credit exposure in our Structured Credit portfolio of $10.0 billion and added leveraged loan CDOs, or CLOs, and synthetic ABS CDO products. We are also in the process of expanding our Structured Credit and CDO Asset Management businesses internationally.
Target the most attractive risk-adjusted returns in the credit markets. In our financial guaranty insurance business lines, we target those segments of the markets that we believe offer enhanced economic returns. In our Structured Credit business, we currently focus on selling credit protection through our insurance products on layers of exposure with credit profiles equivalent to "AAA" rated exposures, which we believe currently offers the most favorable risk-adjusted returns. However, we have the operating flexibility to assume credit exposures throughout the entire capital structure based on our relative value view of risk and return under changing market conditions. In our Municipal Finance business we have targeted the lower investment grade, non-investment grade and unrated portions of the market. We believe that this portion of the municipal market is underserved by others participating in the municipal finance market and offers attractive risk-adjusted returns. In the future, we may focus on other markets as economic opportunities arise.
Expand our existing product lines and develop new credit product areas. Our ability to expand existing products into broader geographic areas, asset classes and credit profiles is a function of the flexibility of our execution alternatives and "A" rating of our insurance subsidiary, ACA Financial Guaranty. By using our execution alternatives (insurance policies, insured credit swaps and cash), alone or in combination, we can assume credit exposure in various markets and access opportunities when they emerge. In our Structured Credit business we will continue developing our credit expertise into the evolving ABS, leveraged loan, project finance and MBS credit swap markets. In our Municipal Finance business we plan to utilize our expertise in financing municipal health care, transportation, student housing, and similar revenue-based projects to expand our business into broader financing opportunities for enterprises, tax-exempt or otherwise.
Expand counterparty and other key relationships for our insurance lines of business. Our Structured Credit business is dependent upon our developing and maintaining strong business relationships with other financial institutions that act as counterparties in insured credit swap transactions. We have substantially increased our relationships in recent years, increasing our Structured Credit counterparties to 22 at June 30, 2006, and will continue to focus on building new counterparty relationships. In our Municipal Finance business, we intend to strengthen our marketing efforts and expand our relationships with the investment banks and financial advisors most responsible for producing transactions in our target markets. In addition, we plan to utilize our expertise in financing municipal health care, transportation, student housing, and similar revenue based projects to expand our business into broader initiatives or financing such enterprises regardless of the tax status of the issued debt instrument.
Sustain the operating flexibility of an "A" financial strength rating for our financial guaranty insurance subsidiary. We believe an "A" rating for our insurance subsidiary is optimal for maximizing our strategic business opportunities. Our objective is to maintain capital adequacy in excess of S&P's requirements for "A" rated insurers so that we have excess rating agency capital to absorb unforeseen losses but to otherwise operate in a manner consistent with the greater operating flexibility afforded to us due to our "A" rating by S&P which is not afforded to higher rated insurers.
116
History
We began operations in September 1997 with a business strategy focused on providing "A" rated financial guaranty insurance to the Municipal Finance market. Beginning in 2002, we extended our financial guaranty insurance products to include our Structured Credit business and expanded our operations generally by establishing our CDO Asset Management business. In 2004, we raised $170 million in equity, in order to increase the capital base of our financial guaranty insurance subsidiary. In connection with the capital raise, our Board of Directors hired our current CEO, Alan S. Roseman, to focus our strategy on those opportunities where we could leverage our core credit competencies and financial guaranty insurance platform. As part of this capital investment, we changed our name from American Capital Access Holdings Ltd. to our current name, effective September 15, 2004.
Our principal executive office is located at 140 Broadway, New York, New York 10005 and our telephone number is (212) 375-2000. We maintain a website at www.aca.com on which we will post all reports we file with the SEC under Section 13(a) of the Securities Exchange Act of 1934 after the closing of this offering. We also will post on this site our key corporate governance documents, including our board committee charters and our code of conduct. Information on our website is not, however, a part of this prospectus.
STRUCTURED CREDIT
General
We select, structure and sell credit protection through our financial guaranty insurance subsidiary, ACA Financial Guaranty, principally on highly rated liabilities of structured financings, such as CSOs, including layers of risk of single tranche transactions and fully distributed CDOs, MBS and ABS. Each liability or layer of risk that we insure generally references a diversified portfolio of corporate financial obligations such as bonds and loans, or structured finance securities. In addition, each layer of risk typically benefits from subordination, which means that we would not be required to make a payment until a pre-negotiated level of losses resulting from defaults on the referenced assets have exceeded such agreed-upon level. The pre-negotiated level of losses is referred to as an attachment point.
We assume credit risk in our Structured Credit business by entering into credit swaps with various counterparties, the required payments under which are insured by, and payable under, financial guaranty insurance policies. Additionally, our insured credit swaps typically are secured by contingent collateral arrangements pursuant to which we agree to post collateral to secure our transactions in the event the transaction performance severely deteriorates or we experience a corporate credit event such as a downgrade of our insurance subsidiary to below an "A-" financial strength rating. Our willingness to provide such security, combined with our insurance rated platform, enhances counterparties' willingness to do business with us and differentiates our business model from "AAA" rated financial guarantors and similar entities that are typically unable or unwilling to provide such collateral arrangements. While generally we receive a fixed payment or premium for the sale of credit protection on a quarterly basis, in certain circumstances we receive a single premium that is paid up front at the time that we enter into such insured credit swap.
A large portion of our Structured Credit business consists of the insurance of CSOs. In single tranche transactions, we negotiate with dealers to construct a portfolio of reference entities, our attachment point and the size of our aggregate exposure that we will insure, each in accordance with the risk profile that we are willing to assume. We also enter into insured credit swaps assuming the risk of single tranches that reference other CSO liabilities that in turn reference a portfolio of corporate entities.
117
For cash flow CDO, MBS and ABS transactions, we generally sell protection in the form of insured credit swaps that reference certain tranches of liabilities issued by those structures. Under our insured credit swaps we are obligated to make payments to a protection buyer in the event that the assets purchased in such structures have insufficient cash available to pay principal or interest on the referenced liability, or the assets underlying the referenced liability are written down. We also enter into insured credit swaps assuming the risk of tranches of cash flow CDOs that are secured by the liabilities of other cash flow CDOs, which are in turn secured by classes of ABS or MBS.
As of June 30, 2006, 99.73% of our insured credit swap portfolio was constructed of exposures with credit profiles equivalent to "AAA" rated exposures. However, beginning in 2005, we have assumed credit risk exposure that would be rated lower than "AAA." We anticipate some growth in insuring credit exposure lower than "AAA" rated credit profiles when such exposures are expected to meet our risk-adjusted return requirements. We also intend to grow our Structured Credit business through the expansion of our current insurance products and the introduction of new asset classes and insurance products, including selling credit protection on tranches referencing portfolios of MBS with various ratings, selling protection on single-name MBS (with various credit ratings), and executing credit swap transactions that reference the developing ABS indices.
Structured Credit Portfolio
The chart below shows the notional amounts of our insured Structured Credit portfolio as of June 30, 2006 and December 31 of each year since we closed our first Structured Credit transactions in 2002.
Notional Amount of Structured Credit Portfolio
(in billions)
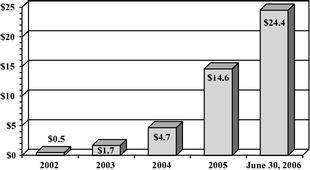
We executed our first Structured Credit transaction in July of 2002. As of June 30, 2006, we had completed 121 transactions with 108 of these currently outstanding and our insured Structured Credit portfolio totaled $24.4 billion (in aggregate credit swap notional amount). One way in which we manage risk in our insured credit swap portfolio is by means of diversification based on a variety of criteria, including reference entities, industries and geography. Our insured credit swaps written on CSO tranches include 1,271 reference entities spread across 46 industries in 46 countries. Reference entities domiciled in the United States and outside of the United States comprised 55% and 45%, respectively, of our CSO portfolio at June 30, 2006. All of our insured credit swaps are denominated in United States dollars except for two transactions denominated in euro.
118
The chart below shows our Structured Credit portfolio by deal type as of June 30, 2006:
| Deal Type | Notional Amount (in millions) | Percent of Portfolio | Number of Deals | Percent of Portfolio | ||||||||
|---|---|---|---|---|---|---|---|---|---|---|---|---|
| CDO/CSO | ||||||||||||
| Corporate | $ | 20,163 | 82.5 | % | 87 | 80.6 | % | |||||
| ABS/MBS | 4,011 | 16.4 | 16 | 14.8 | ||||||||
| Multisector | 202 | 0.8 | 2 | 1.9 | ||||||||
| Other | 51 | 0.2 | 1 | 0.9 | ||||||||
| Total CDO/CSO | 24,427 | 99.9 | % | 106 | 98.2 | % | ||||||
| ABS/MBS | 9 | 0.1 | 2 | 1.8 | ||||||||
| Total | $ | 24,436 | 100.0 | % | 108 | 100.0 | % | |||||
Counterparties
As of June 30, 2006, we had 22 counterparties in our Structured Credit business. Strengthening and expanding relationships with our counterparties is an important element of our business strategy. We enter into ISDA master agreements that govern the standard terms of our transactions with each of our counterparties, and a standard form insurance policy, which allows us to capitalize on market fluctuations and execute transactions in a timely and efficient manner.
Transaction Pricing and Execution
The fixed payments that we receive in connection with our transactions are largely determined by the results of our quantitative modeling and credit swap market conditions, both generally and with respect to the particular reference entities included in a given portfolio. Our decision to enter into a particular transaction at a price is framed by our analysis of the underlying credits and by our proprietary model which considers numerous variables including the credit quality of the portfolio, the tranche ratings, the transaction terms and structural features, including the need for and terms of any potential collateral posting. We analyze our model's output and the market context of the subject transaction in light of our risk and economic return parameters. We document our Structured Credit transactions through a combination of a credit swap and an insurance policy.
MUNICIPAL FINANCE
General
We provide financial guaranty insurance through our subsidiary ACA Financial Guaranty, which has an "A" financial strength rating by S&P, primarily to underserved segments of the municipal finance market. Our financial guaranty insurance policies guarantee to investors the payment of the principal and interest on the insured obligation in accordance with the original payment schedule. ACA Financial Guaranty is licensed to write financial guaranty insurance in all 50 states, the District of Columbia, Guam, Puerto Rico and the U.S. Virgin Islands. As of June 30, 2006, we had $6.3 billion total net par guaranteeing municipal bonds.
Consistent with general market practice, we are typically paid our insurance policy premiums up front. Our premiums are negotiated to capture a portion of the difference in the borrowing cost, or spread, between our insured obligations and the same obligations if issued uninsured. ACA Financial Guaranty is the sole "A" rated financial guarantor. The strong capitalization of our financial guaranty insurance subsidiary following our $170 million equity capital raise in 2004 increased customer awareness of our name and confidence in our ability to maintain our financial strength rating. We also experienced improved pricing on ACA Financial Guaranty insured municipal finance bonds across all
119
industry sectors, as well as tighter and more consistent spreads as measured against the municipal market data "AAA" general obligation yield curve.
Target Municipal Finance Market
We target municipal bond issuers that are underserved by other market participants by reason of industry sector, credit characteristics, transaction size or rating. Specifically, with respect to ratings, we target lower investment grade, non-investment grade and non-rated issuers in the municipal finance market that have, by our estimation, a strong credit profile or where the credit profile has been sufficiently enhanced by additional security to support our expectation of timely payment. Such additional security typically includes liens on the assets funded by the bond issuance, mortgages on the underlying properties and revenue pledges amongst other forms of security as appropriate, all of which would be available to us in order to satisfy the principal and interest payments in the case of a default. As an "A" rated financial guarantor, we are less constrained by the rating agencies than "AAA" rated financial guarantors, which gives us a competitive advantage in these underserved sectors of the municipal finance market. We originate our municipal finance insurance business through our internal sales force and referrals from investment banks, financial advisors and previously insured obligors.
Prior to June 2004, we also participated in the secondary market for municipal bonds. In such cases, a holder of outstanding bonds in the secondary market will purchase financial guaranty insurance to facilitate the future sale of the bonds. The financial guaranty insurance typically increases the sale price of the bonds by an amount in excess of the cost of the insurance policy, making the purchase of the policy economically attractive to the bondholder. As is the case with new issues, the premium is generally payable in full at the time of policy issuance. Our current business strategy does not include any significant secondary market insurance participation; however, we will employ secondary market executions to supplement existing primary market exposures or in situations where we know the credit fundamentals of a particular issue of municipal bonds through primary underwriting.
Our overall penetration of our target market is 1.7% for 2005. The table below sets forth our market penetration by bond type for 2005:
Target Market Analysis
ACA Capital Target Market 2005
| | Target Market 2005 | ACA 2005 | |||||||||
|---|---|---|---|---|---|---|---|---|---|---|---|
| Sector | Par Issued(1) (in millions) | Number of Issues(1) | Par Written (in millions) | Market Penetration | |||||||
| General purpose | $ | 10,325.7 | 1,227 | $ | 58.2 | 0.56 | % | ||||
| Healthcare | 6,548.0 | 284 | 149.4 | 2.28 | |||||||
| Education | 4,546.1 | 1,016 | 103.7 | 2.28 | |||||||
| Housing | 2,614.0 | 170 | 22.0 | 0.84 | |||||||
| Environmental facilities | 1,277.2 | 40 | — | 0.00 | |||||||
| Public facilities | 1,291.1 | 226 | 95.1 | 7.37 | |||||||
| Utilities | 1,153.6 | 360 | — | 0.00 | |||||||
| Transportation | 873.7 | 114 | 35.8 | 4.10 | |||||||
| Development | 571.9 | 77 | 21.9 | 3.83 | |||||||
| Electric power | 189.2 | 33 | 15.0 | 7.93 | |||||||
| Total | $ | 29,390.5 | 3,547 | $ | 501.1 | 1.70 | % | ||||
- (1)
- The information included in this chart is derived from data obtained from Securities Data Corporation as of February 16, 2006. All municipal bonds rated equal to or below "B+" by any of S&P, Fitch Ratings Services, or Fitch, or B1 by Moody's Investor Services, or Moody's, or rated
120
above A- by either S&P or Fitch or A3 by Moody's were excluded, as were all municipal bond issuances that were enhanced by a letter of credit. All municipal bond issuances in the various sectors that were either unrated or for which the ratings were unknown were then added to the data to derive these final calculations. Since issues we insured would be rated "A" and therefore would be excluded pursuant to the process described above, we also added back the par issued and number of issues data for all municipal bond issuances that we insured. The information is calculated on the basis of total par issued and number of issues for the various sectors of the entire municipal bond market as reflected in the chart,excluding those sectors in which we do not participate, such as single family housing, student loans and industrial development bonds, andexcluding notes with an initial term of less than 13 months.
Municipal Finance Portfolio
We seek to maintain an insured portfolio that is designed to manage risk by means of diversification based on a variety of criteria including revenue source, issue size, type of asset, industry concentrations, type of bond and geographic area. As of June 30, 2006, we had 775 municipal policies outstanding relating to 391 unique obligors. Our insured portfolio of bonds is divided into the following major types:
Higher Education Bonds. Higher education bonds that we insure consist primarily of bonds issued to finance the construction of educational facilities. As an example, we insure student housing projects that have strong demand characteristics, involvement by established universities, including participation in the marketing of the facility, and experienced management. In addition, for new construction projects, we require that other insurance and debt service guaranties, or capital, cover completion and certain stabilization risks.
Health Care Revenue Bonds. Health care revenue bonds include long-term financings for capital construction or improvements of health care facilities typically secured by a general reserve pledge and an underlying mortgage note of the not-for-profit corporation owning and operating the individual hospital or health care system. To date, our focus has been on insuring the debt of acute care hospitals that are sole community providers in rural areas or specialty providers of essential services.
Tax-Backed (Non-General Obligation) Bonds. Tax-supported bonds include a variety of bonds that are supported, not by a general obligation, but instead by a specific tax source, and include tax-backed revenue bonds and general fund obligations of the issuer, such as lease revenue bonds. Tax-backed revenue bonds may be secured by a lien on pledged tax revenues, such as revenues from special taxes, including retail sales and gasoline taxes, or from tax increments (or tax allocations) generated by growth in property values within a district.
Long-Term Care Bonds. Long-term care bonds that we insure consist primarily of long-term financings for capital construction or improvements of continuing care retirement communities, or CCRCs. CCRCs are organizations that offer a full range of housing, residential supportive services and healthcare to residents of retirement age. We insure the debt of CCRCs that have been operating with strong demand and stabilized occupancy or are being built to augment established operations.
General Obligation Bonds. General obligation or full faith and credit bonds are issued by states, their political subdivisions and other municipal issuers and are supported by the general obligation of the issuer to pay the bonds from available funds and by a pledge of the issuer to levy sufficient taxes to provide for the full payment of the bonds.
Transportation Revenue Bonds. Transportation revenue bonds include a wide variety of revenue-supported bonds, such as bonds for airports, ports, tunnels, municipal parking facilities, toll roads and toll bridges.
121
Utility Revenue Bonds. Municipal utility revenue bonds include obligations of all forms of municipal utilities, including electric, water and sewer utilities. Insurable utilities may be organized as municipal enterprise systems, authorities or joint-action agencies.
Housing Revenue Bonds. Housing revenue bonds include affordable multifamily housing bonds, with varying security structures based on the presence of underlying mortgages, reserve funds, and various other features.
Investor-Owned Utilities Bonds. Pollution control bonds or industrial development bonds are issued to finance projects of investor-owned utilities. The bonds are secured by the senior credit or first mortgage obligations of an investor-owned utility, typically an electric distribution utility.
Other Municipal Bonds. Other types of domestic municipal bonds insured by ACA Financial Guaranty include private college and university revenue bonds, and financings for stadiums, government office buildings, recreation facilities, resource recovery facilities, prison facilities and mobile home parks. These bond types are typically secured by a combination of project-related fee revenue, lease payments or other support of state or local governmental entities.
The following table shows the diversification by bond type of our municipal finance insured portfolio as of June 30, 2006:
Insured Municipal Finance Portfolio by Bond Type
(in millions)
| Bond Type | Net Par Exposure | Percent of Municipal Portfolio | |||||
|---|---|---|---|---|---|---|---|
| Higher Education | $ | 1,459.1 | 23.3 | % | |||
| Healthcare | 894.1 | 14.3 | |||||
| Tax-Backed | 829.0 | 13.2 | |||||
| Long Term Care | 742.2 | 11.8 | |||||
| General Obligations | 568.2 | 9.1 | |||||
| Transportation | 394.9 | 6.3 | |||||
| Housing | 309.9 | 4.9 | |||||
| Not For Profit | 301.2 | 4.8 | |||||
| Utility | 278.6 | 4.5 | |||||
| Other | 488.3 | 7.8 | |||||
| Total Municipal Finance | $ | 6,265.5 | 100.0 | % | |||
The table below sets forth the geographic distribution, by location of the obligor, of our net par exposure by the ten largest jurisdictions as of June 30, 2006.
Municipal Finance Insured Portfolio by State or Territory
(in millions)
| Location | Net Par Exposure | Percent of Municipal Portfolio | |||||
|---|---|---|---|---|---|---|---|
| California | $ | 1,133.4 | 18.1 | % | |||
| New York | 657.7 | 10.5 | |||||
| Florida | 315.5 | 5.0 | |||||
| Texas | 310.7 | 5.0 | |||||
| Pennsylvania | 287.4 | 4.6 | |||||
| Washington | 280.5 | 4.5 | |||||
| U.S. Virgin Islands | 265.6 | 4.2 | |||||
| Colorado | 201.2 | 3.2 | |||||
| Arizona | 196.1 | 3.1 | |||||
| Illinois | 175.0 | 2.8 | |||||
| Total 10 Municipal Finance | 3,823.1 | 61.0 | % | ||||
| Other Municipal | 2,442.4 | 39.0 | % | ||||
| Total | $ | 6,265.5 | 100.0 | % | |||
122
As of June 30, 2006, the municipal net par amount outstanding for our 20 largest credits, totaling $1.4 billion, was 22% of our total municipal net par amount outstanding, with no one credit representing more than 2.9% of our total net par amount outstanding.
We underwrite financial guaranty insurance on the assumption that the insurance will remain in force until maturity of the insured obligations.
CDO ASSET MANAGEMENT
General
We are an asset manager of CDOs. To grow our assets under management, we sponsor CDOs that acquire pools of fixed income assets that we select and manage through our registered investment adviser subsidiary, ACA Management, L.L.C. We completed our first CDO in January 2002 and as of June 30, 2006, we had closed 17 CDO transactions and had grown our CDO assets under management from $2.4 billion as of year-end 2002 to $12.1 billion as of June 30, 2006. At June 30, 2006, our weighted average asset management fee was 0.21% on total CDO assets under our management. Based on our knowledge of the market, we believe we are one of the largest global CDO managers as ranked by assets under management.
The chart below reflects assets under management as of June 30, 2006 and December 31 of each year since we closed our first CDO in 2002.
CDO Assets Under Management
(in millions)
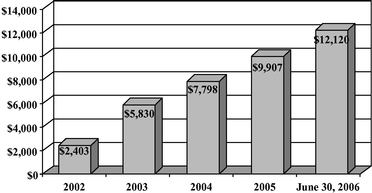
We receive multiple revenue streams in connection with our CDO products. We receive fees for structuring the CDOs, fees during the period the CDO assets are accumulated, which we call the warehouse phase, and fees for providing asset management services during the term of the CDO. We currently invest in a portion of the equity of our CDOs, generally ranging between 5% and 25% of the equity sold, which resulted in total equity investments of $18.9 million in 2005 and the first six months of 2006 with respect to an increase of $4.3 billion in CDO assets under management in 2005 and the first six months of 2006. We view our equity investments as an opportunity to increase the marketability of our CDOs by aligning our interests as manager with those of our CDO investors. As an equity investor in our CDOs, we receive a payment from any proceeds generated by the underlying collateral in excess of expenses and debt service on the liabilities issued by the CDO.
Each of our managed CDOs includes a diversified portfolio of financial obligations such as bonds, loans and/or credit swaps that reference individual bonds or loans. We currently sponsor and manage CDOs backed by investment grade corporate financial obligations, ABS and RMBS, and non-investment grade leveraged loans and bonds. CDOs do not always own their underlying collateral
123
outright but rather, in certain structures, achieve collateral exposure by entering into credit swaps, in which case the structures are referred to as synthetic CDOs. Our corporate credit CDOs and certain of our ABS CDOs are synthetic CDOs. In addition, many of our cash flow CDOs allow for some portion of the underlying exposures to be obtained synthetically through credit swaps.
At June 30, 2006, we managed over 2,314 credit positions across 52 industries in our CDOs, all of which are actively monitored by our credit analysts. We have an experienced staff of professionals with backgrounds in insurance, credit analysis, capital markets and risk assessment that services our CDO Asset Management business as well as a strong infrastructure of legal, accounting, information technology and other professionals.
The following tables provide certain information on our CDO assets under management as of June 30, 2006:
CDO Assets Under Management—ABS
| Year Deal Closed | CDO Name | Structure | Collateral Type(1) | Notional Portfolio Size At Inception (in millions) | Current AUM (in millions) | Original Investment in Retained Equity (in millions) | Retained Equity % | First Optional Call Date | Maturity Date | ||||||||||||
|---|---|---|---|---|---|---|---|---|---|---|---|---|---|---|---|---|---|---|---|---|---|
| 2002 | ACA ABS 2002-1 | Cash Flow | Investment Grade | $ | 400 | $ | 260 | $ | 18.0 | 100 | % | 08/01/05 | 08/01/37 | ||||||||
| 2003 | ACA ABS 2003-1 | Cash Flow | Investment Grade | 400 | 404 | 18.0 | 100 | 06/10/07 | 06/10/38 | ||||||||||||
| 2003 | Grenadier Funding Ltd | Cash Flow | High-Grade | 1,500 | 1,493 | 22.5 | 100 | 08/05/08 | 08/05/38 | ||||||||||||
| 2003 | ACA ABS 2003-2 | Cash Flow | Investment Grade | 725 | 732 | 33.5 | 100 | 12/10/07 | 12/10/38 | ||||||||||||
| 2004 | ACA ABS 2004-1 | Cash Flow | Investment Grade | 450 | 440 | 10.0 | 61 | 07/10/07 | 07/10/39 | ||||||||||||
| 2004 | Zenith Funding | Cash Flow | High-Grade | 1,500 | 1,511 | 13.0 | 52 | 12/06/09 | 12/06/39 | ||||||||||||
| 2005 | ACA ABS 2005-1 | Cash Flow | Investment Grade | 452 | 452 | 4.4 | 24 | 04/05/08 | 04/05/40 | ||||||||||||
| 2005 | ACA ABS 2005-2 | Cash Flow | Investment Grade | 450 | 454 | 2.1 | 10 | 09/06/09 | 12/06/44 | ||||||||||||
| 2005 | Khaleej II | Synthetic | Investment Grade | 750 | 750 | 4.5 | 14 | 09/20/09 | 09/20/40 | ||||||||||||
| 2006 | Lancer Funding | Cash Flow | High-Grade | 1,500 | 1,500 | 1.5 | 10 | 07/06/10 | 04/06/46 | ||||||||||||
| 2006 | ACA ABS 2006-1 | Cash Flow | Investment Grade | 750 | 750 | 1.4 | 5 | 06/10/13 | 06/10/41 | ||||||||||||
| Total: | $ | 8,877 | $ | 8,746 | $ | 128.9 | |||||||||||||||
CDO Assets Under Management—Corporate
| Year Deal Closed | CDO Name | Structure | Collateral Type(1) | Notional Portfolio Size At Inception (in millions) | Current AUM (in millions) | Original Investment in Retained Equity (in millions) | Retained Equity % | First Optional Call Date | Maturity Date | ||||||||||||
|---|---|---|---|---|---|---|---|---|---|---|---|---|---|---|---|---|---|---|---|---|---|
| 2002 | ACA CDS 2001-1 | Synthetic | Investment Grade | $ | 1,000 | $ | 975 | $ | 22.5 | 100 | % | N/A | 04/10/07 | ||||||||
| 2002 | ACA CDS 2002-1 | Synthetic | Investment Grade | 1,000 | 965 | 22.0 | 100 | N/A | 07/15/08 | ||||||||||||
| 2003 | ACA CDS 2002-2 | Synthetic | Investment Grade | 1,000 | 1,000 | 25.0 | 100 | N/A | 03/31/08 | ||||||||||||
| 2005 | Argon 49 | Synthetic | Investment Grade | 61 | (2) | 64 | (2) | 0 | 0 | N/A | 06/20/15 | ||||||||||
| 2006 | Argon 57 | Synthetic | Investment grade | 64 | (2) | 64 | (2) | 0 | 0 | N/A | 06/20/13 | ||||||||||
| Total: | $ | 3,125 | $ | 3,068 | $ | 69.5 | |||||||||||||||
124
CDO Assets Under Management—Leveraged Loan
| Year Deal Closed | CDO Name | Structure | Collateral Type(1) | Notional Portfolio Size At Inception (in millions) | Current AUM (in millions) | Original Investment in Retained Equity (in millions) | Retained Equity % | First Optional Call Date | Maturity Date | ||||||||||||
|---|---|---|---|---|---|---|---|---|---|---|---|---|---|---|---|---|---|---|---|---|---|
| 2005 | ACA CLO 2005-1 | Cash Flow | Non-Investment Grade | $ | 300 | $ | 306 | $ | 5.0 | 21 | % | 10/15/09 | 10/15/17 | ||||||||
| Total: | $ | 300 | $ | 306 | $ | 5.0 | |||||||||||||||
- (1)
- Investment grade collateral is rated "BBB-" or better; however certain of our investment grade CDOs include the ability to invest a minority portion (20% or less) in non-investment grade assets. High-grade is "A-" or better.
- (2)
- The original notional deal sizes for Argon 49 and Argon 57 were €50 million each. For purposes of this chart, we have converted the amounts to U.S. dollars at the prevailing currency exchange rates on June 30, 2006.
The following is a diagram of a typical CDO origination and management process. The CDO origination process typically takes six to nine months for ABS CDOs and two to four months for CDS CDOs:
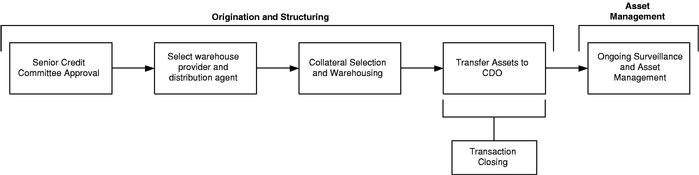
Origination and Structuring of CDOs
Engagement and Structuring
We first determine the basic structure of a CDO, including the types of assets that may be included in the collateral acquired in the CDO, the minimum average rating of such assets, the financing costs to be paid to the investment bank for warehousing such assets during the warehousing phase, structuring and management fees to be paid to us and distribution fees for placement of the liabilities to be paid to the investment bank. These arrangements are approved by our Senior Credit Committee. The Senior Credit Committee defines our transactional underwriting guidelines and monitors compliance, reviews portfolio risk management policies and procedures, approves any credit risk we assume during the warehousing phase and the appropriateness of all fees paid to us. Once we agree on a structure, we engage an investment bank to warehouse the assets and distribute the liabilities.
Warehousing and Credit Selection
We enter into a warehousing agreement with the investment bank to provide financing for the accumulation of assets to be included in a particular CDO. During the warehousing period, at our direction, the investment bank acquires the securities that will constitute the assets of the CDO and continues to "warehouse" those assets until the transaction is closed and the assets are transferred to the CDO. During the warehouse phase, the assets are owned by the sponsoring bank. The completion
125
of the warehousing stage of a CDO typically takes approximately 30 days for a synthetic CDO and six to nine months for a cash flow CDO. During this stage, we are generally accountable to pay losses on any assets that default during the warehouse phase up to an aggregate pre-negotiated amount. The warehouse facility has been provided by a third party in all of our CDO transactions and we have not incurred losses on any defaulted assets during the warehouse phase of any of our CDO transactions.
Pursuant to an established credit process that includes extensive analysis of each potential asset to be included in a CDO and formalized collateral committee approvals, we then advise the investment bank warehousing the CDO as to the selection of the assets to be included in the CDO portfolio. If the credit quality of any of the selected assets deteriorate during the warehousing phase, we also advise the investment bank as to potential trading opportunities or strategies.
Acquiring assets in our targeted credit classes is highly competitive. Our ability to source such opportunities is important to our success. Through our CDO Asset Management and Structured Credit businesses, we have developed close relationships with numerous financial intermediaries, investment banks, commercial banks and brokerage firms which provide a source for many of the assets included in our CDOs. We also capitalize on the relationships developed by our senior management and portfolio managers, who have many years of experience in the market, to enhance our access to such assets.
Once the warehousing of assets is completed, we work with the investment bank to determine the liability structure of the CDO given the actual portfolio of assets accumulated. The investment banks distribute these liabilities as well as the preferred shares or equity securities that we do not purchase to investors worldwide. The investor base for our CDOs is comprised largely of banks, money managers, hedge funds, non-bank financial institutions, pension funds and insurance companies. The liabilities sold to third party investors have recourse solely to the assets of the CDO; we do not credit enhance any portion of the CDO liabilities for third party investors.
Management of CDO Assets
Investment Strategy
In structuring and managing our CDO portfolios we seek to diversify among industries, issuers, credit quality, types of instruments and other parameters as required to meet certain tests developed by the rating agencies and necessary to achieve and maintain the desired ratings on the various classes of CDO liabilities. Depending on the size of a CDO, it will typically own or reference in excess of 100 individual assets or reference entities.
As an asset manager, we are responsible for monitoring credits in our CDOs, and, in certain structures, reinvesting principal proceeds received by the CDO from the prepayment of underlying collateral. In constructing and managing our portfolios we generally follow a buy and hold strategy. However, we retain the ability to limit losses in our CDOs by trading deteriorating credits in a timely manner or hedging potential losses. We trade primarily to offset deteriorating credit exposures as opposed to trying to improve yield.
Typical Asset Management Agreement Terms
Under our asset management agreements with each of our CDOs, we are paid management fees quarterly for managing the selection, acquisition and disposition of the underlying collateral and for monitoring the underlying collateral. Our fees are typically divided into a senior fee and a subordinated fee and are paid out of cash flow from the underlying assets to the extent available. The senior fee is
126
payable after certain expenses of the CDO but prior to payment on the CDO liabilities, whereas the subordinate fee is payable after payment of debt service on the CDO liabilities. To date, we have received all contractually agreed-upon senior and subordinated fees. In certain transactions we are also paid an incentive fee to the extent returns on the equity of the CDO exceed an agreed-upon annual rate of return. In synthetic CDOs, our management fees are paid out of the quarterly payments paid to the CDO pursuant to the terms of the underlying portfolio of credit swaps. Generally, our services as asset manager may be terminated without cause by a vote of a majority of the holders of each class of debt securities and the equity tranche. We may also be removed "for cause" upon the occurrence of certain events on the affirmative vote of a majority of the holders of the senior CDO liabilities or a majority vote of the holders of the equity.
Equity Investment
In order to better align the interests of the asset manager with those of the CDO investors, CDO investors typically require that asset managers purchase a portion of the equity, or first loss position, in their CDOs. We do not view these investments as a revenue strategy but rather as an opportunity to increase the marketability of our CDOs and thereby maximize our CDO assets under management. We purchase a portion of the preferred shares, or, in respect of our synthetic CDOs, enter into credit swaps requiring payment (pro rata with other equity holders) up to a certain amount on a first loss basis should defaults occur in the underlying referenced portfolio. We have historically financed substantially all of our equity investments, through either the investment bank participating with us in the CDO or other corporate borrowings.
While in our early transactions we invested in 100% of the equity tranches of our CDOs, since 2004, our growth in assets under management and historical asset management performance have allowed us to reduce the level of equity investments to between 5% and 25% of the total equity sold in a CDO. As of June 30, 2006, we have completed 17 CDOs, representing $12.1 billion in outstanding CDO assets under management. We have retained economic exposure through the purchase of equity in our CDOs of $20.8 million relative to $4.3 billion CDO assets under management added in 2005 and the first six months of 2006. As of June 30, 2006, our total outstanding equity investment in our CDOs was $205.3 million.
Other
Beginning in May 2006, we initiated and hold a portion of the equity interest in a credit opportunity fund which we also manage. We intend to grow the assets under management in the fund through third party investment.
Conflict Resolution
In addition to providing management services to CDOs we originate and structure, we also provide management services to portfolios structured by third parties and provide investment advice to our credit opportunity fund established in May 2006, in which we are an investor. We may also enter into new lines of business. We may encounter conflicts of interest in these various roles and interests and between these roles and interests and our proprietary investment interests. We intend to act in a manner which is fair and equitable in allocating business opportunities and have established an allocation and conflict resolution process should conflicts occur; however, because of these potential conflicts, we may not be able to participate in certain opportunities which otherwise meet our business objectives.
127
OTHER
We have a fourth line of business, Other, which encompasses insurance products in which we are no longer active, including industry loss warranty transactions, trade credit reinsurance and insurance of certain classes of assets in asset-backed securitizations, principally manufactured housing. At June 30, 2006, all of the exposure in this business line had either expired or was in run-off. Run-off indicates that while we will not add new exposure, we have some current exposure that has not yet expired.
With respect to the industry loss warranty transactions contained in "Other," we incurred $21.0 million of losses in 2004. We no longer have outstanding exposure to such business, nor do we intend to engage in such transactions in the future and, due to changes in applicable financial guaranty insurance law, we are no longer able to engage in such transactions. An industry loss warranty is a reinsurance contract in which the payout is dependent on the occurrence of two triggers. The first trigger is the occurrence of an insured loss of the buyer; the second trigger is the loss to the insurance industry as a whole. Industry loss warranties are primarily used to protect against property risk, property catastrophe, marine, aviation, satellite losses, terrorism and workers' compensation catastrophe.
With respect to the trade credit reinsurance portion of "Other," this business was in run-off at June 30, 2006. Trade credit insurance provides protection against bad debt losses and export trade risks. We did not enter into new trade credit reinsurance contracts during 2005 or the first six months of 2006; however, we have outstanding exposure to contracts entered into during 2003 and 2004 until such exposure expires, generally over the next five years. On a net margin basis, defined as premiums earned less losses and commission and brokerage expenses, the contribution of these trade credit reinsurance contracts to our net income was $(0.4) million, $0.1 million, $0.7 million and $0.1 million for the six months ended June 30, 2006 and each of the years ended 2005, 2004 and 2003, respectively. We have no plans to enter into new trade credit reinsurance contracts in the future.
Three of a portfolio of 12 securitized manufactured housing bonds that we insured in 1999 experienced losses in 2004 and 2005. In response to an increase in the rate of delinquencies observed in the mortgages underlying each of the related securitizations, we established a case specific reserve in 2004 in the amount of $20.3 million. This reserve represented the present value of expected losses, discounted at the applicable treasury rate. Due to the very long tenor of these bonds, payments are projected to continue through 2033. Each year we increase the reserve for accretion to adjust to the proper present value. While the reserve represents our best estimate at the time of establishment of ultimate losses on a present value basis, facts and circumstances may change such that the estimate is required to be revalued. In 2005, in addition to the $1.0 million we recorded for accretion less the $0.7 million we made in claim payments, we increased the reserve by an additional $2.4 million. In the first six months of 2006, this reserve increased $0.5 million due to accretion. As of June 30, 2006, the reserve was $23.5 million.
INSURED RISK PORTFOLIO
ACA Financial Guaranty assumes credit risk through the issuance of financial guaranty insurance policies across all of our business lines. While we are subject to S&P guidelines and capital adequacy tests which we must meet in order to maintain our "A" rating, as well as internal risk management parameters, our insured risk portfolio contains exposures of various credit qualities.
128
The tables below set forth ACA Financial Guaranty's net par exposure by business line and, within each business line, ACA Financial Guaranty's net par exposure by credit quality as of June 30, 2006.
Net Par Exposure by Business Line
| Business Line | Amount | Percent of Insured Portfolio | |||||
|---|---|---|---|---|---|---|---|
| | (in millions) | ||||||
| Structured Credit | $ | 24,436 | 77.9 | % | |||
| Municipal Finance | 6,265 | 19.8 | |||||
| CDO Asset Management | 148 | 0.5 | |||||
| Other | 556 | 1.8 | |||||
| Total | $ | 31,405 | 100.0 | % | |||
Net Par Exposure by Credit Quality
| | Municipal Finance | Structured Finance(1) | Total | ||||||||||||||
|---|---|---|---|---|---|---|---|---|---|---|---|---|---|---|---|---|---|
| Credit Quality of Portfolio(2) | Amount | Percent of Municipal Finance Portfolio(3) | Amount | Percent of Structured Finance Portfolio(3) | Amount | Total Portfolio(3) | |||||||||||
| | | | (in millions) | | | ||||||||||||
| AAA | $ | 10 | .2 | % | $ | 24,704 | 98.3 | % | $ | 24,714 | 78.7 | % | |||||
| AA | 53 | 0.8 | 160 | 0.6 | 213 | 0.7 | |||||||||||
| A | 230 | 3.7 | 8 | — | 238 | 0.7 | |||||||||||
| BBB | 3,787 | 60.4 | 13 | 0.1 | 3,800 | 12.1 | |||||||||||
| Below investment grade | 2,185 | 34.9 | 255 | 1.0 | 2,440 | 7.8 | |||||||||||
| Total par exposure | $ | 6,265 | 100.0 | % | $ | 25,140 | 100.0 | % | $ | 31,405 | 100.0 | % | |||||
- (1)
- Structured Finance includes Structured Credit, CDO Asset Management and Other net par exposure of $24,436 million, $148 million and $556 million, respectively. Structured Credit net par exposure by credit quality is 99.73% AAA, 0.10% AA, .03% A, 0.0% BBB, 0.14% below investment grade based on internal credit ratings.
- (2)
- Ratings assigned are internal credit ratings.
- (3)
- Exposure percentages do not reflect applicable reinsurance or any collateral posted for the benefit of the insured party.
UNDERWRITING AND RISK MANAGEMENT
We have adopted formalized underwriting and risk management policies and procedures across our business lines designed to ensure that the risk profile of a given credit is consistent with our credit standards and that the related transaction affords us adequate profitability and is otherwise appropriate for our portfolio. Our credit assessment, underwriting, risk management and surveillance processes across all of our business lines are designed to limit loss frequency and severity; however, we anticipate both cyclical and idiosyncratic credit event loss activity across our portfolio of credit exposures. Consequently, we place significant emphasis on managing loss severity should losses occur.
We have established a Risk Management Committee that monitors and seeks to limit our exposure to any one credit on an aggregate basis across our business and our investment portfolio. We also employ hedging strategies, which are directed by our Risk Management Committee. The Risk Management Committee is overseen by the Risk Oversight Committee of our Board of Directors. We
129
are also subject to certain regulatory limits and rating agency guidelines on our exposure to a single risk.
We have a Senior Credit Committee mandated to create and support a credit culture throughout our company, establish underwriting policies and procedures (subject to review by our Board of Directors), define underwriting guidelines and monitor compliance, require appropriate portfolio risk management and approve the assumption of risk and related pricing, including commitments to insure. The Senior Credit Committee consists of eight members, including our Chief Executive Officer, Chief Financial Officer, General Counsel and Executive Vice President, Head of Institutional Risk Management. An approval by the Senior Credit Committee also requires the affirmative vote of the Chief Executive Officer.
In our Municipal Finance business, we assume credit risk to the scheduled maturity of the underlying bond. Our decision to assume credit risk in a particular transaction is based on a rigorous quantitative and qualitative analysis of such transaction and its incremental effect on our existing risk portfolio.
Underwriting Committee Process for Structured Credit and CDO Asset Management Transactions
The Senior Credit Committee serves as the principal underwriting committee for Structured Credit and CDO Asset Management transactions. Structured Credit transactions are brought to the Senior Credit Committee by the applicable underwriter and reviewed in context of numerous variables, including the credit quality of the portfolio, tranche ratings, transaction terms and structural features, such as the need for and terms of any potential collateral posting. The power to approve certain transactions with standard pre-approved terms may be delegated to a sub-committee of the Senior Credit Committee. In the case of CDO Asset Management transactions, a portfolio manager will seek approval from the Senior Credit Committee for the asset class being managed on behalf of ACA Capital and other third party investors and the general terms of such management, including the applicable management fees. The Senior Credit Committee has delegated the authority to acquire equity in our CDOs within certain parameters and subject to specified return thresholds and the approval of the Chief Financial Officer of any financing terms. The Senior Credit Committee has also delegated the approval of individual security acquisition rights to the relevant Collateral Committees.
We have three different collateral committees. Each of the collateral committees is chaired by the Executive Vice President, Head of Credit and President of ACA Management, L.L.C., who, as well as our Chief Executive Officer, has an individual right to reject any credit. Credits approved by a collateral committee are eligible to be included in a portfolio. The portfolio manager ultimately determines whether to purchase an approved asset for inclusion in a given CDO portfolio.
- •
- Our ABS collateral committee approves the selection of assets for all cash flow and synthetic ABS CDO transactions.
- •
- Our corporate credit committee approves exposure to corporate reference entities on our synthetic corporate CDOs.
- •
- Our leveraged loan committee approves participation in the loans to be included in our CLOs.
Underwriting Committee Process for Municipal Finance Transactions
Municipal Finance transactions are subject to the approval of either the Municipal Finance Underwriting Committee, which includes our Chief Executive Officer, our Executive Vice President, Institutional Risk Management and an attorney from the General Counsel's office, or the Senior Credit Committee. The primary objective of the Municipal Finance Underwriting Committee is to approve routine municipal finance transactions, whereas approval of the Senior Credit Committee is required for larger transactions or those with non-routine collateral packages or transaction terms. All
130
transactions, whether approved by the Municipal Finance Underwriting Committee or the Senior Credit Committee, require the approval of the Chief Executive Officer.
The Municipal Finance Underwriting Committee or the Senior Credit Committee, as the case may be, reviews the transaction terms, security package and credit, as well as proposed pricing relative to market spreads and returns on capital based on S&P's capital charges.
SURVEILLANCE
Structured Credit and CDO Asset Management Surveillance
We have a dedicated team of credit analysts with an average of over 13 years of experience in fixed income and corporate credit analysis. We actively monitor the performance of the underlying assets included in our Structured Credit and CDO transactions. The extent to which we monitor a particular credit is generally determined by the degree of stress that credit is experiencing, and the potential impact that a particular credit may have on a given transaction or across transactions and in our investment portfolio. As a part of the monitoring process we review credit ratings and periodic financial reporting, and track current news, research and monthly asset performance reports, in addition to rating agency reports and actions, on individual credits. We also continually assess and update our systems and the models we employ to analyze the overall impact of credit migrations and actual versus expected cash flow on our portfolios, as well as on our aggregate exposure across our operating business lines and in our investment portfolio.
Structured Credit. Our proprietary programs, SARA and CDO Wizard, are the primary applications we use for screening, surveilling and reporting on our Structured Credit transactions. The underwriter of a transaction maintains primary responsibility for monitoring the performance of that transaction, including available subordination to our tranche of exposure, cash flows, conformance with projections and, in partnership with our credit analysts, the performance of the underlying credits. For our ongoing surveillance, we have established a five-point classification system into which all of our Structured Credit transactions are classified, as follows:
- •
- Category 1—performing;
- •
- Category 2—underperforming (the credit is deviating from expected performance, but no default is anticipated; more in depth, and potentially more frequent, review is required);
- •
- Category 3—continued deterioration (the credit is experiencing recurring and material violations of surveillance and/or covenants and a ratings downgrade has occurred or is expected; these credits are included on our credit monitor list and an action plan is devised and presented monthly to the surveillance committee by the assigned analyst);
- •
- Category 4—potential impairment of principal (the credit is experiencing continued deterioration, operating results and/or enhancement are significantly below projections and a payment default may occur; these credits are presented to the Senior Credit Committee to formulate and approve an appropriate loss mitigation strategy, which is updated monthly to a surveillance committee and quarterly to the Senior Credit Committee); and
- •
- Category 5—impairment of principal (these credits have experienced or are expected to experience a default that will not be cured, resulting in an impairment of principal; a loss mitigation plan is put in place with respect to these credits and reported and updated monthly to a surveillance committee and quarterly to the Senior Credit Committee).
Our credit analysts and risk management team also specifically review our credit swap portfolios to determine the risk of a default or other credit event of any reference entity included in our portfolios and the impact on the available subordination to our tranche of exposure. If we believe this risk exceeds acceptable levels, depending on the likely impact on our subordination and the overall
131
performance of the relevant portfolio to date, we may seek to reduce or eliminate this credit exposure by removing and substituting reference entities within the relevant portfolio, or hedging our exposure outside of the particular transaction. From time to time, in order to manage our Structured Credit portfolio, we enter into transactions that either unwind prior transactions or assign our position to a third party.
CDO Asset Management. Our proprietary programs, SARA and CDO Wizard, are also the primary applications we use for screening, trading, surveillance and reporting on our CDOs. Potential investments for our CDOs are entered into the system by our credit analysts before a specific asset is acquired and the programs analyze the asset in the context of the relevant portfolio to assure compliance with deal terms. The CDO Asset Management group has adopted the same ratings system with respect to the individual credits in the CDO portfolio as the Structured Credit group applies to its transactions as a whole. Generally, credits are subject to monthly review by the monthly surveillance committee. If certain material events occur concerning the credit, such as a report of negative performance and financial results, a decrease in value of credit enhancement, announced litigation or adverse litigation results, or the occurrence of unexpected rating actions, the committee will recommend a reclassification of such credit to the appropriate category as reflected by its then current state of deterioration. All credits on the credit monitor list of Category 3 and above are reported to the Risk Oversight Committee of our Board of Directors on a quarterly basis. Each of the individual credits held in our CDOs in Category 3 and above are also reviewed and an investment decision, such as to continue to hold, to sell, or to hedge the exposure, is made. Prior to execution of a trade with respect to any such credit, we perform an evaluation of the relevant CDO portfolio.
Municipal Finance Surveillance
Our municipal finance surveillance group is responsible for monitoring outstanding issues of municipal bonds we insure. The group reviews each credit for relevant changes in the economic or political environment which could interrupt the timely payment of debt service on an insured issue of municipal bonds. Additionally, our surveillance group and risk management professionals review our municipal finance portfolio for concentration of risk by (i) specific bond types; (ii) geographic location; and (iii) size of issue. Our underwriting group is also responsible for portfolio analysis, which entails a broader examination of trends in specific asset classes and bond types.
Once an obligation is insured, the surveillance group periodically reviews information relating to each obligor, including audited financial statements, for review. Potential problems uncovered through this review, such as poor financial results, low fund balances, covenant or other trigger violations, trustee or servicer problems, or excessive litigation, could result in an immediate in-depth surveillance review and an evaluation of possible remedial actions. The surveillance group also monitors state and municipal finances and budget developments, and evaluates their impact on issuers of municipal bonds.
We have also established a five-point classification system for all of our Municipal Finance credits, as follows:
- •
- Category 1—performing;
- •
- Category 2—underperforming (the credit is deviating from expected performance but no default or claim payment by us is anticipated; more in depth review and potentially more frequent review is required);
- •
- Category 3—declining (the credit is experiencing recurring and material covenant violations and material deviation from operating and cash flow projections, and we may be required to make a claim payment in the long term; these credits are referred to our director of recovery management and an attorney in our legal department for continued monitoring who, together with surveillance and underwriting personnel, develop an action plan that is then reported to the managing director of surveillance and periodically updated to the loss mitigation committee);
132
- •
- Category 4—deteriorating (the credit is experiencing a material decline in creditworthiness and ability to pay, and draws upon debt service reserve funds indicate that we may be required to make payment of a claim in the foreseeable future; heightened involvement/review by the director of recovery management is required as are more frequent updates of loss mitigation strategies); and
- •
- Category 5—claim(s) paid or imminent (claims have been or will be paid pursuant to a payment default of the underlying obligor on the municipal bond; the director of recovery management has continued responsibility for implementing loss mitigation strategies and frequent reporting, and these credits are subject to write-offs and case basis reserves as determined by our Chief Financial Officer).
Generally, Category 1 credits are reviewed annually and Category 2 credits are reviewed semi-annually. Category 3 credits are reviewed quarterly, except that negatively trending Category 3 credits and all Category 4 and 5 credits are reviewed monthly or more frequently consistent with any related action plan. All credits classified as Category 3 and above are also reported on a quarterly basis to the Risk Oversight Committee of our Board of Directors. In the event a periodic review of a given credit reflects that the credit is not performing as expected, or if an unexpected material event occurs that may adversely affect the related obligor's ability to pay debt service, such as damages pursuant to natural disasters, adverse litigation, the loss of tax revenues due to voter initiatives, or unexpected rating actions, surveillance will recommend a reclassification of such credit to the appropriate category as reflected by its then-current state of deterioration. Our loss mitigation committee, which includes our Chief Executive Officer, Executive Vice President—Head of Municipal Finance, Managing Director and Head of Municipal Finance Surveillance and Managing Director and Chief Accounting Officer, among others, oversees the loss mitigation efforts of the director of recovery management and the surveillance group and periodically reviews and confirms the recommended classifications of our municipal bond credits.
ACA FINANCIAL GUARANTY'S RATING
Our insurance subsidiary's financial strength rating is an important factor in establishing our competitive position in the municipal finance and structured credit market. The value of ACA Financial Guaranty's financial guaranty insurance policy is a function of the "rating" applied to the obligations insured. The rating also provides necessary credit support to our counterparties in our Structured Credit business who, in entering into the credit swaps, rely on the insurance provided in these transactions by ACA Financial Guaranty. From time to time, we also employ the rating to support our general corporate financing activities, including our outstanding medium term note obligations and outstanding notes in connection with the financing of our CDO equity investments. See "Management's Discussion and Analysis of Financial Condition and Results of Operations—Liquidity and Capital Resources—Indebtedness." ACA Financial Guaranty's financial strength is rated "A" ("strong," the sixth highest of twenty-one rating levels) by S&P.
Our insurance subsidiary's financial strength rating reflects only the views of S&P and is subject to revision or withdrawal at any time. A financial strength rating is an opinion regarding the financial security characteristics of an insurance or reinsurance organization with respect to an insurer's ability to pay under its insurance policies and contracts in accordance with their terms. The opinion is not specific to any particular policy or contract. Financial strength ratings do not refer to an insurer's ability to meet non-insurance or non-reinsurance obligations and are not a recommendation to purchase or discontinue any policy or contract issued by an insurer or to buy, hold, or sell any security issued by an insurer or any parent company of any insurer or reinsurer.
S&P has developed and published rating guidelines for rating financial guaranty insurers and reinsurers. The financial strength rating assigned by S&P is based upon factors relevant to policyholders and is not directed towards the protection of investors in our common stock. The rating criteria used by S&P in establishing its ratings include consideration of the sufficiency of capital resources to meet
133
projected growth (as well as access to such additional capital as may be necessary to continue to meet applicable capital adequacy standards), a company's overall financial strength, business plan and strategy, and demonstrated management expertise in financial guaranty and traditional reinsurance, credit analysis, systems development, marketing, capital markets and investment operations.
REINSURANCE
State insurance laws and regulations (as well as the rating agencies) impose minimum capital requirements and single risk limits on financial guaranty insurance companies, limiting the aggregate amount of insurance which may be written and the maximum size of any single risk exposure which may be assumed. Financial guaranty insurance companies can use reinsurance to diversify risk, increase underwriting capacity, reduce capital needs, stabilize stockholder returns and strengthen financial ratios. Although our use of reinsurance has been limited, from time to time, ACA Financial Guaranty may employ a variety of reinsurance structures to help manage risk. As of June 30, 2006 we had purchased an aggregate of $42.3 million of facultative reinsurance in respect of 28 municipal bond insurance policies we issued in order to reduce our single risk exposure to those credits, and $50 million of catastrophic coverage through an excess of loss reinsurance policy.
INVESTMENT PORTFOLIO
Our investment portfolio consists of the assets of ACA Financial Guaranty and the assets of our consolidated CDOs. The following discussion relates to ACA Financial Guaranty. Our principal objective in managing our investment portfolio is to generate an optimal level of after-tax investment income while preserving our "A" financial strength rating, to maintain adequate liquidity and to minimize the correlation with insurance risk. The investment policy is set by our Board of Directors, and ACA Financial Guaranty's investment portfolio is managed by outside professional money managers. To accomplish our objectives, we have established guidelines for building a portfolio of high-quality fixed income investments, requiring that such investments be rated at least "BBB-" at acquisition and the overall portfolio be rated "A+" on average. The portfolio may continue to hold fixed income investments falling below the minimum quality level with approval of our Investment Committee. Eligible fixed income investments include, but are not limited to, U.S. Treasury and agency obligations, corporate bonds, municipal bonds and asset and mortgage backed securities. The following tables set forth certain information concerning our fixed maturity securities investment portfolio.
The following table reflects the composition of our non-VIE investment portfolio, by security type:
Non-VIE Investment Portfolio by Security Type(1)
| | As of June 30, | As of December 31, | ||||||||||||||||||||
|---|---|---|---|---|---|---|---|---|---|---|---|---|---|---|---|---|---|---|---|---|---|---|
| | 2006 | 2005 | 2004 | 2003 | ||||||||||||||||||
| Security Type | Amount | Percentage Investment Portfolio | Amount | Percent of Investment Portfolio | Amount | Percent of Investment Portfolio | Amount | Percent of Investment Portfolio | ||||||||||||||
| | (in millions) | |||||||||||||||||||||
| U.S. Treasury securities | $ | 32.3 | 6.7 | % | $ | 55.6 | 11.4 | % | $ | 86.6 | 20.6 | % | $ | 60.7 | 22.1 | % | ||||||
| Federal agency securities | 68.3 | 14.1 | 46.4 | 9.5 | 31.8 | 7.6 | 29.6 | 10.7 | ||||||||||||||
| Obligations of states and political subdivisions | 118.2 | 24.5 | 120.9 | 24.9 | 28.9 | 6.9 | 29.1 | 10.6 | ||||||||||||||
| Corporate securities | 110.7 | 22.9 | 106.6 | 21.8 | 107.0 | 25.4 | 58.6 | 21.3 | ||||||||||||||
| Asset-backed securities | 13.6 | 2.8 | 11.4 | 2.3 | 19.2 | 4.6 | 16.9 | 6.1 | ||||||||||||||
| Mortgage-backed securities | 139.7 | 29.0 | 146.9 | 30.1 | 147.4 | 34.9 | 80.4 | 29.2 | ||||||||||||||
| Total non-VIE securities | $ | 482.8 | 100.0 | % | $ | 487.8 | 100.0 | % | $ | 420.9 | 100.0 | % | $ | 275.3 | 100.0 | % | ||||||
- (1)
- Excludes assets related to our consolidated CDOs.
134
The following table reflects our non-VIE investment portfolio results for the six months ended June 30, 2006 and each year in the three-year period ended December 31, 2005:
Non-VIE Investment Results(1)(2)
| | | December 31, | |||||||||||
|---|---|---|---|---|---|---|---|---|---|---|---|---|---|
| Investment Category | June 30, 2006 | ||||||||||||
| 2005 | 2004 | 2003 | |||||||||||
| | (in millions) | ||||||||||||
| Average invested assets | $ | 554.0 | $ | 530.0 | $ | 439.2 | $ | 337.7 | |||||
| Investment income(3) | 12.8 | 21.8 | 14.5 | 11.6 | |||||||||
| Effective yield(4) | 4.6 | %(5) | 4.1 | % | 3.3 | % | 3.4 | % | |||||
- (1)
- Excludes assets and results related to our consolidated CDOs.
- (2)
- Includes cash and short term investments.
- (3)
- Excluding investment expenses and realized investment gains (losses).
- (4)
- Investment income for the period divided by average invested assets for the same period.
- (5)
- Annualized rate.
ACA Financial Guaranty's investment portfolio is invested primarily in fixed income securities. The following table shows our non-VIE investment portfolio by comparable rating as of June 30, 2006:
Non-VIE Investment Portfolio by Rating(1)(2)(3)
| Rating | Amount | Percent of Investment Portfolio | ||||
|---|---|---|---|---|---|---|
| | (in millions) | | ||||
| AAA or equivalent | $ | 409.3 | 74.7 | % | ||
| AA | 51.7 | 9.4 | ||||
| A | 51.9 | 9.5 | ||||
| BBB | 25.3 | 4.6 | ||||
| Below investment grade and non-rated | 9.8 | 1.8 | ||||
| Total non-VIE securities | $ | 548.0 | 100.0 | % | ||
- (1)
- Ratings are represented by the lower of the S&P and Moody's Investors Service classifications.
- (2)
- Excludes assets related to our consolidated CDOs.
- (3)
- Includes cash and short term investments.
The following table indicates the composition of our non-VIE fixed income security portfolio by time to maturity as of June 30, 2006:
Distribution of Non-VIE Investments by Maturity(1)(2)(3)
| Investment Category | Estimated Fair Value | Percent of Investment Portfolio | ||||
|---|---|---|---|---|---|---|
| | (in millions) | | ||||
| Due in one year or less | $ | 86.4 | 15.8 | % | ||
| Due after one year through five years | 84.1 | 15.3 | ||||
| Due after five years through ten years | 151.0 | 27.6 | ||||
| Due over ten years | 226.5 | 41.3 | ||||
| Total non-VIE securities | $ | 548.0 | 100.0 | % | ||
- (1)
- Actual maturities could differ from contractual maturities because borrowers have the right to call or prepay certain obligations which may not include call or prepayment penalties.
135
- (2)
- Excludes assets related to our consolidated CDOs.
- (3)
- Includes cash and short term investments.
REGULATION
The following summary is based upon current law and is for general information only.
ACA Financial Guaranty Corporation.
Our financial guaranty insurance subsidiary, ACA Financial Guaranty, is licensed to provide financial guaranty insurance in the State of Maryland (its state of incorporation), as well as in each of the other 49 states, the District of Columbia, Guam, Puerto Rico and the U.S. Virgin Islands. The operations of ACA Financial Guaranty are subject to regulation by the departments of insurance in all of those jurisdictions. The extent of state insurance regulation and supervision varies by jurisdiction, but Maryland, New York and most other jurisdictions have laws and regulations prescribing minimum standards of solvency, including minimum capital requirements and business conduct that must be maintained by licensed insurance companies. These laws prescribe permitted classes of risks which may be written and limitations on the size of risks which may be insured. In addition, some state laws and regulations require the approval or filing of policy forms and rates. ACA Financial Guaranty is required to file detailed annual and quarterly financial statements with the Maryland Insurance Administration and similar supervisory agencies in each of the other jurisdictions in which it is licensed. These financial statements are prepared in accordance with SAP and procedures prescribed or permitted by the insurance departments in the jurisdictions in which ACA Financial Guaranty is licensed to do business. The operations and accounts of ACA Financial Guaranty are subject to examination by these regulatory agencies at regular intervals. The Maryland Insurance Administration conducts an examination of insurance companies domiciled in Maryland every five years. During 2005, the Maryland Insurance Administration completed its field work in connection with a five-year examination of ACA Financial Guaranty for the period from 1998 through 2003. The Maryland Insurance Commissioner has produced a draft report in respect of the examination to which we have responded; however, the final report has not been issued. We believe that we have recorded all material adjustments to our statutory financial statements arising from the examination as of June 30, 2005, but we cannot be certain until the final report is issued.
Maryland Financial Guaranty Insurance Law. Title 31 of the Code of Maryland Regulations establishes, with respect to the transaction of financial guaranty insurance, single and aggregate risk limits, limits on the types of debt instruments and monetary obligations which may be insured, and contingency reserve funding requirements. These limits and reserve requirements are similar to those contained under Article 69 of the New York Insurance Law as described below, which also applies to our financial guaranty insurance policies by virtue of our doing business as a foreign insurer in New York. ACA Financial Guaranty is also subject to the laws and regulations governing financial guaranty in the jurisdictions other than Maryland and New York in which it transacts the business of financial guaranty insurance. The laws and regulations of these other jurisdictions governing financial guaranty insurance are generally not more stringent in any material respect than Article 69 of the New York Insurance Law.
New York Financial Guaranty Insurance Law. Article 69 of the New York Insurance Law is a comprehensive financial guaranty insurance statute that governs all financial guaranty insurers licensed to do business in New York, including ACA Financial Guaranty. This statute limits the business of financial guaranty insurers to financial guaranty insurance and related lines, such as certain types of surety.
Article 69 requires that financial guaranty insurers maintain a special statutory accounting reserve called the contingency reserve to protect policyholders against the impact of excessive losses occurring during adverse economic cycles. Article 69 requires ACA Financial Guaranty to provide a contingency
136
reserve quarterly on a pro rata basis over a period of 20 years for municipal bonds, special revenue bonds and industrial development bonds, and 15 years for all other obligations in an amount equal to the greater of 50% of premiums written for the relevant category of insurance or a percentage of the principal guaranteed (varying from 0.55% to 2.50%, depending upon the type of obligation guaranteed), until the contingency reserve amount for the category equals the applicable percentage of net unpaid principal. Under statutory accounting policies, this reserve must be maintained for the periods specified above, except that reductions by the insurer may be permitted under specified circumstances if actual incurred losses exceed certain thresholds or if the reserve accumulated is deemed excessive in relation to the insurer's outstanding insured obligations. Financial guaranty insurers also are required to maintain an unearned premium reserve as well as reserves for losses and loss adjustment expenses for insured obligations that have already defaulted.
Article 69 establishes single risk limits for financial guaranty insurers applicable to all obligations issued by a single entity and backed by a single revenue source. For example, under the limit applicable to each qualifying issue of ABS issued by a single entity and for each pool of consumer debt obligations, the lesser of (1) the insured average annual debt service for a single risk or (2) the insured unpaid principal (reduced by the extent to which the unpaid principal of the supporting assets and, provided the insured risk is investment grade, the excess spread, exceed the insured unpaid principal), divided by nine, net of qualifying reinsurance and collateral, may not exceed 10% of the sum of the insurer's policyholders' surplus and contingency reserve, subject to certain conditions. Under the single risk limit applicable to municipal obligations, the insured average annual debt service with respect to a single issuer, net of qualifying reinsurance and collateral, may not exceed 10% of the sum of the insurer's policyholders' surplus and contingency reserve. In addition, insured principal of municipal obligations attributable to any single issuer, net of qualifying reinsurance and collateral, is limited to 75% of the insurer's policyholders' surplus and contingency reserve. Single risk limits also are specified for other categories of insured obligations and generally are more restrictive than those listed for asset-backed or municipal obligations.
Article 69 also establishes aggregate risk limits on the basis of aggregate net liability insured as compared to policyholders' surplus and contingency reserves. Aggregate net liability is defined as outstanding principal and interest of guaranteed obligations insured, net of qualifying reinsurance and collateral. Under these limits, policyholders' surplus and contingency reserves must not be less than a percentage of aggregate net liability equal to the sum of various percentages of aggregate net liability for various categories of specified obligations. The percentage varies from 0.33% for certain municipal obligations to 4.00% for certain non-investment grade obligations.
In addition, Article 69 requires 95% of ACA Financial Guaranty's outstanding total liability on municipal bonds, special revenue bonds and industrial development bonds, net of reinsurance and collateral, to be investment grade.
Insurance Holding Company Law. ACA Financial Guaranty is subject to regulation under the insurance holding company statute of Maryland, where ACA Financial Guaranty is domiciled. The holding company statute requires ACA Financial Guaranty to register and file certain reports describing, among other information, our capital structure, ownership, financial condition and transactions with affiliates. The holding company statute also generally requires prior approval of changes in control, the payment of certain dividends and other inter-corporate transfers of assets, and of certain transactions between ACA Financial Guaranty and us and our affiliates. The holding company statute imposes standards on certain transactions between ACA Financial Guaranty and related companies that include that all transactions be fair and reasonable, be appropriately recorded in the books of both parties and be appropriately accounted for, and requires prior regulatory approval for transactions not in the ordinary course of business that exceed specified limits.
The holding company statute prohibits any person from acquiring control of us or ACA Financial Guaranty unless that person has filed a notification with specified information with the Maryland
137
Insurance Commissioner and has obtained the Commissioner's prior approval. Under the Maryland statute, acquiring ten percent or more of the voting stock of an insurance company or its parent company is presumptively considered a change of control, although such presumption may be rebutted. Accordingly, any person who acquires, directly or indirectly, ten percent or more of our voting securities without either the prior approval of the Maryland Insurance Commissioner or a filed and approved disclaimer of control will be in violation of this law and may be subject to injunctive action. In addition, many U.S. state insurance laws require prior notification of state insurance departments of a change in control of a non-domiciliary insurance company doing business in that state. While these pre-notification statutes do not authorize the state insurance departments to disapprove the change in control, they authorize regulatory action in the affected state if particular conditions exist, such as undue market concentration. Any future transactions that would constitute a change in control of ACA Capital may require prior notification in those states that have adopted pre-acquisition notification laws.
These laws may discourage potential acquisition proposals and may delay, deter or prevent a change of control of ACA Capital, including through transactions, and in particular unsolicited transactions, that some or all of our stockholders might consider to be desirable.
- •
- Dividends. ACA Financial Guaranty must give ten days' prior notice to the Maryland Insurance Commissioner of its intention to pay any ordinary dividend or make any ordinary distribution. Ordinary dividends and ordinary distributions refer to any dividend or distribution other than an extraordinary dividend or extraordinary distribution (as defined below). The Maryland Insurance Commissioner has the right to prevent such an ordinary dividend or distribution if he determines, in his discretion, that after the payment thereof, ACA Financial Guaranty's policyholders' surplus would be inadequate or could cause ACA Financial Guaranty to be in a hazardous financial condition. In the past, the Maryland Insurance Commissioner has consented to the payment of dividends by ACA Financial Guaranty sufficient to make interest payments on the debt service of $40 million of our indebtedness, the proceeds of which were contributed to ACA Financial Guaranty.
Under Maryland insurance law, ACA Financial Guaranty must provide the Maryland Insurance Commissioner with at least 30 days' prior notice before paying an "extraordinary dividend" or making an "extraordinary distribution." Extraordinary dividends and extraordinary distributions are dividends or distributions that, together with any other dividends and distributions paid during the immediately preceding 12-month period, would exceed the lesser of:
ten percent of ACA Financial Guaranty's statutory policyholders' surplus (as determined under SAP as of December 31 of the prior year); and
ACA Financial Guaranty's net investment income excluding realized capital gains (as determined under SAP) for the 12-month period ending on December 31 of the prior year and pro rata distributions of any class of ACA Financial Guaranty's own securities, but including any amounts of net investment income (excluding realized capital gains) in the three calendar years prior to the preceding calendar year that have not already been paid out as dividends.
These statutory limitations are subject to change. ACA Financial Guaranty may not pay extraordinary dividends or make extraordinary distributions until either the 30-day notice period has expired (without the Maryland Insurance Commissioner disapproving such payment) or the Maryland Insurance Commissioner has approved the payment within that period.
ACA Financial Guaranty may pay extraordinary dividends only out of positive earned surplus. "Earned surplus" is defined as that part of surplus that, after deduction of all losses, represents the net earnings, gains, or profits that have not been distributed to stockholders as dividends, transferred to stated capital or to capital surplus or applied to other permissible purposes, but does not include unrealized capital gains or reevaluation of assets. At June 30, 2006, ACA Financial Guaranty had a negative earned surplus of $109.9 million primarily due to the formula-driven calculations which assign
138
surplus to contingency reserves based on our portfolio of insurance exposures. As a result, ACA Financial Guaranty is currently unable to pay extraordinary dividends until it has a positive earned surplus calculated on a SAP basis. Further, due to the nature of the calculation as applied to our business, increases in U.S. GAAP income will not necessarily result in positive earned surplus.
A surplus note is a subordinated debt instrument issued by an insurer, with the approval of the Maryland Insurance Commissioner, which, for regulatory purposes, is treated as policyholders' surplus. The claims of the holder of a surplus note are subordinate to the claims of policyholders, insurance claimants and beneficiaries and to all other classes of creditors other than surplus note holders. In the case of a Maryland domestic insurer, payment of principal and interest on any surplus note is subject to the prior approval of the Maryland Insurance Commissioner. The Maryland Insurance Commissioner has in the past approved interest payments on a $10 million surplus note ACA Financial Guaranty issued to us in December 2004.
The foregoing dividend limitations are determined in accordance with SAP, which generally produce statutory earnings in amounts less than earnings computed in accordance with U.S. GAAP. Similarly, policyholders' surplus, computed on a SAP basis, will normally be less than net worth computed on a U.S. GAAP basis.
- •
- Guaranty Funds. Guaranty fund laws in most states require insurers transacting business in the state to participate in guaranty associations, which pay claims of policyholders and third-party claimants against impaired or insolvent insurance companies doing business in the state. In most states, insurers licensed to write only municipal bond insurance, financial guaranty insurance and other forms of surety insurance, such as ACA Financial Guaranty, are exempt from assessment by these funds and their policyholders are prohibited from making claims on these funds.
- •
- Credit Risk Exposure Limits. Under Maryland insurance law "A" rated financial guaranty insurance companies total liability, net of qualifying reinsurance and collateral, for municipal bonds, special revenue bonds and industrial development bonds must be 70% investment grade unless otherwise approved by the Commissioner of the Maryland Insurance Administration. The Commissioner has approved an order permitting ACA Financial Guaranty to maintain 60% of its total liability of municipal bond, special revenue bond and industrial development bond exposure, net of qualifying reinsurance and collateral, in investment grade credits.
Other Applicable Insurance Regulatory Laws
- •
- Premium Rates and Policy Forms. ACA Financial Guaranty's premium rates and policy forms are subject to regulation in every state in which it is licensed to transact business in order to protect policyholders against the adverse effects of excessive, inadequate or unfairly discriminatory rates and to encourage competition in the insurance marketplace. In most states, premium rates and policy forms must be filed either prior to or shortly after their use. In some states, such rates and forms also must be approved prior to use. Changes in premium rates are subject to justification, generally on the basis of the insurer's loss experience, expenses and future trend analysis.
- •
- Reinsurance. Certain restrictions apply under the laws of several states to any licensed company ceding business to an unlicensed reinsurer. Under such laws, if a reinsurer is not admitted or approved in such states, the company ceding business to the reinsurer cannot take credit in its statutory financial statements for the risk ceded to such reinsurer absent compliance with certain reinsurance security requirements. These security requirements apply to any reinsurance agreements between ACA Financial Guaranty and an unlicensed reinsurer.
- •
- Investment. Under Maryland insurance law, ACA Financial Guaranty may invest in only certain permitted investments and only up to specified amounts. Failure to comply with these investment limitations would cause investments exceeding regulatory limitations to be treated as non-admitted assets for purposes of measuring surplus in accordance with SAP, and in some
139
instances, could require divestiture of such non-qualifying assets. In addition, pursuant to Maryland insurance law, ACA Financial Guaranty may make an investment only if it is approved (or made pursuant to approved guidelines) by ACA Financial Guaranty's board of directors or the committee of ACA Financial Guaranty's board of directors that is responsible for supervising or making such investment. Although it is not domiciled in New York, ACA Financial Guaranty must remain in substantial compliance with New York insurance law limitations on investments in order to retain its license there.
Bermuda Insurance Subsidiaries. ACA Assurance Ltd. and ACA Solutions Ltd. are licensed in Bermuda to write insurance and reinsurance, respectively, and are not admitted to do business in any jurisdiction other than Bermuda. ACA Assurance's activities are limited to certain discontinued lines of business and ACA Solutions' activities are limited to one immaterial reinsurance contract with ACA Financial Guaranty. The insurance laws of each state of the United States and of many other jurisdictions regulate the sale of insurance within their jurisdictions by alien insurers, such as ACA Assurance and ACA Solutions. ACA Assurance and ACA Solutions intend to conduct their business so as not to be subject to the licensing requirements of insurance regulators in the United States or elsewhere (other than Bermuda). We cannot assure you, however, that insurance regulators in the United States or elsewhere will not review the activities of ACA Assurance and ACA Solutions and claim that ACA Assurance and ACA Solutions are subject to such jurisdiction's licensing requirements.
ACA Assurance and ACA Solutions are subject to regulations under the Bermuda Insurance Act of 1978, or Insurance Act, and are registered as insurers by the Bermuda Monetary Authority, or the BMA. The Insurance Act imposes on Bermuda insurance companies solvency and liquidity standards and auditing and reporting requirements as well as certain restrictions on the payment of dividends. The Insurance Act also grants to the BMA powers to supervise, investigate and intervene in the affairs of insurance companies.
ACA Management, L.L.C.
Our asset management subsidiary, ACA Management, is registered with the SEC as an investment adviser under the Investment Advisers Act and is subject to the provisions of the Investment Advisers Act and the SEC's regulations promulgated thereunder. The Investment Advisers Act imposes numerous obligations on registered investment advisers relating to, among other things, fiduciary duties to clients, engaging in transactions with clients, maintaining an effective compliance program, performance fees, solicitation arrangements, conflicts of interest, advertising, and recordkeeping, reporting and disclosure requirements. The SEC is authorized to institute proceedings and impose sanctions for violations of the Investment Advisers Act, ranging from fines and censure to termination of an investment adviser's registration. We are also in the process of applying for an investment management license on behalf of our newly formed subsidiary, ACA Capital Management (U.K.) Pte. Limited from the Financial Services Authority in the United Kingdom (the "FSA"). If approved, our European CDO Asset Management business will also be subject to the applicable regulations of the FSA.
COMPETITION
All of our business lines are highly competitive, although each line has a different competitive dynamic.
Structured Credit Business. The business of selling credit protection in the form of credit swaps is a quickly evolving and highly competitive market. Competition is based on many factors, including the general reputation of a counterparty, execution quality and efficiency, perceived financial strength of the protection seller and willingness to post collateral under certain circumstances, pricing and other terms and conditions of the transaction. We compete with hedge funds, insurance companies including financial guarantors that, like ACA Financial Guaranty, insure the obligations of subsidiaries providing
140
credit protection through swaps, banks, derivative products companies such as Athilon Capital Corp. and non-bank financial institutions.
Municipal Finance Business. As the sole "A" rated financial guarantor, our target market in our municipal finance line of business is different than that of other financial guarantors. We do not compete directly with "AAA" rated financial guarantors. Radian Group Inc., as the only "AA" rated financial guarantor, is able to participate in our target market, although to a lesser degree than we are. Our strongest competition in our target market is from letter of credit banks and high-yield municipal mutual funds that purchase uninsured non-investment grade municipal obligations. We also compete with structural alternatives to third-party credit enhancement, including senior-subordinated structures. These structural alternatives compete on price, quality of execution, reputation and structural advantages.
CDO Asset Management Business. The financial services industry, and in particular, the market for CDO Asset Management services, is highly competitive with low barriers to entry. The key competitive factors are the historical performance of our portfolios, our underwriting processes for the acquisition of credits and the quality of our portfolio management and credit analyst teams. Our competitors include The TCW Group, Inc., Vanderbilt Capital Advisors, LLC, Blackrock Financial Management, Inc., Clinton Group Inc. and GSC Partners, among many financial institutions. Many of these companies have greater financial resources and are more established and well known in the CDO market than we are.
EMPLOYEES
As of June 30, 2006, we had 102 full-time employees. None of our employees are covered by collective bargaining agreements. We consider our employee relations to be good.
PROPERTIES
Our headquarters are located at 140 Broadway, New York, New York 10005, where we lease 42,000 square feet of office space under a lease that expires on August 31, 2009. We also have two back-up data/disaster recovery centers, one in midtown Manhattan and another outside of Chicago, Illinois. We have also contracted with SunGard Recovery Services for alternative office space for our key personnel. We believe we have adequate facilities to conduct our business.
LEGAL PROCEEDINGS
In the normal course of business, we may become involved in various claims and legal proceedings, including claims involving employee-related matters. We are not aware of any pending or threatened material litigation which we believe could reasonably be likely to result in a material adverse effect on us or our results of operations.
141
Executive Officers, Significant Employees and Directors
We list below our executive officers, significant employees and members of our Board of Directors along with their ages, positions and biographies for at least the past five years.
| Name | Age | Position | ||
|---|---|---|---|---|
| | (at October 3, 2006) | | ||
| David E. King | 47 | Chairman of the Board | ||
| Alan S. Roseman | 49 | Deputy Chairman, Chief Executive Officer and President | ||
| Edward U. Gilpin | 45 | Director, Executive Vice President and Chief Financial Officer | ||
| William T. Tomljanovic | 44 | Executive Vice President, Credit | ||
| Ruben Selles | 53 | Executive Vice President, Municipal Finance | ||
| Joseph M. Pimbley | 48 | Executive Vice President, Institutional Risk Management | ||
| Laura Schwartz | 43 | Senior Managing Director, CDO Asset Management | ||
| James A. Rothman | 42 | Senior Managing Director, Structured Credit | ||
| Nora J. Dahlman | 41 | Managing Director, General Counsel | ||
| David M. Barse | 44 | Director | ||
| John G. Berylson | 53 | Director | ||
| Douglas L. Jacobs | 58 | Director | ||
| Robert Juneja | 35 | Director | ||
| William H. Lacy | 61 | Director | ||
| Warren A. Stephens | 49 | Director |
David E. King has been the Chairman of our Board of Directors since he joined in September 2004. He has served since 2001 as a Senior Managing Director of Bear, Stearns & Co. Inc. and Executive Vice President of Bear Stearns Merchant Banking, LLC. BSMB/ACA LLC, an affiliate of Bear Stearns Merchant Banking, LLC, is one of our stockholders. See "Principal and Selling Stockholders." Prior to joining Bear, Stearns & Co. Inc. in 2001, he was a Partner at McCown De Leeuw & Co. in charge of the New York office investment activities. He serves on the board of directors of Reddy Ice Group, Inc., a New York Stock Exchange-listed company, and the following privately held companies: Cavalry Investments, LLC, 24 Hour Fitness Worldwide, Inc., GlobalVantEdge, Inc., Sutton Place Group, LLC, Churchill Financial Holdings, LLC and Garnet Capital Advisors, LLC. Mr. King also sits on the advisory board of Falconhead Capital LLC.
Alan S. Roseman joined the Company in May 2004. Prior to joining us, he was the Executive Vice President and Co-Chief Operating Officer, as well as a member of the Executive and Underwriting Committees of ACE Financial Solutions from 1999 to 2004. Before joining ACE, he served for 11 years as Executive Vice President and General Counsel, and as a member of the Executive Committee, of Capital Re Corporation, a financial guaranty reinsurance company.
Edward U. Gilpin has served as our Executive Vice President and Chief Financial Officer since he joined the Company in December 2000. He is also a Director on our Board and a member of our executive committee. Previously, Mr. Gilpin was a senior investment banker in the Financial Institutions Group at Prudential Securities. Prior to that, Mr. Gilpin was the Chief Financial Officer for an "AAA"
142
start-up venture sponsored by us and Prudential Securities and served in various senior positions at MBIA, Inc.
William T. Tomljanovic is an Executive Vice President, responsible for Credit. He is also a member of our executive committee and the President of ACA Management. Mr. Tomljanovic joined us in 2000. Prior to his current position, Mr. Tomljanovic served from 2000 to May 2004 as head of our former customized solutions group, which encompassed Structured Credit and certain other discontinued lines of business, and from May 2004 to February 2006 as head of structured finance. Previously, Mr. Tomljanovic was a Director of Investment Banking for Prudential Securities, responsible for originating and structuring CDOs, and served in various senior management positions with Capital Re Corporation.
Ruben Selles is an Executive Vice President and oversees our Municipal Finance Group. He is a member of our Executive Committee. Prior to joining us in 2002, Mr. Selles served for nearly two decades as the Managing Director of Healthcare Finance, and most recently as Managing Director of Healthcare Risk Management, for Ambac.
Joseph M. Pimbley, Ph.D. is responsible for risk management across all of our business lines and our investment portfolio. Prior to joining us in 2002, Dr. Pimbley was Senior Vice President, Credit Derivative Product Manager, for the capital markets subsidiary of the Sumitomo Mitsui Banking Corporation from 1997 to 2002 and before that served as Senior Risk Manager for GE Capital.
Laura Schwartz is responsible for our CDO Asset Management business. Before being named head of the CDO Asset Management business in 2004, Ms. Schwartz served as a senior portfolio manager. Prior to joining us in 2002, Ms. Schwartz was a director in the Asset Backed Finance Group at Merrill Lynch from 1998 to 2002, where she was responsible for the origination and execution of commercial and sub-prime residential mortgage backed securities.
James A. Rothman is responsible for our Structured Credit business. Before being named head of the group in 2004, Mr. Rothman served as a senior underwriter in the group. Prior to joining us in 2001, Mr. Rothman served in various management positions at GE Capital Commercial Finance, Deutsche Bank Securities, PaineWebber and Chase Manhattan Mortgage Corporation, where he was responsible for various types of securitization transactions and structured mortgage transactions.
Nora J. Dahlman is our General Counsel. Before being named General Counsel in 2004, she served as an Associate General Counsel supporting our CDO Asset Management and Structured Credit groups. Prior to joining us in 2003, Ms. Dahlman worked on personal projects from 2001 to 2003 and was First Vice President and Assistant General Counsel at Ambac from 1999 to 2001. Prior to joining Ambac, she was a Vice President and Attorney with Credit Lyonnais from 1997 to 1999 and before that spent several years in private practice as a finance associate.
David M. Barse has been a member of our Board of Directors since March 2001. He is currently President and Chief Executive Officer of Third Avenue Management LLC, a registered investment company and the investment advisor to the Third Avenue Family of Funds, and its affiliated broker dealer, MJ Whitman LLC. Mr. Barse joined Third Avenue in 1991. Third Avenue Trust, one of Third Avenue's funds, is one of our stockholders. See "Principal and Selling Stockholders." From July 1996 until July 2002, Mr. Barse served as President and Chief Operating Officer of Danielson Holding Corporation and has served on its board of directors since 1996. In 2005, Danielson changed its name to Covanta Holding Corporation, a New York Stock Exchange-listed company.
John G. Berylson has been a member of our Board of Directors since 2000 and has previously served as our Chairman. Since March 2002, Mr. Berylson has served as Chairman and Chief Executive of Chestnut Hill Ventures LLC, an affiliate of one of our stockholders, ACA Chestnut Hill, L.L.C. See "Principal and Selling Stockholders." Since October 2000, he has served as President of GCC Investments, Inc. From 1993 until October 2000, he served as Senior Vice President and Chief
143
Investment Officer of GC Companies, Inc. Mr. Berylson currently serves on the board of directors of FleetCor Technologies, Inc., a privately held company.
Douglas L. Jacobshas been a member of our Board of Directors since November 2004. Since 2003, Mr. Jacobs has been a self-employed investor. From 1995 to 2003, he was Executive Vice President and Treasurer for FleetBoston Financial Group. He joined Fleet Bank in 1988 as Executive Vice President of the Fleet Mortgage Group, responsible for secondary trading and financing and capital markets. Mr. Jacobs' career began at Citibank in 1972, where he ultimately assumed the position of Division Executive for the Investment Banking Group's MBS Group. Mr. Jacobs' other directorships include Global Signal, Inc., a publicly traded company, Hanover Capital Mortgage Holdings, Inc., a publicly traded REIT, Women & Infants Hospital and Trinity Repertory Theatre in Providence, Rhode Island.
Robert Junejahas been a member of our Board of Directors since September 2004. He has served since 2005 as a Managing Director of Bear, Stearns & Co. Inc. and Bear Stearns Merchant Banking, LLC, and has been with Bear, Stearns & Co. Inc. since 2000. BSMB/ACA LLC, an affiliate of Bear Stearns Merchant Banking, LLC, is one of our stockholders. See "Principal and Selling Stockholders." Prior to joining Bear Stearns, Mr. Juneja was Vice President of Corporate Development at Destia Communications, Inc. from 1999 to 2000. He is a member of the board of directors of the following privately held companies: OnFiber Communications, Inc., Cavalry Investments, LLC and Churchill Financial Holdings, LLC.
William H. Lacyhas been a member of our Board of Directors since February 2005. He is former chairman and chief executive officer of MGIC Investment Corporation, the parent of Mortgage Guaranty Insurance Corporation (MGIC), a private mortgage insurer. Mr. Lacy served in various capacities at MGIC over his 28-year career. In 1971 he began his career in the secondary mortgage market group, and was appointed President and Chief Executive Officer of MGIC Investment in 1987. Mr. Lacy retired from MGIC in December 1999. Mr. Lacy has served on several committees including the National Association of Home Builders Mortgage Roundtable, Lender's Service, Inc. Advisory Board, and the Fannie Mae Advisory Board. He is a former president of the Mortgage Insurance Companies of America (MICA), an industry trade association, and a member of the board of directors of two NYSE-listed companies—Johnson Controls, Inc. and Ocwen Financial Corporation.
Warren A. Stephens has been a member of our Board of Directors since 2001. Since 1998, Mr. Stephens has been the President and Chief Executive Officer of Stephens Group, Inc., one of our stockholders, and Stephens Inc. See "Principal and Selling Stockholders." He currently serves on the boards of two NYSE-listed companies—Dillard's, Inc. and Alltel Corporation—and numerous privately held companies.
Board Composition
Our Bylaws provide that our Board of Directors shall consist of between three and fourteen members, or such number as may be determined by the stockholders. The current Board of Directors consists of nine persons. According to a stockholders agreement, certain of our stockholders have agreed to vote in favor of the director nominees for a specified number of board positions. See "Description of Capital Stock—Stockholders Agreement." The agreement is subject to the applicable rules of the SEC and New York Stock Exchange.
144
COMMITTEES OF THE BOARD OF DIRECTORS
Our Board of Directors has the authority to appoint committees to perform certain management and administration functions. Upon completion of this offering, our Board of Directors will have an audit and investment committee, an executive committee, a compensation committee, a nominating and governance committee and a risk oversight committee. In addition, from time to time, special committees may be established under the direction of the Board of Directors when necessary to address specific issues. We have adopted new charters for the audit and investment committee, compensation committee and nominating and governance committee, subject to completion of this offering, which are New York Stock Exchange and SEC compliant.
Audit and Investment Committee
The audit and investment committee was established to assist the Board of Directors in its oversight of the integrity of our financial reporting process, the system of internal controls, the audit process and the performance, qualification and independence of our independent auditors. Upon consummation of this offering, the audit and investment committee will consist of Douglas Jacobs (chairman), Robert Juneja and John Berylson. The Board of Directors has determined Douglas Jacobs to be an "audit committee financial expert," and each of the members to be "financially literate" under the requirements of the SEC and each meets similar qualifications under the requirements of the NYSE. Within one year after consummation of this offering, all of the members of the audit and investment committee will be independent in accordance with the NYSE and SEC rules.
Upon consummation of this offering, the audit and investment committee's primary duties and assigned roles will be to:
- •
- oversee the audit and other services of our independent registered public accountants and be directly responsible for the appointment, independence, qualifications, compensation and oversight of the outside auditors, who are to report directly to the audit and investment committee;
- •
- serve as an independent and objective body to monitor and assess our compliance with legal and regulatory requirements, our financial reporting processes and related internal control systems and the performance, generally, of our internal audit function;
- •
- resolve any disagreements between management and the independent registered public accountants regarding financial reporting;
- •
- review and discuss with management and the independent registered public accountants our annual audited financial statements and Management's Discussion and Analysis of Financial Condition and Results of Operations; and
- •
- oversee, direct and review the management of our insurance investment portfolio.
The audit and investment committee charter will also mandate that the audit and investment committee pre-approve all audit, audit-related, tax and other services conducted by our independent registered public accountants. The audit and investment committee will also approve budgets annually for the pre-approved audit, audit-related, tax and other services to be performed by the independent accountants.
Compensation Committee
The compensation committee was established to discharge the Board of Directors' responsibilities relating to compensation of our executive officers, and to administer and implement our incentive-compensation plans and equity-based plans. The compensation committee shall at all times have at least one member who was nominated by and is a representative of BSMB/ACA LLC and currently
145
consists of David King (chairman), Douglas Jacobs, David Barse and John Berylson. All of these individuals, except David Barse, who was nominated to the compensation committee in August of 2006, served on the compensation committee during the 2005 fiscal year. Within one year after consummation of this offering, all of the members of the compensation committee will be independent in accordance with the NYSE rules. A subcommittee of the Board of Directors may be created to grant stock-based awards to certain officers and directors. The compensation committee will also be responsible for preparing a report on executive compensation for inclusion in the proxy statement for our annual meetings.
Nominating and Governance Committee
We have created a nominating and governance committee to become effective simultaneously with the completion of this offering. The members of the nominating and governance committee shall at all times include at least one member who was nominated by and is a representative of BSMB/ACA LLC. The members of the committee shall be David King (chairman), Warren Stephens and William Lacy. The charter of the nominating and governance committee specifies the committee's duties and responsibilities, which include the following:
- •
- establish criteria for board and committee membership, and recommended to the board qualified individuals for election to the Board of Directors or appointment to board committees;
- •
- consider and make recommendations to our Board of Directors concerning the size and composition of the board and each committee thereof;
- •
- review the compensation of non-employee directors and make recommendations to the Board of Directors concerning compensation of non-employee directors;
- •
- prepare an annual assessment of the Board of Directors and each committee, and assist the board and each committee in its self-evaluation to determine whether the Board of Directors and such committees are functioning effectively; and
- •
- review and reassess the adequacy of our Corporate Governance Guidelines and recommend any proposed changes thereto to the Board of Directors.
The nominating and governance committee will also evaluate the performance of our Chief Executive Officer and oversee management development and succession planning in coordination with our compensation committee.
Risk Oversight Committee
The risk oversight committee was established to oversee our credit analysis and risk management processes. The risk oversight committee shall consist of at least three members and at least one member who was nominated by and is a representative of BSMB/ACA LLC. Upon consummation of this offering, the risk oversight committee will consist of David King (chairman), William Lacy, Douglas Jacobs and Alan Roseman. Under the terms of its charter, the risk oversight committee's primary duties and assigned roles are to:
- •
- monitor the compliance with our underwriting policies and procedures, and review reports on the performance of our municipal finance and structured finance business sectors;
- •
- evaluate the tools we use for measuring risk/return and review our risk/return performance;
- •
- review the guidelines and policies governing the processes for identifying and assessing significant risk or exposures and for formulating and implementing steps to monitor and control such risks and exposures; and
146
- •
- review management proposals to introduce new product lines, services and information technology initiatives.
Executive Committee
We also have an executive committee, which shall include at least one member who was nominated by and is a representative of BSMB/ACA LLC and currently consists of David King, David Barse and Alan Roseman. Under the terms of its charter, the executive committee has the power to act on behalf of our Board of Directors with respect to the management and business affairs of the Company during intervals between meetings of the Board of Directors to the extent permitted under Delaware law and its charter.
Independent Directors
The NYSE's rules include a requirement that a majority of our directors be "independent" within 12 months of completion of this offering. In compliance with the requirements of the Sarbanes-Oxley Act of 2002, the NYSE listing standards and SEC rules and regulations, a majority of the directors on our compensation and nominating and governance committees will be independent within 90 days of listing on the NYSE and, within one year, these committees will be fully independent and a majority of our Board of Directors will be independent. One member of the audit and investment committee will meet the independence requirements for audit committee members as adopted by the NYSE and the SEC upon consummation of this offering. A majority of the directors on our audit and investment committee will meet such requirements within 90 days of the effectiveness of the registration statement and, within one year of effectiveness, the committee will be fully independent.
147
The following table sets forth the total compensation earned during the year ending December 31, 2005 by our Chief Executive Officer and the other four most highly compensated executive officers employed by us on December 31, 2005, whom we refer to as the named executive officers.
Summary Compensation Table(1)
| | | Annual Compensation | Long-Term Compensation Awards | | ||||||||||||
|---|---|---|---|---|---|---|---|---|---|---|---|---|---|---|---|---|
| Name and Principal Position | Year | Salary | Bonus(2) | Other Annual Compensation | Securities Underlying Stock Options | All Other Compensation | ||||||||||
| Alan S. Roseman Chief Executive Officer, President and Deputy Chairman of the Board | 2005 | $ | 600,000 | $ | 1,300,000 | — | — | — | ||||||||
| Edward U. Gilpin Executive Vice President, Chief Financial Officer and Director | 2005 | 400,000 | 540,000 | — | — | $ | 148,888 | (3) | ||||||||
| William T. Tomljanovic Executive Vice President, Credit | 2005 | 400,000 | 650,000 | — | — | 142,812 | (4) | |||||||||
| Laura Schwartz Senior Managing Director, CDO Asset Management | 2005 | 275,000 | 610,000 | — | — | — | ||||||||||
| James A. Rothman Senior Managing Director, Structured Credit | 2005 | 250,000 | 650,000 | — | — | — | ||||||||||
- (1)
- In accordance with the rules of the SEC, the compensation described in this table does not include various perquisites and other personal benefits received by the executive officers, that do not exceed the lesser of $50,000 or 10% of any officer's salary and bonus disclosed in this table.
- (2)
- The annual bonuses for fiscal year 2005 were awarded in March 2006.
- (3)
- $134,888 represents a loan forgiveness which occurred pursuant to the terms of Mr. Gilpin's employment contract on February 29, 2005. $14,000 represents 401(k) matching payments made by the Company to Mr. Gilpin's 401(k) account.
- (4)
- $128,812 represents a loan forgiveness which occurred pursuant to the terms of Mr. Tomljanovic's employment contract on February 28, 2005. $14,000 represents 401(k) matching payments made by the Company to Mr. Tomljanovic's 401(k) account.
Option Grants in Last Fiscal Year
We did not make any stock option grants to our named executive officers during fiscal year 2005.
Aggregate Option Exercises in 2005 and Fiscal Year-End Option Values
The following table sets forth information regarding exercisable and unexercisable stock options held as of December 31, 2005 by each of the named executive officers. None of our named executive officers exercised any options in 2005. The value of unexercised in-the-money options, at December 31, 2005, is calculated based on a value of $12.66 per share of our common stock (adjusted for our August 23, 2006 6-for-1 stock split), which was the fair market value of our common stock as set by our
148
Board of Directors as of that date, less the per share exercise price multiplied by the number of shares issuable upon exercise of the options.
| Name | Shares Acquired on Exercise | Value Realized | Number of Securities Underlying Unexercised Options at December 31, 2005(1) | Value of Unexercised In-the-Money Options at December 31, 2005 | ||||||||||
|---|---|---|---|---|---|---|---|---|---|---|---|---|---|---|
| | | | Exercisable | Unexercisable | Exercisable | Unexercisable | ||||||||
| Alan Roseman | N/A | N/A | 154,284 | 385,716 | $ | 351,000 | $ | 877,500 | ||||||
| Edward Gilpin | N/A | N/A | 191,058 | 108,942 | 457,760 | 247,845 | ||||||||
| William Tomljanovic | N/A | N/A | 191,058 | 108,942 | 457,760 | 247,845 | ||||||||
| Laura Schwartz | N/A | N/A | 42,272 | 32,727 | 45,102 | 74,456 | ||||||||
| James Rothman | N/A | N/A | 34,630 | 40,370 | 70,004 | 86,310 | ||||||||
- (1)
- All securities underlying options have been adjusted to reflect a 6-for-1 split of our common stock which was effected August 23, 2006.
Employment Agreements
Set forth below is a summary of the employment agreements we have with each of our named executive officers. This summary is qualified in its entirety by the detailed provisions of the individual employment agreements. You may refer to the exhibits that are a part of the registration statement of which this prospectus is a part for copies of the employment agreements.
Alan Roseman. Our Board approved certain amendments to our employment agreement with Alan Roseman, to become effective upon the completion of this offering, under which Mr. Roseman serves as our President, Chief Executive Officer, Chief Operating Officer and Deputy Chairman of our Board. As amended, Mr. Roseman's agreement provides for a term ending on September 30, 2009. Mr. Roseman's base salary is $650,000. Mr. Roseman is eligible for an annual incentive award. In addition, in 2004 Mr. Roseman was granted 55,869 restricted shares of the Company's series B senior convertible preferred stock, which will be converted into 335,214 shares of common stock concurrently with the closing of this offering. Two-thirds of these shares are vested. One-third is scheduled to vest on September 30, 2007. If a "change of control" of the company, as defined in the agreement, occurs during his employment, Mr. Roseman's restricted stock and stock options will become fully vested.
In connection with a "change of control," Mr. Roseman will be entitled to a gross-up for any excise taxes imposed on him by section 4999 of the tax code.
If we terminate Mr. Roseman for "cause," as defined in the agreement, we are required to pay him his base salary through the date of termination, accrued vacation pay, any other amounts earned, accrued or owing to him but not yet paid and other benefits in accordance with our applicable plans and programs.
If we terminate Mr. Roseman's employment without cause or if he terminates his employment as a result of a "constructive termination," as defined in the agreement, we are required to pay him his base salary through the date of termination, accrued vacation pay, any other amounts earned, accrued or owing to him but not yet paid and other benefits in accordance with our applicable plans and programs. In addition, upon his execution of a release of all claims against us, Mr. Roseman will be entitled to (i) a pro-rata annual incentive award for the year of termination calculated on the basis of the prior year's annual incentive award paid to Mr. Roseman, (ii) a lump sum severance payment equal to two times his annual base salary, (iii) full vesting of all restricted stock and stock options and (iv) payment of COBRA premiums for the entire period of eligibility and continued participation in all of our welfare plans until the earlier of one year from termination or the receipt of equivalent coverage from a subsequent employer. Additionally, the post-termination exercise period of Mr. Roseman's stock options granted on or after August 3, 2006 is one year from the date of termination.
Mr. Roseman is subject to standard non-competition, non-solicitation and confidentiality covenants.
149
For additional information regarding Mr. Roseman's employment agreement, see "Certain Relationships and Related Party Transactions."
Other Executives. On September 30, 2004, we amended and restated our employment agreements with Edward Gilpin, our Chief Financial Officer and Executive Vice President, and William Tomljanovic, our Executive Vice President—Credit, and entered into new employment agreements with Laura Schwartz, a Senior Managing Director and James Rothman, a Senior Managing Director (the "Executives"). Each agreement provides for a three-year term ending on September 30, 2007. Their base salaries are: Mr. Gilpin and Mr. Tomljanovic: $400,000, Ms. Schwartz: $275,000 and Mr. Rothman: $275,000. Each Executive is eligible for an annual incentive award. In 2001, Mr. Tomljanovic and Mr. Gilpin each executed promissory notes, as amended, in the principal amount of $500,000 in connection with their purchase of shares of our common stock. Mr. Tomljanovic and Mr. Gilpin each made payments in respect of principal and accrued interest on their promissory notes on February 29, 2004 in the amount of $190,350 and $171,600, respectively. Pursuant to the terms of their amended contracts, the Company agreed to forgive the balance of the promissory notes over the following three years, one third each year plus the amount of any accrued interest in that year. On March 13, 2006, we forgave the remaining outstanding principal amount of these notes and interest thereon. If a "change of control" occurs, each Executive's stock options that were issued to such Executives prior to September 30, 2004 will become fully vested.
If we terminate an Executive for "cause," as defined in each agreement, we are required to pay such Executive his or her base salary through the date of the termination, accrued vacation pay, any other amounts earned, accrued or owing to him or her but not yet paid and other benefits in accordance with our applicable plans and programs.
If we terminate an Executive's employment without cause or if he or she terminates his or her employment as a result of a "constructive termination," as defined in the agreements, we are required to pay such Executive his or her base salary through the date of termination, accrued vacation pay, any other amounts earned, accrued or owing to him or her but not yet paid and other benefits in accordance with our applicable plans and programs. In addition, upon the execution of a release of all claims against us, the Executive will be entitled to (i) a pro-rata annual incentive award for the year of termination, (ii) a lump sum severance payment equal to one year of base salary (or, in the case of Mr. Gilpin and Mr. Tomljanovic, if greater, the base salary for the remaining term of the agreement) and (iii) payment of COBRA premiums for the entire period of eligibility and continued participation in all of our welfare plans until the earlier of one year from termination or the receipt of equivalent coverage from a subsequent employer.
The Executives are subject to standard non-competition, non-solicitation and confidentiality covenants.
On September 8, 2006, our Board approved certain amendments to our employment agreement with Mr. Gilpin to become effective upon the completion of this offering. As amended, Mr. Gilpin's contract will remain as described above except that in the event we terminate Mr. Gilpin without cause or if he terminates his employment as a result of a "constructive termination," as defined in the agreement, upon Mr. Gilpin's execution of a release of all claims against us, in lieu of a severance payment described above, we will be required to pay Mr. Gilpin a severance payment equal to two times his base salary then in effect. Additionally, all of Mr. Gilpin's stock options and restricted stock shall immediately vest upon the occurrence of a change of control, as defined in the agreement.
Compensation of Directors
Subject to completion of this offering, each independent director will be entitled to receive (i) an annual fee of $30,000 for serving on the Board of Directors, (ii) an annual grant of restricted common stock of the Company pursuant to the Company's 2006 Amended and Restated Stock Incentive Plan, the number of shares included in the annual grant shall be that number of shares which is the equivalent of $40,000 in value determined based on the per share initial public offering price, to vest
150
annually over three years with 33.33% of the relevant grant vesting on the anniversary date of the grant each year and the first annual share grant made simultaneously upon completion of this offering, and (iii) an additional fee of $1,000 for each committee meeting such director attends. The chairman of the audit and investment committee shall receive additional annual compensation of $10,000.
Employee Plans
Omnibus Incentive Compensation Plan
A description of the provisions of our Omnibus Incentive Compensation Plan is set forth below. In this summary, the Omnibus Incentive Compensation Plan is referred to as the 2001 incentive compensation plan. This summary is qualified in its entirety by the detailed provisions of the incentive compensation plan. You may refer to the exhibits that are a part of the registration statement of which this prospectus is a part for a copy of the incentive compensation plan.
Our Board of Directors approved the 2001 incentive compensation plan on February 28, 2001 and our stockholders approved it on June 13, 2001. The objectives of the 2001 incentive compensation plan are to optimize our profitability and growth by linking the personal interests of our employees and outside directors to our interests, to provide our employees and outside directors with incentives for excellence in individual performance, and to promote teamwork among our employees and outside directors. Further, the 2001 incentive compensation plan provides us with the flexibility to motivate and attract personnel who will make significant contributions to our success.
Administration. The 2001 incentive compensation plan is administered by the compensation committee of our Board of Directors. Subject to the terms of the 2001 incentive compensation plan, the compensation committee may select participants to receive awards, determine the types of awards and terms and conditions of awards, and interpret provisions of the incentive compensation plan.
Source of Shares. The shares of common stock issued under the 2001 incentive compensation plan consist of authorized but unissued shares and treasury shares.
Eligibility. Under the 2001 incentive compensation plan, we may make awards to our employees, our affiliates' or subsidiaries' employees, and our outside directors.
Amendment or Termination of the Plan. While our Board of Directors may terminate or amend the 2001 incentive compensation plan at any time, no amendment may materially and adversely impair the rights of grantees with respect to outstanding awards without the written consent of such grantees. Unless terminated earlier, the 2001 incentive compensation plan will terminate when all of the shares of common stock reserved for issuance under the incentive compensation plan have been purchased or acquired, but will continue to govern unexpired awards. Amendments will be submitted for stockholder approval to the extent required by applicable law.
Options. The 2001 incentive compensation plan permits the granting of options to purchase shares of common stock intended to qualify as incentive stock options under the Internal Revenue Code, referred to as incentive stock options, and stock options that do not qualify as incentive stock options, referred to as non-qualified stock options.
The exercise price of each stock option is determined by the compensation committee. The term of each stock option is fixed by the compensation committee. The term of an incentive stock option may not exceed 10 years from the option's date of grant. The compensation committee determines at what time or times each option may be exercised and the period of time, if any, after retirement, death, disability or termination of employment during which options may be exercised.
In general, an optionee may pay the exercise price of an option by cash or its equivalent, by tendering shares of common stock (which if acquired from us have been held by the optionee for at least six months), or, if set forth in a stock option award agreement, by a promissory note.
Stock options granted under the 2001 incentive compensation plan may not be sold, transferred, pledged, or assigned other than by will or under applicable laws of descent and distribution. However,
151
we may permit limited transfers of non-qualified stock options pursuant to the terms of the respective non-qualified stock option award agreements.
Other Awards. The compensation committee may also grant under the incentive compensation plan other types of awards. These awards include share appreciation rights, restricted shares, performance shares, performance units, and cash-based awards. Only options have been granted under the incentive compensation plan to date.
Effect of Extraordinary Corporate Transactions. In general, unless provision is made for their combination, substitution or assumption, options granted under the 2001 incentive compensation plan will be fully vested in the event of a "change of control," as such term is defined in the 2001 incentive compensation plan and associated option award agreements.
Adjustments for Share Dividends and Similar Events. The compensation committee will make appropriate adjustments in outstanding awards and in the number of shares available for issuance under the incentive compensation plan to reflect common stock dividends, share splits, spin-offs and other similar events.
Amended and Restated 2004 Stock Incentive Plan and Amended and Restated 2006 Stock Incentive Plan
On September 30, 2004 we amended and restated the Omnibus Incentive Compensation Plan and renamed it the Amended and Restated 2004 Stock Incentive Plan. On August 3, 2006 we further amended and restated the plan and renamed it the Amended and Restated 2006 Stock Incentive Plan. A description of the provisions of our Amended and Restated 2006 Stock Incentive Plan, is set forth below. In this summary, the Amended and Restated 2006 Stock Incentive Plan, as amended, is referred to as the 2006 stock incentive plan. This summary is qualified in its entirety by the detailed provisions of the 2006 stock incentive plan. You may refer to the exhibits that are a part of the registration statement of which this prospectus is a part for a copy of the incentive compensation plan.
The objectives of the 2006 stock incentive plan are to attract and retain highly qualified officers, directors, key employees, and other persons, and to motivate such persons to expend maximum effort to improve our business results and earnings by providing them an opportunity to acquire or increase a direct proprietary interest in our operations and future success.
As of October 3, 2006, the number of shares of common stock reserved for issuance under the 2006 stock incentive plan (which includes all options previously reserved under the 2001 incentive plan) was 6,327,972. As of October 3, 2006, options and restricted stock with respect to 3,354,054 shares of common stock were outstanding under the incentive compensation plan and 2,973,918, shares were available for issuance for new grants, 543,000 of which have been granted for options and 239,000 of which have been granted for restricted stock, in each case contingent upon the completion of this offering. At the discretion of the board, participants in the 2006 stock incentive plan who exercise their options by delivery of our shares may receive an additional option for a number of shares equal to the number of shares delivered with an exercise price per share equal to the fair market value of a share of our stock on the date the additional option is granted. If an optionee pays the exercise price or applicable withholding taxes with our shares of stock, the total number of shares actually issued shall be deemed delivered for purposes of the maximum number of shares available under the 2006 stock incentive plan. If any shares subject to an award are not purchased or are forfeited, or if an award otherwise terminates without delivery of shares, then those shares shall remain available for issuance under the 2006 stock incentive plan.
Administration. The 2006 stock incentive plan is administered by the compensation committee of our Board of Directors. Subject to the terms of the 2006 stock incentive plan, the compensation committee may select participants to receive awards, determine the types of awards and terms and conditions of awards, prescribe the award agreements evidencing each award, amend, modify or supplement such awards and interpret provisions of the stock incentive plan. In addition, the Board has the discretion to make awards in substitution for awards made under another plan of ours or our
152
affiliates. The Board may also cause a forfeiture of the gain realized by a participant's violating any obligation to, or agreement with, us and to annul an award due a participant's termination of employment for cause.
Source of Shares. The shares of common stock issued under the 2006 stock incentive plan consist of authorized but unissued shares and issued shares that have been reacquired by the Company.
Eligibility. Awards may be made under the 2006 stock incentive plan to our employees, our affiliates' or subsidiaries' employees, our outside directors, our consultants and any other individual whose participation in the plan, as determined by the Board, would be in our best interests.
Amendment or Termination of the Plan. While our Board of Directors may terminate or amend the 2006 stock incentive plan at any time, no amendment may impair the rights of grantees with respect to outstanding awards without the written consent of such grantees. Unless terminated earlier, the 2006 incentive compensation plan will terminate on August 3, 2016. Amendments will be submitted for stockholder approval to the extent stated by the Board or required by applicable law.
Options. The 2006 stock incentive plan permits the granting of options to purchase shares of common stock intended to qualify as incentive stock options under the Internal Revenue Code, referred to as incentive stock options, and stock options that do not qualify as incentive stock options, referred to as non-qualified stock options.
The exercise price of each stock option is determined by the compensation committee. The term of each stock option is fixed by the compensation committee. The term of an option may not exceed 10 years from the option's date of grant or as fixed by the Board. The compensation committee determines at what time or times each option may be exercised and the period of time, if any, after retirement, death, disability or termination of employment during which options may be exercised. Options may be made exercisable in installments and an optionee may pay the exercise price of an option by cash, cash equivalents or, if so permitted by the compensation committee, through the tender to us of shares of stock that were held by the participant for at least six months. The per share exercise price of an option shall be at least equal to the per share fair market value of our shares on the grant date.
Stock options and restricted stock granted under the 2006 stock incentive plan may not be sold, transferred, pledged, or assigned other than by a not-for-value transfer to any family member or by a will or under applicable laws of descent and distribution. However, we may permit limited transfers of non-qualified stock options pursuant to the terms of the respective non-qualified stock option award agreements.
Other Awards. The compensation committee may also grant under the 2006 stock incentive plan other types of awards. These awards include stock units, unrestricted stock, dividend equivalent rights, share appreciation rights, performance shares, performance units, and cash-based awards.
Effect of Extraordinary Corporate Transactions. In general, unless provision is made for their combination, substitution or assumption, options granted under the 2006 stock incentive plan will be fully vested in the event of a "corporate transaction," as such term is defined in the stock incentive plan and associated option award agreements.
Adjustments for Share Dividends and Similar Events. The compensation committee will make appropriate adjustments in outstanding awards and in the number of shares available for issuance under the incentive compensation plan, to reflect common stock dividends, share splits, spin-offs and other similar events.
On August 3, 2006, the compensation committee granted 234,000 shares of restricted stock and options, in the aggregate, to certain of our officers to purchase 543,000 shares of common stock, in each case, subject to the completion of the offering. The shares vest in equal installments on each of the first four anniversaries of the grant date. The options have an exercise price per share equal to the offering price per share, have a term of ten years subject to earlier termination and vest in equal installments every six months over 42 months.
153
PRINCIPAL AND SELLING STOCKHOLDERS
The following table sets forth information known to us regarding beneficial ownership of shares of our common stock as of October 3, 2006, and as adjusted to reflect the sale of the shares of common stock offered by this prospectus, by:
- •
- each person known by us to be the beneficial owner of more than 5% of our shares of common stock;
- •
- each of our named executive officers;
- •
- each of our directors; and
- •
- all of our executive officers and directors as a group.
Unless otherwise noted below, and subject to applicable community property laws, to our knowledge, each person has sole voting and investment power over the shares shown as beneficially owned, except to the extent authority is shared by spouses under applicable law.
The number of shares beneficially owned by each stockholder is determined under rules promulgated by the SEC and assumes the underwriters do not exercise their over-allotment option. The information does not necessarily indicate beneficial ownership for any other purpose. Shares of common stock subject to options and convertible securities currently exercisable or convertible, or exercisable or convertible within 60 days after October 3, 2006, are deemed outstanding for purposes of computing the percentage beneficially owned by the person or entity holding such securities but are not deemed outstanding for purposes of computing the percentage beneficially owned by any other person or entity. All outstanding shares of convertible preferred stock, shares of senior convertible preferred stock and shares of series B senior convertible preferred stock will convert into shares of common stock concurrently with the consummation of this offering. Each of the principal and selling stockholders, among others, has agreed to vote for directors nominated by certain stockholders and each of our named executive officers must appoint BSMB/ACA LLC as proxy and attorney-in-fact to vote for the election and/or removal of directors. See "Description of Capital Stock—Stockholders Agreement." Accordingly, all of the parties to the stockholders agreement may be deemed to be members of a group, which group would be deemed to beneficially own all the shares held by parties to the stockholders agreement for purposes of Section 13 of the Exchange Act, or 29,111,700 shares of common stock on an as converted basis which is 98.19% of the common stock before the offering. The table below represents the number of shares owned by each stockholder without giving effect to the stockholders agreement to provide investors with the economic ownership of each stockholder.
Percentage of beneficial ownership is based on 29,648,281 shares of our common stock outstanding as of October 3, 2006 and 36,523,281 shares of our common stock outstanding upon consummation of this offering, both on an as-converted basis. Shares beneficially owned prior to the offering does not include restricted stock or options that have been granted contingent upon the consummation of the offering. Shares beneficially owned after the offering includes restricted stock granted contingent upon the offering.
As of October 3, 2006, there were approximately 40 holders of common equity and approximately 25 holders of our preferred stock.
154
| | Shares Beneficially Owned Prior to this Offering(1) | | Shares Beneficially Owned After this Offering(1) | ||||||||
|---|---|---|---|---|---|---|---|---|---|---|---|
| | Number of Shares Being Offered(2) | ||||||||||
| Beneficial Owner | |||||||||||
| Number | Percentage | Number | Percentage | ||||||||
| 5% or greater stockholders | |||||||||||
| BSMB/ACA LLC(3) c/o Bear, Stearns & Co. Inc. 383 Madison Avenue, 40th Floor New York, NY 10179 | 10,113,983 | 34.1 | % | 0 | 10,113,983 | 27.7 | % | ||||
| SF Holding Group Corp. (f/k/a Stephens Group, Inc.) 111 Center Street Little Rock, AR 72201 | 4,856,320 | 16.4 | % | 1,863,204.5 | 2,993,115.5 | 8.2 | % | ||||
| Third Avenue Trust 622 Third Avenue New York, NY 10017 | 4,609,411 | 15.6 | % | 0 | 4,609,411 | 12.6 | % | ||||
| Chestnut Hill ACA, LLC 60 Williams Street, Suite 230 Wellesley, MA 02481 | 4,011,851 | 13.5 | % | 0 | 4,011,851 | 11.0 | % | ||||
| AEGON USA Inc.(4) 400 West Market Street Louisville, KY 40202 | 1,481,004 | 5.0 | % | 1,481,004 | 0 | 0.0 | % | ||||
Named Executive Officers and Directors | |||||||||||
| Alan S. Roseman(5) | 690,071 | 2.3 | % | 0 | 750,071 | 2.0 | % | ||||
| Edward U. Gilpin(6) | 302,796 | 1.0 | % | 0 | 337,296 | * | % | ||||
| William T. Tomljanovic(7) | 309,857 | 1.0 | % | 0 | 309,857 | * | % | ||||
| Laura Schwartz(8) | 65,380 | * | 0 | 95,380 | * | % | |||||
| James A. Rothman(9) | 84,889 | * | 0 | 114,889 | * | % | |||||
| David E. King(10) | 10,113,983 | 34.1 | % | 0 | 10,113,983 | 27.7 | % | ||||
| David M. Barse(11) | 4,609,411 | 15.6 | % | 0 | 4,609,411 | 12.6 | % | ||||
| John G. Berylson(12) | 4,011,851 | 13.5 | % | 0 | 4,011,851 | 11.0 | % | ||||
| Douglas L. Jacobs(13) | 40,266 | * | 0 | 42,766 | * | % | |||||
| Robert Juneja(14) | 10,113,983 | 34.1 | % | 0 | 10,113,983 | 27.7 | % | ||||
| William H. Lacy(15) | 46,800 | * | 0 | 49,300 | * | % | |||||
| Warren A. Stephens(16) | 4,856,320 | 16.4 | % | 1,863,204 | 2,993,116 | 8.2 | % | ||||
| All Executive Officers and Directors as a Group (15 persons) | 25,345,036 | 85.5 | % | 1,863,204 | 23,696,832 | 64.9 | % | ||||
| Other Selling Stockholders | |||||||||||
| Insurance Partners(17) 201 Main Street Suite 1620 Fort Worth, Texas 76102 | 1,425,742.8 | 4.8 | % | 1,425,742.8 | 0.00 | 0.0 | % | ||||
| Banc of America 214 North Tyron St. 17th Floor Charlotte, NC 28255 | 527,324.2 | 1.8 | % | 527,324.2 | 0.00 | 0.0 | % | ||||
| Other Shareholders (7 persons)** | 32,047.5 | * | 32,047.5 | 0.00 | 0.0 | % | |||||
Unless otherwise indicated in the footnotes, the address of each of the beneficial owners identified is c/o ACA Capital Holdings, Inc., 140 Broadway, New York, NY 10005.
- *
- Less than 1% of our outstanding common stock.
- **
- Represents additional selling stockholders who hold in the aggregate less than 1% of our outstanding shares of common stock prior to and after the offering.
155
- (1)
- Shares beneficially owned prior to the offering includes (a) shares of common stock issuable upon the exercise of outstanding stock options exercisable within 60 days of October 3, 2006 or upon the completion of this offering, (b) shares of common stock issuable upon conversion of shares of convertible preference stock, shares of senior convertible preferred stock and shares of series B senior convertible preferred stock which will convert concurrently with the consummation of this offering. Shares beneficially owned after the offering includes the items set forth above and shares of restricted stock issuable upon completion of this offering.
- (2)
- Assumes no exercise of the underwriters' over-allotment option to purchase an aggregate of 1,830,500 shares of common stock.
- (3)
- BSMB/ACA LLC is an affiliate of, and is controlled by, Bear Stearns Merchant Banking and an affiliate of The Bear Stearns Companies Inc., a broker/dealer. The Bear Stearns Companies Inc. and John D. Howard, by virtue of his status as the sole member of JDH Management, LLC, may be deemed to share beneficial ownership of shares owned of record by Bear Stearns Merchant Banking and BSMB/ACA LLC. Mr. Howard and The Bear Stearns Companies Inc. share investment and voting power with respect to shares owned by Bear Stearns Merchant Banking and BSMB/ACA LLC, but disclaim beneficial ownership of such shares except to the extent of their pecuniary interest therein. Mr. Howard is employed by Bear, Stearns & Co. Inc., a broker/dealer. The Bear Stearns Companies Inc. is the managing member of Bear Stearns Merchant GP II, LLC, which is the general partner of Bear Stearns Merchant Capital II, L.P., the general partner of Bear Stearns Merchant Banking. The business address for John D. Howard and each of the entities identified in this footnote is 383 Madison Avenue, New York, New York 10179.
- (4)
- Shares beneficially owned by AEGON USA Inc. consists of: (i) 740,502 shares of common stock owned by Life Investors Insurance Company of America and (ii) 740,502 shares of common stock owned by Transamerica Life Insurance Company.
- (5)
- Includes beneficial ownership of 444,857 shares of restricted stock issuable upon completion of this offering and/or common stock for which Mr. Roseman holds options exercisable on or within 60 days of October 3, 2006.
- (6)
- Includes beneficial ownership of 284,562 shares of restricted stock issuable upon completion of this offering and/or common stock for which Mr. Gilpin holds options exercisable on or within 60 days of October 3, 2006.
- (7)
- Includes beneficial ownership of 247,491 shares of restricted stock issuable upon completion of this offering and/or common stock for which Mr. Tomljanovic holds options exercisable on or within 60 days of October 3, 2006.
- (8)
- Includes beneficial ownership of 183,935 shares of restricted stock issuable upon completion of this offering and/or common stock for which Ms. Schwartz holds options exercisable on or within 60 days of October 3, 2006.
- (9)
- Includes beneficial ownership of 90,808 shares of restricted stock issuable upon completion of this offering and/or common stock for which Mr. Rothman holds options exercisable on or within 60 days of October 3, 2006.
- (10)
- Mr. King, our chairman, is a Senior Managing Director of Bear, Stearns & Co. Inc. and an Executive Vice President of Bear Stearns Merchant Banking, LLC, an affiliate of BSMB/ACA LLC. Mr. King disclaims beneficial ownership of any of the shares of common stock owned by BSMB/ACA LLC, except to the extent of his pecuniary interest therein, if any.
156
- (11)
- Mr. Barse, one of our directors, is President and Chief Executive Officer of Third Avenue Management, LLC, an affiliate of Third Avenue Trust. Mr. Barse disclaims beneficial ownership of any of the shares of common stock owned by Third Avenue Trust, except to the extent of his pecuniary interest therein, if any.
- (12)
- Mr. Berylson, one of our directors, is Chairman and Chief Executive Officer of Chestnut Hill Ventures, LLC, an affiliate of Chestnut Hill ACA, LLC. Mr. Berylson disclaims beneficial ownership of any of the shares of common stock owned by Chestnut Hill ACA, LLC, except to the extent of his pecuniary interest therein, if any.
- (13)
- Includes beneficial ownership of 15,100 shares of restricted stock issuable upon completion of this offering and/or common stock for which Mr. Jacobs hold options exercisable on or within 60 days of October 3, 2006.
- (14)
- Mr. Juneja, one of our directors, is a Managing Director of Bear, Stearns & Co. Inc. and Bear Stearns Merchant Banking, LLC, an affiliate of BSMB/ACA LLC. Mr. Juneja disclaims beneficial ownership of any of the shares of common stock owned by BSMB/ACA LLC, except to the extent of his pecuniary interest therein, if any.
- (15)
- Includes beneficial ownership of 10,900 shares of restricted stock issuable upon completion of this offering and/or common stock for which Mr. Lacy hold options exercisable on or within 60 days of October 3, 2006.
- (16)
- Mr. Stephens, one of our directors, is President and Chief Executive Officer of SF Holding Corp. (f/k/a Stephens Group, Inc.). Mr. Stephens may be deemed to have beneficial ownership of any of the shares of common stock owned by SF Holding Corp. (f/k/a Stephens Group, Inc.).
- (17)
- Consists of: (i) 911,769.6 shares of common stock owned by Insurance Partners, L.P., (ii) 502,509.6 shares of common stock owned by Insurance Partners Offshore (Bermuda) L.P., and (iii) 11,463.6 shares of common stock owned by IP/MCLP, L.L.C.
Insurance GenPar, L.P., as the general partner of Insurance Partners, L.P., Insurance GenPar MGP, L.P., as the general partner of Insurance GenPar, L.P., and Insurance GenPar MGP, Inc., as the general partner of Insurance GenPar MGP, L.P., may be deemed as beneficial owners of the shares of common stock owned by Insurance Partners, L.P., but only to the extent of their respective pecuniary interest therein. The business address for Insurance Partners, L.P. is 201 Main Street, Suite 1620, Fort Worth, Texas 76102.
Insurance GenPar (Bermuda), L.P., as the general partner of Insurance Partners Offshore (Bermuda), L.P., Insurance GenPar (Bermuda) MGP, L.P., as the general partner of Insurance GenPar (Bermuda), L.P., and Insurance GenPar (Bermuda) MGP, Ltd., as the general partner of Insurance GenPar (Bermuda) MGP, L.P., may be deemed as beneficial owners of the shares of common stock owned by Insurance Partners (Bermuda), L.P., but only to the extent of their respective pecuniary interest therein. The business address for Insurance Partners Offshore (Bermuda), L.P. is 41 Cedar Avenue, P.O. Box HM 1179, Hamilton, HM EX, Bermuda.
Insurance Partners, L.P. and Insurance Partners Offshore (Bermuda) L.P., as managing members of IP/MCLP, L.L.C., Insurance GenPar, L.P., as the general partner of Insurance Partners, L.P., Insurance GenPar MGP, L.P., as the general partner of Insurance GenPar, L.P., Insurance GenPar MGP, Inc., as the general partner of Insurance GenPar MGP, L.P., Insurance GenPar (Bermuda), L.P., as the general partner of Insurance Partners Offshore (Bermuda), L.P., Insurance GenPar (Bermuda) MGP, L.P., as the general partner of Insurance GenPar (Bermuda), L.P., and Insurance GenPar (Bermuda) MGP, Ltd., as the general partner of Insurance GenPar (Bermuda) MGP, L.P., may be deemed as beneficial owners of the shares of common stock owned by IP/MCLP, L.L.C., but only to the extent of their respective pecuniary interest therein. The business address for IP/MCLP, L.L.C. is One Chase Manhattan Plaza, 44th Floor, New York, NY 10005.
157
CERTAIN RELATIONSHIPS AND RELATED PARTY TRANSACTIONS
On September 30, 2004, a Bear Stearns Merchant Banking, LLC sponsored investment vehicle, BSMB/ACA LLC ("BSMB"), invested $105 million in the Company in exchange for series B senior convertible preferred stock. Bear Stearns Merchant Banking is the private equity arm of Bear, Stearns & Co. Inc., a wholly-owned subsidiary of The Bear Stearns Companies Inc., and a representative of the underwriters in this offering. BSMB is our largest stockholder, with 34.3% of our outstanding common stock on an as-converted basis before giving effect to this offering, and BSMB has the right to appoint three representatives to serve on our Board of Directors. Currently two BSMB representatives serve on our Board, including our chairman. Upon closing the BSMB investment, we paid an affiliate of BSMB a transaction fee of $2.0 million. In addition, we paid advisory expenses of $0.8 million to Bear, Stearns & Co. Inc. on behalf of BSMB in 2004. We also paid an affiliate of BSMB a portfolio monitoring fee of approximately $62,500 in 2004 and $263,945 in 2005 and $64,000 in the first quarter of 2006 under a professional services agreement that will terminate upon consummation of this offering.
During 2005, Bear, Stearns & Co. Inc. performed investment banking services for us in connection with the structuring and issuance of one of our CDOs for which it was paid a structuring and placement fee of $5.0 million. At the close of that transaction, Bear, Stearns & Co. Inc. paid us an asset management fee of $450,000 for managing the assets during the warehouse phase. Bear, Stearns & Co. Inc. also performed investment banking services on a CDO that closed on April 27, 2006 for which it was paid a structuring and placement fee of $10.4 million. We were also paid a structuring fee and fees for management of the assets during the warehouse phase in the aggregate amount of $4.3 million in that transaction. Bear, Stearns & Co. Inc. is acting as an investment bank in connection with three additional CDOs, which are presently in the warehouse phase. Upon the close of that CDO, Bear, Stearns & Co. Inc. will also receive a structuring and placement fee. In addition, during 2005, Bear, Stearns & Co. Inc. was paid a placement fee of $1.0 million in connection with the issuance and sale of certain medium term notes. In April 2006, we transferred our position in a credit swap as a protection seller under one Structured Credit transaction to Bear, Stearns & Co. Inc. for which Bear, Stearns & Co. Inc. paid us $839,000. In May 2006, we entered into a credit agreement in which Bear Stearns Corporate Lending Inc., an affiliate of BSMB, is a lender and will earn customary fees. See "Management's Discussion and Analysis of Financial Condition and Results of Operations—Liquidity and Capital Resources—Indebtedness—Credit Facility."
In 2002, we replaced one of our investment managers with Stephens Capital Management ("Stephens") and incurred investment management fees of $0.1 million, $0.2 million and $0.1 million related to Stephens during 2005, 2004 and 2003, respectively, and $32,000 in 2006 related to first quarter activity. This investment manager is affiliated with SF Holding Corp. (f/k/a Stephens Group Inc.). SF Holding Corp. is our second largest stockholder, with 16.5% of our outstanding common stock on an as-converted basis before giving effect to this offering. One representative of SF Holding Corp. serves on our Board of Directors. Stephens Inc., an affiliate of SF Holding Corp., is one of the underwriters in this offering.
In May 2003, Banc of America Securities, LLC, an affiliate of Banc of America Strategic Investments Corporation, acted as placement agent in connection with the origination of one of our CDOs. We paid Banc of America Securities, LLC a total of $3,538,708 in placement and structuring fees and expenses in relation to these services. Also, in connection with a municipal bond offering consummated during the fourth quarter of 2003, ACA Financial Guaranty Corporation obtained a standby letter of credit from Bank of America, N.A., another affiliate of Banc of America Strategic Investments Corporation, in the stated amount of $11,680,000 for which Bank of America, N.A. was paid fees and expenses totaling approximately $232,000 in 2003. The letter of credit was terminated effective as of December 31, 2004. In addition, Banc of America Securities, LLC acted as placement agent in connection with our issuance of shares of series B senior convertible preferred stock in 2004 for which it was paid placement fees of $2.4 million. At the time of these transactions, Banc of
158
America Strategic Investments Corporation was the beneficial owner of 7.8% of our outstanding common stock on an as-converted basis before giving effect to this offering, and, as of October 3, 2006, held 1.8% of our outstanding common stock on an as-converted basis.
We believe all the transactions listed above are on terms comparable to those that could have been obtained from unaffiliated third parties.
We have entered into indemnity agreements with two of our directors, William Lacy and Douglas Jacobs, under which we agreed to indemnify Mr. Lacy or Mr. Jacobs if either is made, or threatened to be made, a party to any action or proceeding (including an action by or in the right of the Company), whether civil, criminal, administrative or investigative, by reason of the fact that he is or was a director of our company, or was serving at our request as a director or officer of another corporation, partnership, joint venture, trust or other enterprise, against any judgments, fines, amounts paid in settlement and reasonable expenses which he incurs, subject to the limitations imposed by Delaware law. Under Delaware law, we are permitted to indemnify our directors, officers, employees and other agents, within the limits established by our bylaws and public policy, pursuant to an express contract. Delaware law generally permits indemnification of expenses actually and reasonably incurred in the defense or settlement of a derivative or third-party action, provided there is a determination by a disinterested quorum of the directors, by independent legal counsel (if a quorum of independent directors is not obtainable) or by a majority vote of a quorum of the stockholders (excluding shares owned by the indemnified party) that the person seeking indemnification acted in good faith and in a manner reasonably believed to be in, or not opposed to, the best interests of the corporation. Without court approval, however, no indemnification may be made in respect of any derivative action in which such person is adjudged liable for negligence or misconduct in the performance of his or her duty to the corporation. In addition, we maintain liability insurance covering all of our directors and officers. There is no pending litigation or proceeding involving any of our directors, officers or employees for which indemnification is sought.
On September 30, 2004, pursuant to an employment contract approved by the Board of Directors, we granted 55,869 restricted shares of series B senior convertible preferred stock to our Chief Executive Officer, Alan Roseman, which totaled approximately $3.5 million. In addition, we loaned Mr. Roseman $1,372,892 to fund taxes associated with his Section 83(b) election. The loan accrued interest at 3.56%, the applicable federal rate provided by the IRS for the month the loan was originated. The largest aggregate amount of indebtedness outstanding was $1,380,902. On May 2, 2006, Mr. Roseman paid the outstanding principal balance and accrued interest in the amount of $1,126,312 in full. See "Executive Compensation—Employment Agreements."
Pursuant to employment agreements approved by the Board of Directors in 2001, our Executive Vice President and Chief Financial Officer, Edward Gilpin, and our Executive Vice President—Head of Credit, William Tomljanovic, each purchased 8,789 shares of our common stock in exchange for a $500,000 10-year promissory note payable to us. The promissory notes accrued interest at the 10-year U.S. Treasury rate. Under Mr. Gilpin's note the largest aggregate amount of indebtedness outstanding was $560,533. Mr. Gilpin made principal and interest payments on the note in the aggregate amount of $171,600 and the remaining balance was forgiven by the Company. Under Mr. Tomljanovic's note the largest aggregate amount of indebtedness outstanding was also $560,533. Mr. Tomljanovic made principal and interest payments on the note in the aggregate amount of $190,350 and the remaining balance was forgiven by the Company. See "Executive Compensation—Employment Agreements."
From September 2004 to May 2005, we employed James Berylson, the son of John Berylson, a member of our Board of Directors. During that time, James Berylson received compensation of $60,750 while serving as an analyst in our Structured Credit business.
See "Description of Capital Stock—Stockholders Agreement" for additional information on relationships with our stockholders.
159
The following description of our share capital summarizes certain provisions of our Certificate of Incorporation and Bylaws. Copies of our Certificate of Incorporation and Bylaws are filed as exhibits to the registration statement of which this prospectus is a part.
General
As of October 3, 2006, our authorized capital stock consisted of 100,000,000 shares of common stock, par value $0.10 per share, and 8,000,000 shares of preferred stock, par value $0.10 per share. As of October 3, 2006, we had 6,254,643 shares of common stock outstanding, 959 shares of convertible preferred stock outstanding, 154 shares of senior convertible preferred stock outstanding and 2,785,769 shares of series B senior convertible preferred stock outstanding. We will be issuing 6,875,000 shares of common stock in this offering (assuming the underwriters' over-allotment option is not exercised). Upon consummation of the offering, and excluding restricted stock granted contingent upon the consummation of this offering, we will have approximately 36,523,281 shares outstanding as adjusted for conversion of our preferred stock described below. As of October 3, 2006, we had options outstanding to acquire 3,354,054 shares of common stock with a weighted average exercise price of $11.28 and options to acquire 2,973,918 shares of common stock available under our option plan, 543,000 of which have been granted contingent upon the completion of this offering with a per share exercise price equal to the initial public offering price and 239,000 shares of which were also granted as an award of restricted stock to certain independent directors and employees of the Company on August 3, 2006 contingent upon the completion of this offering.
Upon consummation of this offering, all outstanding shares of our convertible preferred stock, senior convertible preferred stock and series B senior convertible preferred stock will convert into shares of our common stock. We are required to give notice to each registered holder of convertible preferred stock, specifying the applicable conversion price and calling upon such holders to surrender all convertible preferred stock for mandatory conversion into shares of common stock.
Common Stock
Holders of common stock have no preemptive, redemption, conversion or sinking fund rights. The quorum for any meeting of our stockholders is two or more persons present in person and representing in person or by proxy the majority of the aggregate voting power of our Company. Holders of common stock are entitled to one vote per share on all matters submitted to a vote of holders of common stock, provided that holders of common stock are not entitled to vote on any amendment to the Certificate of Incorporation that relates solely to the terms, number of shares, powers, limitations or restrictions of preferred stock. Most matters to be approved by holders of common stock require approval by a simple majority vote cast at a meeting where a quorum is present. However, directors shall be elected by a plurality in voting power of the shares present in person or represented by proxy at a meeting where a quorum is present.
Subject to preferences that may be applicable to any outstanding preferred stock, the holders of common stock will be entitled to receive ratably such dividends, if any, as may be declared from time to time by the Board of Directors out of funds legally available for that purpose. In the event of a dissolution, liquidation or winding-up of our company, the holders of our common stock are entitled to share equally and ratably in the assets of our company, if any, remaining after the payment of all our debts and liabilities and the liquidation preference of any outstanding preferred stock.
Preferred Stock
Upon the consummation of this offering, all outstanding shares of our preferred stock will be converted into an aggregate of 23,393,638 shares of common stock. Our Board of Directors has the authority to issue new preferred stock in one or more series and to establish the rights, preferences,
160
privileges and restrictions granted to or imposed on any unissued shares of preferred stock and to fix the number of shares constituting any series and the designations of such series, without any further vote or action by the stockholders. Our Board of Directors will have the authority, without approval of the stockholders, to issue preferred stock that has voting and conversion rights superior to the common stock which may affect the voting power of the holders of common stock and could have the effect of delaying, deferring or preventing a change in control. We have no plans to issue any shares of preferred stock.
Delaware Anti-Takeover Law and Charter and Bylaw Provisions
Provisions of Delaware law and our Certificate of Incorporation and Bylaws could make it more difficult to acquire us by means of a tender offer, a proxy contest or otherwise, and to remove incumbent officers and directors. These provisions are expected to discourage types of coercive takeover practices and inadequate takeover bids and to encourage persons seeking to acquire control of us to first negotiate with us. We believe that the benefits of increased protection of our potential ability to negotiate with the proponent of an unfriendly or unsolicited proposal to acquire or restructure us outweigh the disadvantages of discouraging takeover or acquisition proposals because, among other things, negotiation of these proposals could result in an improvement of their terms.
We are subject to Section 203 of the Delaware General Corporation Law, an anti-takeover law. In general, Section 203 prohibits a publicly held Delaware corporation from engaging in a "business combination" with an "interested stockholder" for a period of three years following the date the person became an interested stockholder, unless (with certain exceptions) the "business combination" or the transaction in which the person became an interested stockholder is approved in a prescribed manner. Generally, a "business combination" includes a merger, asset or stock sale, or other transaction resulting in a financial benefit to the interested stockholder. Generally, an "interested stockholder" is a person who, together with affiliates and associates, owns (or within three years prior to the determination of interested stockholder status, did own) 15% or more of a corporation's voting stock. The existence of this provision would be expected to have an anti-takeover effect with respect to transactions not approved in advance by the Board of Directors, including discouraging attempts that might result in a premium over the market price for the shares of common stock held by stockholders.
Registration Rights
The holders of substantially all of our unregistered shares have the right, pursuant to a registration rights agreement, subject to certain limitations, to demand the registration of all or a part of their shares of common stock. Under the agreement, no party may exercise their right to demand registration of any shares within 180 days after (i) the effective date of a previous registration pursuant to a demand registration or (ii) certain previous registrations in which the holders of registrable securities were given piggyback rights. The holders of registrable securities are divided into three groups under the agreement, and we are obligated to effect a total of up to two "demand" registrations for each such group. Any such registration statement that we file in response to such a demand must allow at least 80% of the securities requested to be included in such registration to be registered and sold in order for the filing to count as one of the "demand" registrations. This right will be made subject to a lock-up agreement between those stockholders with registration rights and our underwriters in connection with this offering which, unless waived, will prevent such holders from exercising this right until 180 days after the date of this Prospectus. See "Underwriting."
Subject to the exceptions and limitations set forth in the registration rights agreement, the holders of registrable securities have unlimited piggyback registration rights, subject to the right of the underwriters to determine that the number of securities exceeds the amount that can reasonably be sold and require the registration of the reasonable amounts of shares pro rata amongst the holders.
We will bear all registration expenses, except underwriting discounts and selling commissions, incurred in connection with the registrations described above. We have agreed to indemnify each
161
stockholder with registration rights against certain liabilities, including liabilities under federal and state securities laws.
We have filed the Amended and Restated Registration Rights Agreement and Amendments Nos. 1 and 2 to the Amended and Restated Registration Rights Agreement as exhibits to our registration statement, and this discussion is qualified by reference to the actual agreement and amendments.
Stockholders Agreement
We and some of our current stockholders are parties to a stockholders agreement.
The stockholders agreement states that each stockholder that is a party to the agreement shall vote and shall take all other necessary or desirable actions within its control in its capacity as a stockholder, and that we shall take all necessary or desirable actions within our control, so that the following individuals shall be elected to our Board of Directors:
- •
- two members of our senior management, one of which must be our Chief Executive Officer and another, who must be a member of our executive management team, nominated by our Chief Executive Officer;
- •
- one director nominated by BSMB/ACA LLC if BSMB/ACA LLC and its affiliates hold 10% or more of its original stock holdings, two directors nominated by BSMB/ACA LLC if BSMB/ACA LLC and its affiliates hold 25% or more of its original stock holdings and three directors nominated by BSMB/ACA LLC if BSMB/ACA LLC and its affiliates hold 50% or more of its original stock holdings, and at all times two independent directors nominated by BSMB/ACA LLC not employed by the Company, Bear Stearns or any stockholder (BSMB/ACA LLC is an affiliate of Bear, Stearns & Co. Inc.);
- •
- one director nominated by SF Holding Corp. (f/k/a Stephens Group, Inc.) if SF Holding Corp. holds 10% or more of our common stock;
- •
- one director nominated by Chestnut Hill ACA, LLC if Chestnut Hill ACA, LLC holds 10% or more of our common stock; and
- •
- one director nominated by Third Avenue Trust if Third Avenue Trust holds 10% or more of our common stock.
The chairman of our Board of Directors shall be an individual nominated by BSMB/ACA LLC and, subject to applicable NYSE and SEC rules, any committee of the Board of Directors shall include at least one individual nominated by BSMB/ACA LLC, subject to NYSE and SEC independence requirements. The composition of the Board of Directors of ACA Financial Guaranty and any other subsidiary of the Company that BSMB/ACA LLC may reasonably designate shall be the same as that of the Board of Directors of the Company unless prohibited by law, in which case the composition of such subsidiary board shall include at least one BSMB/ACA LLC director unless BSMB/ACA LLC otherwise consents. Amendment No. 2 to the Stockholders Agreement provides that, in the event of a conflict between the Securities Act of 1933, as amended, the Securities Exchange Act of 1934, as amended, (together the "securities laws") or the rules and regulations of any exchange of which the company's common stock is traded (the "listing requirements") and the terms of the Stockholders Agreement, the listing requirements and/or the applicable securities laws will prevail.
Each of our employees who is a party to the stockholders agreement must appoint BSMB/ACA LLC as proxy and attorney-in-fact to vote for the election and/or removal of directors. If such an employee ceases to be employed by us, our Board of Directors may elect to have the Company purchase all or any portion of shares owned by the employee. The purchase price of these shares will be determined pursuant to a formula in the stockholders agreement and may not be equal to the market price at the time of termination or repurchase.
162
We have filed the Stockholders Agreement and Amendment Nos. 1 and 2 to the Stockholders Agreement as exhibits to our registration statement, and this summary is qualified by reference to the actual agreement and amendments.
Limitations of Directors' and Officer's Liability; Indemnification
Our Certificate of Incorporation includes provisions that limit the personal liability of our directors for monetary damages for breach of their fiduciary duties as directors, except for liability that cannot be eliminated under the Delaware General Corporation Law. The Delaware General Corporation Law does not permit a provision in a corporation's Certificate of Incorporation that would eliminate such liability (i) for any breach of their duty of loyalty to the corporation or its stockholders, (ii) for acts or omissions not in good faith or that involve intentional misconduct or a knowing violation of law, (iii) for any unlawful payment of a dividend or unlawful stock repurchase or redemption, as provided in Section 174 of the Delaware General Corporation Law or (iv) for any transaction from which the director derived an improper personal benefit.
While these provisions provide directors with protection from awards for monetary damages for breaches of their duty of care, they do not eliminate such duty. Accordingly, these provisions will have no effect on the availability of equitable remedies such as an injunction or rescission based on a director's breach of his or her duty of care. Our Bylaws also contain provisions indemnifying our directors and officers to the fullest extent permitted by Delaware law. Our Bylaws further provide that, to the fullest extent permitted by Delaware law, we may indemnify our employees and agents. We believe that these provisions are necessary to attract and retain qualified individuals to serve as directors, officers, employees and agents.
We have entered into indemnity agreements with two of our directors, William Lacy and Douglas Jacobs, under which we agreed to indemnify Mr. Lacy or Mr. Jacobs if he is made, or threatened to be made, a party to any action or proceeding (including an action by or in the right of the Company), whether civil, criminal, administrative or investigative, by reason of the fact that he is or was a director of our company or was serving at our request as a director or officer of another corporation, partnership, joint venture, trust, or other enterprise, against any judgments, fines, amounts paid in settlement and reasonable expenses which he incurs. We maintain liability insurance covering our directors and officers. There is no pending litigation or proceeding involving any of our directors, officers or employees for which indemnification is sought.
Corporate Opportunities
Our Certificate of Incorporation provides that BSMB/ACA LLC, SF Holding Corp. (f/k/a Stephens Group, Inc.), Chestnut Hill ACA, LLC, Third Avenue Trust and certain other of our significant stockholders have no obligation to offer us an opportunity to participate in business opportunities presented to those entities or their respective affiliates even if the opportunity is one that we might reasonably have pursued, and that none of those entities nor their respective affiliates will be liable to us or our stockholders for breach of any duty by reason of any such activities unless, in the case of any person who is a director or officer of our company, such business opportunity is expressly offered to such director or officer in writing solely in his or her capacity as an officer or director of our company. Stockholders will be deemed to have notice of and consented to this provision of our Certificate of Incorporation.
Transfer Agent
Our registrar and transfer agent for our common stock is Mellon Investor Services LLC.
Listing
Our common stock has been approved for listing on the NYSE under the symbol "ACA," subject to official notice of issuance.
163
SHARES ELIGIBLE FOR FUTURE SALE
Prior to this offering, there has been no public market for our common stock. Upon consummation of this offering, we will have outstanding an aggregate of 36,762,281 shares of our common stock, assuming no exercise of the underwriters' over-allotment option and no exercise of outstanding options. If the underwriters exercise their over-allotment option in full, assuming no exercise of outstanding options, we will have 38,592,781 shares of our common stock outstanding. All of the shares we sell in this offering will be freely tradable without restriction or further registration under the Securities Act, other than shares purchased by our "affiliates," as that term is defined in Rule 144. The remaining 66.8%, or 24,557,958 shares of our common stock that are outstanding after this offering, will be restricted shares under the terms of the Securities Act. Approximately 87.9% of these shares are subject to lock-ups as described below. Restricted shares may be sold in the public market only if registered or if they qualify for an exemption from registration under Rules 144, 144(k) or 701 promulgated under the Securities Act, which rules are summarized below
We and our executive officers and directors, the selling stockholders and certain other stockholders, all of whom collectively hold a substantial majority of our stock not being sold in the offering, have agreed under lock-up agreements that, during the period beginning from the date of this prospectus and continuing to and including the date 180 days after the date of this prospectus, none of us will, directly or indirectly, offer, sell, offer to sell, contract to sell or otherwise dispose of any of our common stock, except in limited circumstances, without the prior written consent of Credit Suisse Securities (USA) LLC.
In general, under Rule 144 as currently in effect, beginning 90 days after the date of this prospectus a person who has beneficially owned restricted shares for at least one year and has complied with the requirements described below would be entitled to sell a specified number of shares within any three-month period. That number of shares cannot exceed the greater of one percent of the number of shares of our common stock then outstanding, which will equal approximately 36,762 shares immediately after this offering, or the average weekly trading volume of our common stock on the New York Stock Exchange during the four calendar weeks preceding the filing of a notice on Form 144 reporting the sale. Sales under Rule 144 are also restricted by manner of sale provisions, notice requirements and the availability of current public information about us. Rule 144 also provides that our affiliates who are selling shares of our common stock that are not restricted shares must comply with the same restrictions applicable to restricted shares with the exception of the holding period requirement.
Under Rule 144(k), a person who is not deemed to have been our affiliate at any time during the 90 days preceding a sale, and who has beneficially owned the shares proposed to be sold for at least two years, is entitled to sell those shares without complying with the manner of sale, public information, volume limitation or notice provisions of Rule 144. Accordingly, unless otherwise restricted, 15,505,588 shares may be sold immediately after completion of this offering. In addition, the remaining 21,591,907 shares subject to the lock-up period described above may be resold under Rule 144, approximately half of which are held by affiliates.
Rule 701 provides that shares of common stock acquired upon the exercise of currently outstanding options or pursuant to other rights granted under our equity incentive plan may be resold, to the extent not restricted by the terms of the lock-up agreements, by persons, other than affiliates, beginning 90 days after the date of this prospectus, subject only to the manner of sale provisions of Rule 144, and by affiliates under Rule 144, without compliance with its one-year minimum holding period. As of October 3, 2006, options to purchase a total of 3,354,054 shares of our common stock were outstanding, 1,661,931 of which options are exercisable. In addition, 543,000 options are being issued contingent on the offering.
164
We intend to file a registration statement on Form S-8 under the Securities Act within 90 days after this offering to register 1,054,662 shares of our common stock underlying outstanding stock options or reserved for issuance under our Amended and Restated 2006 Stock Incentive Plan. This registration statement will become effective upon filing, and shares covered by this registration statement will be eligible for sale in the public market immediately after the effective date of this registration statement, unless such shares are subject to vesting restrictions with us or the lock-up agreements described above.
As a result of lock-up agreements, the Form S-8, the provisions of Rules 144 and 701 and vesting of certain options, additional shares will be available for sale in the public market as follows:
| Number of Shares | Date of First Availability for Resale | |
|---|---|---|
1,661,931 1,843,076 23,362,183 | Immediately. Upon filing the Form S-8, assuming the vesting of certain options. After 180 days from the date of this prospectus, assuming the vesting of certain options and subject, in some cases, to volume limits. |
Prior to this offering, there was no public market for our common stock. We cannot predict the effect, if any, that sales of our common stock from time to time, or the availability of our common stock for future sale, may have on the market price for our common stock. Sales of substantial amounts of our common stock, or the perception that such sales could occur, could adversely affect prevailing market prices for our common stock and could impair our future ability to obtain capital through an offering of equity securities.
165
MATERIAL U.S. FEDERAL INCOME TAX CONSIDERATIONS
The following is a summary of the material U.S. federal income and estate tax consequences of the acquisition, ownership and disposition of our common shares by a non-U.S. holder. As used in this summary, the term "non-U.S. holder" means a beneficial owner of our common shares that is not, for United States federal income tax purposes:
- •
- an individual who is a citizen or resident of the United States or a former citizen or resident of the United States subject to taxation as an expatriate;
- •
- a corporation (or other entity classified as a corporation for these purposes) created or organized in or under the laws of the United States or of any political subdivision of the United States;
- •
- a partnership (including any entity or arrangement classified as a partnership for these purposes);
- •
- an estate whose income is includible in gross income for U.S. federal income tax purposes regardless of its source; or
- •
- a trust, if (1) a U.S. court is able to exercise primary supervision over the trust's administration and one or more "United States persons" (within the meaning of the U.S. Internal Revenue Code) has the authority to control all of the trust's substantial decisions, or (2) the trust has a valid election in effect under applicable U.S. Treasury regulations to be treated as a "United States person."
An individual may be treated as a resident of the United States in any calendar year for United States federal income tax purposes, instead of a nonresident, by, among other ways, being present in the United States on at least 31 days in that calendar year and for an aggregate of at least 183 days during a three-year period ending in the current calendar year. For purposes of this calculation, an individual would count all of the days present in the current year, one-third of the days present in the immediately preceding year and one-sixth of the days present in the second preceding year. Residents are taxed for U.S. federal income purposes as if they were U.S. citizens.
If a partnership or other pass-through entity (including an entity or arrangement treated as a partnership or other type of pass-through entity for U.S federal income tax purposes) owns our common shares, the tax treatment of a partner or beneficial owner of the partnership or other pass-through entity may depend upon the status of the partner or beneficial owner and the activities of the partnership or entity and by certain determinations made at the partner or beneficial owner level. Partners and beneficial owners in partnerships or other pass-through entities that own our common shares should consult their own tax advisors as to the particular U.S. federal income and estate tax consequences applicable to them.
This summary does not discuss all of the aspects of U.S. federal income and estate taxation that may be relevant to a non-U.S. holder in light of the non-U.S. holder's particular investment or other circumstances. In particular, this summary only addresses a non-U.S. holder that holds our common shares as a capital asset (generally, investment property) and does not address:
- •
- special U.S. federal income tax rules that may apply to particular non-U.S. holders, such as financial institutions, insurance companies, tax-exempt organizations, and dealers and traders in stocks, securities or currencies;
- •
- non-U.S. holders holding our common shares as part of a conversion, constructive sale, wash sale or other integrated transaction or a hedge, straddle or synthetic security;
- •
- any U.S. state and local or non-U.S. or other tax consequences; or
166
- •
- the U.S. federal income or estate tax consequences for the beneficial owners of a non-U.S. holder.
This summary is based on provisions of the U.S. Internal Revenue Code of 1986, as amended, applicable U.S. Treasury regulations and administrative and judicial interpretations, all as in effect or in existence on the date of this prospectus. Subsequent developments in U.S. federal income or estate tax law, including changes in law or differing interpretations, which may be applied retroactively, could have a material effect on the U.S. federal income and estate tax consequences of purchasing, owning and disposing of our common shares as set forth in this summary.Each non-U.S. holder should consult a tax advisor regarding the U.S. federal, state, local and non-U.S. income and other tax consequences of acquiring, holding and disposing of our common shares.
Dividends
We do not anticipate paying cash dividends on our common shares in the foreseeable future. See "Dividend Policy." In the event, however, that we pay dividends on our common shares that are not effectively connected with a non-U.S. holder's conduct of a trade or business in the United States, a U.S. federal withholding tax at a rate of 30%, or a lower rate under an applicable income tax treaty, will be withheld from the gross amount of the dividends paid to such non-U.S. holder. Non-U.S. holders should consult their own tax advisors regarding their entitlement to benefits under a relevant income tax treaty.
In order to claim the benefit of an applicable income tax treaty, a non-U.S. holder will be required to provide a properly executed U.S. Internal Revenue Service Form W-8BEN (or other applicable form) in accordance with the applicable certification and disclosure requirements. Special rules apply to partnerships and other pass-through entities and these certification and disclosure requirements also may apply to beneficial owners of partnerships and other pass-through entities that hold our common shares. A non-U.S. holder that is eligible for a reduced rate of U.S. federal withholding tax under an income tax treaty may obtain a refund or credit of any excess amounts withheld by filing an appropriate claim for a refund with the U.S. Internal Revenue Service. Non-U.S. holders should consult their own tax advisors regarding their entitlement to benefits under a relevant income tax treaty and the manner of claiming the benefits.
Dividends that are effectively connected with a non-U.S. holder's conduct of a trade or business in the United States and, if required by an applicable income tax treaty, are attributable to a permanent establishment maintained by the non-U.S. holder in the United States, will be taxed on a net income basis at the regular graduated rates and in the manner applicable to United States persons. In that case, the U.S. federal withholding tax discussed above will not apply if the non-U.S. holder provides a properly executed U.S. Internal Revenue Service Form W-8ECI (or other applicable form) in accordance with the applicable certification and disclosure requirements. In addition, a "branch profits tax" may be imposed at a 30% rate, or a lower rate under an applicable income tax treaty, on dividends received by a foreign corporation that are effectively connected with the conduct of a trade or business in the United States.
Gain on disposition of our common shares
A non-U.S. holder generally will not be taxed on any gain recognized on a disposition of our common shares unless:
- •
- the gain is effectively connected with the non-U.S. holder's conduct of a trade or business in the United States and, if required by an applicable income tax treaty, is attributable to a permanent establishment maintained by the non-U.S. holder in the United States; in these cases, the gain will be taxed on a net income basis at the regular graduated rates and in the manner applicable to United States persons (unless an applicable income tax treaty provides otherwise) and, if the
167
- •
- the non-U.S. holder is an individual who holds our common shares as a capital asset, is present in the United States for more than 182 days in the taxable year of the disposition and meets other requirements (in which case, except as otherwise provided by an applicable income tax treaty, the gain, which may be offset by U.S. source capital losses, generally will be subject to a flat 30% U.S. federal income tax, even though the non-U.S. holder is not considered a resident alien under the U.S. Internal Revenue Code); or
- •
- we are or have been a "U.S. real property holding corporation" for U.S. federal income tax purposes at any time during the shorter of the five-year period ending on the date of disposition or the period that the non-U.S. holder held our common shares.
non-U.S. holder is a foreign corporation, the "branch profits tax" described above may also apply;
Generally, a corporation is a "U.S. real property holding corporation" if the fair market value of its "U.S. real property interests" equals or exceeds 50% of the sum of the fair market value of its worldwide real property interests plus its other assets used or held for use in a trade or business. The tax relating to stock in a U.S. real property holding corporation generally will not apply to a non-U.S. holder whose holdings, direct and indirect, at all times during the applicable period, constituted 5% or less of our common shares, provided that our common shares were regularly traded on an established securities market. We believe that we are not currently, and we do not anticipate becoming in the future, a U.S. real property holding corporation.
Federal estate tax
Our common shares that are owned or treated as owned by an individual who is not a U.S. citizen or resident of the United States (as specially defined for U.S. federal estate tax purposes) at the time of death will be included in the individual's gross estate for U.S. federal estate tax purposes, unless an applicable estate tax or other treaty provides otherwise and, therefore, may be subject to U.S. federal estate tax.
Information reporting and backup withholding tax
Dividends paid to a non-U.S. holder may be subject to U.S. information reporting and backup withholding. A non-U.S. holder will be exempt from backup withholding if the non-U.S. holder provides a properly executed U.S. Internal Revenue Service Form W-8BEN or otherwise meets documentary evidence requirements for establishing its status as a non-U.S. holder or otherwise establishes an exemption.
The gross proceeds from the disposition of our common shares may be subject to U.S. information reporting and backup withholding. If a non-U.S. holder sells our common shares outside the United States through a non-U.S. office of a non-U.S. broker and the sales proceeds are paid to the non-U.S. holder outside the United States, then the U.S. backup withholding and information reporting requirements generally will not apply to that payment. However, U.S. information reporting, but not U.S. backup withholding, will apply to a payment of sales proceeds, even if that payment is made outside the United States, if a non-U.S. holder sells our common shares through a non-U.S. office of a broker that:
- •
- is a United States person;
- •
- derives 50% or more of its gross income in specific periods from the conduct of a trade or business in the United States;
- •
- is a "controlled foreign corporation" for United States federal income tax purposes; or
168
- •
- is a foreign partnership, if at any time during its tax year:
- •
- one or more of its partners are United States persons who in the aggregate hold more than 50% of the income or capital interests in the partnership; or
- •
- the foreign partnership is engaged in a United States trade or business,
unless the broker has documentary evidence in its files that the non-U.S. holder is not a United States person and certain other conditions are met or the non-U.S. holder otherwise establishes an exemption.
If a non-U.S. holder receives payments of the proceeds of a sale of our common shares to or through a U.S. office of a broker, the payment is subject to both U.S. backup withholding and information reporting unless the non-U.S. holder provides a properly executed U.S. Internal Revenue Service Form W-8BEN certifying that the non-U.S. Holder is not a "United States person" or the non-U.S. holder otherwise establishes an exemption.
A non-U.S. holder generally may obtain a refund of any amounts withheld under the backup withholding rules that exceed the non-U.S. holder's U.S. federal income tax liability by filing a refund claim with the U.S. Internal Revenue Service.
169
Under the terms and subject to the conditions contained in an underwriting agreement dated , 2006, we and the selling stockholders have agreed to sell to the underwriters named below, for whom Credit Suisse Securities (USA) LLC, J.P. Morgan Securities Inc. and Bear, Stearns & Co. Inc. are acting as representatives, the following respective numbers of shares of common stock:
| Underwriters | Number of shares | ||
|---|---|---|---|
| Credit Suisse Securities (USA) LLC | |||
| J.P. Morgan Securities Inc. | |||
| Bear, Stearns & Co. Inc. | |||
| Stephens Inc. | |||
| Keefe, Bruyette & Woods, Inc. | |||
| Total | 12,204,323 | ||
The underwriting agreement provides that if the underwriters take any of the shares presented in the table above, then they must take all of these shares. The underwriting agreement also provides that the obligations of the underwriters are subject to certain conditions precedent, including the absence of any material adverse change in our business and the receipt of certain certificates, opinions and letters from us, our counsel and our independent auditors. The underwriting agreement further provides that if an underwriter defaults the purchase commitments of non-defaulting underwriters may be increased in certain circumstances or the offering may be terminated.
The underwriters are offering the common stock, subject to the prior sale of shares, and when, as and if such shares are delivered to and accepted by them. The underwriters will initially offer to sell shares to the public at the initial public offering price shown on the front cover page of this prospectus. The underwriters may sell shares to securities dealers at a discount of up to $ per share from the initial public offering price. Any such securities dealers may resell shares to certain other brokers or dealers at a discount of up to $ per share from the initial public offering price. After the initial public offering, the underwriters may vary the public offering price and other selling terms.
If the underwriters sell more shares than the total number shown in the table above, the underwriters have the option to buy up to an additional 1,830,500 shares of common stock from us to cover such sales. They may exercise this option during the 30-day period from the date of this prospectus. If any shares are purchased with this option, the underwriters will purchase shares in approximately the same proportion as shown in the table above.
The underwriters propose to offer the shares of common stock initially at the public offering price on the cover page of this prospectus and to selling group members at that price less a selling concession of $ per share. The underwriters and selling group members may allow a discount of $ per share on sales to other broker/dealers. After the initial public offering the representatives may change the public offering price and the concession and discount to broker/dealers.
170
The following table shows the per share and total underwriting discounts that we and the selling stockholders will pay to the underwriters. These amounts are shown assuming both no exercise and full exercise of the underwriters' option to purchase additional shares.
| | Paid by Us | Paid by Selling Stockholders | |||||||||||
|---|---|---|---|---|---|---|---|---|---|---|---|---|---|
| | Without Over-allotment Exercise | With Over-allotment Exercise | Without Over-allotment Exercise | With Over-allotment Exercise | |||||||||
| Per share | $ | $ | $ | $ | |||||||||
| Total | $ | $ | $ | $ | |||||||||
In connection with the offering the underwriters may engage in stabilizing transactions, over-allotment transactions, syndicate covering transactions and penalty bids in accordance with Regulation M under the Securities Exchange Act of 1934, or the Exchange Act.
- •
- Stabilizing transactions permit bids to purchase the underlying security so long as the stabilizing bids do not exceed a specified maximum.
- •
- Over-allotment involves sales by the underwriters of shares in excess of the number of shares the underwriters are obligated to purchase, which creates a syndicate short position. The short position may be either a covered short position or a naked short position. In a covered short position, the number of shares over-allotted by the underwriters is not greater than the number of shares that they may purchase in the over-allotment option. In a naked short position, the number of shares involved is greater than the number of shares in the over-allotment option. The underwriters may close out any covered short position by either exercising their over-allotment option and/or purchasing shares in the open market.
- •
- Syndicate covering transactions involve purchases of the common stock in the open market after the distribution has been completed in order to cover syndicate short positions. In determining the source of shares to close out the short position, the underwriters will consider, among other things, the price of shares available for purchase in the open market as compared to the price at which they may purchase shares through the over-allotment option. If the underwriters sell more shares than could be covered by the over-allotment option—a naked short position—the position can only be closed out by buying shares in the open market. A naked short position is more likely to be created if the underwriters are concerned that there could be downward pressure on the price of the shares in the open market after pricing that could adversely affect investors who purchase in the offering.
- •
- Penalty bids permit the representatives to reclaim a selling concession from a syndicate member when the common stock originally sold by the syndicate member is purchased in a stabilizing or syndicate covering transaction to cover syndicate short positions.
These stabilizing transactions, syndicate covering transactions and penalty bids may have the effect of raising or maintaining the market price of our common stock or preventing or retarding a decline in the market price of the common stock. As a result the price of our common stock may be higher than the price that might otherwise exist in the open market. These transactions may be effected on the New York Stock Exchange or otherwise and, if commenced, may be discontinued at any time.
Each underwriter has represented, warranted and agreed that:
- •
- it has not offered and will not make an offer of the common stock to the public in the United Kingdom prior to the publication of a prospectus in relation to the common stock and the approval of the offer by the Financial Services Authority ("FSA") or, where appropriate, approval in another Member State and notification to the FSA, all in accordance with the Prospectus Directive, except that it may make an offer of the stock to persons who fall within
171
- •
- it has only communicated or caused to be communicated and will only communicate or cause to be communicated any invitation or inducement to engage in investment activity (within the meaning of Section 21 of the FSMA) received by it in connection with the issue or sale of any stock in circumstances in which Section 21(1) of the FSMA does not apply to us or to persons who have professional experience in matters relating to investments falling within Article 19(5) of the FSMA; and
- •
- it has complied and will comply with all applicable provisions of the FSMA with respect to anything done by it in relation to the stock in, from or otherwise involving the United Kingdom.
the definition of "qualified investor" as that term is defined in Section 86(1) of the Financial Services and Markets Act 2000 ("FSMA") or otherwise in circumstances which do not result in an offer of transferable securities to the public in the United Kingdom within the meaning of the FSMA;
We will not offer to sell any common stock to any member of the public in the Cayman Islands.
The common stock may not be offered or sold in Hong Kong, by means of any document, other than to persons whose ordinary business is to buy or sell stock or debentures, whether as principal or agent, or in circumstances which do not constitute an offer to the public within the meaning of the Companies Ordinance (Cap. 32) of Hong Kong. No advertisement, invitation or document relating to the common stock, whether in Hong Kong or elsewhere, may be issued, which is directed at, or the contents of which are likely to be accessed or read by, the public of Hong Kong (except if permitted to do so under the securities laws of Hong Kong) other than with respect to common stock which are or are intended to be disposed of only to persons outside Hong Kong or only to "professional investors" within the meaning of the Securities and Futures Ordinance (Cap. 571) of Hong Kong and any rules made thereunder.
The common stock have not been and will not be registered under the Securities and Exchange Law of Japan (Law No. 235 of 1948 as amended) (the "Securities Exchange Law") and disclosure under the Securities Exchange Law has not been and will not be made with respect to the common stock. Accordingly, the common stock may not be, directly or indirectly, offered or sold in Japan or to, or for the benefit of, any resident of Japan or to others for re-offering or re-sale, directly or indirectly in Japan or to, or for the benefit of, any resident of Japan except pursuant to an exemption from the registration requirements of, and otherwise in compliance with, the Securities Exchange Law and other relevant laws, regulations and ministerial guidelines of Japan. As used in this paragraph, "resident of Japan" means any person residing in Japan, including any corporation or other entity organized under the laws of Japan.
This prospectus has not been and will not be registered as a prospectus with the Monetary Authority of Singapore under the Securities and Futures Act (Cap. 289) of Singapore, or the Securities and Futures Act. Accordingly, the common stock may not be offered or sold or made the subject of an invitation for subscription or purchase nor may this prospectus or any other document or material in connection with the offer or sale, or invitation for subscription or purchase of such common stock be circulated or distributed, whether directly or indirectly, to the public or any members of the public in Singapore other than: (1) to an institutional investor or other person falling within Section 274 of the Securities and Futures Act, (2) to a sophisticated investor, and in accordance with the conditions specified in Section 275 of the Securities and Futures Act or (3) pursuant to, and in accordance with the conditions of any other applicable provision of the Securities and Futures Act.
In relation to each Member State of the European Economic Area which has implemented the Prospectus Directive (each, a Relevant Member State), and effective as of the date on which the Prospectus Directive is implemented in that Relevant Member State (the Relevant Implementation Date), no common stock have been offered to the public in that Relevant Member State prior to the
172
publication of a prospectus in relation to the common stock which has been approved by the competent authority in that Relevant Member State or, where appropriate, approved in another Relevant Member State and brought to the attention of the competent authority in that Relevant Member State, all in accordance with the Prospectus Directive. Notwithstanding the foregoing, an offer of common stock may be made effective as of the Relevant Implementation Date to the public in that Relevant Member State at any time:
(1) to legal entities which are authorized or regulated to operate in the financial markets or, if not so authorized or regulated, whose corporate purpose is solely to invest in securities;
(2) to any legal entity which has two or more of (a) an average of at least 250 employees during the last financial year; (b) a total balance sheet of more than €43,000,000 and (c) an annual net turnover of more than €50,000,000, as shown in its last annual or consolidated accounts; or
(3) in any other circumstances which do not require the publication by the issuer of a prospectus pursuant to Article 3 of the Prospectus Directive. For the purposes of this paragraph, the expression an "offer of common stock to the public" in relation to any common stock in any Relevant Member State means the communication in any form and by any means of sufficient information on the terms of the offer and the common stock to be offered so as to enable an investor to decide to purchase or subscribe the common stock, as the same may be varied in that Member State by any measure implementing the Prospectus Directive in that Member State and the expression Prospectus Directive means Directive 2003/71/EC and includes any relevant implementing measure in each Relevant Member State.
The common stock have not been registered under the Korean Securities and Exchange Law. Each of the underwriters has represented and agreed that it has not offered, sold or delivered and will not offer, sell or deliver, directly or indirectly, any common stock in Korea or to, or for the account or benefit of, any resident of Korea, except as otherwise permitted by applicable Korean laws and regulations; and any securities dealer to whom it sells common stock will agree that it will not offer any common stock, directly or indirectly, in Korea or to any resident of Korea, except as permitted by applicable Korean laws and regulations, or to any other dealer who does not so represent and agree.
No action may be taken in any jurisdiction other than the United States that would permit a public offering of the common stock or the possession, circulation or distribution of this prospectus in any jurisdiction where action for that purpose is required. Accordingly, the common stock may not be offered or sold, directly or indirectly, and neither the prospectus nor any other offering material or advertisements in connection with the common stock may be distributed or published in or from any country or jurisdiction except under circumstances that will result in compliance with any applicable rules and regulations of any such country or jurisdiction.
Bear, Stearns & Co. Inc. and Stephens Inc., both underwriters, may be deemed to be our affiliates. The offering therefore is being conducted with accordance with the applicable provisions of Rule 2720 of the National Association of Securities Dealers, Inc. Conduct Rules. Rule 2720 requires that the initial public offering price of the shares of common stock not be higher than that recommended by a "qualified independent underwriter" meeting certain standards. Accordingly, Credit Suisse Securities (USA) LLC is assuming the responsibilities of acting as the qualified independent underwriter in pricing the offering and conducting due diligence. The initial public offering price of the shares of common stock is no higher than the price recommended by Credit Suisse Securities (USA) LLC.
We and the selling stockholders have agreed to indemnify the underwriters and Credit Suisse Securities (USA) LLC in its capacity as Qualified Independent Underwriter against certain liabilities, including liabilities under the Securities Act, or contribute to payments that the underwriters may be required to make in that respect.
173
We have agreed that, during the period beginning from the date of this prospectus and continuing to and including the date 180 days after the date of this prospectus, we will not, directly or indirectly, offer, sell, offer to sell, pledge, contract to sell or otherwise dispose of any, or file with the Securities and Exchange Commission a registration statement under the Securities Act relating to, any shares of our common stock or securities convertible into or exchangeable or exercisable for any shares of our common stock, or publicly disclose the intention to make any offer, sale, pledge, disposition or filing, without the prior written consent of the representatives subject to certain exceptions, including shares issued pursuant to the exercise of options and up to 15% of our common stock at the time of issuance as consideration or partial consideration for acquisitions of businesses. However, in the event that either (1) during the last 17 days of the "lock-up" period, we release earning results or material news, or a material event relating to us occurs or (2) prior to the expiration of the "lock-up" period, we announce that we will release earnings results during the 16-day period beginning on the last day of the "lock-up" period, then in either case the expiration of the "lock-up" will be extended until the expiration of the 18-day period beginning on the date of the release of the earnings results or the occurrence of the material news or event, as applicable, unless the representatives waive, in writing, such an extension.
Our executive officers, directors and stockholders holding a majority of our shares of common stock have agreed that they will not offer, sell, contract to sell, pledge or otherwise dispose of, directly or indirectly, any shares of our common stock or securities convertible into or exchangeable or exercisable for any shares of our common stock, enter into a transaction that would have the same effect, or enter into any swap, hedge or other arrangement that transfers, in whole or in part, any of the economic consequences of ownership of our common stock, whether any of these transactions are to be settled by delivery of our common stock or other securities, in cash or otherwise, or publicly disclose the intention to make any offer, sale, pledge or disposition, or to enter into any transaction, swap, hedge or other arrangement, without, in each case, the prior written consent of the representatives for a period of 180 days after the date of this prospectus subject to certain exceptions, including certain bona fide gifts. However, in the event that either (1) during the last 17 days of the "lock-up" period, we release earnings results or material news, or a material event relating to us occurs or (2) prior to the expiration of the "lock-up" period, we announce that we will release earnings results during the 16-day period beginning on the last day of the "lock-up" period, then in either case the expiration of the "lock-up" will be extended until the expiration of the 18-day period beginning on the date of the release of the earnings results or the occurrence of the material news or event, as applicable, unless the representatives waive, in writing, such an extension.
The underwriters have informed us that they do not intend sales to discretionary accounts to exceed five percent of the total number of shares of our common stock offered by them and that no sales to discretionary accounts may be made without prior written approval of the customer.
Our common stock has been approved for listing on the NYSE under the symbol "ACA," subject to official notice of issuance. The underwriters intend to sell our common stock to a minimum of 2,000 beneficial owners in lots of 100 or more so as to meet the distribution requirements of this listing.
We will pay all of the expenses of the offering, including those of the selling stockholders (other than underwriting discounts and commissions relating to the shares sold by the selling stockholders). We estimate that the total expenses of the offering, including the underwriting discounts, will be approximately $11.7 million.
There has been no public market for our common stock prior to this offering. We, the selling stockholders and the underwriters will negotiate the initial public offering price. In determining the initial public offering price, we, the selling stockholders and the underwriters expect to consider a number of factors in addition to prevailing market conditions, including:
- •
- the history of and prospects for our industry and companies engaged in activities similar to ours;
174
- •
- an assessment of our management;
- •
- our present operations;
- •
- our historical results of operations;
- •
- the trend of our revenues and earnings; and
- •
- our earnings prospects.
A prospectus in electronic format may be made available on the web sites maintained by one or more of the underwriters, or selling group members, if any, participating in this offering and one or more of the underwriters participating in this offering may distribute prospectuses electronically. The representatives may agree to allocate a number of shares to underwriters and selling group members for sale to their online brokerage account holders. Internet distributions will be allocated by the underwriters and selling group members that will make internet distributions on the same basis as other allocations.
We and the underwriters will consider these and other relevant factors in relation to the price of similar securities of generally comparable companies. Neither we nor the underwriters can assure investors that an active trading market will develop for the common stock, or that the common stock will trade in the public market at or above the initial public offering price.
In the ordinary course, the underwriters and their affiliates have provided, and may in the future provide, investment banking, commercial banking, investment management, or other financial services to us and our affiliates for which they have received compensation and may receive compensation in the future. We engaged Credit Suisse Securities (USA) LLC in the origination of one of our CDOs for which it received customary financing costs and placement fees. In May 2006, we entered into a credit agreement in which Credit Suisse, Cayman Islands Branch, an affiliate of Credit Suisse Securities (USA) LLC, is a lender and will earn customary fees. See "Management's Discussion and Analysis of Financial Condition and Results of Operations—Liquidity and Capital Resources—Indebtedess—Credit Facility." We have entered into insured credit swap transactions with J.P. Morgan Securities Inc. in which, in exchange for payments of customary fees, we provide loss protection on referenced pools of securities. J.P. Morgan also has a prime brokerage arrangement with our credit opportunity fund and a J.P. Morgan affiliate acts as trustee on certain of our CDO transactions. J.P. Morgan Securities Inc. also acted as the placement agent for an equity capital financing by us in 2004 and is currently the lead syndicate bank for our unsecured and unfunded credit facility. In addition, an affiliate of J.P. Morgan Securities Inc. is an investment manager of our investment portfolio, for which services it receives customary annual investment management fees. Keefe, Bruyette & Woods, Inc. acted as placement agent for four of our trust preferred issues, for which services it received customary fees. For a description of our transactions with Bear, Stearns & Co. Inc., and Stephens Inc., and their respective affiliates, see "Certain Relationships and Related Party Transactions." As of the date of this prospectus, affiliates of both Bear, Stearns & Co. Inc. and Stephens Inc. were among our stockholders and both have representatives on our Board of Directors. See "Description of Capital Stock—Stockholders Agreement."
175
Certain matters as to U.S. law in connection with this offering will be passed upon for us by Fried, Frank, Harris, Shriver & Jacobson LLP, New York, New York. Certain legal matters in connection with this offering will be passed upon for the underwriters by Davis Polk & Wardwell, New York, New York.
The consolidated financial statements as of and for the years ended December 31, 2004 and 2005 included in this Prospectus have been audited by Deloitte & Touche LLP, an independent registered public accounting firm, as stated in their report appearing herein and elsewhere in the Registration Statement, and are included in reliance upon the report of such firm given upon their authority as experts in accounting and auditing.
The consolidated financial statements for the year ended December 31, 2003 included in this Prospectus have been so included in reliance on the reports of PricewaterhouseCoopers LLP, an independent registered public accounting firm, given on the authority of said firm as experts in auditing and accounting.
CHANGE IN INDEPENDENT REGISTERED PUBLIC ACCOUNTING FIRM
On August 27, 2004, PricewaterhouseCoopers LLP, or PwC, issued their report dated August 20, 2004 on our financial statements for the year ended December 31, 2003 and resigned as our independent registered public accounting firm. On September 29, 2004, our Board of Directors appointed Deloitte & Touche LLP as our independent registered public accounting firm.
During the year ended December 31, 2003 and through August 27, 2004, there were no disagreements with PwC on any matter of accounting principles or practices, financial statement disclosure or auditing scope or procedure, which disagreements, if not resolved to PwC's satisfaction, would have caused them to make reference thereto in their report on the financial statements for such years.
During the year ended December 31, 2003 and through August 27, 2004, there were no reportable events pursuant to Item 304(a)(1)(v) of Regulation S-K.
The report of PwC on the financial statements for the year ended December 31, 2003 contained no adverse opinion or disclaimer of opinion and was not qualified or modified as to uncertainty, audit scope or accounting principle.
We did not consult with Deloitte & Touche LLP on any accounting or financial reporting matters in the periods prior to their appointment.
We requested PricewaterhouseCoopers LLP to furnish a letter addressed to the Securities and Exchange Commission, stating whether it agrees with these statements and, if not, stating the respects in which it does not agree. A copy of this letter, dated as of May 9, 2006, is filed as Exhibit 16.1 to the Form S-1 registration statement of which this prospectus forms a part.
WHERE YOU CAN FIND ADDITIONAL INFORMATION
We have filed with the SEC a registration statement on Form S-1 under the Securities Act registering the common stock to be sold in this offering. As permitted by the rules and regulations of the SEC, this prospectus does not contain all of the information included in the registration statement and the exhibits and schedules filed as a part of the registration statement. For further information concerning us and the common stock to be sold in this offering, you should refer to the registration statement and to the exhibits and schedules filed as part of the registration statement. Statements contained in this prospectus regarding the contents of any agreement or other document filed as an
176
exhibit to the registration statement are not necessarily complete, and in each instance reference is made to the copy of the agreement filed as an exhibit to the registration statement and each statement being qualified by this reference. The registration statement, including the exhibits and schedules filed as a part of the registration statement, may be inspected at the public reference facility maintained by the SEC at its public reference room at 100 F Street, NE, Washington, DC 20549 and copies of all or any part thereof may be obtained from that office upon payment of the prescribed fees. You may call the SEC at 1-800-SEC-0330 for further information on the operation of the public reference room and you can request copies of the documents, upon payment of a duplicating fee, by writing to the SEC. In addition, the SEC maintains a web site at http://www.sec.gov that contains reports, proxy and information statements and other information regarding registrants, including us, that file electronically with the SEC.
177
ACA CAPITAL HOLDINGS, INC. AND SUBSIDIARIES
INDEX TO CONSOLIDATED FINANCIAL STATEMENTS
| | Page | ||
|---|---|---|---|
| Unaudited Consolidated Financial Statements as of June 30, 2006 and December 31, 2005 and for the Six Months Ended June 30, 2006 and 2005: | |||
Balance Sheets | F-2 | ||
Statements of Operations | F-3 | ||
Statements of Stockholders' Equity | F-4 | ||
Statements of Cash Flows | F-5 | ||
Notes to Unaudited Consolidated Financial Statements | F-6 | ||
Report of Independent Registered Public Accounting Firm | F-23 | ||
Report of Independent Registered Public Accounting Firm | F-24 | ||
Consolidated Financial Statements as of December 31, 2005 and 2004 and for the Years Ended December 31, 2005, 2004 and 2003: | |||
Balance Sheets | F-25 | ||
Statements of Operations | F-26 | ||
Statements of Stockholders' Equity (as restated, see Note 2) | F-27 | ||
Statements of Cash Flows | F-28 | ||
Notes to Consolidated Financial Statements | F-29 | ||
F-1
ACA CAPITAL HOLDINGS, INC. AND SUBSIDIARIES
CONSOLIDATED BALANCE SHEETS (UNAUDITED)
AS OF JUNE 30, 2006 AND DECEMBER 31, 2005
(Dollars in thousands)
| | June 30, 2006 | December 31, 2005 | |||||||
|---|---|---|---|---|---|---|---|---|---|
| ASSETS | |||||||||
| Fixed-maturity securities available for sale—at fair value, amortized cost of $5,186,811 and $5,292,081, respectively | $ | 5,189,249 | $ | 5,298,739 | |||||
| Fixed-maturity securities trading—at fair value, amortized cost of $3,468 and $0, respectively | 3,448 | — | |||||||
Guaranteed investment contract | 119,340 | 119,340 | |||||||
| Total investments | 5,312,037 | 5,418,079 | |||||||
Cash: | |||||||||
| Cash and cash equivalents | 222,705 | 174,420 | |||||||
| Restricted cash | 54,066 | 50,185 | |||||||
| Total cash | 276,771 | 224,605 | |||||||
| Accrued investment income | 19,310 | 17,258 | |||||||
| Derivative assets | 16,868 | 15,250 | |||||||
| Deferred policy acquisition costs, net | 48,075 | 47,414 | |||||||
| Deferred debt issuance costs, net | 37,432 | 40,843 | |||||||
| Prepaid reinsurance premiums | 619 | 848 | |||||||
| Other assets | 34,391 | 27,903 | |||||||
| TOTAL | $ | 5,745,503 | $ | 5,792,200 | |||||
| LIABILITIES AND MINORITY INTEREST AND STOCKHOLDERS' EQUITY | |||||||||
| LIABILITIES | |||||||||
| Unearned premiums | $ | 194,486 | $ | 187,743 | |||||
| Reserve for losses and loss adjustment expenses | 37,244 | 34,306 | |||||||
| Short-term debt | 2,674,305 | 2,674,698 | |||||||
| Long-term debt | 2,182,143 | 2,254,650 | |||||||
| Related party debt | 100,000 | 100,000 | |||||||
| Derivative liabilities | 31,628 | 46,534 | |||||||
| Accrued interest payable | 15,979 | 15,347 | |||||||
| Accrued expenses and other liabilities | 29,687 | 32,277 | |||||||
| Payable for securities purchased | 19,463 | 30,138 | |||||||
| Current income tax payable | 3,387 | 3,044 | |||||||
| Deferred income taxes | 11,336 | 6,909 | |||||||
| Total liabilities | 5,299,658 | 5,385,646 | |||||||
MINORITY INTEREST | 33,129 | 22,241 | |||||||
COMMITMENTS AND CONTINGENCIES | |||||||||
STOCKHOLDERS' EQUITY: | |||||||||
| Senior convertible preferred stock—220 shares authorized, 154 shares and 129 shares issued and outstanding at June 30, 2006 and December 31, 2005 | 9,296 | 7,339 | |||||||
| Convertible preferred stock—1,500 shares authorized, 959 shares issued and outstanding at June 30, 2006 and December 31, 2005 | 54,858 | 54,858 | |||||||
| Series B senior convertible preferred stock—3,000,000 shares authorized, 2,785,769 shares issued and outstanding at June 30, 2006 and December 31, 2005 | 164,263 | 164,263 | |||||||
| Common stock of 100,000,000 shares authorized at June 30, 2006 and 12,000,000 shares authorized at December 31, 2005; 7,106,490 and 6,442,950 shares issued and outstanding at June 30, 2006 and December 31, 2005; par value of $0.10 | 710 | 644 | |||||||
| Gross paid-in and contributed capital | 133,558 | 125,184 | |||||||
| Treasury stock at cost—851,847 shares and 351,876 shares at June 30, 2006 and December 31, 2005 | (12,088 | ) | (5,500 | ) | |||||
| Notes receivable from stockholders | (3,121 | ) | (1,355 | ) | |||||
| Deferred compensation | (1,450 | ) | (2,030 | ) | |||||
| Accumulated other comprehensive income—net of deferred income tax of $6,828 and $5,369 at June 30, 2006 and December 31, 2005, respectively | 12,680 | 11,132 | |||||||
| Retained earnings | 54,010 | 29,778 | |||||||
| Total stockholders' equity | 412,716 | 384,313 | |||||||
| TOTAL | $ | 5,745,503 | $ | 5,792,200 | |||||
See notes to unaudited consolidated financial statements.
F-2
ACA CAPITAL HOLDINGS, INC. AND SUBSIDIARIES
CONSOLIDATED STATEMENTS OF OPERATIONS (UNAUDITED)
FOR THE SIX MONTHS ENDED JUNE 30, 2006 AND 2005
(Dollars and shares in thousands, except per share amounts)
| | 2006 | 2005 | |||||||
|---|---|---|---|---|---|---|---|---|---|
| REVENUES: | |||||||||
| Gross premiums written | $ | 20,515 | $ | 17,805 | |||||
| Less premiums ceded | (186 | ) | 766 | ||||||
| Net premiums written | 20,329 | 18,571 | |||||||
| Increase in unearned premium reserve — net | (6,972 | ) | (2,350 | ) | |||||
| Premiums earned | 13,357 | 16,221 | |||||||
| Net insured credit swap revenue | 22,111 | 4,543 | |||||||
| Net investment income | 160,164 | 114,474 | |||||||
| Net realized and unrealized losses on investments | (3,223 | ) | (1,223 | ) | |||||
| Net realized and unrealized gains on derivative instruments | 6,139 | 4,040 | |||||||
| Other net credit swap revenue | 5,544 | 2,524 | |||||||
| Fee income | 11,073 | 4,366 | |||||||
| Other income | 104 | 295 | |||||||
| Total revenues | 215,269 | 145,240 | |||||||
EXPENSES: | |||||||||
| Loss and loss adjustment expenses | 3,682 | 4,139 | |||||||
| Policy acquisition costs | 4,160 | 3,984 | |||||||
| Other operating expenses | 23,294 | 14,669 | |||||||
| Interest expense | 137,383 | 95,504 | |||||||
| Depreciation and amortization | 4,717 | 4,064 | |||||||
| Total expenses | 173,236 | 122,360 | |||||||
| Income of minority interest | (2,229 | ) | (1,685 | ) | |||||
| Income before income taxes | 39,804 | 21,195 | |||||||
| Provision for income tax expense | 13,615 | 8,078 | |||||||
| Net income | $ | 26,189 | $ | 13,117 | |||||
| Share and Per Share Data: | |||||||||
| Earnings per share | |||||||||
| Basic | $ | 1.15 | $ | 0.58 | |||||
| Diluted | $ | 0.87 | $ | 0.44 | |||||
| Weighted average shares outstanding | |||||||||
| Basic | 22,830 | 22,698 | |||||||
| Diluted | 29,846 | 29,682 | |||||||
See notes to unaudited consolidated financial statements.
F-3
ACA CAPITAL HOLDINGS, INC. AND SUBSIDIARIES
CONSOLIDATED STATEMENTS OF STOCKHOLDERS' EQUITY
FOR THE SIX MONTHS ENDED JUNE 30, 2006 (UNAUDITED)
(Dollars in thousands, except for share amounts)
| | Preferred Stock | Common Stock | | | | | | | | ||||||||||||||||||||||||
|---|---|---|---|---|---|---|---|---|---|---|---|---|---|---|---|---|---|---|---|---|---|---|---|---|---|---|---|---|---|---|---|---|---|
| | Gross Paid in and Contributed Capital | | Notes Receivable from Stockholders | | Accumulated Other Comprehensive Income | | | ||||||||||||||||||||||||||
| | Shares | Amount | Shares | Par Value | Treasury Stock | Deferred Compensation | Retained Earnings | Total Stockholders' Equity | |||||||||||||||||||||||||
| BALANCE—January 1, 2006 | 2,786,882 | $ | 226,460 | 6,442,950 | $ | 644 | $ | 125,184 | $ | (5,500 | ) | $ | (1,355 | ) | $ | (2,030 | ) | $ | 11,132 | $ | 29,778 | $ | 384,313 | ||||||||||
| Comprehensive income: | |||||||||||||||||||||||||||||||||
| Net income | — | — | — | — | — | — | — | — | — | 26,189 | 26,189 | ||||||||||||||||||||||
| Change in unrealized gain on investments, net of change in deferred income tax of $(1,528) | — | — | — | — | — | — | — | — | (3,999 | ) | — | (3,999 | ) | ||||||||||||||||||||
| Gain in derivative hedges, net of change in deferred income tax of $2,987 | — | — | — | — | — | — | — | — | 5,547 | — | 5,547 | ||||||||||||||||||||||
| Total comprehensive income | — | — | — | — | — | — | — | — | — | — | 27,737 | ||||||||||||||||||||||
| Vesting of Series B senior conv. prf stock to CEO | — | — | — | — | — | — | — | 580 | — | — | 580 | ||||||||||||||||||||||
| Exercise of stock options by former executives | — | — | 663,540 | 66 | 8,024 | — | — | — | — | — | 8,090 | ||||||||||||||||||||||
| Common stock purchased from former executive | — | — | — | — | — | (6,588 | ) | — | — | — | — | (6,588 | ) | ||||||||||||||||||||
| Stock based compensation expense | — | — | — | — | 350 | — | — | — | — | — | 350 | ||||||||||||||||||||||
| Issuance of note receivable from stockholder | — | — | — | — | — | — | (2,262 | ) | — | — | — | (2,262 | ) | ||||||||||||||||||||
| Discharge of note receivable from stockholders | — | — | — | — | — | — | 496 | — | — | — | 496 | ||||||||||||||||||||||
| Senior convertible preferred stock dividend | 25 | 1,957 | — | — | — | — | — | — | — | (1,957 | ) | — | |||||||||||||||||||||
| BALANCE—June 30, 2006 | 2,786,907 | $ | 228,417 | 7,106,490 | $ | 710 | $ | 133,558 | $ | (12,088 | ) | $ | (3,121 | ) | $ | (1,450 | ) | $ | 12,680 | $ | 54,010 | $ | 412,716 | ||||||||||
See notes to unaudited consolidated financial statements.
F-4
ACA CAPITAL HOLDINGS, INC. AND SUBSIDIARIES
CONSOLIDATED STATEMENTS OF CASH FLOWS (UNAUDITED)
FOR THE SIX MONTHS ENDED JUNE 30, 2006 and 2005
(Dollars in thousands)
| | 2006 | 2005 | |||||||
|---|---|---|---|---|---|---|---|---|---|
| CASH FLOWS FROM OPERATING ACTIVITIES: | |||||||||
| Net income | $ | 26,189 | $ | 13,117 | |||||
| Adjustments to reconcile net income to net cash provided by operating activities | |||||||||
| Depreciation and amortization | 4,717 | 4,064 | |||||||
| Accrual of discount and amortization of premium on investment — net | (208 | ) | 176 | ||||||
| Income of minority interest | 2,229 | 1,685 | |||||||
| Net realized losses on fixed maturity securities available for sale | 3,203 | 1,223 | |||||||
| Net unrealized losses on fixed maturity securities trading | 20 | — | |||||||
| Net realized and unrealized (gains) losses on net insured credit swaps | (829 | ) | 5,922 | ||||||
| Net unrealized (gains) losses on derivative instruments | (6,139 | ) | (4,040 | ) | |||||
| Net unrealized (gains) losses on other net credit swap revenue | (291 | ) | 1,006 | ||||||
| Share based compensation | 350 | — | |||||||
| Discharge of note receivable from stockholders | 496 | 264 | |||||||
| Deferred compensation | 580 | 580 | |||||||
Changes in assets and liabilities: | |||||||||
| Income taxes payable | 343 | 9,031 | |||||||
| Deferred income tax expense | 2,967 | (1,318 | ) | ||||||
| Prepaid reinsurance premiums | 228 | 887 | |||||||
| Payable and accrued expenses | (2,591 | ) | (6,268 | ) | |||||
| Deferred policy acquisition costs | (661 | ) | 187 | ||||||
| Unearned premium reserve | 6,743 | 2,350 | |||||||
| Derivative liabilities | (1,905 | ) | 10,038 | ||||||
| Loss and loss adjustment expenses | 2,938 | (8,884 | ) | ||||||
| Interest payable | 632 | 1,402 | |||||||
| Accrued investment income | (2,052 | ) | (2,234 | ) | |||||
| Other | 1,272 | 2,725 | |||||||
| Net cash provided by operating activities | 38,231 | 31,913 | |||||||
| CASH FLOWS FROM INVESTING ACTIVITIES: | |||||||||
| Net (deposit) release of restricted cash | (3,881 | ) | 30,073 | ||||||
| Purchases of fixed-maturity securities | (516,124 | ) | (699,979 | ) | |||||
| Purchases of fixed-maturity securities trading | (3,458 | ) | — | ||||||
| Proceeds from sales of fixed-maturity securities | 83,662 | 122,757 | |||||||
| Proceeds from maturities of fixed-maturity securities | 524,052 | 363,006 | |||||||
| Net purchase of property and equipment | (230 | ) | (223 | ) | |||||
| Net cash provided by (used in) investing activities | 84,021 | (184,366 | ) | ||||||
| CASH FLOWS FROM FINANCING ACTIVITIES: | |||||||||
| Paydown on long-term debt | (72,507 | ) | (21,057 | ) | |||||
| Proceeds from issuance of commercial paper — net | (393 | ) | 195,474 | ||||||
| Payment of issuance costs for debt | (308 | ) | (1,783 | ) | |||||
| Proceeds from issuance of preferred stock-net of issuance costs | — | 311 | |||||||
| Purchase of treasury stock | (759 | ) | (74 | ) | |||||
| Net cash (used in) provided by financing activities | (73,967 | ) | 172,871 | ||||||
| NET INCREASE IN CASH AND CASH EQUIVALENTS | 48,285 | 20,418 | |||||||
| CASH AND CASH EQUIVALENTS — beginning of period | 174,420 | 228,927 | |||||||
| CASH AND CASH EQUIVALENTS — end of period | $ | 222,705 | $ | 249,345 | |||||
| SUPPLEMENTAL CASH FLOW DISCLOSURES: | |||||||||
| Federal and local income taxes paid | $ | 11,049 | $ | 1,575 | |||||
| Interest paid | $ | 136,752 | $ | 94,101 | |||||
| SUPPLEMENTAL DISLOSURE OF NON-CASH FINANCING ACTIVITIES: | |||||||||
| Common stock acquired in exchange for note receivable | $ | 2,262 | $ | — | |||||
See notes to unaudited consolidated financial statements.
F-5
ACA CAPITAL HOLDINGS, INC. AND SUBSIDIARIES
NOTES TO UNAUDITED CONSOLIDATED FINANCIAL STATEMENTS
JUNE 30, 2006
1. BUSINESS, ORGANIZATION AND OPERATIONS
ACA Capital Holdings, Inc ("ACA Capital"), a Delaware domiciled holding company, is engaged in providing financial guaranty insurance products to participants in the global credit derivatives markets, structured finance capital markets and municipal finance capital markets, as well as providing asset managements services. The Company's principal activities include financial guaranty insurance of municipal and non-municipal debt obligations, structured credit risk assumption through credit derivatives and collateralized debt obligation asset management. ACA Capital conducts its business through four wholly-owned subsidiaries (collectively, the "Company"). Its financial guaranty business is conducted through ACA Financial Guaranty Corporation ("ACA FG"), a Maryland domiciled insurance company. ACA FG is licensed to conduct insurance business, which provides credit enhancement on municipal and other public finance obligations, in 50 states, the District of Columbia, Guam, the U.S. Virgin Islands and Puerto Rico. Standard & Poor's Corporation Services has assigned a financial strength rating of "A" to ACA FG. ACA FG also provides the credit support for the Company's structured credit business activities. Through ACA Service LLC, ACA Risk Solutions, LLC and ACA Management, LLC, the Company conducts its collateralized debt obligation asset management business. This business encompasses the origination (in partnership with investment banks), structuring and management of collateralized debt obligations (including collateralized loan obligations and other similarly securitized asset classes, collectively "CDOs").
The Company defines its business as being composed of three distinct continuing lines of business or segments. They are Municipal Finance, Structured Credit and CDO Asset Management. A fourth line of business, Other, includes business in areas and markets in which the Company is no longer active. Although the Municipal Finance and Structured Credit businesses are reported in separate segments, together they form the Company's financial guaranty business. Municipal Finance provides financial guaranty insurance policies guaranteeing the timely payment of scheduled principal and interest on municipal debt obligations. Structured Credit structures and sells credit protection, principally in the form of insured credit swaps ("CDS"), against a variety of asset classes in the institutional fixed income markets. CDO Asset Management focuses on CDO origination, structuring and management. The Company will at times assume risk in the CDOs it manages through investment in some portion of the capital structure.
ACA Capital was originally incorporated in Delaware on January 3, 1997. On November 22, 2002, ACA Capital changed its jurisdiction of incorporation from Delaware to Bermuda. During 2004, the Board of Directors determined that re-domesticating to Delaware would eliminate certain adverse consequences of remaining in Bermuda, facilitate ACA Capital's access to U.S. capital markets, simplify its tax filings, accounting and operation, and reduce the costs of compliance with two sets of filing obligations and laws (as ACA Capital stockholders are U.S. entities and individuals). On September 15, 2004, therefore, ACA Capital re-domesticated from Bermuda to Delaware through a process called a "discontinuation" under Bermuda law and a "domestication" under Delaware law. As a result, it became a Delaware domiciled holding company and changed its name from American Capital Access Holdings, Ltd. to its current name.
2. SUMMARY OF SIGNIFICANT ACCOUNTING POLICIES
Basis of Presentation—These interim unaudited consolidated financial statements have been prepared in accordance with accounting principles generally accepted in the United States of America,
F-6
or U.S. GAAP, and include all adjustments, consisting only of normal recurring adjustments, that we consider necessary for the fair presentation of our financial position and results of operations for these periods. The preparation of financial statements in conformity with U.S. GAAP requires management to make estimates and assumptions that affect the reported amounts of assets and liabilities and disclosure of contingent assets and liabilities at the date of the financial statements and the reported amounts of revenues and expenses during the reporting periods. Actual results could differ from those estimates. Operating results for the six months ended June 30, 2006 and 2005 are not necessarily indicative of the results that may be expected for a full year. Certain prior year items have been reclassified to conform to the current year presentation. These unaudited interim consolidated financial statements should be read in conjunction with the Company's audited consolidated financial statements as of December 31, 2005 and 2004 and the years ended December 31, 2005, 2004 and 2003.
In August 2006, the Company's Board of Directors authorized a dividend of stock in order to effect a six-for-one stock split. All prior share and per share amounts have been restated to reflect the stock split.
Reclassifications
Certain prior year items have been reclassified to conform to the current year presentation.
As part of its financial guaranty insurance business, the Company selects, structures and sells credit protection through insured credit swaps in the institutional fixed income markets. The Company generates revenues through the premiums paid by third parties to insure against the risk of default on the assets underlying the credit swaps. In the accompanying consolidated financial statements, the Company has reclassified the credit swap premiums and the related changes in the unearned premium reserve from "Gross premiums written" and "Increase in unearned premium reserve—net" to "Net insured credit swap revenue." The related realized and unrealized gains and losses on insured credit swaps, previously recognized in "Net realized and unrealized gains (losses) on derivative instruments," have also been reclassified to "Net insured credit swap revenue." Management's decision to reclassify these amounts was based on a change in the Company's mix of Structured Credit business from traditional financial guaranty business issued in the form of insurance policies to insured credit swaps. Management also believes that this reclassification will increase comparability of its financial statements with other companies whose primary business is as a participant in the CDS market, particularly as it relates to the Company's Structured Credit line of business.
In certain circumstances, the Company receives premiums on insured credit swap transactions on an upfront basis. Whereas the Company previously recognized premiums received on an upfront basis as "Unearned premiums," such amounts have been reclassified to "Derivative liabilities."
Additionally, in order to be consistent with the Company's reclassification on insured credit swaps, fees earned in connection with uninsured credit swaps of the Company's CDO Asset Management business and the related realized and unrealized gains (losses) in the Company's consolidated financial statements have been reclassified from "Derivative income" and "Net realized and unrealized gains (losses) on derivative instruments," respectively, to "Other net credit swap revenue" in the consolidated statements of operations.
F-7
The effects of these reclassifications on the Company's consolidated balance sheets as of June 30, 2006 and 2005 and related statements of operations and cash flows for the six months ended June 30, 2006 and 2005 are as follows (dollars in thousands):
| | As of June 30, 2006 | As of December 31, 2005 | ||||||||||
|---|---|---|---|---|---|---|---|---|---|---|---|---|
| | As previously reported | As reclassified | As previously reported | As reclassified | ||||||||
| ASSETS: | ||||||||||||
| Other assets | $ | 42,939 | $ | 34,391 | $ | 33,894 | �� | $ | 27,903 | |||
| Total assets | $ | 5,754,052 | $ | 5,745,503 | $ | 5,798,191 | $ | 5,792,200 | ||||
LIABILITIES AND STOCKHOLDERS' EQUITY | ||||||||||||
| Unearned premiums | $ | 218,750 | $ | 194,486 | $ | 211,353 | $ | 187,743 | ||||
| Derivative liabilities | 15,913 | 31,628 | 28,915 | 46,534 | ||||||||
| Total liabilities | 5,308,207 | 5,299,658 | 5,391,637 | 5,385,646 | ||||||||
| Total liabilities and stockholders' equity: | $ | 5,754,052 | $ | 5,745,503 | $ | 5,798,191 | $ | 5,792,200 | ||||
| | Six Months Ended June 30, 2006 | Six Months Ended June 30, 2005 | |||||||||||
|---|---|---|---|---|---|---|---|---|---|---|---|---|---|
| | As previously reported | As reclassified | As previously reported | As reclassified | |||||||||
| Net premiums written | $ | 40,833 | $ | 20,329 | $ | 39,963 | $ | 18,571 | |||||
| Increase in unearned premium reserve, net | (6,194 | ) | (6,972 | ) | (13,276 | ) | (2,350 | ) | |||||
| Premiums earned | 34,639 | 13,357 | 26,687 | 16,221 | |||||||||
| Net realized and unrealized gains (losses) on derivatives | 7,259 | 6,139 | (2,888 | ) | 4,040 | ||||||||
| Derivative income | 5,253 | — | 3,530 | — | |||||||||
| Net insured credit swap revenue | — | 22,111 | — | 4,543 | |||||||||
| Other net credit swap revenue | — | 5,544 | — | 2,524 | |||||||||
| | Six Months Ended June 30, 2006 | Six Months Ended June 30, 2005 | ||||||||||
|---|---|---|---|---|---|---|---|---|---|---|---|---|
| | As previously reported | As reclassified | As previously reported | As reclassified | ||||||||
| CASH FLOWS FROM OPERATING ACTIVITIES: | ||||||||||||
| Unearned premium reserve | $ | 7,397 | $ | 6,743 | $ | 12,388 | $ | 2,350 | ||||
| Derivative liabilities | 0 | (1,905 | ) | 0 | 10,038 | |||||||
| Other | (1,287 | ) | 1,272 | 2,725 | 2,725 | |||||||
| Net cash provided by operating activities | 38,231 | 38,231 | 31,913 | 31,913 | ||||||||
These adjustments had no impact on net income, earnings per share, cash flows or total stockholders' equity.
F-8
3. RELEVANT RECENT ACCOUNTING PRONOUNCEMENTS
In December 2004, the Financial Accounting Standard Board ("FASB") issued FAS 123(R), "Shared-Based Payments." FAS 123(R) is a revision of FAS 123, "Accounting for Stock Based Compensation" and supersedes Accounting Principles Board ("APB") Opinion No. 25, "Accounting for Stock Issued to Employees." FAS 123(R) requires the Company to expense the fair value of employee stock options and other forms of stock based compensation. Effective January 1, 2006, the Company adopted the requirements of FAS 123(R) using the prospective application as permitted by FAS 123(R), accordingly prior period amounts have not been restated. Under this application, the Company is required to record compensation expense for all awards granted after the date of adoption. Awards granted prior to the date of adoption of FAS 123(R) continue to be accounted for under APB 25, the Company's prior accounting method for stock based compensation. For the six months ended June 30, 2006, the Company recognized compensation expense under FAS 123(R) of $0.4 million.
In May 2005, the FASB issued FAS 154, "Accounting Changes and Error Corrections." This pronouncement changes the requirements for the accounting and reporting of a change in accounting principle. This statement applies to all voluntary changes in accounting principle as well as to changes required by an accounting pronouncement that does not include specific transition provisions. This statement eliminates the requirement in APB No. 20, "Accounting Changes," to include the cumulative effect of changes in accounting principle in the statement of operations in the period of change. Instead, to enhance the comparability of prior period financial statements, FAS 154 requires that changes in accounting principle be retroactively applied, with the cumulative effect of the accounting principle reflected as an asset or liability and an offsetting adjustment to retained earnings in the first period presented as if that accounting principle had always been used. Each subsequent period presented is then adjusted to reflect the period specific effects of applying the change. The implementation of this statement did not have a material impact on the Company's financial statements.
In November 2005, the FASB released Staff Position Nos. FAS 115-1 and FAS 124-1, "The Meaning of Other-Than-Temporary Impairment and Its Application to Certain Investments." This pronouncement addresses the determination as to when an investment is considered impaired, whether that impairment is other than temporary, and the measurement of an impairment loss. It also includes accounting considerations subsequent to the recognition of an other-than-temporary impairment and requires certain disclosures about unrealized losses that have not been recognized as other-than-temporary impairments. The implementation of this pronouncement is not expected to have a material impact on the Company's financial statements.
In September 2005, the AICPA issued Statement of Position ("SOP") 05-1, "Accounting by Insurance Enterprises for Deferred Acquisition Costs in Connection with Modifications or Exchanges of Insurance Contracts." SOP 05-1 provides guidance on accounting by insurance enterprises for deferred acquisition costs on internal replacements of many types of insurance and investment contracts, including those covered by FAS No. 60. Contract modifications meeting all of the conditions set out in SOP 05-1 result in a replacement contract that is substantially unchanged from the replaced contract and a contract that is accounted for as a continuation of the replaced contract. The modifications would otherwise trigger accounting as if the original contract was extinguished and replaced by a new contract, with unamortized deferred acquisition costs, unearned revenue liabilities and deferred sales inducements associated with the original contract recognized currently in income. The implementation
F-9
of this pronouncement is not expected to have a material impact on the Company's financial statements.
In February 2006, the FASB issued FAS 155, "Accounting for Certain Hybrid Financial Instruments," an amendment of FAS 133 and 140. FAS 155 (i) permits fair value remeasurement for any hybrid financial instrument that contains an embedded derivative that otherwise would require bifurcation, (ii) clarifies which interest-only strips and principal-only strips are not subject to the requirements of FAS 133, (iii) clarifies that concentrations of credit risk in the form of subordination are not embedded derivatives and, (iv) amends FAS 140 to eliminate the exemption from applying the requirements of FAS 133 on a qualifying special-purpose entity from holding a derivative financial instrument that pertains to a beneficial interest other than another derivative financial instrument. FAS 155 is effective for all financial instruments acquired or issued after the beginning of an entity's first fiscal year that begins after September 15, 2006. Management will implement the requirements of FAS 155 after its effective date, as applicable. Since this guidance is applicable to future transactions, its effect on the financial statements can not be estimated.
In March 2006, the FASB issued FAS 156, "Accounting for Servicing of Financial Assets," an amendment of FAS No. 140, "Accounting for Transfers and Servicing of Financial Assets and Extinguishments of Liabilities." FAS 156 requires that all separately recognized servicing assets and servicing liabilities be initially measured at fair value, if practicable, and permits for subsequent measurement using either fair value measurement with changes in fair value reflected in earnings or the amortization and impairment requirements of FAS 140. The subsequent measurement of separately recognized servicing assets and servicing liabilities at fair value eliminates the necessity for entities that manage the risks inherent in servicing assets and servicing liabilities with derivatives to qualify for hedge accounting treatment and eliminates the characterization of declines in fair value as impairments or direct write-downs. FAS 156 is effective for an entity's first fiscal year beginning after September 15, 2006. The implementation of this pronouncement is not expected to have a material impact on the Company's financial statements.
In July 2006, the FASB issued FASB Interpretation No. 48, "Accounting for Uncertainty in Income Taxes" ("FIN 48"). FIN 48 prescribes a recognition threshold and measurement attribute for the financial statement recognition and measurement of a tax position taken or expected to be taken in a tax return. The Interpretation also provides guidance on de-recognition, classification, interest and penalties, accounting in interim periods, disclosure, and transition. FIN 48 is effective in fiscal years beginning after December 15, 2006. The provisions of FIN 48 are to be applied to all tax positions upon initial adoption, with the cumulative effect adjustment reported as an adjustment to the opening balance of retained earnings. Management is currently evaluating the potential impact, if any, which the adoption of FIN 48 will have on the Company's consolidated financial statements.
In April 2006, the FASB issued FSP FIN 46(R)-6, "Determining the Variability to Be Considered in Applying FASB Interpretation No. 46(R)" ("FSP FIN 46(R)-6"). FSP FIN 46(R)-6 addresses whether certain arrangements associated with variable interest entities (VIEs) should be treated as variable interests or considered as creators of variability, and indicates that the variability to be considered shall be based on an analysis of the design of the entity. FSP FIN 46(R)-6 is required to be applied prospectively to all entities with which the Company first becomes involved and to all entities previously required to be analyzed under FIN 46(R) upon the occurrence of certain events, beginning
F-10
the first day of the first reporting period after June 15, 2006. Management is currently evaluating the potential impact, if any, that the adoption of FSP FIN 46(R)-6 will have on the Company's consolidated financial statements.
In September 2006, the FASB also issued FAS 157, "Fair Value Measurements." FAS 157 enhances existing guidance for measuring assets and liabilities using fair value, such as emphasizing that fair value is a market-based measurement, not an entity-specific measurement, and sets out a fair value hierarchy with the highest priority being quoted prices in active markets. FAS 157 is effective for financial statements issued for fiscal years beginning after November 15, 2007, and interim periods within those fiscal years. Management is currently evaluating the potential impact, if any, which the adoption of FAS 157 will have on the Company's consolidated financial statements.
In September 2006, the FASB issued FAS 158, "Employers' Accounting for Defined Benefit Pension and Other Postretirement Plans—an amendment of FASB Statements No. 87, 88, 106 and 132(R)." FAS 158 requires companies that sponsor a defined benefit pension plan to fully recognize, as an asset or liability, the overfunded or underfunded status of its benefit plan(s) in their balance sheets. FAS 158 is effective for companies with publicly traded equity securities for fiscal years ending after December 15, 2006. The implementation of this pronouncement is not expected to have a material impact on the Company's financial statements.
FASB Financial Guaranty Insurance Review. In January and February 2005, the SEC staff discussed with several financial guaranty industry participants the differences in loss reserve recognition practices in the industry. In June 2005, at the request of the SEC, the FASB added a project to their agenda to review and codify accounting standards for financial guaranty insurance contracts as they relate to loss reserving policies and later added a review of accounting policies in the financial guaranty insurance industry as they relate to premium recognition and deferred policy acquisition costs. Proposed guidance is expected to be issued by the FASB later in 2006 and final guidance is expected to be issued in 2007. When the FASB reaches a conclusion, the financial guaranty insurance industry, including us, may have to change certain aspects of its relevant accounting policies. We cannot predict how the FASB will resolve this issue or the resulting impact on our financial statements. Until the issue is resolved, we will continue to apply our existing accounting policies as disclosed in our audited consolidated financial statements as of December 31, 2005 and 2004 and for the years ended December 31, 2005, 2004 and 2003.
4. CDO ASSET MANAGEMENT BUSINESS
One of the ways the Company participates in the structured finance market is through structuring and managing CDOs originated in collaboration with investment banks. CDOs can be issued in funded, unfunded or partially funded form. Funded CDOs issue debt instruments and purchase investment assets, while unfunded CDOs synthetically acquire assets and issue liabilities (i.e., assets and liabilities are in derivative form). Partially funded CDOs are a combination of these two forms. From an accounting perspective, funded and partially funded CDOs are determined to be VIEs. Each time such CDOs are formed, the Company performs an analysis to determine whether it is the primary beneficiary and thus required to consolidate the CDO under the provisions of FIN 46(R).
F-11
The following table lists each of the Company's CDOs outstanding as of June 30, 2006 (dollars in millions):
| Year Deal Closed | CDO Name | Transaction Type | Collateral Type(1) | Consolidated | Current AUM (in millions) | Original Investment in Retained Equity (in millions) | Retained Equity % | First Optional Call Date | Maturity Date | |||||||||||
|---|---|---|---|---|---|---|---|---|---|---|---|---|---|---|---|---|---|---|---|---|
| 2002 | ACA CDS 2001-1 | Unfunded | Investment Grade—Corp | No | $ | 975 | $ | 22.5 | 100 | % | N/A | 04/10/07 | ||||||||
| 2002 | ACA CDS 2002-1 | Partially funded | Investment Grade—Corp | Yes | 965 | 22.0 | 100 | N/A | 07/15/08 | |||||||||||
| 2002 | ACA ABS 2002-1 | Funded | Investment Grade—ABS | Yes | 260 | 18.0 | 100 | 08/01/05 | 08/01/37 | |||||||||||
| 2003 | ACA CDS 2002-2 | Unfunded | Investment Grade—Corp | No | 1,000 | 25.0 | 100 | N/A | 03/31/08 | |||||||||||
| 2003 | ACA ABS 2003-1 | Funded | Investment Grade—ABS | Yes | 404 | 18.0 | 100 | 06/10/07 | 06/10/38 | |||||||||||
| 2003 | Grenadier Funding Ltd | Funded | High-Grade—ABS | Yes | 1,493 | 22.5 | 100 | 08/05/08 | 08/05/38 | |||||||||||
| 2003 | ACA ABS 2003-2 | Funded | Investment Grade—ABS | Yes | 732 | 33.5 | 100 | 12/10/07 | 12/10/38 | |||||||||||
| 2004 | ACA ABS 2004-1 | Funded | Investment Grade—ABS | Yes | 440 | 10.0 | 61 | 07/10/07 | 07/10/39 | |||||||||||
| 2004 | Zenith Funding | Funded | High-Grade—ABS | Yes | 1,511 | 13.0 | 52 | 12/06/09 | 12/06/39 | |||||||||||
| 2005 | ACA ABS 2005-1 | Funded | Investment Grade—ABS | No | 452 | 4.4 | 24 | 04/05/08 | 04/05/40 | |||||||||||
| 2005 | Argon 49 | Funded | Investment Grade—Corp | No | 64 | (2) | 0 | 0 | N/A | 06/20/15 | ||||||||||
| 2005 | ACA CLO 2005-1 | Funded | Non-Investment Grade—Leveraged Loans | No | 306 | 5.0 | 21 | 10/15/09 | 10/15/17 | |||||||||||
| 2005 | ACA ABS 2005-2 | Funded | Investment Grade—ABS | No | 454 | 2.1 | 10 | 09/06/09 | 12/06/44 | |||||||||||
| 2005 | Khaleej II | Partially funded | Investment Grade—ABS | No | 750 | 4.5 | 14 | 09/20/09 | 09/20/40 | |||||||||||
| 2006 | Lancer | Funded | High-Grade—ABS | No | 1,500 | 1.5 | 10 | 07/06/10 | 04/06/46 | |||||||||||
| 2006 | Argon 57 | Funded | Investment Grade—Corp | No | 64 | (2) | 0 | 0 | N/A | 06/20/13 | ||||||||||
| 2006 | ACA ABS 2006-1 | Funded | Investment Grade—ABS | No | 750 | 1.4 | 5 | 06/10/13 | 06/10/41 | |||||||||||
| Total: | $ | 12,120 | $ | 203.4 | ||||||||||||||||
- (1)
- Investment grade collateral is rated "BBB-" or better; however certain of our investment grade CDOs include the ability to invest a minority portion (20% or less) in non-investment grade assets. High-grade is "A-" or better.
- (2)
- The original notional deal sizes for Argon 49 and Argon 57 were €50 million each. For purposes of this chart, we have converted the amounts to U.S. dollars at the prevailing currency exchange rates on June 30, 2006.
As of June 30, 2006 and December 31, 2005, consolidated liabilities include non-recourse debt from consolidated CDOs of $4,762.6 million and $4,833.2 million, respectively. Also, as of June 30, 2006 and December 31, 2005, investment in fixed maturity securities includes investments related to CDOs of $4,709.9 million and $4,810.9 million, respectively.
5. NET INSURED CREDIT SWAP REVENUE AND OTHER NET CREDIT SWAP REVENUE
Net insured credit swap revenue includes insured credit swap premiums received for credit protection the Company has sold under its insured credit swaps as well as realized and unrealized gains and losses related to those transactions. Realized losses arise upon the occurrence of credit events requiring payment by the Company under the related credit swap and, additionally, realized gains or losses could occur if a transaction is terminated in advance of its scheduled termination date. Unrealized gains and losses represent the adjustments for changes in fair value that are recorded in each reporting period, under FAS 133. The fair value of the Company's insured credit swaps are recorded as either a derivative liability or derivative asset on the consolidated balance sheets.
F-12
The following table disaggregates net insured credit swap revenue into its component parts for the six months ended June 30, 2006 and 2005:
| | Six Months Ended June 30, | ||||||||
|---|---|---|---|---|---|---|---|---|---|
| | 2006 | 2005 | |||||||
| | (in thousands) | ||||||||
| Net insured credit swap revenue | |||||||||
| Insured credit swap premiums earned | $ | 21,282 | $ | 10,465 | |||||
| Realized gains on insured credit swaps | 2,009 | — | |||||||
| Unrealized losses on insured credit swaps | (1,180 | ) | (5,922 | ) | |||||
| Total net insured credit swap revenue | $ | 22,111 | $ | 4,543 | |||||
Other net credit swap revenue includes revenues received from a partially funded CDS CDO which sells credit protection under credit swaps for which it receives fixed quarterly fees as well as the residual returns on our two synthetic equity participations. Other net credit swap revenue also includes net realized and unrealized gains and losses associated with these transactions. These revenues are included in the Company's consolidated statements of operations.
The following table disaggregates other net credit swap revenue into its component parts for the six months ended June 30, 2006 and 2005:
| | Six Months ended June 30, | ||||||||
|---|---|---|---|---|---|---|---|---|---|
| | 2006 | 2005 | |||||||
| | (in thousands) | ||||||||
| Other net credit swap revenue | |||||||||
| Credit swap fees earned | $ | 5,253 | $ | 3,530 | |||||
| Realized gains (losses) on credit swaps | — | — | |||||||
| Unrealized gains (losses) on credit swaps | 291 | (1,006 | ) | ||||||
| Total other net credit swap revenue | $ | 5,544 | $ | 2,524 | |||||
6. LITIGATION
In May 2006, the Company paid a judgment in the amount of $3.7 million in satisfaction of a damages award in connection with an employment contract dispute with a former executive of the Company plus accrued interest through the date of payment. Also in May 2006, the Company settled the former executive's attorney's fees at an additional amount of $0.6 million. The Company had posted a reserve of $4.2 million to cover these costs in December 2005. A judicial satisfaction of the judgment has been filed and the Company has no additional liability with respect to this matter.
F-13
7. SEGMENT INFORMATION
The Company's reportable segments are as follows:
(1) Structured Credit, which structures and sells credit protection, principally in the form of CDS, against a variety of asset classes in the institutional fixed income markets;
(2) Municipal Finance, which provides insurance guaranteeing the timely payment of ultimate principal and interest on municipal obligations;
(3) CDO Asset Management, which originates, structures and manages assets, primarily corporate obligations or asset-backed securities, in funded or synthetic CDOs; and
(4) Other, which primarily includes trade credit insurance business, insured loss warranty business and financial guaranty insurance on certain other sectors, each of which the Company is no longer engaged in.
The Company's reportable segments are strategic business units that offer different products and services. They are managed separately since each business requires different marketing strategies, personnel skill sets and technology.
Where determinable, the Company specifically assigns assets to each segment, otherwise, the Company allocates assets based on estimates. In general, allocation percentages for assets are determined based on each line's estimated capital utilization from a rating agency perspective.
The accounting policies of the segments are the same as those described in the summary of significant accounting policies. The Company evaluates segment performance based on its income (loss) before income taxes. Reportable segment results are presented net of material inter-segment
F-14
transactions. The following table summarizes the Company's operations and allocation of assets as of and for the six months ended June 30, 2006 and 2005 (dollars in thousands):
| | Six Months Ended June 30, 2006 | ||||||||||||||||
|---|---|---|---|---|---|---|---|---|---|---|---|---|---|---|---|---|---|
| | Structured Credit | Municipal Finance | CDO Asset Management | Other | Consolidated Totals | ||||||||||||
| Revenues | |||||||||||||||||
| Premiums earned | $ | 506 | $ | 11,752 | $ | — | $ | 1,099 | $ | 13,357 | |||||||
| Net insured credit swap revenue | 20,439 | 632 | 1,040 | — | 22,111 | ||||||||||||
| Net investment income | 1,734 | 8,004 | 148,577 | 1,849 | 160,164 | ||||||||||||
| Net realized and unrealized losses on investments | (171 | ) | (817 | ) | (2,046 | ) | (189 | ) | (3,223 | ) | |||||||
| Net realized and unrealized gains on derivative instruments | — | — | 6,139 | — | 6,139 | ||||||||||||
| Other net credit swap revenue | (25 | ) | — | 5,569 | — | 5,544 | |||||||||||
| Fee and other income | 283 | 152 | 10,742 | — | 11,177 | ||||||||||||
| Total revenues | 22,766 | 19,723 | 170,021 | 2,759 | 215,269 | ||||||||||||
Expenses | |||||||||||||||||
| Loss and loss adjustment expenses | — | 2,915 | — | 767 | 3,682 | ||||||||||||
| Policy acquisition costs | — | 3,790 | — | 370 | 4,160 | ||||||||||||
| Other operating expenses | 8,663 | 4,404 | 10,227 | — | 23,294 | ||||||||||||
| Interest expense | 173 | 830 | 136,207 | 173 | 137,383 | ||||||||||||
| Depreciation and amortization | 367 | 309 | 4,041 | — | 4,717 | ||||||||||||
| Total expenses | 9,203 | 12,248 | 150,475 | 1,310 | 173,236 | ||||||||||||
| Income of minority interest | (7 | ) | — | (2,222 | ) | — | (2,229 | ) | |||||||||
| Income before income taxes | $ | 13,556 | $ | 7,475 | $ | 17,324 | $ | 1,449 | 39,804 | ||||||||
| Provision for income taxes | 13,615 | ||||||||||||||||
| Net income | $ | 26,189 | |||||||||||||||
| Segment assets | $ | 56,390 | $ | 452,947 | $ | 5,139,289 | $ | 96,877 | $ | 5,745,503 | |||||||
F-15
| | Six Months Ended June 30, 2005 | ||||||||||||||||
|---|---|---|---|---|---|---|---|---|---|---|---|---|---|---|---|---|---|
| | Structured Credit | Municipal Finance | CDO Asset Management | Other | Consolidated Totals | ||||||||||||
| Revenues | |||||||||||||||||
| Premiums earned | $ | 1,771 | $ | 10,324 | $ | — | $ | 4,126 | $ | 16,221 | |||||||
| Net insured credit swap revenue | 2,868 | — | 1,675 | — | 4,543 | ||||||||||||
| Net investment income | 386 | 6,459 | 106,085 | 1,544 | 114,474 | ||||||||||||
| Net realized losses on investments | (13 | ) | (217 | ) | (941 | ) | (52 | ) | (1,223 | ) | |||||||
| Net realized and unrealized gains on derivative instruments | — | — | 4,040 | — | 4,040 | ||||||||||||
| Other net credit swap revenue | — | — | 2,524 | — | 2,524 | ||||||||||||
| Fee and other income | 241 | 37 | 4,383 | — | 4,661 | ||||||||||||
| Total revenues | 5,253 | 16,603 | 117,766 | 5,618 | 145,240 | ||||||||||||
Expenses | |||||||||||||||||
| Loss and loss adjustment expenses | — | 2,087 | — | 2,052 | 4,139 | ||||||||||||
| Policy acquisition costs | — | 3,073 | — | 911 | 3,984 | ||||||||||||
| Other operating expenses | 3,010 | 3,845 | 7,814 | — | 14,669 | ||||||||||||
| Interest expense | 53 | 762 | 94,505 | 184 | 95,504 | ||||||||||||
| Depreciation and amortization | 97 | 244 | 3,691 | 32 | 4,064 | ||||||||||||
| Total expenses | 3,160 | 10,011 | 106,010 | 3,179 | 122,360 | ||||||||||||
| Income of minority interest | — | — | (1,685 | ) | — | (1,685 | ) | ||||||||||
| Income before income taxes | $ | 2,093 | $ | 6,592 | $ | 10,071 | $ | 2,439 | 21,195 | ||||||||
| Provision for income taxes | 8,078 | ||||||||||||||||
| Net income | $ | 13,117 | |||||||||||||||
| Segment assets | $ | 35,528 | $ | 441,521 | $ | 5,236,130 | $ | 94,887 | $ | 5,808,066 | |||||||
8. STOCK PLANS AND STOCK BASED COMPENSATION
In 2001, the Company adopted the American Capital Access Holdings, Incorporated Omnibus Incentive Plan (the "Prior Plan") under which 2,188,584 shares of the Company's common shares were reserved for issuance to employees, directors and consultants. In 2003, the Company's Board of Directors approved the increase of the number of shares reserved for issuance by 72,954. In 2004, the Board of Directors approved the ACA Capital Holdings, Inc. Amended and Restated 2004 Stock Incentive Plan effective September 30, 2004 (as amended on October 4, 2004, the "Plan") amending and restating the Prior Plan and increasing the total options available under the Plan (including those previously distributed under the Prior Plan) to 4,241,538. In August 2006, the Board of Directors approved the increase of the total options available under the Plan, including all shares subject to existing awards thereunder, to 6,327,972. The Plan permits the grant of nonqualified and qualified stock options, incentive stock options, restricted stock, stock units, unrestricted stock, dividend equivalent and
F-16
cash-based awards. The objectives of the Plan are to optimize the profitability and growth of the Company through annual long-term incentives that are consistent and linked with the Company's goals.
In December 2004, the FASB issued FAS 123(R) that requires compensation cost related to share-based payment transactions to be recognized in an issuer's financial statements. The compensation cost, with limited exceptions, is measured based on the grant-date fair value of the equity or liability instrument issued. FAS 123(R) replaces FAS 123 and supersedes Accounting Principal Board Opinion No. 25.
Effective January 1, 2006, the Company adopted FAS 123(R) using the prospective application as permitted by FAS 123(R). Accordingly, prior period amounts have not been restated. Under this application, we are required to record compensation expense for all awards granted after the date of adoption. Awards granted prior to the date of adoption of FAS 123(R) continue to be accounted for under APB Opinion No. 25. Compensation cost is recognized over the periods that an employee provides service in exchange for the award.
The fair value of the stock options granted was estimated on the date of grant using a Black-Scholes option valuation model that uses the assumptions noted in the following table. The risk-free rate is based on the U.S. Treasury yield curve in effect at the time of grant. The expected term (estimated period of time outstanding) of the stock options granted was estimated using the simplified method, in which expected term equals the average of graded vesting term and the contractual term. Expected volatility was estimated based on the historical volatility of comparable public companies for a period equal to the stock option's expected term, ending on the day of grant, and calculated on a monthly basis.
| | June 30, 2006 | ||
|---|---|---|---|
| Expected life (years) | 6.00 | ||
| Risk-free interest rate | 4.55 | % | |
| Volatility | 25.00 | % | |
| Dividend yield | 0.00 | % |
In the first six months of 2006, the adoption of FAS 123(R) resulted in incremental stock-based compensation expense of $0.4 million. The incremental stock-based compensation expense caused income before income taxes and net income to decrease by $0.4 million and $0.2 million, respectively, and basic and diluted earnings per share to decrease by $0.01 and $0.01 per share, respectively. There was no effect on cash provided by operating activities and cash provided by financing activities related to excess tax benefits from stock-based payment arrangements in the first six months of 2006.
Prior to the adoption of FAS 123(R), the Company applied APB No. 25 to account for its stock-based compensation awards and provided the required pro forma disclosures of FAS 123. The following table illustrates the effect on net income and earnings per share had compensation expense for stock-
F-17
based compensation awards been recorded in the six months ended June 30, 2005 based on the fair value method under FAS 123.
| (In thousands, except per share amounts) | Six Months Ended June 30, 2005 | ||||
|---|---|---|---|---|---|
| Net income, as reported | $ | 13,117 | |||
| Add: Stock-based employee compensation expense included in reported net income, net of related tax effects | 0 | ||||
| Deduct: Stock-based compensation expense determined under fair value method for awards, granted prior to the adoption of FAS 123(R), net of related tax effects | (147 | ) | |||
| Pro forma net income | $ | 12,970 | |||
| Earnings per share | |||||
| Basic—as reported | $ | 0.58 | |||
| Basic—pro forma | $ | 0.57 | |||
| Diluted—as reported | $ | 0.44 | |||
| Diluted—pro forma | $ | 0.44 | |||
Unless otherwise specified, each option vests ratably either annually over 3 years or every 6 months over 31/2 years, beginning at the date of grant. As long as the grantee is still with the Company, if not vested by its terms, each option fully vests upon the earliest of:
- •
- the grantee's normal retirement date;
- •
- the grantee's death or disability; or
- •
- the occurrence of a change of control of the Company.
Information with regard to stock options for the period ended June 30, 2006, is as follows:
| | Number of Shares | Weighted Average Exercise Price Per Share | |||
|---|---|---|---|---|---|
| Outstanding, January 1, 2006 | 3,043,650 | $ | 10.54 | ||
| Granted | 1,017,000 | 12.66 | |||
| Exercised | (663,540 | ) | 10.23 | ||
| Forfeited | (51,402 | ) | 10.52 | ||
| Expired | — | — | |||
| Outstanding, June 30, 2006 | 3,345,708 | $ | 11.25 | ||
| Options vested, June 30, 2006 | 1,526,922 | $ | 10.70 | ||
F-18
The table summarizes information regarding fully vested share options as of June 30, 2006:
| ($ in millions, except per-share amount) | | ||
|---|---|---|---|
| Number of options vested | 1,526,922 | ||
| Weighted-average exercise price per share | $ | 10.70 | |
| Aggregate intrinsic value (excess market price over exercise price) | $ | 3,014 | |
| Weighted-average remaining contractual term of options (in years) | 5.92 | ||
The weighted average grant date fair values of the stock options granted during the six months ended June 30, 2006 and 2005 were $4.45 and $2.41, respectively. As of June 30, 2006, there was $2.8 million of total unrecognized compensation cost related to nonvested share-based compensation awards granted under the stock option plans. The cost is expected to be recognized over a weighted average period of 3.11 years.
The following table summarizes information concerning outstanding and exercisable options at June 30, 2006:
| | Options Outstanding | Options Exercisable | ||||||||||
|---|---|---|---|---|---|---|---|---|---|---|---|---|
| Range of Exercise Prices | Number Outstanding | Weighted Average Remaining Contractual Life (Years) | Weighted Average Exercise Price | Number Exercisable | Weighted Average Exercise Price | |||||||
| $ 9.04—$10.33 | 676,758 | 3.90 | $ | 10.23 | 676,758 | $ | 10.23 | |||||
| $10.34—$11.62 | 1,274,418 | 8.28 | $ | 10.38 | 545,538 | $ | 10.38 | |||||
| $11.63—$12.92 | 1,394,532 | 8.71 | $ | 12.53 | 304,626 | $ | 12.31 | |||||
| 3,345,708 | 7.57 | $ | 11.25 | 1,526,922 | $ | 10.70 | ||||||
9. INVESTMENTS
The Company accounts for its investments in fixed maturity securities in accordance with the FAS No. 115, "Accounting for Certain Investments in Debt and Equity Securities" and Emerging Issues Task Force ("EITF") Issue No. 99-20, "Recognition of Interest Income and Impairment on Purchased and Retained Beneficial Interests in Securitized Financial Assets." Management determines the appropriate classification of securities at the time of purchase. As of June 30, 2006 and December 31, 2005, all investments in fixed maturity securities, with the exception of the Company's investments in its credit opportunity fund (see Note 9), were designated as available-for-sale and were carried at fair value. Fixed maturity securities in the Company's credit opportunity fund are designated as trading and are also carried at fair value. The difference between fair value and amortized cost of available-for-sale securities is included in the accumulated other comprehensive income component of shareholders' equity, net of applicable deferred income tax. Changes in fair value of trading securities are included in net income. The fair values of these securities are based on independent market quotations or, when such quotations are not readily available because the securities are infrequently traded in the public market, from internal valuation models. These models include estimates, made by management, which utilize current market information. The valuation results from these models could differ materially from amounts realizable in an open market sale or exchange.
F-19
The Company's process for identifying declines in the fair value of investments that are other than temporary involves consideration of several factors. These factors include (i) the duration of a significant decline in value, (ii) the liquidity, business prospects and overall financial condition of the issuer, (iii) the magnitude of the decline, (iv) the collateral structure and other credit support, as applicable, (v) the Company's intent and ability to hold the investment until the values recover, and (vi) for asset backed securities, the estimated cash flows. When the analysis of the above factors results in a conclusion that a decline in fair values is other than temporary, the cost of the security is written down to fair value as of the reporting date and any previously unrealized loss is realized in the period such a determination is made.
On November 3, 2005, the FASB issued FASB Staff Position ("FSP") Nos. FAS 115-1 and FAS 124-1, "The Meaning of Other-Than-Temporary Impairment and Its Application to Certain Investments." This FSP addresses the determination as to when an investment is considered impaired, whether that impairment is other than temporary and the measurement of an impairment loss. This FSP also includes accounting considerations subsequent to the recognition of other-than-temporary impairment and requires certain disclosures about unrealized losses that have not been recognized as other-than-temporary impairments. The guidance in this FSP also amends FAS No. 115. We adopted this FSP effective January 1, 2006. Accordingly, we are now required to assess our investments for impairment in each reporting period and to use existing guidance, prior to the issuance of EITF 03-1, in assessing whether an impairment is other than temporary. The impact from the adoption of this guidance was not material.
The Company recognized $1.9 million and $0.9 million of other than temporary impairments within the CDO VIE portfolio during the six months ended June 30, 2006 and 2005, respectively.
The following table shows the gross unrealized losses and fair value of our fixed maturity securities available for sale with unrealized losses that are not deemed to be other-than-temporarily impaired,
F-20
aggregated by investment category and length of time that individual securities have been in a continuous unrealized loss position, at June 30, 2006.
| | Less than 12 months | 12 months or more | | | |||||||||||||||
|---|---|---|---|---|---|---|---|---|---|---|---|---|---|---|---|---|---|---|---|
| | Fair Value | Unrealized Loss | Fair Value | Unrealized Loss | Total Fair Value | Total Unrealized Loss | |||||||||||||
| | (in thousands) | ||||||||||||||||||
| Available for sale-non-VIE: | |||||||||||||||||||
| U.S. treasury securities | $ | 23,090 | $ | (941 | ) | $ | 9,245 | $ | (321 | ) | $ | 32,335 | $ | (1,262 | ) | ||||
| Federal-agency securities | 62,350 | (2,420 | ) | 5,931 | (81 | ) | 68,281 | (2,501 | ) | ||||||||||
| Obligations of states and political subdivisions | 69,563 | (1,700 | ) | 31,635 | (1,379 | ) | 101,198 | (3,079 | ) | ||||||||||
| Corporate securities | 72,435 | (3,950 | ) | 25,995 | (1,639 | ) | 98,430 | (5,589 | ) | ||||||||||
| Asset-backed securities | 9,764 | (131 | ) | 3,815 | (51 | ) | 13,579 | (182 | ) | ||||||||||
| Mortgage-backed securities | 60,198 | (3,279 | ) | 70,977 | (3,585 | ) | 131,175 | (6,864 | ) | ||||||||||
Total non-VIE securities | 297,400 | (12,421 | ) | 147,598 | (7,056 | ) | 444,998 | (19,477 | ) | ||||||||||
| Available for sale-VIE—asset-backed securities | 784,715 | (8,286 | ) | 319,422 | (7,222 | ) | 1,104,137 | (15,508 | ) | ||||||||||
| Total | $ | 1,082,115 | $ | (20,707 | ) | $ | 467,020 | $ | (14,278 | ) | $ | 1,549,135 | $ | (34,985 | ) | ||||
The unrealized losses on the Company's investments were caused by interest rate increases. Because the decline in market value of these securities is attributable to changes in interest rates and not credit quality, and because the Company has the ability and intent to hold these investments until a recovery of fair value, which may be at maturity, it does not consider these investments to be other-than-temporarily-impaired at June 30, 2006.
Included above are 454 fixed maturity securities, 216 in the non-VIE portfolios, and 238 in the VIE portfolios. At June 30, 2006, there were 4 fixed maturity securities each of whose amortized cost exceeded its respective fair value by greater than 20%. In addition, over 98% of these securities are rated investment grade in the non-VIE portfolios while over 95% are rated investment grade in the VIE portfolios. Management has assessed these and other factors and concluded that there were no other than temporarily impaired fixed maturity securities included in the above table as of June 30, 2006.
10. CREDIT OPPORTUNITY FUND
In May 2006, the Company launched a credit opportunity fund ("Credit Fund") to leverage its expertise in the capital and credit markets and as an asset manager. The fund invests in fixed maturity securities, particularly in the asset back sector. The fund had assets under management of $25.0 million as of June 30, 2006, of which the Company had invested $16.4 million. The remaining $8.6 million was invested by third party investors. In addition to receiving a return on its investment in the Credit Fund, the Company is paid a management fee to select and manage the assets of the fund. For accounting
F-21
purposes, the Credit Fund is consolidated in the Company's financial statements as of June 30, 2006 and its financial results are recorded in the Structured Credit line of business.
11. SENIOR CONVERTIBLE PREFERRED STOCK
In April 2006, the Company issued 25 shares of senior convertible preferred stock to its existing stockholders representing the 5% "liquidation accretion" premium earned from the date of issuance through September 30, 2004. The transaction was accounted for as a dividend. A value of $2.0 million, based on the March 31, 2006 book value, was reclassified from Retained Earnings to Senior Convertible Preferred Stock to record the dividend.
12. SUBSEQUENT EVENTS
On August 3, 2006, the compensation committee granted in the aggregate to certain of our officers 234,000 shares of restricted stock and options to purchase 543,000 shares of common stock, in each case, subject to the completion of the offering. The shares of restricted stock vest in equal installments on each of the first four anniversaries of the grant date. The options have an exercise price per share equal to the offering price per share, have a term of ten years subject to earlier termination and vest in equal installments every six months over 42 months.
On August 3, 2006 the Company's Board of Directors authorized a dividend in order to effect a six-for-one stock split on the Company's outstanding shares of common stock and on each share of common stock to be issued upon conversion of the various classes of preferred stock of the Company. Each stockholder of record on August 3, 2006 has received five additional shares of common stock for each share of common stock held by such stockholder on that date. Additional funds have been shifted from the Additional Paid in Capital account to the Common Stock account to equal the amount of additional par value represented by the additional shares which have been issued under the stock split. Upon the conversion of the various classes of the Company's preferred stock, each holder of Convertible Preferred Stock, Senior Convertible Preferred Stock and Series B Senior Convertible Preferred Stock will be issued, in the case Convertible Preferred Stockholders and Senior Convertible Preferred Stockholders, 6,000 shares for each share of preferred stock held by such holder and, in the case of the Series B Senior Convertible Preferred Stockholders, 6 shares of each share of preferred stock held by such holder. All earnings per share and related stock option information presented in these financial statements and accompanying footnotes have been retroactively adjusted to reflect the increased number of shares resulting from this action. While outstanding Common Stock has been restated to reflect the stock spit, outstanding Preferred Stock has not been and will not be restated until such Preferred Stock is converted into Common Stock.
On August 18, 2006, the Company granted two of its independent directors $40,000 each of restricted common stock contingent upon the successful completion of the Company's initial public offering of its common stock. The number of shares of restricted stock granted to each director is dependent on the offering price of the initial public offering. These shares of restricted stock will vest one third per year over a three year period.
F-22
REPORT OF INDEPENDENT REGISTERED PUBLIC ACCOUNTING FIRM
To the Board of Directors and Stockholders of
ACA Capital Holdings, Inc.
New York, New York
We have audited the accompanying consolidated balance sheets of ACA Capital Holdings, Inc. and subsidiaries (the "Company") (formerly, American Capital Access Holdings, Ltd. and subsidiaries) as of December 31, 2005 and 2004, and the related consolidated statements of operations, stockholders' equity, and cash flows for the years then ended. Our audits also included the financial statement schedules listed in the Index at Item 16 as of and for the years ended December 31, 2005 and 2004. These financial statements and financial statement schedules are the responsibility of the Company's management. Our responsibility is to express an opinion on these financial statements and financial statement schedules based on our audits.
We conducted our audits in accordance with the standards of the Public Company Accounting Oversight Board (United States). Those standards require that we plan and perform the audit to obtain reasonable assurance about whether the financial statements are free of material misstatement. The Company is not required to have, nor were we engaged to perform, an audit of its internal control over financial reporting. Our audits included consideration of internal control over financial reporting as a basis for designing audit procedures that are appropriate in the circumstances, but not for the purpose of expressing an opinion on the effectiveness of the Company's internal control over financial reporting. Accordingly, we express no such opinion. An audit also includes examining, on a test basis, evidence supporting the amounts and disclosures in the financial statements, assessing the accounting principles used and significant estimates made by management, as well as evaluating the overall financial statement presentation. We believe that our audits provide a reasonable basis for our opinion.
In our opinion, such 2005 and 2004 consolidated financial statements present fairly, in all material respects, the financial position of ACA Capital Holdings, Inc. and subsidiaries as of December 31, 2005 and 2004, and the results of their operations and their cash flows for the years then ended in conformity with accounting principles generally accepted in the United States of America. Also, in our opinion, such financial statement schedules, when considered in relation to the basic consolidated financial statements taken as a whole, present fairly in all material respects the information set forth therein as of and for the years ended December 31, 2005 and 2004.
/s/ Deloitte & Touche LLP
New York, New York
March 27, 2006
(May 9, 2006 as to Note 23, August 28, 2006 as to the effects of the stock split described in Note 25 and October 27, 2006 as to the effects of the restatement of the Consolidated Statement of Stockholders' Equity for the year ended December 31, 2005 and the effects of reclassifications, both as described in Note 2)
F-23
REPORT OF INDEPENDENT REGISTERED PUBLIC ACCOUNTING FIRM
To the Board of Directors and Stockholders of
ACA Capital Holdings, Inc.:
In our opinion, the accompanying consolidated statements of operations, stockholders' equity, and cash flows present fairly, in all material respects, the results of operations and cash flows of ACA Capital Holdings, Inc. and its subsidiaries ("the Company") (formerly American Capital Access Holdings, Ltd. and subsidiaries) for the year ended December 31, 2003, in conformity with accounting principles generally accepted in the United States of America. These financial statements are the responsibility of the Company's management. Our responsibility is to express an opinion on these financial statements based on our audit. We conducted our audit of these statements in accordance with the standards of the Public Company Accounting Oversight Board (United States). Those standards require that we plan and perform the audit to obtain reasonable assurance about whether the financial statements are free of material misstatement. An audit includes examining, on a test basis, evidence supporting the amounts and disclosures in the financial statements, assessing the accounting principles used and significant estimates made by management, and evaluating the overall financial statement presentation. We believe that our audit provides a reasonable basis for our opinion.
/s/ PricewaterhouseCoopers LLP
Los Angeles, CA
August 20, 2004, except for the effects on the 2003 financial statements of the restatement discussed in Note 2 under the caption "2003 Financial Statement Restatement", as to which the date is August 15, 2005, and except for the segment information discussed in Note 22 and the earnings per share information discussed in Note 23, as to which the date is May 9, 2006, and except for the effects of the stock split discussed in Note 25, as to which the date is August 28, 2006 and except for the effects of reclassifications discussed in Note 2 under the caption "Reclassifications", as to which the date is October 26, 2006.
F-24
ACA CAPITAL HOLDINGS, INC. AND SUBSIDIARIES
CONSOLIDATED BALANCE SHEETS
AS OF DECEMBER 31, 2005 AND 2004
(Dollars in thousands)
| | 2005 | 2004 | |||||||
|---|---|---|---|---|---|---|---|---|---|
| ASSETS | |||||||||
| Fixed-maturity securities available for sale—at fair value, amortized cost of $5,292,081 and $5,115,968, respectively | $ | 5,298,739 | $ | 5,153,099 | |||||
Guaranteed investment contract | 119,340 | 122,600 | |||||||
| Total investments | 5,418,079 | 5,275,699 | |||||||
Cash: | |||||||||
| Cash and cash equivalents | 174,420 | 228,927 | |||||||
| Restricted cash | 50,185 | 30,073 | |||||||
| Total cash | 224,605 | 259,000 | |||||||
| Accrued investment income | 17,258 | 12,354 | |||||||
| Derivative assets | 15,250 | 28,460 | |||||||
| Deferred policy acquisition costs, net | 47,414 | 46,556 | |||||||
| Deferred debt issuance costs, net | 40,843 | 45,867 | |||||||
| Prepaid reinsurance premiums | 848 | 1,824 | |||||||
| Other assets | 27,903 | 22,201 | |||||||
| TOTAL | $ | 5,792,200 | $ | 5,691,961 | |||||
| LIABILITIES AND MINORITY INTEREST AND STOCKHOLDERS' EQUITY | |||||||||
| LIABILITIES | |||||||||
| Unearned premiums | $ | 187,739 | $ | 180,140 | |||||
| Reserve for losses and loss adjustment expenses | 34,306 | 36,006 | |||||||
| Short-term debt | 2,674,698 | 2,473,039 | |||||||
| Long-term debt | 2,254,650 | 2,430,008 | |||||||
| Related party debt | 100,000 | — | |||||||
| Derivative liabilities | 46,538 | 58,755 | |||||||
| Accrued interest payable | 15,347 | 11,503 | |||||||
| Accrued expenses and other liabilities | 32,277 | 25,262 | |||||||
| Payable for securities purchased | 30,138 | 77,355 | |||||||
| Current income tax payable | 3,044 | 2,340 | |||||||
| Deferred income taxes | 6,909 | 12,016 | |||||||
| Total liabilities | 5,385,646 | 5,306,424 | |||||||
MINORITY INTEREST IN CDOs | 22,241 | 20,923 | |||||||
COMMITMENTS AND CONTINGENCIES | |||||||||
STOCKHOLDERS' EQUITY: | |||||||||
| Senior convertible preferred stock—220 shares authorized, 129 shares issued and outstanding at December 31, 2005 and 2004 | 7,339 | 7,339 | |||||||
| Convertible preferred stock—1,500 shares authorized, 959 shares issued and outstanding at December 31, 2005 and 2004 | 54,858 | 54,858 | |||||||
| Series B senior convertible preferred stock—3,000,000 shares authorized, 2,785,769 and 2,767,268 shares issued and outstanding at December 31, 2005 and 2004, respectively | 164,263 | 163,050 | |||||||
| Series C senior convertible preferred stock—35,000 shares authorized, 0 shares and 13,501 shares issued and outstanding at December 31, 2005 and 2004, respectively | — | 841 | |||||||
| Common stock of 12,000,000 shares authorized at December 31, 2005 and 2004; 6,442,950 shares issued and outstanding at December 31, 2005 and 2004; par value of $0.10 | 644 | 644 | |||||||
| Gross paid-in and contributed capital | 125,184 | 125,184 | |||||||
| Treasury stock at cost—351,876 shares and 344,748 shares at December 31, 2005 and 2004, respectively | (5,500 | ) | (5,426 | ) | |||||
| Notes receivable from stockholders | (1,355 | ) | (1,656 | ) | |||||
| Deferred compensation | (2,030 | ) | (3,190 | ) | |||||
| Accumulated other comprehensive income—net of deferred income tax of $5,369 and $11,195 at December 31, 2005 and 2004, respectively | 11,132 | 21,952 | |||||||
| Retained earnings | 29,778 | 1,018 | |||||||
| Total stockholders' equity | 384,313 | 364,614 | |||||||
| TOTAL | $ | 5,792,200 | $ | 5,691,961 | |||||
See notes to consolidated financial statements.
F-25
ACA CAPITAL HOLDINGS, INC. AND SUBSIDIARIES
CONSOLIDATED STATEMENTS OF OPERATIONS
FOR THE YEARS ENDED DECEMBER 31, 2005, 2004 AND 2003
(Dollars and shares in thousands, except per share amounts)
| | 2005 | 2004 | 2003 | |||||||||
|---|---|---|---|---|---|---|---|---|---|---|---|---|
| REVENUES: | ||||||||||||
| Gross premiums written | $ | 41,280 | $ | 44,570 | $ | 60,981 | ||||||
| Less premiums ceded | 638 | 911 | (3,465 | ) | ||||||||
| Net premiums written | 41,918 | 45,481 | 57,516 | |||||||||
| Increase in unearned premium reserve—net | (8,575 | ) | (15,648 | ) | (38,720 | ) | ||||||
| Premiums earned | 33,343 | 29,833 | 18,796 | |||||||||
| Net insured credit swap revenue | 21,571 | 16,018 | 6,841 | |||||||||
| Net investment income | 254,591 | 126,170 | 52,868 | |||||||||
| Net realized gains (losses) on investments | (2,777 | ) | (6,547 | ) | 3,188 | |||||||
| Net realized and unrealized gains on derivative instruments | 8,410 | 6,520 | 9,124 | |||||||||
| Other net credit swap revenue | 4,157 | 10,990 | 12,121 | |||||||||
| Fee income | 11,110 | 6,091 | 8,898 | |||||||||
| Other income | 189 | 3,937 | 423 | |||||||||
| Total revenues | 330,594 | 193,012 | 112,259 | |||||||||
EXPENSES: | ||||||||||||
| Loss and loss adjustment expenses | 14,038 | 46,590 | 3,168 | |||||||||
| Policy acquisition costs | 8,652 | 3,835 | 4,077 | |||||||||
| Other operating expenses | 37,443 | 38,645 | 29,466 | |||||||||
| Interest expense | 214,313 | 101,137 | 39,260 | |||||||||
| Depreciation and amortization | 8,583 | 6,935 | 4,115 | |||||||||
| Total expenses | 283,029 | 197,142 | 80,086 | |||||||||
| (Income) loss of minority interest | (3,708 | ) | 476 | — | ||||||||
| Income (loss) before income taxes | 43,857 | (3,654 | ) | 32,173 | ||||||||
| Provision for income tax expense | 15,097 | 135 | 12,206 | |||||||||
| Net income (loss) | $ | 28,760 | $ | (3,789 | ) | $ | 19,967 | |||||
| Share and Per Share Data: | ||||||||||||
| Earnings (loss) per share | ||||||||||||
| Basic | $ | 1.26 | $ | (0.61 | ) | $ | 3.18 | |||||
| Diluted | $ | 0.96 | $ | (0.61 | ) | $ | 1.51 | |||||
Weighted average shares outstanding | ||||||||||||
| Basic | 22,794 | 6,168 | 6,270 | |||||||||
| Diluted | 29,886 | 6,168 | 13,260 | |||||||||
See notes to consolidated financial statements.
F-26
ACA CAPITAL HOLDINGS, INC. AND SUBSIDIARIES
CONSOLIDATED STATEMENTS OF STOCKHOLDERS' EQUITY
FOR THE YEARS ENDED DECEMBER 31, 2005(1), 2004 and 2003
(Dollars in thousands, except for share amounts)
| | Preferred Stock | Common Stock | Gross Paid in and Contributed Capital | | Notes Receivable from Stockholders | | Accumulated Other Comprehensive Income (Loss) | | | |||||||||||||||||||||||||
|---|---|---|---|---|---|---|---|---|---|---|---|---|---|---|---|---|---|---|---|---|---|---|---|---|---|---|---|---|---|---|---|---|---|---|
| | Treasury Stock | Deferred Compensation | Related Earnings/ (Deficit) | Total Stockholders' Equity | ||||||||||||||||||||||||||||||
| | Shares | Amount | Shares | Par Value | ||||||||||||||||||||||||||||||
| BALANCE—December 31, 2002 | 1,088 | $ | 62,197 | 6,442,950 | $ | 644 | $ | 125,184 | $ | (3,222 | ) | $ | (4,200 | ) | $ | — | $ | (5,583 | ) | $ | (15,160 | ) | 159,860 | |||||||||||
| Comprehensive income: | ||||||||||||||||||||||||||||||||||
| Net income | — | — | — | — | — | — | — | — | — | 19,967 | 19,967 | |||||||||||||||||||||||
| Change in unrealized gain on investments, net of change in deferred income tax of $7,795 | — | — | — | — | — | — | — | — | 14,479 | — | 14,479 | |||||||||||||||||||||||
| Total comprehensive income | — | — | — | — | — | — | — | — | — | — | 34,446 | |||||||||||||||||||||||
| BALANCE—December 31, 2003 | 1,088 | 62,197 | 6,442,950 | 644 | 125,184 | (3,222 | ) | (4,200 | ) | — | 8,896 | 4,807 | 194,306 | |||||||||||||||||||||
| Comprehensive income: | ||||||||||||||||||||||||||||||||||
| Net loss | — | — | — | — | — | — | — | — | — | (3,789 | ) | (3,789 | ) | |||||||||||||||||||||
| Change in unrealized gain on investments, net of change in deferred income tax of $6,812 | — | — | — | — | — | — | — | — | 13,056 | — | 13,056 | |||||||||||||||||||||||
| Total comprehensive income | — | — | — | — | — | — | — | — | — | — | 9,267 | |||||||||||||||||||||||
| Changes in Senior convertible preferred stock: | ||||||||||||||||||||||||||||||||||
| Issuance of Series A senior convertible preferred stock | 307,131 | 28,600 | — | — | — | — | — | — | — | — | 28,600 | |||||||||||||||||||||||
| Transfer from Series A senior conv. prf to Series B | (307,131 | ) | (28,600 | ) | — | — | — | — | — | — | — | — | (28,600 | ) | ||||||||||||||||||||
| Transfer to Series B senior conv. prf from Series A | 459,143 | 28,600 | — | — | — | — | — | — | — | — | 28,600 | |||||||||||||||||||||||
| Issuance of Series B senior convertible preferred stock | 2,252,256 | 140,293 | — | — | — | — | — | — | — | — | 140,293 | |||||||||||||||||||||||
| Grant of Series B senior conv. prf stock to CEO | 55,869 | 3,480 | — | — | — | — | — | (3,190 | ) | — | — | 290 | ||||||||||||||||||||||
| Less capitalized costs of raising capital | — | (9,323 | ) | — | — | — | — | — | — | — | — | (9,323 | ) | |||||||||||||||||||||
| Issuance of Series C senior convertible preferred stock | 13,501 | 841 | — | — | — | — | — | — | — | — | 841 | |||||||||||||||||||||||
| Employee stock buyback | — | — | — | — | — | (2,204 | ) | 2,200 | — | — | — | (4 | ) | |||||||||||||||||||||
| Principal paydowns | — | — | — | — | — | — | 344 | — | — | — | 344 | |||||||||||||||||||||||
| BALANCE—December 31, 2004 | 2,781,857 | 226,088 | 6,442,950 | 644 | 125,184 | (5,426 | ) | (1,656 | ) | (3,190 | ) | 21,952 | 1,018 | 364,614 | ||||||||||||||||||||
| Comprehensive income: | ||||||||||||||||||||||||||||||||||
| Net income | — | — | — | — | — | — | — | — | — | 28,760 | 28,760 | |||||||||||||||||||||||
| Change in unrealized gain on investments, net of change in deferred income tax of $(10,343)(1) | — | — | — | — | — | — | — | — | (19,212 | ) | — | (19,212 | ) | |||||||||||||||||||||
| Gain on derivative hedges, net of change in deferred income tax of $4,518(1) | — | — | — | — | — | — | — | — | 8,392 | — | 8,392 | |||||||||||||||||||||||
| Total comprehensive income | — | — | — | — | — | — | — | — | — | — | 17,940 | |||||||||||||||||||||||
| Changes in Senior convertible preferred stock: | ||||||||||||||||||||||||||||||||||
| Issuance of Series C senior convertible preferred stock | 5,000 | 372 | — | — | — | — | — | — | — | — | 372 | |||||||||||||||||||||||
| Vesting of Series B senior conv. prf stock to CEO | — | — | — | — | — | — | — | 1,160 | — | — | 1,160 | |||||||||||||||||||||||
| Transfer from Series C senior conv. pref to Series B | (18,501 | ) | (1,213 | ) | — | — | — | — | — | — | — | — | (1,213 | ) | ||||||||||||||||||||
| Transfer to Series B senior conv. pref from Series C | 18,501 | 1,213 | — | — | — | — | — | — | — | — | 1,213 | |||||||||||||||||||||||
| Employee stock buyback | — | — | — | — | — | (74 | ) | — | — | — | — | (74 | ) | |||||||||||||||||||||
| Employee stock principal paydown | — | — | — | — | — | — | 301 | — | — | — | 301 | |||||||||||||||||||||||
| BALANCE—December 31, 2005 | 2,786,857 | $ | 226,460 | 6,442,950 | $ | 644 | $ | 125,184 | $ | (5,500 | ) | $ | (1,355 | ) | $ | (2,030 | ) | $ | 11,132 | $ | 29,778 | $ | 384,313 | |||||||||||
- (1)
- As restated, see Note 2 for effects of 2005 restatement.
See notes to consolidated financial statements.
F-27
ACA CAPITAL HOLDINGS, INC. AND SUBSIDIARIES
CONSOLIDATED STATEMENTS OF CASH FLOWS
FOR THE YEARS ENDED DECEMBER 31, 2005, 2004 and 2003
(Dollars in thousands)
| | 2005 | 2004 | 2003 | |||||||||
|---|---|---|---|---|---|---|---|---|---|---|---|---|
| CASH FLOWS FROM OPERATING ACTIVITIES: | ||||||||||||
| Net income (loss) | $ | 28,760 | $ | (3,789 | ) | $ | 19,967 | |||||
| Adjustments to reconcile net income (loss) to net cash provided by operating activities | ||||||||||||
| Depreciation and amortization | 8,583 | 6,935 | 4,115 | |||||||||
| Accrual of discount and amortization of premium on investment—net | 503 | 312 | 1,286 | |||||||||
| (Income) loss of minority interest | 3,708 | (476 | ) | — | ||||||||
| Net realized (gains) losses on investments | 2,777 | 6,547 | (3,188 | ) | ||||||||
| Proceeds from (payment for) termination of derivatives | (3,837 | ) | 916 | — | ||||||||
| Net unrealized (gains) losses on net insured credit swaps | 5,663 | (6,160 | ) | (1,801 | ) | |||||||
| Net realized and unrealized gains on derivative instruments | (8,410 | ) | (6,520 | ) | (9,124 | ) | ||||||
| Net realized and unrealized (gains) losses on other net credit swap revenue | 4,466 | (2,160 | ) | (149 | ) | |||||||
| Discharge of note receivable from stockholders | 264 | — | — | |||||||||
| Deferred compensation | 1,160 | (3,190 | ) | — | ||||||||
Changes in assets and liabilities: | ||||||||||||
| Income taxes payable | 704 | 3,783 | (1,570 | ) | ||||||||
| Deferred income tax expense | 719 | (3,322 | ) | 10,287 | ||||||||
| Prepaid reinsurance premiums | 976 | 7,785 | 2,598 | |||||||||
| Premiums receivable | (858 | ) | 1,247 | (2,056 | ) | |||||||
| Payable and accrued expenses | 12,858 | 791 | 10,933 | |||||||||
| Deferred policy acquisition costs | (858 | ) | (4,833 | ) | (3,336 | ) | ||||||
| Unearned premium reserve | 7,599 | 7,803 | 36,115 | |||||||||
| Derivative liabilities | 16,725 | 897 | — | |||||||||
| Loss and loss adjustment expenses | (1,700 | ) | 31,022 | 3,168 | ||||||||
| Counterparty collateral payable | (5,843 | ) | 4,090 | 6,177 | ||||||||
| Interest payable | 3,844 | 3,849 | 3,992 | |||||||||
| Interest receivable | (4,904 | ) | (4,894 | ) | (3,467 | ) | ||||||
| Other | (8,461 | ) | (15,563 | ) | (7,954 | ) | ||||||
| Net cash provided by operating activities | 64,438 | 25,070 | 65,993 | |||||||||
| CASH FLOWS FROM INVESTING ACTIVITIES: | ||||||||||||
| Net (deposit) release of restricted cash | (20,112 | ) | 660 | (8,744 | ) | |||||||
| Purchases of fixed-maturity securities | (1,333,288 | ) | (2,918,437 | ) | (3,188,628 | ) | ||||||
| Redemptions of guaranteed investment contract | 3,260 | (100 | ) | — | ||||||||
| Proceeds from sales of fixed-maturity securities | 187,962 | 349,741 | 684,402 | |||||||||
| Proceeds from maturities of fixed-maturity securities | 918,716 | 479,030 | 155,010 | |||||||||
| Net purchase of property and equipment | (597 | ) | (983 | ) | (1,738 | ) | ||||||
| Net cash used in investing activities | (244,059 | ) | (2,090,089 | ) | (2,359,698 | ) | ||||||
| CASH FLOWS FROM FINANCING ACTIVITIES: | ||||||||||||
| Proceeds from issuance of debt | 106,867 | 745,141 | 1,167,219 | |||||||||
| Proceeds from issuance of commercial paper—net | 204,948 | 1,207,341 | 1,265,699 | |||||||||
| Pay down on debt | (185,514 | ) | (13,965 | ) | (10,056 | ) | ||||||
| Payment of issuance costs for debt | (1,461 | ) | (15,993 | ) | (25,897 | ) | ||||||
| Proceeds received from minority interest in CDOs | — | 18,500 | — | |||||||||
| Proceeds from issuance of preferred stock—net of issuance costs | 311 | 163,891 | — | |||||||||
| Net proceeds from hedging activities | — | 8,245 | 19,775 | |||||||||
| Purchase of treasury stock | (74 | ) | (4 | ) | — | |||||||
| Notes receivable from stockholders | 37 | 344 | — | |||||||||
| Payments on capital lease obligations | — | (1,157 | ) | (1,630 | ) | |||||||
| Net cash provided by financing activities | 125,114 | 2,112,343 | 2,415,110 | |||||||||
| NET (DECREASE) INCREASE IN CASH AND CASH EQUIVALENTS | (54,507 | ) | 47,324 | 121,405 | ||||||||
CASH AND CASH EQUIVALENTS—beginning of year | 228,927 | 181,603 | 60,198 | |||||||||
| CASH AND CASH EQUIVALENTS—end of year | $ | 174,420 | $ | 228,927 | $ | 181,603 | ||||||
| SUPPLEMENTAL CASH FLOW DISCLOSURES: | ||||||||||||
| Federal and local income taxes paid | $ | 14,070 | $ | 420 | $ | 3,372 | ||||||
| Interest paid | $ | 210,469 | $ | 97,288 | $ | 35,186 | ||||||
| SUPPLEMENTAL DISCLOSURE OF NON-CASH FINANCING ACTIVITIES— | ||||||||||||
| Common stock acquired in exchange for note receivable | $ | — | $ | 2,200 | $ | — | ||||||
See notes to consolidated financial statements.
F-28
ACA CAPITAL HOLDINGS, INC. AND SUBSIDIARIES
NOTES TO CONSOLIDATED FINANCIAL STATEMENTS
FOR THE YEARS ENDED DECEMBER 31, 2005, 2004 and 2003
1. BUSINESS, ORGANIZATION AND OPERATIONS
ACA Capital Holdings, Inc ("ACA Capital"), a Delaware domiciled holding company, is engaged in the business of providing financial guaranty insurance products to participants in the global credit derivatives markets, structured finance capital markets and municipal finance capital markets. We also provide asset management services to specific segments of the structured finance capital markets. The Company's principal activities include financial guaranty insurance of municipal and non-municipal debt obligations, structured credit risk assumption through credit derivatives and collateralized debt obligation asset management. ACA Capital conducts its business through four wholly-owned subsidiaries (collectively, the "Company"). Its financial guaranty business is conducted through ACA Financial Guaranty Corporation ("ACA FG"), a Maryland domiciled insurance company. ACA FG is licensed to conduct insurance business, which provides credit enhancement on municipal and other public finance obligations, in 50 states, the District of Columbia, Guam, the U.S. Virgin Islands and Puerto Rico. Standard & Poor's Corporation has assigned a financial strength rating of "A" to ACA FG. ACA FG also provides the credit support for the Company's structured credit business activities. Through ACA Service LLC, ACA Risk Solutions, LLC and ACA Management, LLC, the Company conducts its collateralized debt obligation asset management business. This business encompasses the origination (in partnership with investment banks), structuring and management of collateralized debt obligations (including collateralized loan obligations and other similarly securitized asset classes, collectively "CDOs").
The Company defines its business as being composed of three distinct continuing lines of business or segments. They are Municipal Finance, Structured Credit and CDO Asset Management. A fourth line of business, Other, includes business in areas and markets in which the Company is no longer active. Although the Municipal Finance and Structured Credit businesses are reported in separate segments, together they form the Company's financial guaranty business. Municipal Finance provides financial guaranty insurance policies guaranteeing the timely payment of scheduled principal and interest on municipal debt obligations. Structured Credit structures and sells credit protection, principally in the form of insured credit swaps ("CDS"), against a variety of asset classes in the institutional fixed income markets. CDO Asset Management focuses on CDO origination, structuring and management. The Company will at times assume risk in the CDOs it manages through investment in some portion of the capital structure.
ACA Capital was originally incorporated in Delaware on January 3, 1997. On November 22, 2002, ACA Capital changed its jurisdiction of incorporation from Delaware to Bermuda. During 2004, the Board of Directors determined that re-domesticating to Delaware would eliminate certain adverse consequences of remaining in Bermuda, facilitate ACA Capital's access to U.S. capital markets, simplify its tax filings, accounting and operation, and reduce the costs of compliance with two sets of filing obligations and laws (as ACA Capital stockholders are U.S. entities and individuals). On September 15, 2004, therefore, ACA Capital re-domesticated from Bermuda to Delaware through a process called a "discontinuation" under Bermuda law and a "domestication" under Delaware law. As a result, it became a Delaware domiciled holding company and changed its name from American Capital Access Holdings, Ltd. to its current name.
F-29
2. SUMMARY OF SIGNIFICANT ACCOUNTING POLICIES
Basis of Presentation—These consolidated financial statements have been prepared in accordance with accounting principles generally accepted in the United States of America, or U.S. GAAP. The preparation of financial statements in conformity with U.S. GAAP requires management to make estimates and assumptions that affect the reported amounts of assets and liabilities and disclosure of contingent assets and liabilities at the date of the financial statements and the reported amounts of revenues and expenses during the reporting periods. Actual results could differ from those estimates.
Certain prior year items have been reclassified to conform to the current year presentation.
Reclassifications—As part of its financial guaranty insurance business, the Company selects, structures and sells credit protection through insured credit swaps in the institutional fixed income markets. The Company generates revenues through the premiums paid by third parties to insure against the risk of default on the assets underlying the credit swaps. In the accompanying consolidated financial statements, the Company has reclassified the credit swap premiums and the related changes in the unearned premium reserve from "Gross premiums written" and "Increase in unearned premium reserve—net" to "Net insured credit swap revenue." The related realized and unrealized gains and losses on insured credit swaps, previously recognized in "Net realized and unrealized gains (losses) on derivative instruments," have also been reclassified to "Net insured credit swap revenue." Management's decision to reclassify these amounts was based on a change in the Company's mix of Structured Credit business from traditional financial guaranty business issued in the form of insurance policies to insured credit swaps. Management also believes that this reclassification will increase comparability of its financial statements with other companies whose primary business is as a participant in the CDS market, particularly as it relates to the Company's Structured Credit line of business.
In certain circumstances, the Company receives premiums on insured credit swap transactions on an upfront basis. Whereas the Company previously recognized premiums received on an upfront basis as "Unearned premiums," such amounts have been reclassified to "Derivative liabilities."
Additionally, in order to be consistent with the Company's reclassification on insured credit swaps, fees earned in connection with uninsured credit swaps of the Company's CDO Asset Management business and the related realized and unrealized gains (losses) included in the Company's financial statements have been reclassified from "Derivative income" and "Net realized and unrealized gains (losses) on derivative instruments," respectively, to "Other net credit swap revenue" in the consolidated statements of operations.
F-30
The effects of these reclassifications on the Company's consolidated balance sheets as of December 31, 2005 and 2004 and related statements of operations and cash flows for the three years in the period ended December 31, 2005 are as follows (dollars in thousands):
| | As of December 31, 2005 | As of December 31, 2004 | ||||||||||
|---|---|---|---|---|---|---|---|---|---|---|---|---|
| | As previously reported | As reclassified | As previously reported | As reclassified | ||||||||
| ASSETS: | ||||||||||||
| Other assets | $ | 33,894 | $ | 27,903 | $ | 22,201 | $ | 22,201 | ||||
| Total assets | $ | 5,798,191 | $ | 5,792,200 | $ | 5,691,961 | $ | 5,691,961 | ||||
LIABILITIES AND STOCKHOLDERS' EQUITY | ||||||||||||
| Unearned premiums | $ | 211,353 | $ | 187,739 | $ | 181,037 | $ | 180,140 | ||||
| Derivative liabilities | 28,915 | 46,538 | 57,858 | 58,755 | ||||||||
| Total liabilities | 5,391,637 | 5,385,646 | 5,306,424 | 5,306,424 | ||||||||
| Total liabilities and stockholders' equity | $ | 5,798,191 | $ | 5,792,200 | $ | 5,691,961 | $ | 5,691,961 | ||||
| | Twelve Months Ended December 31, 2005 | Twelve Months Ended December 31, 2004 | Twelve Months Ended December 31, 2003 | ||||||||||||||||
|---|---|---|---|---|---|---|---|---|---|---|---|---|---|---|---|---|---|---|---|
| | As previously reported | As reclassified | As previously reported | As reclassified | As previously reported | As reclassified | |||||||||||||
| Net premiums written | $ | 91,868 | $ | 41,918 | $ | 56,177 | $ | 45,481 | $ | 62,549 | $ | 57,516 | |||||||
| Increase in unearned premium reserve, net | (31,291 | ) | (8,575 | ) | (16,485 | ) | (15,648 | ) | (38,713 | ) | (38,720 | ) | |||||||
| Premiums earned | 60,577 | 33,343 | 39,692 | 29,833 | 23,836 | 18,796 | |||||||||||||
| Net realized and unrealized gains (losses) on derivatives | (1,719 | ) | 8,410 | 14,840 | 6,520 | 11,074 | 9,124 | ||||||||||||
| Derivative income | 8,623 | — | 8,829 | — | 11,972 | — | |||||||||||||
| Net insured credit swap revenue | — | 21,571 | — | 16,018 | — | 6,841 | |||||||||||||
| Other net credit swap revenue | — | 4,157 | — | 10,990 | — | 12,121 | |||||||||||||
| | Twelve Months Ended December 31, 2005 | Twelve Months Ended December 31, 2004 | Twelve Months Ended December 31, 2003 | ||||||||||||||||
|---|---|---|---|---|---|---|---|---|---|---|---|---|---|---|---|---|---|---|---|
| | As previously reported | As reclassified | As previously reported | As reclassified | As previously reported | As reclassified | |||||||||||||
| CASH FLOWS FROM OPERATING ACTIVITIES: | |||||||||||||||||||
| Unearned premium reserve | $ | 30,316 | $ | 7,599 | $ | 8,700 | $ | 7,803 | $ | 36,115 | $ | 36,115 | |||||||
| Derivative liabilities | — | 16,725 | — | 897 | — | — | |||||||||||||
| Other | (8,461 | ) | (8,461 | ) | (15,563 | ) | (15,563 | ) | (7,954 | ) | (7,954 | ) | |||||||
| Net cash provided by operating activities | 64,438 | 64,438 | 25,070 | 25,070 | 65,993 | 65,993 | |||||||||||||
These adjustments had no impact on net income, earnings per share, cash flows or total stockholders' equity.
F-31
Restatement of Consolidated Statement of Stockholders' Equity for the year ended December 31, 2005—In 2006, the Company determined that it had made a clerical error in the preparation of its consolidated statement of stockholders' equity for the year ended December 31, 2005, which affected individual components of accumulated other comprehensive income (loss). As a result, the following amounts have been restated (dollars in thousands):
| | Accumulated Other Comprehensive Income (Loss) | |||||||
|---|---|---|---|---|---|---|---|---|
| | As Previously Reported | As Restated | ||||||
| BALANCE—December 31, 2004 | $ | 21,952 | $ | 21,952 | ||||
| Comprehensive income: | ||||||||
| Change in unrealized gain on investments, net of change in deferred income taxes of $(1,307) as previously reported and $(10,343) as restated | (2,428 | ) | (19,212 | ) | ||||
| (Loss) gain on derivative hedges, net of change in deferred income taxes of $(4,518) as previously reported and $4,518 as restated | (8,392 | ) | 8,392 | |||||
| BALANCE—December 31, 2005 | $ | 11,132 | $ | 11,132 | ||||
The adjustments had no impact on net income, earnings per share, cash flows or total stockholders' equity.
2003 Financial Statement Restatement—In 2005, prior to completing its 2004 consolidated financials statements, the Company determined that, based on a review of its internal documentation, it improperly accounted for three interest rates swaps in its consolidated CDOs. The improper accounting resulted because the Company did not fully satisfy the contemporaneous documentation and other requirements of FAS 133 necessary to obtain cash flow hedge accounting treatment. As a result, the increase in the fair value of the interest rate swaps aggregating $4.3 million less deferred taxes of $1.5 million that had previously been recorded in accumulated other comprehensive income in stockholders' equity were reclassified to net realized and unrealized gains (losses) on derivative instruments and provision for income tax expense in the consolidated statement of operations for the year ended December 31, 2003. This adjustment had the effect of increasing net income from $17.2 million to $20.0 million. There was no impact on total stockholders' equity or cash flows. On a basic and diluted per share basis, the impact to net income was an increase of $0.44 and $0.21, respectively.
Principles of Consolidation—The consolidated financial statements include the accounts of the Company and its subsidiaries, which includes variable interest entities ("VIEs") that are under the Company's control or where the Company is the primary beneficiary (see Note 4). All significant intercompany accounts and transactions have been eliminated in consolidation.
Investments—The major components of the Company's investment portfolio are the fixed maturity securities of ACA FG and the Company's consolidated CDOs. The Company accounts for its investments in fixed maturity securities in accordance with the FAS 115, "Accounting for Certain
F-32
Investments in Debt and Equity Securities" and Emerging Issues Task Force ("EITF") Issue No. 99-20, "Recognition of Interest Income and Impairment on Purchased and Retained Beneficial Interests in Securitized Financial Assets." Management determines the appropriate classification of securities at the time of purchase. As of December 31, 2005 and 2004, all investments in fixed maturity securities were designated as available-for-sale and were carried at fair value. The difference between fair value and amortized cost of available for sale securities is included in the accumulated other comprehensive income component of stockholders' equity, net of applicable deferred income tax. The fair values of these securities are based on independent market quotations or, when such quotations are not readily available because the securities are infrequently traded in the public market, from internal valuation models. These models include estimates, made by management, which utilize current market information. The valuation results from these models could differ materially from amounts realizable in an open market sale or exchange.
The Company consolidates a VIE whose primary investment is a Guaranteed Investment Contract ("GIC"). In the absence of readily ascertainable market value, GIC contracts are stated at fair value as determined by management. Management considers the GIC's fair value to approximate contract value, which represents cost plus accumulated interest income. If, in the opinion of management, there were an impairment of value based on their credit risk assessment, such impairment would be recorded as an adjustment to the investment. As of December 31, 2005 and 2004, fair value approximates contract value.
Bond discounts and premiums are amortized over the remaining terms of the securities using the effective-yield method. Investment income is recorded as earned. For mortgaged-backed securities and any other holdings for which there is prepayment risk, prepayment assumptions are evaluated at least annually and revised as necessary. Any adjustments required due to the resulting change in effective yields and maturities are recognized currently in the Company's consolidated statements of operations.
Realized gains and losses on the sale of investments are determined on the basis of specific identification and are included in net income.
Other than Temporary Declines in Investments—The Company's process for identifying declines in the fair value of investments that are other than temporary involves consideration of several factors. These factors include (i) the duration of a significant decline in value, (ii) the liquidity, business prospects and overall financial condition of the issuer, (iii) the magnitude of the decline, (iv) the collateral structure and other credit support, as applicable, (v) the Company's intent and ability to hold the investment until the values recover, and (vi) for asset backed securities, the estimated cash flows. When the analysis of the above factors results in a conclusion that a decline in fair values is other than temporary, the cost of the security is written down to fair value as of the reporting date and any previously unrealized loss is realized in the period such a determination is made (see Note 6).
Cash and Cash Equivalents—Cash and cash equivalents include cash on hand, money market accounts and time deposits with banks with original maturities of three months or less. Included in cash and cash equivalents is $106.3 million and $141.3 million in cash of consolidated VIEs at December 31, 2005 and 2004, respectively.
F-33
Restricted Cash—The Company, principally as collateral for certain CDS exposures, has restricted cash on deposit not available for general operating purposes (see Note 21).
Derivative Contracts—All derivative instruments are recognized in the consolidated balance sheet as either assets or liabilities depending on the rights or obligations under the contracts. All derivative instruments are measured at estimated fair value. The fair values of derivative instruments are determined by broker quotes or valuation models when broker quotes are not available. Valuation models include estimates made by management utilizing current market information. The valuation results from these models could differ materially from amounts that would actually be realized in the open market.
The Company has three main types of derivative instruments, each reported in different captions of the consolidated statements of operations. The three types are insured credit swaps, principally recorded in the Structured Credit line of business, credit swaps in consolidated CDOs that are not insured and interest swaps and caps included in consolidated CDOs.
Within the consolidated statements of operations, derivative contracts comprising insured credit swaps are reported as net insured credit swap revenue. Credit swaps issued out of consolidated CDOs that are not insured by ACA FG are reported as other net credit swap revenue. Interest rate swaps and caps, entirely related to the CDO Asset Management segment, are reported as net realized and unrealized gains (losses) on derivative instruments.
The Company uses interest rate swaps to hedge the exposure to variable interest rates within the CDOs it structures and manages. To the extent cash flow hedges are properly designated and are highly effective, gains and losses on interest rate swaps are reported in accumulated other comprehensive income in stockholders' equity, until earnings are affected by the variability in cash flows of the designated hedged item. Hedge effectiveness is assessed quarterly using the Volatility Reduction Measure, an accepted methodology for such analyses. Effective July 1, 2005, the Company met the documentation standards of FAS 133 to qualify these swaps as cash flow hedges for accounting purposes on a prospective basis. Based on the Company's effectiveness assessment methodology, the hedges have been deemed highly effective since designation. Prior to July 1, 2005, the Company had not met the documentation standards to achieve cash flow hedge accounting as required by FAS 133. As a result, these derivative contracts were not designated as cash flow hedges and the associated mark to market adjustments were included in the Company's consolidated statements of operations.
Furniture and Equipment—Furniture and equipment are recorded at cost less accumulated depreciation and amortization. Depreciation is computed using the straight-line method over the estimated useful lives of the assets, which range from three to five years. Furniture and equipment held under capital leases and leasehold improvements are amortized over the shorter of the estimated lives of the assets or the related lease term. These items are reported in Other assets on the Company's consolidated balance sheets.
Capitalization of Software—The Company accounts for the capitalization of certain internally developed software costs in accordance with Statement of Position 98-1, "Accounting for the Costs of Computer Software Developed or Obtained for Internal Use." These costs are amortized over their
F-34
estimated useful life, which is five years, commencing upon the determination of the software being ready for its intended use.
Premiums Earned—Premiums on financial guaranty insurance products in the form of traditional insurance policies are typically received on an upfront basis, although certain policies pay premium in periodic installments. The vast majority of the Company's Municipal Finance business is conducted by the issuance of traditional policies. Traditional policies are those that meet the scope exception of the guidance of FAS 133, paragraph 10d, as amended by FAS 149, "Amendment of Statement 133 on Derivative Instruments and Hedging Activities." The scope exception provides that financial guaranty contracts are not subject to FAS 133, if they meet certain specified criteria. In general, premiums from insured municipal obligations are received on an upfront basis. Installment premiums are earned over each installment period, which is generally one year or less. Upfront premiums are earned in proportion to the expiration of risk, which is par. Premium is allocated to each par maturity (e.g., principal payment) included in an insured bond and earned on a straight-line basis for the period the related par is outstanding. Unearned premiums represent that portion of premiums which is applicable to coverage of risk to be provided in the future on policies in-force. When an insured issue is retired or defeased prior to the end of the expected period of coverage, the remaining unearned premiums, less any amount credited to a refunding issue insured by the Company, are recognized as earned premium. The amounts earned from refundings were approximately $6.6 million, $1.8 million and $0.4 million, in 2005, 2004 and 2003, respectively.
Net Insured Credit Swap Revenue—The Company's net insured credit swap revenue is comprised of credit swap transactions in which the Company provides credit protection through the use of credit swaps that are insured by ACA FG. Net insured credit swap revenue includes insured credit swap premiums earned and realized and unrealized gains and losses on those credit swaps. Insured credit swap premiums are earned over the life of the transaction. Realized gains and losses occur due to the occurrence of termination events or credit events requiring payment to or by the Company under the credit swap. Unrealized gains and losses represent the changes in fair value of the instruments that are required to be recorded under FAS 133. Obtaining the fair value (as such term is defined in FAS 133) for such instruments requires the use of management judgment. These instruments are valued using pricing models based on the net present value of expected future cash flows and observed prices for other transactions bearing similar risk characteristics. The fair value of these instruments is included in derivative assets or derivative liabilities. The Company does not believe that its credit swaps meet the scope exception of FAS 133 paragraph 10d, as amended by FAS 149, because there is no contractual requirement that the protection purchaser be exposed to the underlying risk.
Fee Income Revenue Recognition—The Company receives fees in connection with each of its businesses, although the vast majority comes from its CDO business. As part of the CDO business, the Company is paid management and structuring fees as well as warehouse income. Management fees represent remuneration for the Company's role as asset manager of CDO collateral and are typically received and earned on a quarterly basis. Structuring fees are payments for the Company's role in structuring a CDO prior to its close. Structuring fees are typically contingent on the closing of the CDO and as such are earned upon the transaction close. Warehouse income represents remuneration for the selection and management of CDO collateral prior to a transaction closing. Warehouse income is earned over the life of the particular warehousing period.
F-35
With respect to its municipal business, the Company also collects fees in connection with waivers and consents granted to bond obligors as well as to reimburse it for costs incurred with insuring municipal secondary-market transactions, primarily rating agency costs. These fees are recognized by the Company as fee income, while the associated costs are recognized as other operating expenses, when the transaction has been closed.
Other Net Credit Swap Revenue—Revenues from credit swap fees from CDS of a consolidated CDS CDO and other credit derivative fees are earned over the life of the underlying transactions and recognized in other net credit swap revenue. Other net credit swap revenue also includes related net realized gains and losses as well as net unrealized gains and losses resulting from the changes in fair value associated with these CDS (see Note 4).
Policy Acquisition Costs—Policy acquisition costs include those expenses that relate primarily to and vary with premium production. Such costs are comprised primarily of premium taxes, personnel and personnel-related expenses of individuals involved in marketing and underwriting, and certain rating-agency and legal fees for municipal and non-derivative structured finance business. The present value of anticipated claims and claim adjustment expenses are considered in determining the recoverability of acquisition costs (see Note 7). Net acquisition costs are deferred and amortized over the period in which the related premiums are earned. No costs are deferred in connection with the Company's insured credit swap transactions.
Deferred Debt Issuance Costs—Costs to issue debt, including debt of consolidated CDOs, are deferred and amortized over the estimated life of the debt, which normally ranges from five to ten years. Such costs include debt placement fees, legal fees, rating agency fees and external advisory fees. The amortization of these costs is included in depreciation and amortization expense.
Losses and Loss Adjustment Expenses—Financial guaranty loss and loss adjustment expense reserves are established on the Company's non-derivative exposure in an amount equal to the Company's estimate of identified or case-specific reserves and non-specific reserves, including cost of settlement, on the obligations it has incurred. In determining its accounting policy for loss reserves, the Company relies primarily on FAS 60, "Accounting and Reporting by Insurance Enterprises." However, FAS 60 was created when the financial guaranty industry was just beginning. As a result, FAS 60 did not contemplate the specific attributes of financial guaranty insurance. In particular, financial guaranty insurance is considered a short-duration insurance product, however, it has features that are more akin to long-duration contracts in that the term of some insured obligations can be as long as 30 years or more and the contracts are generally irrevocable. Under FAS 60, accounting for losses differs for short-duration and long-duration contracts. Because of this inconsistency, the Company also applies FAS 5, "Accounting for Contingencies," in the determination of its loss reserves. Specifically, FAS 5 requires the establishment of reserves when it is probable that a liability has been incurred at the reporting date to the extent the loss can be reasonably estimated. The Company understands that methods of determining non-specific reserves vary within the financial guaranty industry and that the Securities and Exchange Commission has questioned the publicly traded financial guaranty companies about the differences in methods across the industry. As a result of that discussion, FASB is considering whether additional accounting guidance is necessary to address the financial guaranty industry. It is possible that as a result of FASB's deliberations, the financial guaranty industry, including the Company, may have to
F-36
change aspects of its accounting policies in this regard. Any proposed and final documents are expected to be issued later in 2006.
Case specific reserves are those obligations identified as currently or likely to be in default, and represent the present value, discounted at the U.S. Treasury Note rate applicable to the term of the expected default, of the expected loss and loss adjustment expense ("LAE") payments, net of estimated recoveries (under salvage and subrogation rights). Gross case-specific reserves, net of salvage, were $17.7 million and $25.7 million as of December 31, 2005 and 2004, respectively.
Beginning in 2004, the non-specific reserve is derived from the calculation of expected loss, which is estimated using a Monte Carlo simulation. A Monte Carlo simulation is a mathematical technique that is commonly used to estimate the probability of certain mathematical outcomes. It randomly selects values to create scenarios of outcomes and this random selection process is repeated many times to create multiple scenarios. Each time a value is randomly selected, it forms one possible scenario and outcome. Together, these scenarios give a range of possible outcomes, some of which are more probable and some less probable. By definition, the average solution will give the most likely potential outcome. The Company's risk management area typically runs at least 100,000 trials in order to determine future expected losses for the Company's financial guaranty business. The model uses the current ratings and default frequency (net of recovery) applied to each transaction with outstanding exposure to determine the expected probability distribution of loss. Default frequency and recovery amounts are published periodically by each of the major rating agencies. From the model output, the Company can estimate a range of expected loss. The amount of non-specific reserve recorded in the financial statements is based on the loss ratio resulting from the calculation of total losses, including past incurred losses and expected future losses divided by premium. For this purpose, premium is defined as ever to date written premium plus future installment premium on closed transactions. This derived loss ratio is applied to ever to date earned premiums. Case specific reserves are subtracted from this amount to arrive at net non-specific reserves. At December 31, 2005 and 2004, non-specific reserves were $16.6 million and $10.3 million, respectively. These reserves were for our Municipal Finance insured exposure.
Prior to 2004, non-specific reserves were established on non-derivative financial guaranty transactions using a constant loss ratio factor. The constant loss factor was determined based upon an independent rating agency study of historical corporate and municipal default rates and our portfolio characteristics and history. The methodology change in 2004 represented a change in accounting estimate.
Management periodically evaluates the estimates for losses and LAE and any resulting changes are reflected in current year earnings. Management believes the reserving methodology and resulting reserves are adequate to cover the ultimate net cost of claims. However, the reserves are based upon estimates and there can be no assurance that any ultimate liability will not exceed such estimates.
Intangibles—The Company purchased all of the outstanding common stock of ACA FG on September 24, 1997. The acquisition was accounted for as a purchase and the price was allocated to the fair market value of the investments acquired of $15.1 million. In addition to the investments acquired, the Company paid $5.5 million for 54 certificates of authority (licenses) to transact financial guaranty insurance in 50 states, the District of Columbia, Guam, the U.S. Virgin Islands and Puerto Rico. The
F-37
licenses through 2001 were being amortized over a 40-year life, beginning with ACA FG's commencement of operations on September 24, 1997.
Effective January 1, 2002, the Company adopted FAS No. 142, "Goodwill and Other Intangible Assets" ("FAS 142"). FAS 142 requires that an entity no longer amortize intangible assets that have an indefinite life but rather test for impairment losses on an annual basis. The Company believes these licenses have an indefinite life and therefore ceased amortizing them commensurate with its adoption of FAS 142. The Company's annual assessment for impairment involves a two-step process whereby an initial assessment for potential impairment is performed, followed by a measurement of the amount of impairment, if any. To date, the Company has not recorded an impairment loss. The unamortized balance of these licenses at December 31, 2005 and 2004 was $4.9 million.
Income Taxes—The Company recognizes deferred tax assets and liabilities for the expected future tax consequences of events that have been included in the consolidated financial statements or tax returns.
Deferred tax assets and liabilities are determined based on the difference between the financial statement and tax bases of assets and liabilities using enacted tax rates in effect for the year in which the differences are expected to reverse. The effect on tax assets and liabilities of a change in tax rates is recognized in income in the period that includes the enactment date. The Company provides a valuation allowance on its gross deferred tax assets when it is more likely than not that such assets will not be realized. The Company did not provide a valuation allowance as of December 31, 2005 and 2004 (see Note 11).
Stock Compensation Plan—The Company applies Accounting Principles Board ("APB") Opinion No. 25 and related interpretations in accounting for its Incentive Compensation Plan and accounts for stock-based compensation under the intrinsic value method. The Company adopted the disclosure requirements of FAS No. 123, "Accounting for Stock-Based Compensation" ("FAS 123"). FAS 123 defines a "fair value based method" of accounting for stock-based compensation. Under the fair value based method, compensation cost is measured based on the fair value of the award and is recognized over the service period.
Had compensation expense been determined for stock options granted to employees based on the fair value of the options at the grant dates consistent with the method of accounting under FAS 123,
F-38
the Company's net income would have decreased as follows (see Note 14) (dollars in thousands, except per share amounts):
| | Years Ended December 31, | ||||||||||
|---|---|---|---|---|---|---|---|---|---|---|---|
| | 2005 | 2004 | 2003 | ||||||||
| Net income (loss) as reported | $ | 28,760 | $ | (3,789 | ) | $ | 19,967 | ||||
| Share-based employee compensation | |||||||||||
| cost, net of related tax effects | (293 | ) | (26 | ) | (571 | ) | |||||
| Pro forma net income (loss) | $ | 28,467 | $ | (3,815 | ) | $ | 19,396 | ||||
| Basic earnings per share | |||||||||||
| As reported | $ | 1.26 | $ | (0.61 | ) | $ | 3.18 | ||||
| Pro forma | $ | 1.25 | $ | (0.62 | ) | $ | 3.09 | ||||
Diluted earnings per share | |||||||||||
| As reported | $ | 0.96 | $ | (0.61 | ) | $ | 1.51 | ||||
| Pro forma | $ | 0.95 | $ | (0.62 | ) | $ | 1.46 | ||||
On December 16, 2004, the FASB issued FAS 123(R), "Share-Based Payment," which will require compensation costs related to share-based payment transactions to be recognized in the financial statements. With limited exceptions, the amount of compensation cost will be measured based on the grant-date fair value of the equity or liability instruments issued. In addition, liability awards will be re-measured each reporting period. Compensation cost will be recognized over the period that an employee provides service in exchange for the award. The requirements of FAS 123(R) for nonpublic companies will be effective as of the beginning of the first annual reporting period after December 15, 2005. In management's opinion, FAS 123(R) will not have a material effect on the Company's consolidated financial statements. In accordance with FAS 123(R), the Company will commence expensing of stock based compensation January 1, 2006.
Earnings Per Share—Basic earnings per share is calculated using the weighted average shares outstanding. All potentially dilutive securities including unvested stock options and convertible securities, other than participating convertible stock, are excluded from the basic earnings per share calculation. Participating convertible stock consists of series A, B and C senior convertible preferred stock. The participating convertible stockholders participate equally with the common stockholders in dividends declared. However, holders of participating convertible stock are not required to fund Company losses, nor is the contractual principal of these securities reduced as a result of losses incurred by the Company.
In accordance with EITF 03-6, "Participating Securities and the Two-Class Method under FASB Statement No. 128, 'Earnings Per Share,"' the participating preferred stock are considered participating securities requiring the use of the two-class method for computation of basic earnings per share. The two-class method for each period reflects the cash dividends paid per share class of stock, if any, plus the amount of allocated undistributed earnings per share computed using the participation percentage which reflects the dividend rights of each class of stock. The shares of participating convertible stock are considered to be participating convertible securities since the shares of series A, B and C senior convertible preferred stock are convertible on a share-for-share basis into shares of common stock.
F-39
Diluted earnings per share have been computed assuming the conversion of the series A, B and C senior convertible preferred stock into shares of common stock as of the beginning of each period.
In calculating diluted earnings per share, the weighted average shares outstanding is increased to include all potentially dilutive securities. Basic and diluted earnings per share are calculated by dividing net income available to stockholders by the applicable weighted average number of shares outstanding during the year (see Note 23).
3. RELEVANT RECENT ACCOUNTING PRONOUNCEMENTS
In May 2005, the FASB issued FAS 154, "Accounting Changes and Error Corrections." This pronouncement changes the requirements for the accounting and reporting of a change in accounting principle. This statement applies to all voluntary changes in accounting principle as well as to changes required by an accounting pronouncement that does not include specific transition provisions. This statement eliminates the requirement in APB No. 20, "Accounting Changes," to include the cumulative effect of changes in accounting principle in the statement of operations in the period of change. Instead, to enhance the comparability of prior period financial statements, FAS 154 requires that changes in accounting principle be retroactively applied, with the cumulative effect of the accounting principle reflected as an asset or liability and an offsetting adjustment to retained earnings in the first period presented as if that accounting principle had always been used. Each subsequent period presented is then adjusted to reflect the period specific effects of applying the change. The implementation of this statement did not have a material impact on the Company's consolidated financial statements.
In November 2005, the FASB released Staff Position Nos. FAS 115-1 and FAS 124-1, "The Meaning of Other-Than-Temporary Impairment and Its Application to Certain Investments." This pronouncement addresses the determination as to when an investment is considered impaired, whether that impairment is other than temporary, and the measurement of an impairment loss. It also includes accounting considerations subsequent to the recognition of an other-than-temporary impairment and requires certain disclosures about unrealized losses that have not been recognized as other-than-temporary impairments. The implementation of this pronouncement is not expected to have a material impact on the Company's consolidated financial statements.
In September 2005, the AICPA issued Statement of Position ("SOP") 05-1, "Accounting by Insurance Enterprises for Deferred Acquisition Costs in Connection with Modifications or Exchanges of Insurance Contracts." SOP 05-1 provides guidance on accounting by insurance enterprises for deferred acquisition costs on internal replacements of many types of insurance and investment contracts, including those covered by FAS 60. Contract modifications meeting all of the conditions set out in SOP 05-1 result in a replacement contract that is substantially unchanged from the replaced contract and a contract that is accounted for as a continuation of the replaced contract. The modifications would otherwise trigger accounting as if the original contract was extinguished and replaced by a new contract, with unamortized deferred acquisition costs, unearned revenue liabilities and deferred sales inducements associated with the original contract recognized currently in income. The implementation of this pronouncement is not expected to have a material impact on the Company's consolidated financial statements.
F-40
In February 2006, the FASB issued FAS No. 155, "Accounting for Certain Hybrid Financial Instruments," an amendment of FAS 133 and 140. FAS 155 (i) permits fair value remeasurement for any hybrid financial instrument that contains an embedded derivative that otherwise would require bifurcation, (ii) clarifies which interest-only strips and principal-only strips are not subject to the requirements of FAS 133, (iii) clarifies that concentrations of credit risk in the form of subordination are not embedded derivatives and, (iv) amends FAS 140 to eliminate the exemption from applying the requirements of FAS 133 on a qualifying special-purpose entity from holding a derivative financial instrument that pertains to a beneficial interest other than another derivative financial instrument. FAS 155 is effective for all financial instruments acquired or issued after the beginning of an entity's first fiscal year that begins after September 15, 2006. Management will implement the requirements of FAS 155 after its effective date, as applicable. Since this guidance is applicable to future transactions, its effect on the consolidated financial statements can not be estimated.
In March 2006, the FASB issued FAS No. 156, "Accounting for Servicing of Financial Assets," an amendment of FAS No. 140, "Accounting for Transfers and Servicing of Financial Assets and Extinguishments of Liabilities." FAS 156 requires all separately recognized servicing assets and servicing liabilities be initially measured at fair value, if practicable, and permits for subsequent measurement using either fair value measurement with changes in fair value reflected in earnings or the amortization and impairment requirements of FAS 140. The subsequent measurement of separately recognized servicing assets and servicing liabilities at fair value eliminates the necessity for entities that manage the risks inherent in servicing assets and servicing liabilities with derivatives to qualify for hedge accounting treatment and eliminates the characterization of declines in fair value as impairments or direct write-downs. FAS 156 is effective for an entity's first fiscal year beginning after September 15, 2006. The implementation of this pronouncement is not expected to have a material impact on the Company's consolidated financial statements.
4. CDO ASSET MANAGEMENT BUSINESS AND RELATED DERIVATIVE ACTIVITY
One of the ways the Company participates in the structured finance market is through structuring and managing CDOs originated in collaboration with investment banks. CDOs can be issued in funded, unfunded or partially funded form. Funded CDOs issue debt instruments and purchase investment assets, while unfunded CDOs synthetically acquire assets and issue liabilities (i.e., assets and liabilities are in derivative form). Partially funded CDOs are a combination of these two forms. From an accounting perspective, funded and partially funded CDOs are determined to be VIEs. Each time such CDOs are formed, the Company performs an analysis to determine whether it is the primary beneficiary and thus required to consolidate the CDO under the provisions of FIN 46(R).
F-41
The following table lists each of the Company's CDOs outstanding as of December 31, 2005 (dollars in millions):
| Year Deal Closed | Deal Name | Notional Deal Size | Retained Equity | Retained Equity % | Exposure Type | Deal Type | Consolidated | |||||||||
|---|---|---|---|---|---|---|---|---|---|---|---|---|---|---|---|---|
| 2002 | ACA CDS 2001-1 | $ | 1,000 | $ | 22.5 | 100 | % | Investment grade—corporate | Unfunded | No | ||||||
| 2002 | ACA CDS 2002-1 | $ | 1,000 | $ | 22.0 | 100 | % | Investment grade—corporate | Partially funded | Yes | ||||||
| 2002 | ACA ABS 2002-1 | $ | 400 | $ | 18.0 | 100 | % | Investment grade—ABS | Funded | Yes | ||||||
| 2003 | ACA CDS 2002-2 | $ | 1,000 | $ | 25.0 | 100 | % | Investment grade—corporate | Unfunded | No | ||||||
| 2003 | ACA ABS 2003-1 | $ | 400 | $ | 18.0 | 100 | % | Investment grade—ABS | Funded | Yes | ||||||
| 2003 | Grenadier | $ | 1,500 | $ | 22.5 | 100 | % | High-grade—ABS | Funded | Yes | ||||||
| 2003 | ACA ABS 2003-2 | $ | 725 | $ | 33.5 | 100 | % | Investment grade—ABS | Funded | Yes | ||||||
| 2004 | ACA ABS 2004-1 | $ | 450 | $ | 10.0 | 61 | % | Investment grade—ABS | Funded | Yes | ||||||
| 2004 | Zenith Funding | $ | 1,500 | $ | 13.0 | 52 | % | High-grade—ABS | Funded | Yes | ||||||
| 2005 | ACA ABS 2005-1 | $ | 452 | $ | 4.4 | 24 | % | Investment grade—ABS | Funded | No | ||||||
| 2005 | ACA CLO 2005-1 | $ | 300 | $ | 5.0 | 21 | % | Leveraged loans | Funded | No | ||||||
| 2005 | ACA ABS 2005-2 | $ | 450 | $ | 2.3 | 10 | % | Investment grade—ABS | Funded | No | ||||||
| 2005 | Khaleej II | $ | 750 | $ | 5.6 | 14 | % | Investment grade—ABS | Partially funded | No | ||||||
In connection with its engagement as asset manager, the Company typically retains a portion of the equity in such CDOs. Prior to June 2004, the Company retained the entire or the majority of the equity position in its funded CDOs and they are consolidated in the financial statements. A total of seven consolidated CDOs were issued in 2002 through 2004; comprised of six asset-backed security ("ABS") CDOs and one partially funded corporate credit swap CDO. The funded portions of this latter CDO are reflected as a guaranteed investment contract and debt in the Company's consolidated financial statements, while the unfunded portions are treated as credit swaps or derivative contracts under FAS 133. CDO debt outstanding in the Company's consolidated financial statements represents non-recourse debt to the Company that is supported only by the associated assets of the CDO. Likewise, the Company does not have the right to use VIE assets for general operations. The Company's ultimate exposure in respect to losses on the assets purchased by a CDO is limited to the amount of its equity investment in that CDO. In those instances where the Company owns less than 100% of the CDO VIE's equity, but is the primary beneficiary and thus consolidates the CDO VIE, it establishes minority interests for the unowned portion. Two of the six asset-backed security CDOs mentioned above include minority interests. Total non-recourse debt of the CDOs included on the Company's consolidated balance sheets at December 31, 2005 and 2004 was $4,833.2 million and
F-42
$4,765.0 million, respectively. The Company receives insurance premiums, asset management and structuring fees, and equity residual flows from the VIEs that are eliminated in consolidation.
During 2005, the Company retained less than a majority share of the equity position in each of its four newly issued CDOs (two ABS CDOs, one partially funded ABS credit swap CDO and one collateralized loan obligation) and based on FIN46(R) analyses is not deemed to be the primary beneficiary. As a result, these CDOs are not consolidated in the Company's financial statements. Rather, the Company's non-majority investment is recorded as an investment in a single fixed maturity security under the provisions of FAS 115 and EITF 99-20. The total investment in these CDOs included in consolidated assets at December 31, 2005 was $16.0 million. Additionally, the Company has been engaged to act as asset manager to third-party CDOs not originated and structured by the Company for which it receives asset management fees.
As part of its CDO asset management business, the Company enters into warehouse facility agreements for the purpose of accumulating securities for potential CDO transactions. In general, though the specific structures may vary, the warehouse facility is a legal agreement designed to provide for CDO VIE purchases of the warehoused assets at their original cost from a third-party, plus the losses or minus the gains of any interest rate hedges on the fixed rate securities during the warehousing period, as applicable. The Company enters into these agreements to ensure that assets selected will ultimately be delivered with the desired credit spread to meet the return objectives of the CDO. On closure of the CDO transaction (and warehousing period), the VIE uses the proceeds from the issuance of notes to purchase the warehoused assets. The Company generally receives a fee for managing the warehoused assets. From an accounting perspective, when the Company is the primary beneficiary of the CDO VIE and thus required to consolidate it, the warehouse facility agreement represents a forward commitment to purchase assets that is marked to market under the provisions of FAS 133 and 149. This does not apply when the Company is not deemed to be the primary beneficiary of the CDO VIE. During 2005, 2004 and 2003, the Company recognized net realized gains of $0 million, net realized losses of $(0.6) million and net realized and unrealized gains of $4.3 million, respectively, under warehouse facility agreements. Warehouse fees received by the Company totaled $2.4 million, $1.4 million and $4.6 million in 2005, 2004 and 2003, respectively, and are included in fee income.
At December 31, 2005, the Company had three CDOs in the warehouse phase. Two transactions will be funded ABS CDOs while the third will be a funded collateralized loan obligation transaction. These transactions are expected to close in 2006. In each transaction the Company is obligated to purchase no more than 25% of the equity and is not expected to be the primary beneficiary of the related VIE; therefore, these VIE's will not be consolidated in the Company's financial statements.
The impact of a CDO on the Company's consolidated financial statements depends on the structure of the CDO (fully funded, partially funded or unfunded), whether or not the CDO is consolidated and the nature of the underlying assets and liabilities.
Fully funded CDOs contain investments in interest bearing financial assets such as fixed maturity securities or guaranteed investment contracts. The Company has six fully funded and one partially funded CDO that are consolidated. The assets and liabilities of these CDOs are included in our balance sheets. The income generated by the investments is reflected in net investment income in the
F-43
consolidated statements of operations. The debt liabilities issued in the form of notes pay interest that is also included in interest expense in the consolidated statements of operations. A management fee is paid by the CDO to ACA Management, L.L.C. that is eliminated in consolidation. The return on the Company's equity is represented by the net of the CDO's revenue (interest income) and the CDO's expenses including management expenses paid to ACA Management, L.L.C.
Partially funded synthetic CDOs sell credit protection on referenced assets by entering into credit swaps with various protection buyers in the market. The CDO also issues securities, both liabilities and equities, in order to use the proceeds from the sale of these securities to collateralize the CDO's obligations under its credit swaps, except with respect to the most senior tranche of the CDO's credit exposure, in connection with which a partially funded CDO typically purchases credit protection rather than issuing funded liability securities. The proceeds of the securities issued by the partially funded CDO are invested in a guaranteed investment contract, or GIC. The Company has one partially funded CDS CDO that is consolidated. From this consolidated CDO, the Company consolidates investment income, relating to the return on the GIC, and interest expense in connection with the liability securities issued by the CDO. The Company also consolidates derivative income relating to net revenues from the fixed fees payable to the CDO under the terms of the credit swaps pursuant to which the CDS CDO sold credit protection on referenced assets and the fixed fees payable by the CDO on the credit protection that it purchased. This income is reflected in the consolidated statements of operations as other net credit swap revenue. This income is used to pay the interest on the liabilities of the CDO and other expenses of the CDO, including the management fee. Similar to the fully funded and consolidated CDOs, all management fees in this partially funded CDS CDO are eliminated in consolidation. The return on the Company's equity is represented by the net of the CDO's revenue (interest income and derivative income) less the CDO's expenses, including management fees paid to ACA Management, L.L.C.
For funded unconsolidated CDOs, the Company reflects management fees and investment income in its consolidated statements of operations. In these instances, the investment income recorded is only on the equity investment made by the Company as compared to all of the assets in a consolidated CDO. Partially funded, unconsolidated CDOs in which the Company invests in the funded equity securities are reflected in the Company's consolidated financial statements in the same way as funded unconsolidated CDOs.
The Company originated a fully synthetic, or unfunded, CDS CDO in each of 2002 and 2003. In these transactions, the Company acts as asset manager and, through ACA FG, insures the equity or first loss position of the CDO. No SPEs are created and, therefore, no variable interest entities, or VIEs, exist in these structures; rather, the sponsoring investment bank acts as the counterparty in the various credit swaps that constitute the assets and liabilities of the synthetic CDO. CDOs that do not use SPEs are not subject to consolidation under FIN 46(R). For its various roles in the unfunded CDS CDOs, the Company receives structuring fees, management fees, premium and residual equity returns. In the Company's consolidated statements of operations, these revenues are reflected as fee income, net insured credit swap revenue and other net credit swap revenue. Net insured credit swap revenue also includes the changes in fair value of the related credit swaps. The combined equity position of the Company in its two unfunded CDS CDOs, which is the aggregate notional balance of the Company's
F-44
credit swaps insuring the equity tranches of these two CDOs, was $47.5 million at December 31, 2005 and 2004.
In certain funded CDOs, the Company issued liabilities in the form of notes in order to fund its equity purchases. These borrowings were accomplished through the issuance of non-recourse notes by subsidiaries of the Company. These notes are insured as to the repayment of principal and interest by ACA FG. The premium on the policy insuring the notes payable to ACA FG is payable by the Company's subsidiary that invested in the preferred shares. These subsidiaries and ACA FG are wholly owned by the Company and therefore this inter-company premium is eliminated in consolidation.
5. NET INSURED CREDIT SWAP REVENUE AND OTHER NET CREDIT SWAP REVENUE
Net insured credit swap revenue includes insured credit swap premiums earned for credit protection the Company has sold under its insured credit swaps, as well as realized and unrealized gains and losses related to those transactions. Realized losses arise upon the occurrence of credit events requiring payment by the Company under the related credit swap and, additionally, realized gains or losses could occur if a transaction is terminated in advance of its scheduled termination date. Unrealized gains and losses represent the adjustments for changes in fair value that are required to be recorded in each reporting period under FAS 133. The fair value of insured credit swaps are recorded as either a derivative liability or derivative asset on the consolidated balance sheets.
The following table disaggregates net insured credit swap revenue into its component parts for the periods ended December 31, 2005, 2004 and 2003 (dollars in thousands):
| | For the year ended December 31, | |||||||||||
|---|---|---|---|---|---|---|---|---|---|---|---|---|
| | 2005 | 2004 | 2003 | |||||||||
| Net insured credit swap revenue | ||||||||||||
| Insured credit swap premiums earned | $ | 27,234 | $ | 9,858 | $ | 5,040 | ||||||
| Realized gains (losses) on insured credit swaps | — | — | — | |||||||||
| Unrealized gains (losses) on insured credit swaps | (5,663 | ) | 6,160 | 1,801 | ||||||||
| Total net insured credit swap revenue | $ | 21,571 | $ | 16,018 | $ | 6,841 | ||||||
Other net credit swap revenue principally includes revenues received from a partially funded CDS CDO in which the CDS CDO sells credit protection under credit swaps for which it receives fixed quarterly fees, together with the related realized and unrealized gains (losses) (see Note 4). These revenues are consolidated in the Company's consolidated statements of operations.
F-45
The following table disaggregates other net credit swap revenue into its component parts for the periods ended December 31, 2005, 2004 and 2003 (dollars in thousands):
| | For the year ended December 31, | ||||||||||
|---|---|---|---|---|---|---|---|---|---|---|---|
| | 2005 | 2004 | 2003 | ||||||||
| Other net credit swap revenue | |||||||||||
| Credit swap fees earned | $ | 8,623 | $ | 8,830 | $ | 11,972 | |||||
| Realized losses on credit swaps | (3,295 | ) | — | — | |||||||
| Unrealized gains (losses) on credit swaps | (1,171 | ) | 2,160 | 149 | |||||||
| Total other net credit swap revenue | $ | 4,157 | $ | 10,990 | $ | 12,121 | |||||
6. INVESTMENTS
The amortized cost and estimated fair value of fixed maturity securities were as follows (dollars in thousands):
| | December 31, 2005 | ||||||||||||
|---|---|---|---|---|---|---|---|---|---|---|---|---|---|
| | Amortized Cost | Gross Unrealized Gains | Gross Unrealized Losses | Estimated Fair Value | |||||||||
| Available for sale-non-VIE: | |||||||||||||
| U.S. treasury securities | $ | 56,911 | $ | 26 | $ | (1,361 | ) | $ | 55,576 | ||||
| Federal-agency securities | 46,952 | 3 | (594 | ) | 46,361 | ||||||||
| Obligations of sales and political subdivisions | 121,714 | 463 | (1,299 | ) | 120,878 | ||||||||
| Corporate securities | 108,435 | 213 | (2,060 | ) | 106,588 | ||||||||
| Asset-backed securities | 11,496 | — | (83 | ) | 11,413 | ||||||||
| Mortgage-backed securities | 149,430 | 152 | (2,624 | ) | 146,958 | ||||||||
| Total non-VIE Securities | 494,938 | 857 | (8,021 | ) | 487,774 | ||||||||
| Available for sale-VIE— Asset-backed securities | 4,797,143 | 28,672 | (14,850 | ) | 4,810,965 | ||||||||
| Total | $ | 5,292,081 | $ | 29,529 | $ | (22,871 | ) | $ | 5,298,739 | ||||
F-46
| | December 31, 2004 | ||||||||||||
|---|---|---|---|---|---|---|---|---|---|---|---|---|---|
| | Amortized Cost | Gross Unrealized Gains | Gross Unrealized Losses | Estimated Fair Value | |||||||||
| Available for sale-non-VIE: | |||||||||||||
| U.S. treasury securities | $ | 86,626 | $ | 655 | $ | (649 | ) | $ | 86,632 | ||||
| Federal-agency securities | 31,639 | 283 | (93 | ) | 31,829 | ||||||||
| Obligations of sales and political subdivisions | 28,374 | 708 | (216 | ) | 28,866 | ||||||||
| Corporate securities | 106,345 | 799 | (156 | ) | 106,988 | ||||||||
| Asset-backed securities | 19,096 | 128 | (25 | ) | 19,199 | ||||||||
| Mortgage-backed securities | 147,667 | 206 | (478 | ) | 147,395 | ||||||||
| Total non-VIE Securities | 419,747 | 2,779 | (1,617 | ) | 420,909 | ||||||||
| Available for sale-VIE— Asset-backed securities | 4,696,221 | 41,276 | (5,307 | ) | 4,732,190 | ||||||||
| Total | $ | 5,115,968 | $ | 44,055 | $ | (6,924 | ) | $ | 5,153,099 | ||||
The amortized cost and estimated fair value of fixed maturity securities at December 31, 2005, by contractual maturity, is shown below (dollars in thousands):
| | Non-VIE Securities | VIE Securities | Total | |||||||||||||||
|---|---|---|---|---|---|---|---|---|---|---|---|---|---|---|---|---|---|---|
| | Amortized Cost | Estimated Fair Value | Amortized Cost | Estimated Fair Value | Amortized Cost | Estimated Fair Value | ||||||||||||
| Available for sale: | ||||||||||||||||||
| Due in one year or less | $ | 33,558 | $ | 32,939 | $ | 15,000 | $ | 15,462 | $ | 48,558 | $ | 48,401 | ||||||
| Due after one year through five years | 87,272 | 85,569 | 180,660 | 182,247 | 267,932 | 267,816 | ||||||||||||
| Due after five years through ten years | 138,208 | 136,844 | 440,728 | 444,742 | 578,936 | 581,586 | ||||||||||||
| Due after ten years | 235,900 | 232,422 | 4,160,755 | 4,168,514 | 4,396,655 | 4,400,936 | ||||||||||||
| Total | $ | 494,938 | $ | 487,774 | $ | 4,797,143 | $ | 4,810,965 | $ | 5,292,081 | $ | 5,298,739 | ||||||
Actual maturities could differ from contractual maturities because borrowers have the right to call or prepay certain obligations which may or may not include call or prepayment penalties.
Total proceeds from the sale of fixed maturity securities during 2005, 2004 and 2003 were $188.0 million, $349.7 million and $684.4 million, respectively; of these amounts $20.2 million, $141.2 million and $71.6 million, respectively, were VIE security sales. Total gross gains of $0.5 million, $2.1 million and $9.0 million and total gross losses of $0.8 million, $1.2 million and $5.0 million were realized on security sales in 2005, 2004 and 2003, respectively. Gross gains of $0.1 million, $0.7 million and $0.5 million and gross losses of $0 million, $0.1 million and $1.1 million, respectively, were related to VIE securities. In addition, the Company recognized approximately $2.5 million, $7.4 million and $0.8 million in other than temporary declines during 2005, 2004 and 2003, respectively. Of these write-
F-47
downs $2.0 million, $6.9 million and $0.8 million related to the Company's VIE securities in 2005, 2004, and 2003, respectively.
The following table summarizes, for all securities in an unrealized loss position at December 31, 2005, the aggregate fair value and gross unrealized loss by length of time the amounts have continuously been in an unrealized loss position (dollars in thousands):
| | Less than 12 months | 12 months or more | | | ||||||||||||||||
|---|---|---|---|---|---|---|---|---|---|---|---|---|---|---|---|---|---|---|---|---|
| | Fair Value | Unrealized Loss | Fair Value | Unrealized Loss | Total Fair Value | Total Unrealized Loss | ||||||||||||||
| Available for sale-non-VIE: | ||||||||||||||||||||
| U.S. treasury securities | $ | 18,254 | $ | (234 | ) | $ | 34,500 | $ | (1,127 | ) | $ | 52,754 | $ | (1,361 | ) | |||||
| Federal-agency securities | 35,840 | (464 | ) | 5,895 | (130 | ) | 41,735 | (594 | ) | |||||||||||
| Obligations of states and political subdivisions | 63,770 | (926 | ) | 11,864 | (373 | ) | 75,634 | (1,299 | ) | |||||||||||
| Corporate securities | 70,442 | (1,619 | ) | 12,000 | (441 | ) | 82,442 | (2,060 | ) | |||||||||||
| Asset-backed securities | 10,815 | (67 | ) | 566 | (16 | ) | 11,381 | (83 | ) | |||||||||||
| Mortgage-backed securities | 95,508 | (2,121 | ) | 20,818 | (503 | ) | 116,326 | (2,624 | ) | |||||||||||
| Total non-VIE Securities | 294,629 | (5,431 | ) | 85,643 | (2,590 | ) | 380,272 | (8,021 | ) | |||||||||||
| Available for sale-VIE— Asset-backed securities | 1,127,983 | (8,073 | ) | 249,985 | (6,777 | ) | 1,377,968 | (14,850 | ) | |||||||||||
| Total | $ | 1,422,612 | $ | (13,504 | ) | $ | 335,628 | $ | (9,367 | ) | $ | 1,758,240 | $ | (22,871 | ) | |||||
The unrealized losses on the Company's investments in U.S. treasury securities, federal-agency securities, obligations of states and political subdivisions, asset-backed securities and mortgage-backed securities were caused by interest rate increases. Because the decline in market value of these securities is attributable to changes in interest rates and not credit quality, and because the Company has the ability and intent to hold these investments until a recovery of fair value, which may be at maturity, it does not consider these investments to be other-than-temporarily-impaired at December 31, 2005.
The unrealized loss on investments in corporate securities is primarily caused by interest rate increases but also includes an unrealized loss of $0.3 million on investments of $3.5 million in Ford Motor Credit and General Motors Acceptance Corp. These unrealized losses are primarily attributable to recent sector downgrades by auto industry analysts due to diminishing near-term profit forecasts. The Company currently does not believe it is probable that it will be unable to collect all amounts due according to the contractual terms of these investments. Therefore, it is expected that the investments would not be settled at a price less than their amortized cost. Because the Company has the ability and intent to hold these investment until a recovery of fair value, which may be at their maturities in 2007, it does not consider these investments to be other-than-temporarily impaired at December 31, 2005.
Included above are 482 fixed maturity securities, 170 in the non-VIE portfolios, and 312 in the VIE portfolios. At December 31, 2005, there were five fixed maturity securities each of whose amortized cost exceeded its respective fair value by greater than 20%. In addition, 100% of these securities are rated investment grade in the non-VIE portfolios while over 98% are rated investment grade in the VIE portfolios. Management has assessed these and other factors and concluded that there were no other than temporarily impaired fixed maturity securities included in the above table as of December 31, 2005.
F-48
For the years ended December 31, 2005, 2004 and 2003, investment income was derived from the following sources (dollars in thousands):
| | 2005 | 2004 | 2003 | ||||||||
|---|---|---|---|---|---|---|---|---|---|---|---|
| Investment income-non-VIE: | |||||||||||
| Income from fixed maturity securities | $ | 19,300 | $ | 13,336 | $ | 10,065 | |||||
| Income from cash equivalents | 2,527 | 1,139 | 1,498 | ||||||||
| Total investment income-non-VIE | 21,827 | 14,475 | 11,563 | ||||||||
| Investment income VIE: | |||||||||||
| Income from fixed maturity securities | 225,707 | 110,364 | 40,927 | ||||||||
| Income from cash equivalents | 4,159 | 932 | 209 | ||||||||
| Income from guaranteed investment contract | 4,036 | 1,784 | 1,528 | ||||||||
| Total investment income-VIE | 233,902 | 113,080 | 42,664 | ||||||||
| Total investment income | 255,729 | 127,555 | 54,227 | ||||||||
| Investment expenses | (1,138 | ) | (1,385 | ) | (1,359 | ) | |||||
| Net investment income | $ | 254,591 | $ | 126,170 | $ | 52,868 | |||||
In 2002, the Company invested in a GIC through one of its consolidated CDO VIEs. Management considers the GIC's fair value to approximate contract value. As of December 31, 2005 and 2004, the fair value and contract value of the investment contract was $119.3 million and $122.6 million, respectively. The GIC earns interest at a rate of LIBOR less 0.02%, matures in 2007 and is issued by an affiliate of Financial Security Assurance Inc., an "AAA" rated financial guaranty company.
Fixed maturity securities having an amortized cost of $5.2 million and $5.1 million were on deposit with various regulatory authorities as required by law at December 31, 2005 and 2004, respectively.
7. DEFERRED POLICY ACQUISITION COSTS
Deferred policy acquisition costs ("DAC") and the related amortization charged to expense were as follows (dollars in thousands):
| | Years Ended December 31, | |||||||||||
|---|---|---|---|---|---|---|---|---|---|---|---|---|
| | 2005 | 2004 | 2003 | |||||||||
| Balance—beginning of period | $ | 46,556 | $ | 41,723 | $ | 38,387 | ||||||
| Cost deferred during the period: | ||||||||||||
| Compensation and other acquisition costs | �� | 8,760 | 8,434 | 6,491 | ||||||||
| Premium taxes | 750 | 234 | 922 | |||||||||
| Total costs deferred during the period | 9,510 | 8,668 | 7,413 | |||||||||
| Costs amortized during the period | (8,652 | ) | (3,835 | ) | (4,077 | ) | ||||||
| Balance—end of period | $ | 47,414 | $ | 46,556 | $ | 41,723 | ||||||
F-49
8. LOSSES
The following table provides a reconciliation of the beginning and ending reserve balances for unpaid loss expenses (dollars in thousands):
| | Years Ended December 31, | |||||||||
|---|---|---|---|---|---|---|---|---|---|---|
| | 2005 | 2004 | 2003 | |||||||
| Reserve for unpaid losses, net of reinsurance, beginning of year | $ | 36,006 | $ | 3,812 | $ | 2,904 | ||||
| Add: | ||||||||||
| Provision for unpaid losses and LAE for claims occurring in current year, net of reinsurance | 9,830 | 44,229 | 3,168 | |||||||
| Provision for unpaid losses and LAE for claims occurring in prior year, net of reinsurance | 4,208 | 2,361 | — | |||||||
| Incurred losses during the current year, net of reinsurance | 14,038 | 46,590 | 3,168 | |||||||
| Deduct: | ||||||||||
| Loss payments for claims occurring in the current year | 114 | 11,072 | — | |||||||
| Loss payments for claims occurring in the prior year | 15,624 | 3,324 | 2,260 | |||||||
| Total payments made during the year | 15,738 | 14,396 | 2,260 | |||||||
| Reserve for unpaid losses, net of reinsurance end of year | 34,306 | 36,006 | 3,812 | |||||||
| Reinsurance recoverable on unpaid losses at end of year | — | — | 1,172 | |||||||
| Reserve for unpaid losses, gross of reinsurance end of year | $ | 34,306 | $ | 36,006 | $ | 4,984 | ||||
Reserves include case specific and non-specific losses as described in Note 2. At December 31, 2005, net case specific reserves were $17.7 million, net of salvage and subrogation of $8.1 million, and non-specific reserves were $16.6 million. At December 31, 2004, net case specific reserves were $25.7 million, net of salvage and subrogation of $7.7 million, and non-specific reserves were $10.3 million. At December 31, 2003, net case specific reserves were $(4.6) million, net of salvage and subrogation of $4.6 million, and non-specific reserves were $8.4 million. Changes in non-specific reserves are reported as current year activity.
Included in net case-specific reserves in 2005 and 2004 is $23.0 million and $20.3 million, respectively, related to a portfolio of insured manufactured housing mortgage securitizations. These insurance contracts were issued in 1998. Of the portfolio, one bond defaulted in July of 2005, while the remaining bonds are expected to default subsequent to 2005. Losses are expected to be paid through 2033. Also, included in case specific reserves in 2004 is $10 million related to the Company's discontinued excess of loss insured loss warranty business. Total incurred losses and loss adjustment expenses for this business in 2004 were $21 million.
Incurred losses for the year ended December 31, 2005, 2004 and 2003, were $14.0 million, $46.6 million and $3.2 million, respectively. Incurred losses for 2005 and 2004 include $4.2 million and $2.4 million, respectively, of prior period development. In 2005, the Company increased its reserve related to the portfolio of manufactured housing mortgage securitizations discussed above by $3.4 million. In 2004, there was unfavorable development of $2.4 million on a specific municipal case reserve.
F-50
Prior period development arises from changes to loss estimates recognized in the current year that relate to loss reserves first reported in previous calendar years and excludes the effect of losses from the development of earned premium from previous accident years.
Loss and loss adjustment expenses paid, net of reinsurance, for the years ended December 31, 2005, 2004 and 2003 were $15.7 million, $14.4 million and $2.3 million, respectively. Payments made in 2005 and 2004 include $10.0 million and $11.0 million, respectively, related to two contracts in the discontinued industry loss warranty business. The Company had no remaining reserve or exposure on this business as of December 31, 2005. Also included in claim payments is $3.1 million in 2005 related to a municipal bond and $3.9 million in 2004 on two insured mortgage-backed bonds. For the 2004 payment, approximately $0.8 million in salvage was received. Based on the circumstances of the bonds' default, the Company expects to fully recover all payments and accordingly recorded anticipated salvage in an amount equal to net payments made. Similarly, in 2003, $2.7 million was paid on the two bonds and $0.4 million in salvage was received.
Case reserves are recorded net of an adjustment for the time value of money. The Company discounts case losses using the risk free rate that is closest to the term of the expected loss payments of the insured obligation at the date the case loss is established. For this purpose, U.S. Treasury rates are used. At December 31, 2005, the weighted average discount factor used was 4.6% and the discount taken was $16.9 million. At December 31, 2004, the weighted average discount factor used was 5.2% and the discount taken was $17.5 million.
In 1998, ACA FG issued an insurance policy on bonds issued in connection with a multi-family housing complex. Bondholders are secured by a mortgage on the project, a gross revenue pledge, a debt service reserve and other items. Due to financial stress occurring at the project and a resulting acceleration of the related mortgage, in November 2005, the then current owner, transferred title of the property via a deed of assumption (in lieu of a pending foreclosure action) to the Company in order to facilitate the sale of the property to a new owner. The Company's liability, its rights and remedies with respect to the project and the bond financing have not changed at all as a result of the title transfer. Also, the Company does not manage the property; rather the property manager continues to do so. The Company has entered into an agreement to transfer the property to a new owner, subject to the new owner obtaining bond and tax credit financing. This transfer is expected to close in 2006. It is expected that this transaction will not result in a loss to the Company since, once it is completed, ACA FG will no longer have exposure to these bonds as they will be fully redeemed. Additionally, other parties have expressed interest in purchasing the property at amounts in excess of the outstanding par of $9.3 million, should the pending transaction not close. With respect to the debt service on the insured bonds, it is the Company's expectation that no claim payments would be required before 2007 and because it is probable that the property will be disposed of before that time, no case reserve has been recorded at December 31, 2005. However, a reserve for loss adjustment expenses in the amount of $125,000 was established at December 31, 2005, to cover ongoing legal and other mitigation costs associated with this transaction.
F-51
9. REINSURANCE
As of and for the years ended December 31, 2005, 2004 and 2003, amounts reinsured were as follows (dollars in thousands):
| | 2005 | 2004 | 2003 | |||||||
|---|---|---|---|---|---|---|---|---|---|---|
| Income and expenses: | ||||||||||
| Written premiums ceded (cancelled) | $ | (638 | ) | $ | (911 | ) | $ | 3,465 | ||
| Written premiums assumed | 1,026 | 246 | 185 | |||||||
Earned premiums ceded | 337 | 6,874 | 6,064 | |||||||
| Earned premiums assumed | 996 | 308 | 1,001 | |||||||
Loss and loss-adjustment-expense payments ceded | — | — | 176 | |||||||
| Loss and loss-adjustment-expense payments assumed | — | — | — | |||||||
Assets and liabilities: | ||||||||||
| Unearned premium reserve ceded | 848 | 1,824 | 9,609 | |||||||
| Unearned premium reserve assumed | 621 | 591 | 653 | |||||||
Loss and loss-adjustment-expense reserves ceded | — | — | 1,172 | |||||||
| Loss and loss-adjustment-expense reserves assumed | — | — | — | |||||||
Off balance sheet items: | ||||||||||
| Principal outstanding ceded | 48,116 | 115,985 | 151,853 | |||||||
| Principal outstanding assumed | 20,318 | 34,005 | 30,044 | |||||||
During 2005, 2004 and 2003, the Company reinsured a portion of its risk with other insurance companies under pro-rata, excess-of-loss, first loss and facultative reinsurance agreements.
Effective October 1, 2005, ACA FG entered into an excess of loss reinsurance agreement with HCC Reinsurance Company Limited whereby ACA FG cedes its first $50 million in excess of $490 million on non-derivative, non-investment grade municipal paid losses. This reinsurance agreement was amended effective February 1, 2006 to increase the Company's retention to $525 million.
During 2005, a facultative reinsurance agreement covering a municipal obligation with ACE American Insurance Company ("ACE") was cancelled. As a result of the cancellation, $0.8 million in ceded unearned premium reserve was returned to the Company.
In 2004 and 2003, the Company had a first loss and excess of loss reinsurance facility (the "Soft Capital Facility") with ACE. In the aggregate, the Soft Capital Facility provided the Company with an additional $125 million for the payment of claims. The reinsurance facility provided first loss and excess of loss coverage.
The first loss coverage had an additional $50 million limit of liability and reinsured the Company's in-force portfolio subject to the sub-limits of the reinsurer's limit of liability (defined as $20 million in 2002 and increasing to $50 million in 2005 and thereafter) and upon the payment of a premium of $50 million. This $50 million in coverage was accounted for as a financing arrangement and no premiums or losses were recognized in the financial statements. In addition to the $50 million of first loss coverage, the reinsurer was liable for 100% of net paid losses in excess of $175 million and after
F-52
the adjusted surplus, as defined, of the Company is less than $25 million, subject to a $75 million limit of liability.
In 2003, S&P revised its criteria for allowing financial guarantors to take credit for soft capital reinsurance facilities. As a result, the Soft Capital Facility no longer provided ACA FG with a significant benefit. Consequently during 2004, the Soft Capital Facility was cancelled. As a result of the cancellation, $5.6 million in ceded unearned premium reserve was returned to the Company and $2.4 million in deferred commission income was earned. The Company also reassumed a previously ceded case basis loss reserve in the amount of $1.1 million and recorded other income of $2.0 million in connection with the cancellation.
The Company also cancelled reinsurance contracts with Partner Re and Royal Sun Alliance during 2004 which resulted in premiums reassumed of $0.7 million and $0.2 million, respectively. The Company did not cancel any reinsurance contracts in 2003.
To the extent the Company cedes a portion of its business to other non-affiliated insurance and reinsurance companies, a contingent liability exists relating to such reinsurance in the event that the reinsurer becomes unable to meet their obligations under the terms of the reinsurance agreement; the Company would be liable for such defaulted amounts. The were no unpaid losses and loss adjustment expenses ceded to non affiliated insurance and reinsurance companies at December 31, 2005, and 2004. Unearned premiums ceded were $0.8 million and $1.8 million at December 31, 2005 and 2004, respectively.
Ceded earned premiums were $0.3 million, $6.9 million and $6.1 million in 2005, 2004 and 2003 respectively. Loss and loss adjustment expense payments ceded were $0 million, $0 million and $0.2 million in 2005, 2004 and 2003, respectively while reinsurance recoverable on unpaid losses was $0 million, $0 million and $1.2 million at December 31, 2005, 2004 and 2003, respectively.
In 2005, 2004 and 2003, ACA FG assumed reinsurance premiums written of $1.0 million, $0.2 million and $0.2 million, respectively. In 2005, 2004 and 2003, assumed earned premiums were $1.0 million, $0.3 million and $1.0 million, respectively. ACA Assurance, a subsidiary whose business (trade credit and insured loss warranty) was discontinued or placed into runoff in 2004, recorded assumed written premiums of $3.3 million, $12.6 million and $3.7 million and earned premiums of $5.5 million, $10.4 million and $3.2 million, in 2005, 2004 and 2003, respectively.
F-53
10. DEBT
Debt outstanding at December 31, 2005 and 2004 consisted of the following (dollars in thousands):
| | December 31 | | | | |||||||||
|---|---|---|---|---|---|---|---|---|---|---|---|---|---|
| | Maturity Date | 2005 Interest Rate Range | 2005 Weighted Average Interest Rate | ||||||||||
| | 2005 | 2004 | |||||||||||
| Zenith Funding Corp. | |||||||||||||
| Commercial Paper Notes | $ | 1,355,400 | $ | 1,153,910 | 2006 | From 4.19% to 4.44% | 4.33% | ||||||
| Tranched Notes Payable | 135,000 | 135,000 | 2039 | LIBOR*+0.65% to 3.00% | LIBOR*+1.04% | ||||||||
| ACA ABS 2004-1 Limited | |||||||||||||
| Tranched Notes Payable-Floating | 419,277 | 429,633 | 2039 | LIBOR*+0.37% to 3.25% | LIBOR*+0.59% | ||||||||
| Tranched Note Payable-Fixed | 2,795 | 3,000 | 2039 | 7.7% | |||||||||
| Grenadier Funding Corp. | |||||||||||||
| Commercial Paper Notes | 1,327,511 | 1,324,053 | 2006 | From 4.24% to 4.46% | 4.36% | ||||||||
| Tranched Notes Payable | 157,500 | 157,500 | 2013 | LIBOR**+0.6% to 0.95% | LIBOR**+0.8% | ||||||||
| ACA ABS 2003-1 Limited | |||||||||||||
| Tranched Notes Payable | 361,050 | 361,050 | 2038 | LIBOR*+0.75% to 4.5% | LIBOR*+1.10% | ||||||||
| ACA ABS 2003-2 Limited | |||||||||||||
| Tranched Notes Payable-Floating | 666,500 | 666,500 | 2038 | LIBOR*+0.5% to 4.5% | LIBOR*+0.90% | ||||||||
| Tranched Note Payable-Fixed | 7,000 | 7,000 | 2038 | 5% | |||||||||
| Tranched Note Payable-Fixed | 3,000 | 3,000 | 2038 | 11.5% | |||||||||
| ACA CDS 2002-1 Limited | |||||||||||||
| Tranched Notes Payable | 100,500 | 100,500 | 2008 | LIBOR*+(0.55% to 3%) | LIBOR*+1.14% | ||||||||
| Class A Senior Interest Only | 3,159 | 4,529 | 2008 | 5.484% | |||||||||
| ACA ABS 2002-1 Limited | |||||||||||||
| Tranched Notes Payable | 304,434 | 382,920 | 2034-2037 | LIBOR*+(0.54% to 2.6%) | LIBOR*+0.69% | ||||||||
| Total VIE Debt | 4,843,126 | 4,728,595 | |||||||||||
ACA ABS 2005-1 Funding Limited | 2,685 | — | 2010 | LIBOR + 0.75% | |||||||||
| ACA Parliament Funding, LLC | 100,000 | — | 2010 | LIBOR + 1.25% | |||||||||
| ACA ABS 2004-1 Funding Limited | 9,356 | 10,000 | 2033 | LIBOR*+4% | |||||||||
| ACA ABS 2003-1 Funding Limited | — | 13,281 | 2010 | LIBOR*+2% | |||||||||
| ACA ABS 2003-2 Funding Limited | — | 26,414 | 2010 | LIBOR*+2.25% | |||||||||
| ACA CDS 2002-1 Funding | |||||||||||||
| Limited Senior Secured Notes | — | 12,198 | 2008 | LIBOR*+2% | |||||||||
| ACA ABS 2002-1 Funding | |||||||||||||
| Limited Series A Notes | — | 4,085 | 2009 | LIBOR*+1.5% | |||||||||
| Trust Preferred Debt | 79,899 | 79,899 | 2032-2034 | LIBOR*+(3.35% to 4.1%) | LIBOR*+3.85% | ||||||||
| ACA Service Corporation | — | 22,500 | 2013 | LIBOR**+2.10% | |||||||||
| ACA Service Corporation | — | 13,000 | 2039 | LIBOR*+1.75% | |||||||||
| ACA Service Corporation | 4,182 | — | 2013 | LIBOR + 0.80% | |||||||||
| 5,039,248 | 4,909,972 | ||||||||||||
| Less unamortized discount | (9,900 | ) | (6,925 | ) | |||||||||
| Total Debt | $ | 5,029,348 | $ | 4,903,047 | |||||||||
- *
- Based on three month LIBOR.
- **
- Based on one month LIBOR.
In March 2005, a special purpose entity created by the Company, ACA Parliament, LLC ("ACA Parliament"), entered into an investment agreement with an investment trust created by Bear, Stearns & Co. Inc. ("Investor"), pursuant to which the Investor deposited $99 million (net of $1 million in costs of issuance—see Note 19) (the "Deposit Amount") in a deposit fund that is maintained and invested by ACA Parliament. Pursuant to the terms of the investment agreement, ACA Parliament is required to make quarterly interest payments to the Investor at a rate equal to the three-month LIBOR plus 125 basis points. The obligations of ACA Parliament to make such interest payments and
F-54
to repay the Deposit Amount are guaranteed by financial guaranty insurance policies issued by ACA FG.
During 2005, ACA Parliament loaned certain of the proceeds held by it under the investment agreement to certain ACA Capital affiliates, which in turn were used by such affiliates either (i) to refinance existing funding notes or (ii) to finance the Company's equity participation in the Company's CDO asset management business. In particular, the Company's equity position was refinanced in each of the following CDO transactions: ACA CDS 2002-1 Funding, Limited; ACA ABS 2003-1 Funding, Limited; ACA ABS 2003-2 Funding, Limited; Grenadier Funding, Limited; and Zenith Funding, Limited. The Company financed its equity position in each of the following CDO transactions: ACA CLO 2005-1 Limited and ACA ABS 2005-2, Limited. The Company may use some of the remaining unallocated Deposit Amount from time to time to finance the Company's equity position in future CDO transactions. Each such equity financing is secured by a pledge of the equity purchased with the proceeds of the financing and an ACA FG insurance policy.
During 2005, the Company entered into two promissory note agreements to finance its equity position in CDO deals. The first note had an original face of $4.5 million, has a maturity of 2013 and accrues interest payable quarterly at a rate of LIBOR plus a margin of 0.80%. The second note had an original face of $3.8 million, has a maturity of 2010 and accrues interest payable quarterly at a rate of LIBOR plus a margin of 0.75%.
As of December 31, 2005, Grenadier Funding Corp. and Zenith Funding Corp. had issued 30-90 day commercial paper notes with a weighted average maturity of 53 days and 59 days respectively. The rate on these notes is floating with a weighted average year end value of 4.36% and 4.33%. These notes are limited recourse debt obligations of the issuers, backed solely by collateral managed by the Company. The short-term nature of these notes is designed to correspond with the short term rates on the underlying collateral of the deals. The Zenith Funding Corp., ACA ABS 2004-1 Limited, Grenadier Funding Ltd., ACA ABS 2003-1 Limited, ACA ABS 2003-2 Limited, ACA CDS 2002-1 Limited and ACA ABS 2002-1 Limited tranched notes are issued and collateralized through a VIE pursuant to an indenture agreement. These notes are limited recourse debt obligations of the issuers backed solely by a pledge of collateral managed by the Company in the VIE. The notes may be redeemed prior to the scheduled maturity date at the option of the Company as issuer and collateral manager, or in connection with an event of default pursuant to the indenture agreement.
Interest on the ACA CDS 2002-1 Limited Class A senior interest only note issued by the VIE is computed based on a notional value of $48 million. The interest rate on this note was 5.484% until April 15, 2005, 3.565% from April 15, 2005 until July 15, 2005, and 2.742% from July 15, 2005 until maturity.
The Company issued floating rate junior subordinated deferrable interest debentures, structured as trust preferred securities, of $20.6 million in 2004, bringing the total outstanding issuances to $79.9 million. The trust preferred securities have an initial stated term of 30 years with a call provision at five years from the date of each issuance. The current interest rates on the $79.9 million of outstanding trust preferred securities range from 6.4% to 8.4% at December 31, 2005. The effective interest rate of these securities is calculated based on 3-Month LIBOR plus a margin of 3.35% to 4.1% per annum subject to certain interest rate caps during the lives of the securities.
F-55
As of December 31, 2004, ACA Services had outstanding principal balances of $22.5 million and $13.0 million under its promissory notes dated July 21, 2003 and December 21, 2004 issued to Citigroup Financial Products, Inc. to finance the Company's equity investments in Grenadier Funding Ltd. and Zenith Funding Ltd. These notes accrued interest at one-month LIBOR plus 2.1% and three-month LIBOR plus 1.75%, respectively. The notes had a stated maturity of August 30, 2013 and December 6, 2039. Both of these notes were repaid in March 2005, as mentioned above.
11. INCOME TAXES
In 2004, the Company re-domesticated from Bermuda to Delaware, which under IRS regulations will preclude it from filing a consolidated federal income tax return with its operating subsidiaries until 2008. In 2005, in an effort to reduce federal and state filing requirements and to simplify the organization, the Company re-aligned its tax-paying structure. As a result of the 2005 re-alignment, the Company has two federal corporate taxpayers.
The components of income tax expense for the years ended December 31, 2005, 2004 and 2003, were as follows (dollars in thousands):
| | 2005 | 2004 | 2003 | |||||||
|---|---|---|---|---|---|---|---|---|---|---|
| Current tax expense (benefit): | ||||||||||
| Federal | $ | 12,671 | $ | 3,476 | $ | 1,712 | ||||
| State and local | 1,707 | (19 | ) | 207 | ||||||
| Total current tax expense | 14,378 | 3,457 | 1,919 | |||||||
| Deferred federal tax expense (benefit): | 719 | (3,322 | ) | 10,287 | ||||||
| Total income tax expense | $ | 15,097 | $ | 135 | $ | 12,206 | ||||
The Company's actual income tax expense for the years ended December 31, 2005, 2004 and 2003, differs from the expected amount computed by applying the statutory federal income tax rate of 35% to income before income taxes for the following reasons (dollars in thousands):
| | 2005 | 2004 | 2003 | |||||||
|---|---|---|---|---|---|---|---|---|---|---|
| Expected federal income tax expense | $ | 15,350 | $ | (1,279 | ) | $ | 11,261 | |||
| Tax-exempt interest | (998 | ) | (427 | ) | (309 | ) | ||||
| Loss of foreign entities excluded from federal tax | — | 1,690 | 716 | |||||||
| Deductions related to tax-exempt interest | — | — | 64 | |||||||
| State and local income taxes-net of federal benefit | 1,110 | (13 | ) | 134 | ||||||
| Other | (365 | ) | 164 | 340 | ||||||
| Total income tax expense | $ | 15,097 | $ | 135 | $ | 12,206 | ||||
F-56
The tax effects of temporary differences that give rise to deferred tax assets and liabilities at December 31, 2005 and 2004, are presented below (dollars in thousands):
| | 2005 | 2004 | |||||
|---|---|---|---|---|---|---|---|
| Deferred tax assets: | |||||||
| Net operating losses | $ | 5,748 | $ | 8,127 | |||
| Loss and loss adjustment expense reserve | 10,231 | 10,718 | |||||
| Controlled foreign corporation book to tax basis differences | 6,990 | 2,234 | |||||
| Unrealized loss on derivatives | — | 14 | |||||
| Fixed assets | — | 994 | |||||
| Alternative minimum tax credit | — | 619 | |||||
| Other | 1,421 | 288 | |||||
| Total gross deferred tax assets | 24,390 | 22,994 | |||||
| Deferred tax liabilities | |||||||
| Deferred acquisitions costs | 16,595 | 16,163 | |||||
| Unearned premium reserve | 5,072 | 3,956 | |||||
| Unrealized gain on derivatives | 2,420 | — | |||||
| Other comprehensive income gains on investments | 5,369 | 11,195 | |||||
| GAAP to STAT adjustments | — | 407 | |||||
| Other | 1,843 | 3,289 | |||||
| Total gross deferred tax liabilities | 31,299 | 35,010 | |||||
| Net deferred tax liability | $ | 6,909 | $ | 12,016 | |||
At December 31, 2005, the Company has federal net operating loss carryforwards of approximately $5.8 million that begin to expire in 2024 and are fully expired by 2025.
12. COMMITMENTS
The Company leases its office space under noncancelable operating leases, which expire at various dates through 2009. In addition to base rental costs, the leases for office space provide for rent escalations resulting from increased assessments for real estate taxes, utilities, and maintenance. Rent expense for 2005, 2004 and 2003 was $2.0 million, $2.1 million and $2.1 million, respectively.
Future minimum lease payments under the noncancelable operating leases at December 31, 2005 were as follows (dollars in thousands):
| Year Ending December 31 | Operating Leases | ||
|---|---|---|---|
| 2006 | $ | 1,985 | |
| 2007 | 1,985 | ||
| 2008 | 1,985 | ||
| 2009 | 1,323 | ||
| Total | $ | 7,278 | |
F-57
During the ordinary course of business, the Company has become party to certain litigation. Other than with respect to the litigation described in Note 20 below, in connection with which the Company reserved $4.2 million at December 31, 2005, management believes all other matters will be resolved with no material impact on the Company.
13. FAIR VALUE OF FINANCIAL INSTRUMENTS
The following methods and assumptions were used by the Company in estimating its fair value disclosure for financial instruments. These determinations were based on available market information and appropriate valuation methodologies. Considerable judgment is required to interpret market data to develop the estimates and therefore, they may not necessarily be indicative of the amount the Company could realize in a current market exchange. The use of different market assumptions and/or estimation methodologies may have a material effect on the estimated fair value amounts.
Fixed Maturity Securities—The fair value for fixed maturity securities available-for-sale shown in Note 6 is based on independent market quotations, broker quotes or valuation models when quotations are not available.
Guaranteed Investment Contract—The Contract's fair value approximates contract value, as the interest rate is variable at LIBOR less 0.02% and resets on an annual basis.
Cash and Cash Equivalents—The carrying amounts of these items are reasonable estimates of their fair value.
Accrued Investment Income—The fair value of accrued investment income is assumed to approximate carrying value.
Unearned Premium Reserve—The fair value of the Company's unearned premium reserve is based on the estimated cost of entering into a cession of the entire portfolio with third party reinsurers under current market conditions. This amount was determined by using the statutory basis unearned premium reserve, net of estimated ceding commissions.
Debt—Debt is primarily based on variable rates with fair value approximating carrying value
Accrued interest payable���The fair value of accrued interest payable approximates carrying value.
Present Value of Installment Premiums—The fair value for financial guarantees written (net insurance contracts written) with installment premiums is derived by calculating the present value of the estimated future premiums at a risk adjusted rate of 5% in 2005 and 2004, net of normal ceding commissions.
Derivatives—The fair value derived from market information and appropriate valuation methodologies reflect the estimated amounts that the Company would receive or pay to terminate the transaction at the reporting date. The Company recognizes all derivatives as either assets or liabilities in the balance sheet and measures those instruments at fair value.
Insured credit swaps under which the Company sells credit protection to third parties, have been deemed to meet the definition of derivatives under FAS 133. Additionally the Company uses interest
F-58
rate swaps to hedge interest rate risk in its CDOs. The Company records these transactions at fair value. Fair value is determined based upon quoted prices or internally developed valuation models.
The carrying value and estimated fair value of financial instruments are presented below (dollars in millions):
| | December 31, | ||||||||||||
|---|---|---|---|---|---|---|---|---|---|---|---|---|---|
| | 2005 | 2004 | |||||||||||
| | Carrying Value | Estimated Fair Value | Carrying Value | Estimated Fair Value | |||||||||
| Assets | |||||||||||||
| Fixed maturity securities | $ | 5,298.7 | $ | 5,298.7 | $ | 5,153.1 | $ | 5,153.1 | |||||
| Guaranteed investment contract | 119.3 | 119.3 | 122.6 | 122.6 | |||||||||
| Cash and cash equivalents | 224.6 | 224.6 | 259.0 | 259.0 | |||||||||
| Accrued investment income | 17.3 | 17.3 | 12.4 | 12.4 | |||||||||
| Derivative assets | 15.3 | 15.3 | 28.4 | 28.4 | |||||||||
| Liabilities | |||||||||||||
| Debt | 5,029.3 | 5,029.3 | 4,903.0 | 4,903.0 | |||||||||
| Unearned premium reserve of up-front premiums | 187.8 | 150.9 | 180.1 | 147.2 | |||||||||
| Derivative liabilities | 46.5 | 46.5 | 58.8 | 58.8 | |||||||||
| Accrued interest payable | 15.3 | 15.3 | 11.5 | 11.5 | |||||||||
| Off-Balance Sheet Instruments | |||||||||||||
| Present value of installment premiums on insurance contracts | 11.4 | 7.8 | |||||||||||
| Present value of installment insured credit swap premiums | 119.5 | 62.6 | |||||||||||
14. STOCK COMPENSATION PLAN
In 2001, the Company adopted the American Capital Access Holdings, Incorporated Omnibus Incentive Plan (the "Prior Plan") under which 2,188,584 shares of the Company's common stock were reserved for issuance to employees, directors and consultants. In 2003, the Company's Board of Directors approved the increase of the number of shares reserved for issuance by 72,954. In 2004, the Board of Directors approved the ACA Capital Holdings, Inc. Amended and Restated 2004 Stock Incentive Plan effective September 30, 2004 (as amended on October 4, 2004, the "Plan") amending and restating the Prior Plan and increasing the total options available under the Plan (including those previously distributed under the Prior Plan) to 4,241,538. The Plan permits the grant of nonqualified and qualified stock options, incentive stock options, restricted stock, stock units, unrestricted stock, dividend equivalent and cash-based awards. The objectives of the Plan are to optimize the profitability and growth of the Company through annual long-term incentives that are consistent and linked with
F-59
the Company's goals. A summary of option activity for the years ended December 31, 2005, 2004 and 2003 is as follows:
| | 2005 | 2004 | 2003 | |||||
|---|---|---|---|---|---|---|---|---|
| Outstanding—beginning of year | 3,042,306 | 2,150,070 | 2,060,094 | |||||
| Granted | 111,000 | 1,293,480 | 218,862 | |||||
| Exercised | — | — | — | |||||
| Forfeited | (109,656 | ) | (401,244 | ) | (128,886 | ) | ||
| Outstanding—end of year | 3,043,650 | 3,042,306 | 2,150,070 | |||||
| Options vested—end of year | 2,018,874 | 1,607,118 | 1,199,928 | |||||
The exercise price for stock options issued in 2005, 2004 and 2003 was $11.63, $10.38 and $12.92 per share, respectively. The weighted average exercise price for options issued in 2005, 2004 and 2003 was $11.37, $10.38 and $12.92, respectively. The exercise price of options issued is based on the estimated fair value of the Company's shares at the grant date. Stock options issued under the Prior Plan vest ratably over three years and have a life of ten years from the grant date. Stock options issued under the Plan vest ratably every six months over a forty-two month period and have a life of ten years from the grant date. The Company has outstanding stock options with exercise prices ranging from $10.23 to $12.92. The weighted average exercise price of vested options as of December 31, 2005, 2004 and 2003 is $10.53, $10.45 and $10.37, respectively. Owners of vested options have the right to exercise these options by purchasing shares of the Company's stock at the applicable exercise price. No purchases of this nature occurred during 2005, 2004 or 2003.
The fair value of each option is estimated on the date of grant using the Black-Scholes option-pricing model with the following assumptions used for grants during 2005, 2004 and 2003:
| | 2005 | 2004 | 2003 | ||||
|---|---|---|---|---|---|---|---|
| Dividend yield | 0 | % | 0 | % | 0 | % | |
| Expected volatility | 0 | % | 0 | % | 0 | % | |
| Expected term in years | 6 | 3 | 3 | ||||
| Risk-free interest rate | 3.86 | % | 3.88 | % | 3.29-4.01 | % |
Utilizing these assumptions, the weighted-average per-share fair value of stock options granted in 2005, 2004 and 2003 was $2.41, $1.14 and $1.29, respectively.
The total fair value of stock options granted was approximately $0.2 million, $1.5 million and $0.3 million in 2005, 2004 and 2003, respectively.
15. RETIREMENT PLAN
The Company offers a defined contribution savings plan under Section 401(k) of the Internal Revenue Code. This plan covers substantially all employees who meet minimum age and service requirements and allows participants to defer a portion of their annual compensation on a pre-tax basis up to IRS limits. The Company may make discretionary contributions to the plan on behalf of employees. The Company contributed $0.5 million, $0.6 million and $0.5 million to the plan on behalf of employees for the years ended December 31, 2005, 2004 and 2003, respectively.
F-60
16. PREFERRED AND COMMON STOCK
As of December 31, 2005 the Company had authorized 20,000,000 shares of all classes of stock. The authorized capital of the Company shall be divided into (i) 12,000,000 shares of common stock and (ii) 8,000,000 shares of preferred stock including (a) 1,500 shares of convertible preferred stock, (b) 220 shares of senior convertible preferred stock, (c) 3,000,000 shares of series B senior convertible preferred stock and (d) such other classes or series of preferred stock as the board may determine. In addition, upon an execution of an initial public offering, these shares of preferred stock convert to common stock.
On June 4, June 28, and July 12, 2004, the Company issued 268,471, 26,847, and 11,813 shares of series A senior convertible preferred stock for $25.0 million, $2.5 million and $1.1 million, respectively, to existing stockholders. All of these shares were converted to series B senior convertible preferred stock on September 30, 2004. On the same day, the Company issued an additional 2,247,551 shares of series B senior convertible preferred stock for $140.0 million to new stockholders. Of the capital raised in 2004, $146 million was invested in the capital of ACA FG to increase its statutory capital to meet the redefined minimum capital requirements of Standard & Poor's Corporation, ACA FG's rating agency.
On September 30, 2004, the Company granted 55,869 restricted shares of its series B senior convertible preferred stock, par value $0.10 ("the Restricted Stock") at a fair market value of $62.29 per share, to the Company's new president and chief executive officer (the "Executive"). The total value at the grant date of the restricted stock totaled $3.5 million. The restricted stock vests as follows: 33.33% vested on September 30, 2005; 33.33% will vest on September 30, 2006; and the remaining 33.34% will vest on September 30, 2007, provided the Executive has been continuously employed by the Company or a subsidiary throughout the applicable vesting period. In 2005 and 2004, the vested portion of the restricted stock totaled $1.2 million and $0.3 million, respectively, which was recognized in the Company's consolidated statements of income.
On November 23, 2004, the Company (i) issued 13,501 shares of series C senior convertible preferred stock for $0.8 million to ACA's senior management and to one of its directors, and (ii) an additional 4,705 shares of series B senior convertible preferred stock for $0.3 million to one of its existing stockholders. An additional 5,000 shares of series C senior convertible preferred were issued to one of the Company's directors on June 17, 2005. Each share of series C senior convertible preferred automatically converted into one share of series B senior convertible preferred on November 30, 2005.
Each share of series B senior convertible preferred stock is convertible into six shares of common stock. Each share of convertible preferred is convertible into 6,000 shares of common stock. Each share of senior convertible preferred is convertible into a number of shares of common stock equal to 6,000 plus 5% per annum up to September 30, 2004, compounded annually. This 5% "liquidation accretion" premium commenced on the date of issuance of the senior convertible preferred stock. Therefore, each share of senior convertible preferred stock is convertible into 7,152 shares of common stock at December 31, 2005.
None of the shares of series B senior convertible preferred stock, senior convertible preferred stock or convertible preferred stock are cumulative or have sinking fund requirements.
F-61
17. RATING AGENCY AND REGULATORY MATTERS
The Maryland Insurance Administration ("MIA"), the insurance departments of certain other states and the rating agencies which rate ACA FG have various requirements relating to the maintenance of certain minimum statutory capital and reserves, single risk limits and limits on non-investment grade obligations.
As of December 31, 2005, ACA FG's policyholders' surplus, as determined in accordance with statutory accounting practices, was $266.1 million. Such amount was in excess of the minimum capital and surplus level of $75.0 million required to satisfy a key state regulatory requirement.
Under Maryland insurance law, ACA FG may pay a dividend without the prior approval of the Commissioner of the MIA from earned surplus, as defined, subject to the maintenance of a minimum-capital requirement, and the dividend, which, together with all dividends declared or distributed by it during the preceding twelve months, may not exceed the lesser 10% of its policyholders' surplus shown on its last filed statement, or net income, as defined, for such twelve-month period. Consistent with prior years, in 2006 based upon these restrictions, ACA FG will need the approval of the MIA to pay any dividends.
In May 2005, the MIA approved ACA FG's request for a dividend in an amount equal to the interest payments on $40 million of the $80 million of the Company's trust preferred issuance outstanding as well as to pay interest on a $10 million surplus note issued by ACA FG to the Company through the year ended December 31, 2005. Accordingly, ACA FG paid a dividend of $2.1 million for the ultimate benefit of its parent, ACA Capital, and $0.5 million in interest on the surplus note. No dividends were paid in 2004 or 2003 by ACA FG. In January 2006, ACA FG received approval from the MIA to make 2006 dividend payments to ACA Capital in an amount equal to the interest due on $40 million of trust preferred debt as well as approval to continue making interest payments on its $10 million surplus note, the proceeds of which were contributed by ACA Capital into ACA FG.
The MIA is currently in the process of completing its five year regulatory examination of ACA FG with respect to the period ended December 31, 2003. ACA FG received a draft report on the findings in June 2005. At June 30, 2005, management believed it had recorded all material adjustments arising from the examination. The adjustment recorded in the June 30, 2005 statutory financial statements was a $4.4 million reduction to policyholder's surplus. Had that adjustment been recorded at December 31, 2004, policyholders' surplus would have been $276 million, well above the required minimum amount of $75 million. Until the report is finalized, it cannot be definitively stated that all required adjustments have been made. The Company believes that any additional adjustments will not cause the Company to fall below the minimum statutory capital requirements as defined by Standard & Poor's for the maintenance of its "A" financial strength rating nor key minimum capital and surplus requirements.
On May 5, 2004, the insurer financial strength and financial enhancement ratings of ACA FG were placed on CreditWatch with negative implications by Standard & Poor's ("S&P") while its insurer financial strength rating was placed on Rating Watch Negative by Fitch Ratings ("Fitch"). Fitch subsequently downgraded ACA FG's insurer financial strength rating to "BBB" from "A" on May 11, 2004 and the Company requested that Fitch withdraw its rating of ACA FG, which was granted on August 13, 2004.
These actions were primarily taken because of a revised requirement by the rating agencies that the Company must have at least $300 million of statutory capital (policyholders' surplus and
F-62
contingency reserve) to maintain an "A" rating. In connection with S&P's revised requirement, on June 4, 2004, the Company received a $25 million investment from three of its existing stockholders and the Company looked to the market to find the additional $100 million needed by it to satisfy the S&P minimum capital requirements. The Company contributed the $25 million to its wholly owned subsidiary, ACA Holding LLC. ("ACAH") and ACAH contributed the amount to ACA FG, thereby increasing ACA FG's statutory capital to approximately $200 million. On September 30, 2004, two non-affiliated new investors and certain existing stockholders invested an additional $140 million in the Company, which in turn through ACAH, contributed $146 million of capital to ACA FG, thus satisfying S&P's minimum capital requirement to maintain an "A" rating. As a result, S&P removed ACA FG's financial strength and financial enhancement ratings from CreditWatch.
The ratings actions did not result in material payments by ACA FG, however, under the terms of certain credit swap transactions entered into by various affiliates of the Company, whose obligations under the related credit swap transactions are insured by ACA FG, collateral is required to be posted for the benefit of the swap counterparty in the event of a ratings downgrade of ACA FG. The obligation to post collateral is that of the particular affiliate of ACA FG that entered into the swap. In the event the affiliate cannot satisfy its posting obligation, ACA FG may be required to make a termination payment to the counterparty based on the then current market value of the transaction. As S&P did not downgrade ACA FG, no material collateral postings or material termination payments were made by ACA FG as a result of the 2004 ratings actions.
18. OUTSTANDING EXPOSURE AND COLLATERAL
ACA FG policies insure the scheduled payments of principal and interest on municipal obligations and asset-backed and corporate financings. The outstanding principal amount of insured obligations in
F-63
the insured portfolio, net of amounts ceded aggregating $50 million and $116 million at December 31, 2005 and 2004, respectively, included the following types of issues (dollars in millions):
| | December 31, 2005 | December 31, 2004 | ||||||||||
|---|---|---|---|---|---|---|---|---|---|---|---|---|
| | Net Par Outstanding | % of Net Par Outstanding | Net Par Outstanding | % of Net Par Outstanding | ||||||||
| Municipal: | ||||||||||||
| Healthcare | $ | 929 | 4.3 | % | $ | 911 | 8.1 | % | ||||
| Tax backed | 821 | 3.8 | 785 | 6.9 | ||||||||
| Higher education | 1,413 | 6.6 | 1,328 | 11.8 | ||||||||
| Long-term care | 686 | 3.2 | 529 | 4.7 | ||||||||
| General obligations | 600 | 2.8 | 750 | 6.6 | ||||||||
| Utilities | 305 | 1.4 | 283 | 2.5 | ||||||||
| Transportation | 434 | 2.0 | 438 | 3.9 | ||||||||
| Housing | 280 | 1.3 | 238 | 2.1 | ||||||||
| Investor-owned utilities | 125 | 0.6 | 131 | 1.2 | ||||||||
| Other | 513 | 2.4 | 575 | 5.1 | ||||||||
| Total municipal obligations | 6,106 | 28.4 | 5,968 | 52.9 | ||||||||
| Non-Municipal: | ||||||||||||
| Structured credit swaps | 13,559 | 63.2 | 4,219 | 37.3 | ||||||||
| Capital relief | 1,373 | 6.4 | 672 | 5.9 | ||||||||
| Structured finance | 40 | 0.2 | 132 | 1.2 | ||||||||
| Other | 389 | 1.8 | 305 | 2.7 | ||||||||
| Total non-municipal obligations | 15,361 | 71.6 | 5,328 | 47.1 | ||||||||
| Total | $ | 21,467 | 100.0 | % | $ | 11,296 | 100.0 | % | ||||
The principal amount of insured obligations as of December 31, 2005 and 2004, in the insured portfolio, net of amounts ceded, and the terms to final maturity were as follows (dollars in millions). Actual maturities could differ from final maturities because borrowers have the right to refund or prepay certain obligations.
| | December 31, 2005 | December 31, 2004 | |||||||||
|---|---|---|---|---|---|---|---|---|---|---|---|
| | Net Par Outstanding | % of Net Par Outstanding | Net Par Outstanding | % of Net Par Outstanding | |||||||
| California | $ | 1,141 | 18.7 | % | $ | 1,099 | 18.4 | % | |||
| New York | 545 | 8.9 | 409 | 6.9 | |||||||
| Texas | 365 | 6.0 | 315 | 5.3 | |||||||
| Pennsylvania | 292 | 4.8 | 285 | 4.8 | |||||||
| Florida | 261 | 4.3 | 253 | 4.2 | |||||||
| Other states | 3,502 | 57.3 | 3,607 | 60.4 | |||||||
| Total municipal obligations | $ | 6,106 | 100.0 | % | $ | 5,968 | 100.0 | % | |||
F-64
Debt service on insured obligations for 2005 was approximately $577 million. Since its inception in 1997, the Company has net paid and case-specific losses of $53.2 million on $173.6 million of net earned premium.
19. RELATED PARTY TRANSACTIONS
During 2005, the Company received management and structuring fee income from each of its non-consolidated CDOs of $4.2 million (see Note 4). No CDOs were considered related parties in 2004 and 2003. This amount is included in Fee income.
During 2004, the Company purchased 174,372 shares of its common stock from employees terminated during the year for a purchase price of $2.2 million. The shares purchased were accounted for as treasury stock. No treasury stock was purchased in 2005 or 2003.
In 2002, the Company replaced one of its investment managers with Stephens Capital Management ("Stephens") and incurred investment management fees of $0.1 million, $0.2 million and $0.1 million related to Stephens during 2005, 2004 and 2003, respectively. This investment manager is affiliated with SF Holding corp. (f/k/a Stephens Group Inc.), which has a representative on the Company's Board of Directors and is an investor in the Company.
During 2004, a Bear Stearns sponsored investment vehicle, BSMB/ACA LLC, ("BSMB") invested $105 million in the Company in exchange for series B senior convertible preferred stock. BSMB is the private equity affiliate of the Bear, Stearns Companies, Inc. a subsidiary of Bear, Stearns & Co., Inc. Upon closing the BSMB investment, the Company paid an affiliate of BSMB a transaction fee of $2.0 million. In addition, the Company paid advisory expenses of $0.8 million to Bear, Stearns & Co. Inc. on behalf of BSMB. The Company also pays an affiliate of BSMB a portfolio monitoring fee of approximately $0.3 million per annum in connection with BSMB's investment in the Company. During 2005 Bear, Stearns & Co. Inc. performed investment banking services for the Company on various transactions and was paid structuring and placement fees of $6.2 million. In March 2005, the Company borrowed $100 million via an investment trust structure sponsored by Bear Stearns. The Company is required to make quarterly interest payments to the trust at a rate equal to the three-month LIBOR plus 125 basis points (see Note 10).
In 2003, Banc of America Securities, LLC, an affiliate of Banc of America Strategic Investments Corporation, acted as placement agent in connection with the origination of one of our CDOs. We paid Banc of America Securities, LLC a total of $3,538,708 in placement and structuring fees and expenses in relation to these services. Also, in connection with a municipal bond offering consummated during the fourth quarter of 2003, ACA Financial Guaranty Corporation obtained a standby letter of credit from Bank of America, N.A., another affiliate of Banc of America Strategic Investments Corporation, in the stated amount of $11,680,000 for which Bank of America, N.A. was paid fees and expenses totaling approximately $232,000 in 2003. The letter of credit was terminated effective as of December 31, 2004. In addition, Banc of America Securities, LLC acted as placement agent in connection with our issuance of shares of series B senior convertible preferred stock in 2004 for which it was paid placement fees of $2.4 million.
Pursuant to employment contracts approved by the Board of Directors, in 2001 key senior executives purchased in aggregate 2,493,828 shares of common stock of the Company in exchange for
F-65
$4.2 million, 10-year promissory notes payable to the Company. The promissory notes accrue interest at the 10-year U.S. Treasury rate. The Company received principal payments in connection with these promissory notes of approximately $0.1 million and $0.3 million, during 2005 and 2004, respectively. In May 2004, the previous Chief Executive Officer's promissory note of $2.2 million was cancelled in connection with the Company's repurchase of his shares of the Company's stock. The Company recorded interest income related to the promissory notes of $0.1 million, $0.1 million and $0.3 million, during 2005, 2004 and 2003, respectively. Interest receivable relating to the promissory notes was $0.1 million and $0.2 million at December 31, 2005 and 2004, respectively. Pursuant to the Amended and Restated Employment Agreements, effective September 30, 2004, the Company discharged one-third of the outstanding unpaid principal and interest on the promissory notes of those senior executives remaining with the Company on March 1, 2005, in the amount of $0.3 million, and will discharge the remaining two-thirds on March 1, 2006 and March 1, 2007.
On September 30, 2004, pursuant to an employment contract approved by the Board of Directors, the Company granted 335,214 restricted shares of series B senior convertible preferred stock to the new Chief Executive Officer, which totaled approximately $3.5 million (see Note 16). In addition, the Company loaned the Chief Executive Officer approximately $1.4 million to fund taxes associated with his properly executed Section 83(b) election. The loan accrues interest at 3.56%, the applicable federal rate provided by the IRS for the month the loan originated, and is payable over three years.
20. LITIGATION
The Company was the plaintiff in an action filed with the Supreme Court of the State of New York pursuant to which the Company sought a declaratory judgment that it properly fulfilled the terms of an employment contract with a former executive officer of the Company. In a cross complaint filed by the former executive, the former executive claimed that the Company is obligated to pay the former executive approximately $3.2 million in severance above the $1 million that was previously paid to the executive by the Company. The action was decided on summary judgment in favor of the former executive on October 18, 2005. The former executive was awarded damages in the amount of approximately $3.1 million, plus accrued interest at the statutory rate of 9% per annum from June 9, 2004 and attorney's fees. The Company has appealed the decision to the Appellate Division of the Supreme Court of the State of New York and has posted an appeal bond pending the outcome of that appeal. The Company has recorded a reserve in its consolidated financial statements at December 31, 2005 in the amount of $4.2 million for the damages awarded plus accrued interest and litigation costs.
F-66
21. RESTRICTED BALANCES
As mentioned in Note 6, ACA FG has assets on deposits with various regulatory authorities. Additionally, as mentioned in Note 2, in connection with its CDO Asset Management and Structured Credit derivatives business, the Company has on deposit $45.8 million for the benefit of various counterparties. These funds revert back to the Company upon the expiration of the related risk and in certain instances may be used to pay losses should they be incurred. The Company also holds $4.4 million in collateral, through one of its consolidated CDOs, for the benefit of the CDO debt holders. Restricted balances are recorded as restricted cash assets on the consolidated balance sheets.
22. SEGMENT INFORMATION
The Company's reportable segments are as follows:
- (1)
- Structured Credit, which structures and sells credit protection, principally in the form of CDS, against a variety of asset classes in the institutional fixed income markets;
- (2)
- Municipal Finance, which provides insurance guaranteeing the timely payment of ultimate principal and interest on municipal obligations;
- (3)
- CDO Asset Management, which originates, structures and manages assets, primarily corporate obligations or asset-backed securities, in funded or synthetic CDOs; and
- (4)
- Other, which primarily includes trade credit insurance business, insured loss warranty business and financial guaranty insurance on certain other sectors, each of which the Company is no longer engaged in.
The Company's reportable segments are strategic business units that offer different products and services. They are managed separately since each business requires different marketing strategies, personnel skill sets and technology.
Where determinable, the Company specifically assigns assets to each segment, otherwise, the Company allocates assets based on estimates. In general, allocation percentages for assets are determined based on each line's estimated capital utilization from a rating agency perspective.
The accounting policies of the segments are the same as those described in the summary of significant accounting policies. The Company evaluates segment performance based on its income (loss) before income taxes. Reportable segment results are presented net of material inter-segment
F-67
transactions. The following table summarizes the Company's operations and allocation of assets as of and for the years ended December 31, 2005, 2004 and 2003 (dollars in thousands):
| | Year ended December 31, 2005 | ||||||||||||||||
|---|---|---|---|---|---|---|---|---|---|---|---|---|---|---|---|---|---|
| | Structured Credit | Municipal Finance | CDO Asset Management | Other | Consolidated Totals | ||||||||||||
| Revenues | |||||||||||||||||
| Premiums earned | $ | 2,548 | $ | 23,889 | $ | — | $ | 6,906 | $ | 33,343 | |||||||
| Net insured credit swap revenue | 20,542 | 13 | 1,016 | — | 21,571 | ||||||||||||
| Net investment income | 828 | 13,862 | 236,591 | 3,310 | 254,591 | ||||||||||||
| Net realized losses | (35 | ) | (591 | ) | (2,010 | ) | (141 | ) | (2,777 | ) | |||||||
| Net realized and unrealized gains (losses) on derivative instruments | — | — | 8,410 | — | 8,410 | ||||||||||||
| Other net credit swap revenue | — | — | 4,157 | — | 4,157 | ||||||||||||
| Fee and other income | 632 | 307 | 10,351 | 9 | 11,299 | ||||||||||||
| Total revenues | 24,515 | 37,480 | 258,515 | 10,084 | 330,594 | ||||||||||||
| Expenses | |||||||||||||||||
| Loss and loss adjustment expenses | — | 7,459 | — | 6,579 | 14,038 | ||||||||||||
| Policy acquisition costs | — | 6,970 | — | 1,682 | 8,652 | ||||||||||||
| Other operating expenses | 7,430 | 7,201 | 19,049 | 3,763 | 37,443 | ||||||||||||
| Interest expense | 115 | 1,663 | 212,134 | 401 | 214,313 | ||||||||||||
| Depreciation and amortization | 235 | 596 | 7,674 | 78 | 8,583 | ||||||||||||
| Total expenses | 7,780 | 23,889 | 238,857 | 12,503 | 283,029 | ||||||||||||
| Income of minority interest | — | — | (3,708 | ) | — | (3,708 | ) | ||||||||||
| Income (loss) before income taxes | $ | 16,735 | $ | 13,591 | $ | 15,950 | $ | (2,419 | ) | 43,857 | |||||||
| Provision for income tax | 15,097 | ||||||||||||||||
| Net income | $ | 28,760 | |||||||||||||||
| Segment assets | $ | 36,062 | $ | 483,794 | $ | 5,169,575 | $ | 102,769 | $ | 5,792,200 | |||||||
F-68
| | Year ended December 31, 2004 | ||||||||||||||||
|---|---|---|---|---|---|---|---|---|---|---|---|---|---|---|---|---|---|
| | Structured Credit | Municipal Finance | CDO Asset Management | Other | Consolidated Totals | ||||||||||||
| Revenues | |||||||||||||||||
| Premiums earned | $ | 6,161 | $ | 13,930 | $ | — | $ | 9,742 | $ | 29,833 | |||||||
| Net insured credit swap revenue | 5,617 | — | 10,401 | — | 16,018 | ||||||||||||
| Net investment income | 524 | 8,770 | 114,782 | 2,094 | 126,170 | ||||||||||||
| Net realized losses | (10 | ) | (163 | ) | (6,335 | ) | (39 | ) | (6,547 | ) | |||||||
| Net realized and unrealized gains (losses) on derivative instruments | — | — | 6,520 | — | 6,520 | ||||||||||||
| Other net credit swap revenue | — | — | 10,990 | — | 10,990 | ||||||||||||
| Fee and other income | 644 | 4,057 | 5,184 | 143 | 10,028 | ||||||||||||
| Total revenues | 12,936 | 26,594 | 141,542 | 11,940 | 193,012 | ||||||||||||
| Expenses | |||||||||||||||||
| Loss and loss adjustment expenses | — | 4,310 | — | 42,280 | 46,590 | ||||||||||||
| Policy acquisition costs | — | 2,238 | — | 1,597 | 3,835 | ||||||||||||
| Other operating expenses | 8,870 | 7,148 | 18,910 | 3,717 | 38,645 | ||||||||||||
| Interest expense | 66 | 958 | 99,882 | 231 | 101,137 | ||||||||||||
| Depreciation and amortization | 190 | 482 | 6,200 | 63 | 6,935 | ||||||||||||
| Total expenses | 9,126 | 15,136 | 124,992 | 47,888 | 197,142 | ||||||||||||
| Loss of minority interest | — | — | 476 | — | 476 | ||||||||||||
| Income (loss) before income taxes | $ | 3,810 | $ | 11,458 | $ | 17,026 | $ | (35,948 | ) | (3,654 | ) | ||||||
| Provision for income tax | 135 | ||||||||||||||||
| Net loss | $ | (3,789 | ) | ||||||||||||||
| Segment assets | $ | 33,029 | $ | 430,063 | $ | 5,136,008 | $ | 92,861 | $ | 5,691,961 | |||||||
F-69
| | Year ended December 31, 2003 | |||||||||||||||
|---|---|---|---|---|---|---|---|---|---|---|---|---|---|---|---|---|
| | Structured Credit | Municipal Finance | CDO Asset Management | Other | Consolidated Totals | |||||||||||
| Revenues | ||||||||||||||||
| Premiums earned | $ | 5,171 | $ | 8,795 | $ | — | $ | 4,830 | $ | 18,796 | ||||||
| Net insured credit swap revenue | 3,907 | — | 2,934 | — | 6,841 | |||||||||||
| Net investment income | 408 | 6,837 | 43,991 | 1,632 | 52,868 | |||||||||||
| Net realized gains (losses) | 186 | 3,136 | (883 | ) | 749 | 3,188 | ||||||||||
| Net realized and unrealized gains on derivative instruments | — | — | 9,124 | — | 9,124 | |||||||||||
| Other net credit swap revenue | 1,213 | — | 10,908 | — | 12,121 | |||||||||||
| Fee and other income | 1,113 | 383 | 7,772 | 53 | 9,321 | |||||||||||
| Total revenues | 11,998 | 19,151 | 73,846 | 7,264 | 112,259 | |||||||||||
| Expenses | ||||||||||||||||
| Loss and loss adjustment expenses | — | 1,377 | — | 1,791 | 3,168 | |||||||||||
| Policy acquisition costs | — | 3,788 | — | 289 | 4,077 | |||||||||||
| Other operating expenses | 4,847 | 7,072 | 16,222 | 1,325 | 29,466 | |||||||||||
| Interest expense | 26 | 388 | 38,752 | 94 | 39,260 | |||||||||||
| Depreciation and amortization | 36 | 92 | 3,975 | 12 | 4,115 | |||||||||||
| Total expenses | 4,909 | 12,717 | 58,949 | 3,511 | 80,086 | |||||||||||
| Income before income taxes | $ | 7,089 | $ | 6,434 | $ | 14,897 | $ | 3,753 | 32,173 | |||||||
| Provision for income tax | 12,206 | |||||||||||||||
| Net income | $ | 19,967 | ||||||||||||||
| Segment assets | $ | 31,703 | $ | 317,757 | $ | 3,046,037 | $ | 68,366 | $ | 3,463,863 | ||||||
F-70
23. EARNINGS PER SHARE
The following table sets forth the computation of basic and diluted earnings (loss) per share for the years ended December 31, 2005, 2004 and 2003:
| | 2005 | 2004 | 2003 | |||||||||
|---|---|---|---|---|---|---|---|---|---|---|---|---|
| | (dollars and shares in thousands, except per share amounts) | |||||||||||
| Numerator: | ||||||||||||
| Net income (loss) | $ | 28,760 | $ | (3,789 | ) | $ | 19,967 | |||||
| Common stock undistributed earnings (loss) | $ | 7,687 | $ | (3,789 | ) | $ | 19,967 | |||||
| Participating convertible stock undistributed earnings | 21,073 | — | — | |||||||||
| Total undistributed earnings (loss) | $ | 28,760 | $ | (3,789 | ) | $ | 19,967 | |||||
| Denominator: | ||||||||||||
| Weighted average shares outstanding - basic: | ||||||||||||
| Common stock | 6,090 | 6,168 | 6,270 | |||||||||
| Participating convertible stock | 16,704 | — | — | |||||||||
| Total - basic | 22,794 | 6,168 | 6,270 | |||||||||
| Effect of diluted securities: | ||||||||||||
| Convertible preferred stock | 6,678 | — | 6,624 | |||||||||
| Stock options | 414 | — | 366 | |||||||||
| Total - diluted | 29,886 | 6,168 | 13,260 | |||||||||
| Basic earnings (loss) per share | $ | 1.26 | $ | (0.61 | ) | $ | 3.18 | |||||
| Diluted earnings (loss) per share | $ | 0.96 | $ | (0.61 | ) | $ | 1.51 | |||||
As a result of the 2004 net loss, 4.74 million weighted average shares of participating convertible stock were excluded from the computation of basic earnings (loss) per share. Participating convertible stockholders do not participate in losses with the common stockholders. Additionally, 6.66 million and 0.24 million weighted average shares of dilutive potential common stock, resulting from convertible preferred stock and stock options, respectively, were not included in the computation of diluted earnings (loss) per share for the year ended December 31, 2004. In the absence of the net loss, diluted weighted average shares would have totaled 17.81 million.
The 2005 and 2004 computation of diluted earnings (loss) per share did not include the effects of 0.30 million options to purchase shares of common stock because their exercise prices were greater than the corresponding market value per share of our common stock and would have an anti-dilutive effect on the computation. No option to purchase shares of common stock were excluded from the computation of diluted earnings (loss) per share for 2003.
F-71
24. CONDENSED QUARTERLY FINANCIAL DATA (UNAUDITED)
| | Quarter ended | ||||||||||||||
|---|---|---|---|---|---|---|---|---|---|---|---|---|---|---|---|
| | March 31, 2005 | June 30, 2005 | September 30, 2005 | December 31, 2005 | |||||||||||
| | (Dollars and shares in thousands, except per share amounts) | ||||||||||||||
| Revenues | |||||||||||||||
| Premiums earned | $ | 7,157 | $ | 9,064 | $ | 8,553 | $ | 8,569 | |||||||
| Net insured credit swap revenue | 3,597 | 946 | 12,529 | 4,499 | |||||||||||
| Net investment income | 53,529 | 60,945 | 66,887 | 73,230 | |||||||||||
| Net realized gains (losses) on investments and derivative instruments | 12,941 | (10,124 | ) | 2,360 | 456 | ||||||||||
| Other net credit swap revenue | 2,030 | 494 | 1,146 | 487 | |||||||||||
| Fee and other income | 3,159 | 1,502 | 3,040 | 3,598 | |||||||||||
| Total revenues | 82,413 | 62,827 | 94,515 | 90,839 | |||||||||||
| Expenses | |||||||||||||||
| Loss and loss adjustment expenses | 1,576 | 2,563 | 4,768 | 5,131 | |||||||||||
| Policy acquistion costs | 2,019 | 1,965 | 2,694 | 1,974 | |||||||||||
| Other operating expenses | 7,740 | 6,929 | 7,506 | 15,268 | |||||||||||
| Interest expense | 44,442 | 51,062 | 56,716 | 62,093 | |||||||||||
| Depreciation and amortization | 1,850 | 2,214 | 2,366 | 2,153 | |||||||||||
| Total expenses | 57,627 | 64,733 | 74,050 | 86,619 | |||||||||||
| (Income) loss of minority interest | (1,741 | ) | 56 | (1,440 | ) | (583 | ) | ||||||||
| Income (loss) before income taxes | 23,045 | (1,850 | ) | 19,025 | 3,637 | ||||||||||
| Provision for income tax | 8,303 | (225 | ) | 7,556 | (537 | ) | |||||||||
| Net income (loss) | $ | 14,742 | $ | (1,625 | ) | $ | 11,469 | $ | 4,174 | ||||||
Share and Per Share Data: | |||||||||||||||
| Numerator: | |||||||||||||||
| Total income (loss) | $ | 14,742 | $ | (1,625 | ) | $ | 11,469 | $ | 4,174 | ||||||
| Common stock undistributed earnings (loss) | $ | 3,945 | $ | (1,623 | ) | $ | 3,063 | $ | 1,114 | ||||||
| Participating convertible stock undistributed earnings | 10,796 | — | 8,407 | 3,058 | |||||||||||
| Total undistributed earnings (loss) | $ | 14,742 | $ | (1,625 | ) | $ | 11,469 | $ | 4,174 | ||||||
F-72
| | Quarter ended | ||||||||||||||
|---|---|---|---|---|---|---|---|---|---|---|---|---|---|---|---|
| | March 31, 2005 | June 30, 2005 | September 30, 2005 | December 31, 2005 | |||||||||||
| | (Dollars and shares in thousands, except per share amounts) | ||||||||||||||
| Denominator: | |||||||||||||||
| Weighted average shares outstanding - basic: | |||||||||||||||
| Common stock | 6,096 | 6,090 | 6,090 | 6,090 | |||||||||||
| Participating convertible stock | 16,686 | — | 16,716 | 16,716 | |||||||||||
| Total - basic | 22,782 | 6,090 | 22,806 | 22,806 | |||||||||||
| Effect of dilutive securities: | |||||||||||||||
| Convertible preferred stock | 6,678 | — | 6,678 | 6,678 | |||||||||||
| Stock options | 330 | — | 330 | 438 | |||||||||||
| Total - diluted | 29,790 | 6,090 | 29,814 | 29,922 | |||||||||||
| Basic earnings (loss) per share | $ | 0.65 | $ | (0.27 | ) | $ | 0.50 | $ | 0.18 | ||||||
| Diluted earnings (loss) per share | $ | 0.49 | $ | (0.27 | ) | $ | 0.38 | $ | 0.14 | ||||||
As a result of the net loss for the quarter ended June 30, 2005, 16.68 million weighted average shares of participating convertible stock were excluded from the computation of basic earnings (loss) per share. Participating convertible stockholders do not participate in losses with the common stockholders. Additionally, 6.66 million and 0.30 million weighted average shares of dilutive potential common stock, resulting from convertible preferred stock and stock options, respectively, were not included in the computation of diluted earnings (loss) per share for the quarter ended June 30, 2005. In the absence of the net loss, diluted weighted average shares would have totaled 29.73 million.
The computation of diluted earnings (loss) per share for the quarters ended March 31, June 30, September 30 and December 31, 2005 did not include the effect of 0.30 million options to purchase shares of common stock because their exercise prices were greater than the corresponding market value per share of our common stock and would have an anti-dilutive effect on the computation.
F-73
| | Quarter ended | |||||||||||||||
|---|---|---|---|---|---|---|---|---|---|---|---|---|---|---|---|---|
| | March 31, 2004 | June 30, 2004 | September 30, 2004 | December 31, 2004 | ||||||||||||
| | (Dollars and shares in thousands, except per share amounts) | |||||||||||||||
| Revenues | ||||||||||||||||
| Premiums earned | $ | 6,936 | $ | 7,292 | $ | 1,718 | $ | 13,887 | ||||||||
| Net insured credit swap revenue | 3,012 | 1,410 | 3,612 | 7,984 | ||||||||||||
| Net investment income | 24,850 | 27,656 | 34,150 | 39,514 | ||||||||||||
| Net realized gains (losses) on investments and derivative instruments | (10,615 | ) | 17,227 | (12,960 | ) | 6,321 | ||||||||||
| Other net credit swap revenue | 3,123 | 2,071 | 2,201 | 3,595 | ||||||||||||
| Fee and other income | 1,566 | 1,694 | 4,730 | 2,038 | ||||||||||||
| Total revenues | 28,872 | 57,350 | 33,451 | 73,339 | ||||||||||||
| Expenses | ||||||||||||||||
| Loss and loss adjustment expenses | 1,144 | 16,103 | 22,926 | 6,417 | ||||||||||||
| Policy acquisition costs | 1,188 | 1,563 | (405 | ) | 1,489 | |||||||||||
| Other operating expenses | 8,944 | 13,523 | 7,492 | 8,686 | ||||||||||||
| Interest expense | 20,176 | 22,415 | 27,135 | 31,411 | ||||||||||||
| Depreciation and amortization | 1,672 | 1,640 | 1,814 | 1,809 | ||||||||||||
| Total expenses | 33,124 | 55,244 | 58,962 | 49,812 | ||||||||||||
| (Income) loss of minority interest | 0 | 1,779 | 414 | (1,717 | ) | |||||||||||
| Income (loss) before income taxes | (4,252 | ) | 3,885 | (25,097 | ) | 21,810 | ||||||||||
| Provision for income tax | (1,421 | ) | 1,201 | (8,753 | ) | 9,108 | ||||||||||
| Net income (loss) | $ | (2,831 | ) | $ | 2,684 | $ | (16,344 | ) | $ | 12,702 | ||||||
Share and Per Share Data: | ||||||||||||||||
| Numerator: | ||||||||||||||||
| Net income (loss) | $ | (2,831 | ) | $ | 2,684 | $ | (16,344 | ) | $ | 12,702 | ||||||
| Common stock undistributed earnings (loss) | $ | (2,831 | ) | $ | 2,497 | $ | (16,344 | ) | $ | 3,409 | ||||||
| Participating convertible stock undistributed earnings | — | 187 | — | 9,293 | ||||||||||||
| Total undistributed earnings (loss) | $ | (2,831 | ) | $ | 2,684 | $ | (16,344 | ) | $ | 12,702 | ||||||
| Denominator: | ||||||||||||||||
| Weighted average shares outstanding - basic: | ||||||||||||||||
| Common stock | 6,270 | 6,210 | 6,096 | 6,096 | ||||||||||||
| Participating convertible stock | — | 462 | — | 16,620 | ||||||||||||
| Total - basic | 6,270 | 6,672 | 6,096 | 22,716 | ||||||||||||
| Effect of dilutive securities: | ||||||||||||||||
| Convertible preferred stock | — | 6,654 | — | 6,660 | ||||||||||||
| Stock options | — | 342 | — | 150 | ||||||||||||
| Total - diluted | 6,270 | 13,668 | 6,096 | 29,526 | ||||||||||||
| Basic earnings (loss) per share | $ | 0.45 | $ | 0.40 | $ | 2.68 | $ | 0.56 | ||||||||
| Diluted earnings (loss) per share | $ | 0.45 | $ | 0.20 | $ | 2.68 | $ | 0.43 | ||||||||
F-74
As a result of the net loss for the quarter ended March 31, 2004, 6.66 million and 0.36 million of dilutive potential common stock, resulting from convertible preferred stock and stock options, respectively, were not included in the computation of diluted earnings (loss) per share for the quarter ended March 31, 2004. In the absence of the net loss, weighted average shares of common and dilutive common stock would have totaled 13.29 million.
As a result of the net loss for the quarter ended September 30, 2004, 1.86 million weighted average shares of participating convertible stock were excluded from the computation of basic earnings (loss) per share. Participating convertible stockholders do not participate in losses with the common stockholders. Additionally, 6.66 million and 0.18 million weighted average shares of dilutive potential common stock, resulting from convertible preferred stock and stock options, respectively, were not included in the computation of diluted earnings (loss) per share for the quarter ended September 30, 2004. In the absence of the net loss, diluted weighted average shares would have totaled 14.80 million.
The computation of diluted earnings (loss) per share for the quarters ended March 31, June 30, September 30 and December 31, 2004 did not include the effect of 0.12 million, 0.12 million, 0.30 million and 0.30 million options, respectively, to purchase shares of common stock because their exercise prices were greater than the corresponding market value per share of our common stock and would have an anti-dilutive effect on the computation.
25. STOCK SPLIT
On August 3, 2006 the Company's Board of Directors authorized a dividend in order to effect a six-for-one stock split on the Company's outstanding shares of common stock and on each share of common stock to be issued upon conversion of the various classes of preferred stock of the Company. Each stockholder of record on August 3, 2006 has received five additional shares of common stock for each share of common stock held by such stockholder on that date. Additional funds have been shifted from the additional paid in capital account to the common stock account to equal the amount of additional par value represented by the additional shares which have been issued under the stock split. Upon the conversion of the various classes of the Company's preferred stock, each holder of convertible preferred stock, senior convertible preferred stock and Series B senior convertible preferred stock will be issued, in the case of convertible preferred stockholders and senior convertible preferred stockholders, 6000 shares for each of preferred stock held by such holder and, in the case of the Series B senior convertible preferred stockholders, 6 shares for each share of preferred stock held by such holder. All earnings per share and related stock option information presented in these financial statements and accompanying footnotes have been retroactively adjusted to reflect the increased number of shares resulting from this action. While outstanding common stock has been restated to reflect the stock split, outstanding preferred stock has not and will not be restated until such preferred stock are converted into common stock.
* * * * * *
F-75
The following descriptions of financial strength ratings are derived from more extensive explanations provided by Standard & Poor's Rating Group, a division of The McGraw-Hill Companies.
Standard & Poor's Rating Group
Insurer Financial Strength Ratings
A Standard & Poor's Insurer Financial Strength Rating is a current opinion of the financial security characteristics of an insurance organization with respect to its ability to pay under its insurance policies and contracts in accordance with their terms. This opinion is not specific to any particular policy or contract, nor does it address the suitability of a particular policy or contract for a specific purpose or purchaser. Furthermore, the opinion does not take into account deductibles, surrender or cancellation penalties, timeliness of payment, nor the likelihood of the use of a defense such as fraud to deny claims. For organizations with cross-border or multinational operations, including those conducted by subsidiaries or branch offices, the ratings do not take into account potential that may exist for foreign exchange restrictions to prevent financial obligations from being met. Insurer Financial Strength Ratings are based on information furnished by rated organizations or obtained by Standard & Poor's from other sources it considers reliable. Standard & Poor's does not perform an audit in connection with any rating and may on occasion rely on unaudited financial information. Ratings may be changed, suspended, or withdrawn as a result of changes in, or unavailability of such information or based on other circumstances. Insurer Financial Strength Ratings do not refer to an organization's ability to meet nonpolicy (i.e., debt) obligations. Assignment of ratings to debt issued by insurers or to debt issues that are fully or partially supported by insurance policies, contracts, or guarantees is a separate process from the determination of Insurer Financial Strength Ratings, and follows procedures consistent with issue credit rating definitions and practices. Insurer Financial Strength Ratings are not a recommendation to purchase or discontinue any policy or contract issued by an insurer or to buy, hold, or sell any security issued by an insurer. A rating is not a guaranty of an insurer's financial strength or security.
Insurer Financial Strength Ratings
An insurer rated 'BBB' or higher is regarded as having financial security characteristics that outweigh any vulnerabilities, and is highly likely to have the ability to meet financial commitments.
AAA
An insurer rated 'AAA' hasEXTREMELY STRONG financial security characteristics. 'AAA' is the highest Insurer Financial Strength Rating assigned by Standard & Poor's.
AA
An insurer rated 'AA' hasVERY STRONG financial security characteristics, differing only slightly from those rated higher.
A
An insurer rated 'A' hasSTRONG financial security characteristics, but is somewhat more likely to be affected by adverse business conditions than are insurers with higher ratings.
BBB
An insurer rated 'BBB' hasGOOD financial security characteristics, but is more likely to be affected by adverse business conditions than are higher rated insurers.
A-1
An insurer rated 'BB' or lower is regarded as having vulnerable characteristics that may outweigh its strengths. 'BB' indicates the least degree of vulnerability within the range; 'CC' the highest.
BB
An insurer rated 'BB' hasMARGINAL financial security characteristics. Positive attributes exist, but adverse business conditions could lead to insufficient ability to meet financial commitments.
B
An insurer rated 'B' hasWEAK financial security characteristics. Adverse business conditions will likely impair its ability to meet financial commitments.
CCC
An insurer rated 'CCC' hasVERY WEAK financial security characteristics, and is dependent on favorable business conditions to meet financial commitments.
CC
An insurer rated 'CC' hasEXTREMELY WEAK financial security characteristics and is likely not to meet some of its financial commitments.
R
An insurer rated 'R' has experienced aREGULATORY ACTION regarding solvency. The rating does not apply to insurers subject only to nonfinancial actions such as market conduct violations.
NR
An insurer designated 'NR' isNOT RATED, which implies no opinion about the insurer's financial security.
Plus (+) orminus (-) signs following ratings from 'AA' to 'CCC' show relative standing within the major rating categories.
CreditWatch highlights the potential direction of a rating, focusing on identifiable events and short-term trends that cause ratings to be placed under special surveillance by Standard & Poor's. The events may include mergers, recapitalizations, voter referenda, regulatory actions, or anticipated operating developments. Ratings appear on CreditWatch when such an event or a deviation from an expected trend occurs and additional information is needed to evaluate the rating. A listing, however, does not mean a rating change is inevitable, and whenever possible, a range of alternative ratings will be shown. CreditWatch is not intended to include all ratings under review, and rating changes may occur without the ratings having first appeared on CreditWatch. The "positive" designation means that a rating may be raised; "negative" means that a rating may be lowered; and "developing" means that a rating may be raised, lowered or affirmed.
'pi' Ratings, denoted with a "pi' subscript, are Insurer Financial Strength Ratings based on an analysis of published financial information and additional information in the public domain. They do not reflect in-depth meetings with an insurer's management nor do they incorporate material non-public information, and are therefore based on less comprehensive information than ratings without a "pi' subscript. "pi" ratings are reviewed annually based on a new year's financial statements, but may be reviewed on an interim basis if a major event that may affect an insurer's financial security occurs. "pi" ratings are not modified with "+" or "-" designations, nor are they subject to potential CreditWatch listings.
National Scale Ratings, denoted with a prefix such as "mx" (Mexico) or "ra" (Argentina), assess an insurer's financial security relative to other insurers in its home market. For more information, refer to the separate definitions for national scale ratings.
A-2
PART II
Information Not Required in Prospectus
Item 13. Other Expenses of Issuance and Distribution.
The following table shows the costs and expenses, other than underwriting discounts and commissions, payable in connection with the sale and distribution of the securities being registered. Except as otherwise noted, we will pay all of these amounts. All amounts except the SEC registration fee are estimated.
| Securities and Exchange Commission registration fee | $ | 25,529.35 | |
| National Association of Securities Dealers, Inc. filing fee | 10,500 | ||
| New York Stock Exchange listing fee | 220,000 | ||
| Printing and engraving expenses | 350,000 | ||
| Legal fees and expenses | 1,800,000 | ||
| Accounting fees and expenses | 1,500,000 | ||
| Transfer agent fees and expenses | 75,000 | ||
| Miscellaneous | 93,970.65 | ||
| Total | $ | 4,075,000 | |
Item 14. Indemnification of Directors and Officers.
Our Certificate of Incorporation and Bylaws provide that we will indemnify our directors and officers to the fullest extent permitted by Delaware law. Section 145 of the Delaware General Corporation Law permits a corporation to indemnify any director, officer, employee or agent of the corporation against expenses, including attorneys' fees, judgments, fines and amounts paid in settlement actually and reasonably incurred in connection with any action, suit or proceeding brought by reason of the fact that such person is or was a director, officer, employee or agent of the corporation, if such person acted in good faith and in a manner that he reasonably believed to be in or not opposed to the best interests of the corporation, and, with respect to any criminal action or proceeding, if he had no reason to believe his conduct was unlawful. In a derivative action (i.e., one brought by or on behalf of the corporation), indemnification may be made only for expenses, actually and reasonably incurred by any director, officer, employee or agent in connection with the defense or settlement of such an action or suit, if such person acted in good faith and in a manner that he reasonably believed to be in or not opposed to the best interests of the corporation, except that no indemnification shall be made if such person shall have been adjudged to be liable to the corporation, unless and only to the extent that the court in which the action or suit was brought shall determine that the defendant is fairly and reasonably entitled to indemnity for such expenses despite such adjudication of liability.
Pursuant to Section 102(b)(7) of the DGCL, our Certificate of Incorporation eliminates the liability of a director to the corporation or its stockholders for monetary damages for such breach of fiduciary duty as a director, except for liabilities arising (a) from any breach of the director's duty of loyalty to the corporation or its stockholders; (b) from acts or omissions not in good faith or which involve intentional misconduct or a knowing violation of law; (c) under Section 174 of the DGCL; or (d) from any transaction from which the director derived an improper personal benefit.
We have purchased directors and officers liability insurance policies. Such insurance would be available to our directors and officers in accordance with its terms. In addition, certain directors may be covered by directors and officers liability insurance policies purchased by their respective employers.
Reference is made to the form of Underwriting Agreement filed as Exhibit 1.1 hereto for provisions providing that the Underwriters are obligated, under certain circumstances, to indemnify the
II-1
directors, certain officers and the controlling persons of our company against certain liabilities under the Securities Act.
Reference is made to the employment agreements with our named executive officers filed as Exhibits 10.3 through 10.7 hereto for provisions that provide our named executive officers with further indemnification to the maximum extent permitted by law.
Item 15. Recent Sales of Unregistered Securities.
The following is a list of all securities sold by us or our predecessors, including American Capital Access Holdings, Limited, in the last three years. All of the issuances described below were exempt from registration (i) pursuant to Section 4(2) of the Securities Act, as transactions not involving a public offering, (ii) Rule 701 promulgated under the Securities Act or (iii) as transactions not involving a sale of securities. No underwriters were involved in connection with the sales of securities referred to in this Item 15.
On May 15, 2003, ACA Statutory Trust II, or Trust II, issued and sold $20,000,000 of its Floating Rate Capital Securities to I-Preferred Term Securities II, Ltd. The proceeds from these sales combined with the proceeds from the sale by Trust II to American Capital Access Holdings, Limited of its common securities were used by Trust II to purchase $20,619,000 in principal amount of Floating Rate Junior Subordinated Deferrable Interest Debentures of American Capital Access Holdings, Limited. The Registrant believes that this transaction, if deemed to be a sale of a security, was exempt from the registration requirements of the Securities Act by virtue of Section 4(2) thereof.
On October 29, 2003, ACA Statutory Trust III, or Trust III, issued and sold $20,000,000 of its Floating Rate Capital Securities to I-Preferred Term Securities III, Ltd. The proceeds from these sales combined with the proceeds from the sale by Trust III to American Capital Access Holdings, Limited of its common securities were used by Trust III to purchase $20,619,000 in principal amount of Floating Rate Junior Subordinated Deferrable Interest Debentures of American Capital Access Holdings, Limited. The Registrant believes that this transaction, if deemed to be a sale of a security, was exempt from the registration requirements of the Securities Act by virtue of Section 4(2) thereof.
On December 29, 2004, ACA Statutory Trust IV, or Trust IV, issued and sold $20,000,000 of its Floating Rate Capital Securities to Keefe, Bruyette & Woods, Inc. The proceeds from these sales combined with the proceeds from the sale by Trust IV to ACA Capital Holdings, Inc. of its common securities were used by Trust IV to purchase $20,619,000 in principal amount of Floating Rate Junior Subordinated Deferrable Interest Debentures of ACA Capital Holdings, Inc. The Registrant believes that this transaction, if deemed to be a sale of a security, was exempt from the registration requirements of the Securities Act by virtue of Section 4(2) thereof.
On June 4, 2004, June 28, 2004 and July 12, 2004, we issued 268,471, 26,847 and 11,813 shares of series A senior convertible preferred stock for $25.0 million, $2.5 million and $1.1 million, respectively, to existing stockholders. All of these shares were converted to series B senior convertible preferred stock on September 30, 2004. On the same day, we issued an additional 2,247,552 shares of series B senior convertible preferred stock for $140.0 million to BSMB/ACA LLC, Drawbridge Special Opportunities Fund L.P. and existing stockholders. The Registrant believes that this transaction, if deemed to be a sale of a security, was exempt from the registration requirements of the Securities Act by virtue of Section 4(2) thereof.
On September 30, 2004, we granted 55,869 restricted shares of our series B senior convertible preferred stock, par value $0.10, at a fair market value of $62.29 per share, to our new president and chief executive officer. The total value at the grant date of the restricted stock totaled $3.5 million. The Registrant believes that this transaction, if deemed to be a sale of a security, was exempt from the registration requirements of the Securities Act by virtue of Section 4(2) thereof.
II-2
On November 30, 2004, we (i) issued 13,501 shares of our series C senior convertible preferred stock, par value $0.10, for $0.8 million to Douglas Jacobs, who serves on our Board of Directors, and the following members of our senior management: Ruben Selles, Laura Schwartz, Steven Schrager, James Rothman, Joseph Pimbley, Vincent Ingato, William Tomljanovic, Brad Larson, Adam Willkomm, Lisa Mumford and Nora Dahlman; and (ii) issued an additional 4,705 shares of series B senior convertible preferred stock for $0.3 million to BSMB/ACA LLC, one of our existing stockholders. We issued an additional 5,000 shares of series C senior convertible preferred stock to one of our directors, William H. Lacy, on June 17, 2005. Each share of series C senior convertible preferred stock automatically converted into one share of series B senior convertible preferred on November 30, 2005. The Registrant believes that each transaction with members of the Board of Directors and management, if deemed to be a sale of a security, was exempt from the registration requirements of the Securities Act by virtue of Rule 701 thereof. The Registrant believes that the transaction with BSMB/ACA LLC, if deemed to be a sale of a security, was exempt from the registration requirements of the Securities Act by virtue of Section 4(2) thereof.
During the three years ended October 3, 2006 we granted 2,700,343 options to purchase 2,700,343 shares of common stock, all of which were granted to our employees. The Registrant believes that each transaction, if deemed to be a sale of a security, was exempt from the registration requirements of the Securities Exchange Act by virtue of Rule 701 promulgated under Section 3(b) of the Securities Act as transactions pursuant to a compensatory benefit plan or a contract relating to compensation.
Item 16. Exhibits and Financial Statement Schedules.
- (a)
- Exhibits
The Exhibit Index filed herewith is incorporated herein by reference.
(b) Financial Statement Schedules
Schedule I: Summary of Investments
Schedule II: Condensed Financial Information of the Registrant
Schedule III: Supplementary Insurance Information
Schedule IV: Reinsurance
II-3
Report of Independent Registered Public Accounting Firm
On Financial Statement Schedules
To the Board of Directors and Stockholders of
ACA Capital Holdings, Inc.:
Our audit of the consolidated financial statements referred to in our report dated August 20, 2004, except for the effects on the 2003 financial statements of the restatement discussed in Note 2 under the caption "2003 Financial Statement Restatement", as to which the date is August 15, 2005, and except for the segment information discussed in Note 22 and the earnings per share information discussed in Note 23, as to which the date is May 9, 2006, and except for the effects of the stock split discussed in Note 25, as to which the date is August 28, 2006 and except for the effects of reclassifications discussed in Note 2 under the caption "Reclassifications", as to which the date is October 26, 2006, included an audit of the accompanying financial statement schedules listed in Item 16 of this Form S-1. In our opinion, these financial statement schedules for the year ended December 31, 2003, present fairly, in all material respects, the information set forth therein when read in conjunction with the related consolidated financial statements.
/s/ PricewaterhouseCoopers LLP
Los Angeles, California
August 20, 2004, except for the effects on the 2003 financial statements of the restatement discussed in Note 2 under the caption "2003 Financial Statement Restatement", as to which the date is August 15, 2005, and except for the segment information discussed in Note 22 and the earnings per share information discussed in Note 23, as to which the date is May 9, 2006, and except for the effects of the stock split discussed in Note 25, as to which the date is August 28, 2006 and except for the effects of reclassifications discussed in Note 2 under the caption "Reclassifications", as to which the date is October 26, 2006.
II-4
ACA Capital Holdings, Inc.
Schedule I
Summary of Investments—Other than Investments in Related Parties
As of December 31, 2005 (Dollars in Thousands)
| Type of Investment | Cost (Amortized) | Value | Amount At Which Shown In The Balance Sheet | ||||||||||
|---|---|---|---|---|---|---|---|---|---|---|---|---|---|
| Fixed Maturities: | |||||||||||||
| Bonds: | |||||||||||||
| United States Government and government agencies and authorities | $ | 103,863 | $ | 101,937 | $ | 101,937 | |||||||
| States, municipalities and political subdivisions | 112,959 | 112,079 | 112,079 | ||||||||||
| Public Utilities | 8,755 | 8,798 | 8,798 | ||||||||||
| All other corporate bonds | 269,186 | 264,784 | 264,784 | ||||||||||
| VIE Asset Backed Securities | 4,781,368 | 4,794,817 | 4,810,965 | (1) | |||||||||
| Certificates of Deposit | 176 | 176 | 176 | ||||||||||
| Total fixed maturities | 5,276,307 | 5,282,591 | 5,298,739 | ||||||||||
VIE Guaranteed investment contract | 119,340 | 119,340 | 119,340 | ||||||||||
| Total Investments | $ | 5,395,647 | $ | 5,401,931 | $ | 5,418,079 | |||||||
- (1)
- This difference of $16,148 is the total investment in related party CDOs.
II-5
ACA Capital Holdings, Inc.
Schedule II
Condensed Financial Information of Registrant
CONDENSED BALANCE SHEETS
Parent Company Only
(Dollars in Thousands)
| | December 31, | ||||||
|---|---|---|---|---|---|---|---|
| | 2005 | 2004 | |||||
| ASSETS | |||||||
| Investments in subsidiaries and affiliates, at equity in net assets | $ | 440,075 | $ | 423,346 | |||
| Cash and cash equivalents | 184 | — | |||||
| Receivable from affiliates | 8,206 | 7,174 | |||||
| Deferred debt issuance costs | 2,161 | 2,239 | |||||
| Notes receivable from affiliates | 10,000 | 10,000 | |||||
| Other assets | 4,524 | 2,241 | |||||
| Total assets | $ | 465,150 | $ | 445,000 | |||
LIABILITIES AND STOCKHOLDERS' EQUITY | |||||||
| Debt | $ | 79,899 | $ | 79,899 | |||
| Accrued interest payable | 493 | 487 | |||||
| Accrued expenses and other liabilities | 445 | — | |||||
| Total liabilities | 80,837 | 80,386 | |||||
Senior convertible preferred stock—220 shares authorized, 129 shares issued and outstanding at December 31, 2005 and 2004 | 7,339 | 7,339 | |||||
| Convertible preferred stock—1,500 shares authorized, 959 shares issued and outstanding at December 31, 2005 and 2004 | 54,858 | 54,858 | |||||
| Series B senior convertible preferred stock—3,000,000 shares authorized, 2,785,769 shares and 2,767,268 shares issued and outstanding at December 31, 2005 and 2004, respectively | 164,263 | 163,050 | |||||
| Series C senior convertible preferred stock—35,000 shares authorized, 0 shares and 13,501 shares issued and outstanding at December 31, 2005 and 2004, respectively) | — | 841 | |||||
| Common stock of 12,000,000 shares authorized at December 31, 2005 and 2004; 6,442,950 shares issued and outstanding at December 31, 2005 and 2004, respectively) | 644 | 644 | |||||
| Gross paid-in and contributed capital | 125,184 | 125,184 | |||||
| Treasury stock at cost (351,876 shares and 344,748 shares at December 31, 2005 and 2004, respectively) | (5,500 | ) | (5,426 | ) | |||
| Notes receivable from stockholders | (1,355 | ) | (1,656 | ) | |||
| Deferred compensation | (2,030 | ) | (3,190 | ) | |||
| Accumulated other comprehensive income—net of deferred income tax of $5,369 and $11,195 at December 31, 2005 and 2004, respectively | 11,132 | 21,952 | |||||
| Retained earnings | 29,778 | 1,018 | |||||
| Total stockholders' equity | 384,313 | 364,614 | |||||
| Total liabilities and stockholders' equity | $ | 465,150 | $ | 445,000 | |||
See Supplemental Notes.
II-6
ACA Capital Holdings, Inc.
Schedule II
Condensed Financial Information of Registrant
CONDENSED STATEMENT OF INCOME
Parent Company Only
(Dollars in Thousands)
| | For the years ended December 31, | ||||||||
|---|---|---|---|---|---|---|---|---|---|
| | 2005 | 2004 | 2003 | ||||||
| Revenues: | |||||||||
| Net investment income | $ | 95 | $ | 178 | $ | 322 | |||
| Total revenues | 95 | 178 | 322 | ||||||
Expenses: | |||||||||
| Other operating expenses | 1,264 | 778 | 264 | ||||||
| Interest expense | 5,114 | 3,279 | 1,853 | ||||||
| Depreciation and amortization | 114 | 56 | 35 | ||||||
| Total expenses | 6,492 | 4,113 | 2,152 | ||||||
| Equity in earnings (loss) of subsidiaries and affiliates | 32,662 | (543 | ) | 21,797 | |||||
| Income (loss) before income taxes | 26,265 | (4,478 | ) | 19,967 | |||||
| Provision for income tax benefit | (2,495 | ) | (689 | ) | — | ||||
| Net income (loss) | $ | 28,760 | $ | (3,789 | ) | $ | 19,967 | ||
See Supplemental Notes.
II-7
ACA Capital Holdings, Inc.
Schedule II
Condensed Financial Information of Registrant
CONDENSED STATEMENTS OF CASH FLOWS
Parent Company Only
(Dollars in Thousands)
| | Years Ended December 31, | ||||||||||
|---|---|---|---|---|---|---|---|---|---|---|---|
| | 2005 | 2004 | 2003 | ||||||||
| Cash flows from operating activities: | |||||||||||
| Net income (loss) | $ | 28,760 | $ | (3,789 | ) | $ | 19,967 | ||||
| Adjustments to reconcile net income (loss) to net cash provided by operating activities: | |||||||||||
| Equity in net (income)/loss of affiliates | (32,662 | ) | 543 | (21,797 | ) | ||||||
| Increase/(decrease) in intercompany payable balances | (1,032 | ) | 5,209 | (13,381 | ) | ||||||
| Deferred compensation | 1,160 | (3,190 | ) | — | |||||||
| Dividends received from subsidiaries | 5,114 | 3,279 | 1,853 | ||||||||
| Increase/(decrease) in accrued expenses and other liabilities | 445 | — | (107 | ) | |||||||
| Discharge of notes receivable from stockholders | 264 | — | — | ||||||||
| Increase in accrued interest payable | 6 | 87 | 323 | ||||||||
| Amortization of debt issuance costs | 78 | 55 | 35 | ||||||||
| Increase in taxes receivable | (1,368 | ) | — | — | |||||||
| Other | (855 | ) | 1,277 | (3,399 | ) | ||||||
| Net cash provided/(used) by operating activities | (90 | ) | 3,471 | (16,506 | ) | ||||||
| Cash flows from investing activities: | |||||||||||
| Capital contributions to subsidiaries | — | (188,110 | ) | (17,339 | ) | ||||||
| Notes receivable from affiliates | — | (9,120 | ) | — | |||||||
| Net cash used in investing activities | — | (197,230 | ) | (17,339 | ) | ||||||
| Cash flows from financing activities: | |||||||||||
| Proceeds from issuance of debt | — | 20,619 | 41,238 | ||||||||
| Payment of deferred debt issuance costs | — | (603 | ) | (1,201 | ) | ||||||
| Proceeds from issuance of preferred stock, net of issuance cost | 311 | 163,891 | — | ||||||||
| Change in notes receivable from stockholders | 37 | 344 | — | ||||||||
| Purchase of treasury stock | (74 | ) | (4 | ) | — | ||||||
| Net cash provided by financing activities | 274 | 184,247 | 40,037 | ||||||||
| Net increase/(decrease) in cash and cash equivalents | 184 | (9,512 | ) | 6,192 | |||||||
| Cash and cash equivalents at beginning of year | — | 9,512 | 3,320 | ||||||||
| Cash and cash equivalents at end of year | $ | 184 | $ | — | $ | 9,512 | |||||
| Supplemental cash flow disclosures: | |||||||||||
| Income taxes paid | $ | 414 | $ | 10 | $ | 2,814 | |||||
| Interest paid | $ | 5,108 | $ | 3,192 | $ | 1,530 | |||||
See Supplemental Notes.
II-8
ACA Capital Holdings, Inc.
Schedule II
Condensed Financial Information of Registrant
NOTES TO FINANCIAL STATEMENTS
Parent Company Only
- 1.
- Condensed Financial Statements
The Parent Company condensed financial statements should be read in conjunction with the Company's consolidated financial statements and the notes thereto prepared in accordance with accounting principles generally accepted in the United States of America ("U.S. GAAP"), which are included elsewhere in this registration statement.
- 2.
- Significant Accounting Policies
The Parent Company carries its investment in subsidiaries under the equity method.
- 3.
- Long Term Obligations
As of December 31, 2005 and 2004, the Parent Company issued trust preferred debt securities of $79.9 million. The trust preferred securities have a stated term of 30 years with a call provision of five years from the date of each issuance. The current interest rates on the outstanding securities range from 7.84% to 8.43% at December 31, 2005. The effective interest rate of these securities is calculated based on 3-Month LIBOR plus a margin of 3.35% to 4.1% per annum subject to certain interest rate caps during the lives of the securities.
| Issue | December 31, 2005 | December 31, 2004 | Issue Date | Maturity Date | Interest Rate Spread as of December 31, 2005 | |||||||
|---|---|---|---|---|---|---|---|---|---|---|---|---|
| | (in thousands) | (in thousands) | | | | |||||||
| I-PreTS I | $ | 18,042 | $ | 18,042 | December 4, 2002 | December 2032 | 3 Month LIBOR + 4.00% | |||||
| I-PreTS II | 20,619 | 20,619 | May 15, 2003 | May 2033 | 3 Month LIBOR + 4.10% | |||||||
| I-PreTS III | 20,619 | 20,619 | October 29, 2003 | October 2033 | 3 Month LIBOR + 3.95% | |||||||
| I-PreTS IV | 20,619 | 20,619 | December 29, 2004 | December 2034 | 3 Month LIBOR + 3.35% | |||||||
| Total | $ | 79,899 | $ | 79,899 | ||||||||
- 4.
- Mandatory Dividend Requirements on Preferred Stock
The Parent Company does not have mandatory dividend or redemption requirements for any of its classes of preferred stock.
- 5.
- Dividends from Subsidiaries
The Parent Company received dividends from consolidated subsidiaries of $5.1 million, $3.3 million and $1.9 million for the years ended December 31, 2005, 2004 and 2003, respectively.
- 6.
- Material Contingencies
The Parent Company has recorded a reserve in its financial statements for damages, litigation costs and accrued interest with respect to a claim against the Company by a former executive officer. The aggregate amount of the reserve as of December 31, 2005 was $4.2 million.
- 7.
- Stock Split
On August 3, 2006 the Company's Board of Directors authorized a dividend in order to effect a six-for-one stock split on the Company's outstanding shares of common stock and on each share of common stock to be issued upon conversion of the various classes of preferred stock of the Company. Each stockholder of record on August 3, 2006 has received five additional shares of common stock for each share of common stock held by such stockholder on that date. Additional funds have been shifted from then additional paid in capital account to the common stock account to equal the amount of additional par value represented by the additional shares which have been issued under the stock split. Upon the conversion of the various classes of the Company's preferred stock, each holder of convertible preferred stock, senior convertible preferred stock and
II-9
Series B senior convertible preferred stock will be issued, in the case of convertible preferred stockholders and senior convertible preferred stockholders, 6,000 shares for each preferred stock held by such holder and, in the case of the Series B senior convertible preferred stockholders, 6 shares for each share of preferred stock held by such holder. All earnings per share and related stock option information presented in these condensed financial statements have been retroactively adjusted to reflect the increased number of shares resulting from this action. While outstanding common stock has been restated to reflect the stock split, outstanding preferred stock has not and will not be restated until such preferred stock are converted into common stock.
II-10
ACA Capital Holdings, Inc.
Schedule III
Supplementary Insurance Information
As of and for the Years Ended December 31, 2005, 2004 and 2003
(Dollars in thousands)
| | 2005 | ||||||||||||||||||||||||||
|---|---|---|---|---|---|---|---|---|---|---|---|---|---|---|---|---|---|---|---|---|---|---|---|---|---|---|---|
| Segment | Deferred Policy Acquisition Costs | Unearned Premium Reserve | Reserve for Loss & LAE Expense | Net Investment Income | Net Premium Written | Net Premiums Earned | Loss & LAE Expense | Acquisition Costs | Other Operating Expenses | ||||||||||||||||||
| Municipal Finance | $ | 46,942 | $ | 186,408 | $ | 16,807 | $ | 13,862 | $ | 34,877 | $ | 23,889 | $ | 7,459 | $ | 6,970 | $ | 7,201 | |||||||||
| CDO Asset Management(1) | — | — | — | 236,591 | — | — | — | — | 19,049 | ||||||||||||||||||
| Structured Credit(1) | — | 90 | — | 828 | 2,638 | 2,548 | — | — | 7,430 | ||||||||||||||||||
| Other | 472 | 1,241 | 17,499 | 3,310 | 4,403 | 6,906 | 6,579 | 1,682 | 3,763 | ||||||||||||||||||
| Total | $ | 47,414 | $ | 187,739 | $ | 34,306 | $ | 254,591 | $ | 41,918 | $ | 33,343 | $ | 14,038 | $ | 8,652 | $ | 37,443 | |||||||||
| | 2004 | ||||||||||||||||||||||||||
|---|---|---|---|---|---|---|---|---|---|---|---|---|---|---|---|---|---|---|---|---|---|---|---|---|---|---|---|
| Segment | Deferred Policy Acquisition Costs | Unearned Premium Reserve | Reserve for Loss & LAE Expense | Net Investment Income | Net Premium Written | Net Premiums Earned | Loss & LAE Expense | Acquisition Costs | Other Operating Expenses | ||||||||||||||||||
| Municipal Finance | $ | 45,956 | $ | 176,351 | $ | 12,520 | $ | 8,770 | $ | 29,780 | $ | 13,930 | $ | 4,310 | $ | 2,238 | $ | 7,148 | |||||||||
| CDO Asset Management(1) | — | — | — | 114,782 | — | — | — | — | 18,910 | ||||||||||||||||||
| Structured Credit(1) | — | — | — | 524 | 4,670 | 6,161 | — | — | 8,870 | ||||||||||||||||||
| Other | 600 | 3,789 | 23,486 | 2,094 | 11,032 | 9,742 | 42,280 | 1,597 | 3,717 | ||||||||||||||||||
| Total | $ | 46,556 | $ | 180,140 | $ | 36,006 | $ | 126,170 | $ | 45,482 | $ | 29,833 | $ | 46,590 | $ | 3,835 | $ | 38,645 | |||||||||
| | 2003 | ||||||||||||||||||||||||||
|---|---|---|---|---|---|---|---|---|---|---|---|---|---|---|---|---|---|---|---|---|---|---|---|---|---|---|---|
| Segment | Deferred Policy Acquisition Costs | Unearned Premium Reserve | Reserve for Loss & LAE Expense | Net Investment Income | Net Premium Written | Net Premiums Earned | Loss & LAE Expense | Acquisition Costs | Other Operating Expenses | ||||||||||||||||||
| Municipal Finance | $ | 41,723 | $ | 168,557 | $ | 6,224 | $ | 6,837 | $ | 45,919 | $ | 8,795 | $ | 1,377 | $ | 3,788 | $ | 7,072 | |||||||||
| CDO Asset Management(1) | — | — | — | 43,991 | — | — | — | — | 16,222 | ||||||||||||||||||
| Structured Credit(1) | — | 1,492 | — | 408 | 5,585 | 5,171 | — | — | 4,847 | ||||||||||||||||||
| Other | — | 2,229 | (1,240 | ) | 1,632 | 6,012 | 4,830 | 1,791 | 289 | 1,325 | |||||||||||||||||
| Total | $ | 41,723 | $ | 172,278 | $ | 4,984 | $ | 52,868 | $ | 57,516 | $ | 18,796 | $ | 3,168 | $ | 4,077 | $ | 29,466 | |||||||||
- (1)
- Because CDO Asset Management and Structured Credit transactions are in the form of credit default swaps and are derivatives under SFAS 133, any loss activity is recorded in the caption, "Net realized and unrealized gains (losses) on derivatives." Revenues received are recorded as premium because our insurance subsidiary, ACA Financial Guaranty, provides credit protection to the buyers under these contracts pursuant to its role as financial guarantor.
II-11
ACA Capital Holdings, Inc.
Schedule IV
Reinsurance
For the Years Ended December 31, 2005, 2004 and 2003
(Dollars in thousands)
| | Gross Amount | Ceded | Assumed | Net | Percentage of Amount Assumed to Net | ||||||||||
|---|---|---|---|---|---|---|---|---|---|---|---|---|---|---|---|
| 2005 Earned Premium | $ | 32,684 | $ | (337 | ) | $ | 996 | $ | 33,343 | 2.99 | % | ||||
| 2004 Earned Premium | 36,399 | (6,874 | ) | 308 | 29,833 | 1.03 | % | ||||||||
| 2003 Earned Premium | 23,859 | (6,064 | ) | 1,001 | 18,796 | 5.33 | % | ||||||||
Item 17. Undertakings.
The undersigned Registrant hereby undertakes to provide to the underwriter at the closing specified in the underwriting agreements, certificates in such denominations and registered in such names as required by the underwriter to permit prompt delivery to each purchaser.
Insofar as indemnification for liabilities arising under the Securities Act of 1933 may be permitted to directors, officers and controlling persons of the Registrant pursuant to the foregoing provisions, or otherwise, the Registrant has been advised that in the opinion of the Securities and Exchange Commission such indemnification is against public policy as expressed in the Securities Act and is, therefore, unenforceable. In the event that a claim for indemnification against such liabilities (other than the payment by the Registrant of expenses incurred or paid by a director, officer or controlling person of the Registrant in the successful defense of any action, suit or proceeding) is asserted by such director, officer or controlling person in connection with the securities being registered, the Registrant will, unless in the opinion of its counsel the matter has been settled by controlling precedent, submit to a court of appropriate jurisdiction the question whether such indemnification by it is against public policy as expressed in the Securities Act and will be governed by the final adjudication of such issue.
The undersigned registrant hereby undertakes that:
- (1)
- For purposes of determining any liability under the Securities Act of 1933, the information omitted from the form of prospectus filed as part of this registration statement in reliance upon Rule 430A and contained in a form of prospectus filed by the registrant pursuant to Rule 424(b)(1) or (4) or 497(h) under the Securities Act shall be deemed to be part of this registration statement as of the time it was declared effective.
- (2)
- For the purpose of determining any liability under the Securities Act of 1933, each post-effective amendment that contains a form of prospectus shall be deemed to be a new registration statement relating to the securities offered therein, and the offering of such securities at that time shall be deemed to be the initialbona fide offering thereof.
II-12
Pursuant to the requirements of the Securities Act of 1933, the registrant has duly caused this Registration Statement to be signed on its behalf by the undersigned, thereunto duly authorized, in the City of New York, State of New York, on October 27, 2006.
| ACA CAPITAL HOLDINGS, INC. | ||||||
By: | /s/ ALAN S. ROSEMAN | |||||
| Name: | Alan S. Roseman | |||||
| Title: | President and Chief Executive Officer | |||||
II-13
Pursuant to the requirements of the Securities Act of 1933, this registration statement has been signed by the following persons in the capacities and on the dates indicated.
| Signature | Title | Date | ||
|---|---|---|---|---|
| /s/ ALAN S. ROSEMAN Alan S. Roseman | President, Chief Executive Officer and Director (Principal Executive Officer) | October 27, 2006 | ||
/s/ EDWARD U. GILPIN Edward U. Gilpin | Chief Financial Officer, Executive Vice President and Director (Principal Financial and Accounting Officer) | October 27, 2006 | ||
* David E. King | Chairman of the Board | October 27, 2006 | ||
* David M. Barse | Director | October 27, 2006 | ||
* John G. Berylson | Director | October 27, 2006 | ||
* Douglas L. Jacobs | Director | October 27, 2006 | ||
* Robert Juneja | Director | October 27, 2006 | ||
* William H. Lacy | Director | October 27, 2006 | ||
* Warren A. Stephens | Director | October 27, 2006 |
*By: | /s/ ALAN S. ROSEMAN Alan S. Roseman Attorney-in-fact |
II-14
| Exhibit No. | Description | |
|---|---|---|
| 1.1 | Form of Underwriting Agreement.** | |
| 3.1 | Certificate of Incorporation of the Registrant.** | |
| 3.1.1 | Certificate of Amendment of Certificate of Incorporation of the Registrant.** | |
| 3.1.2 | Certificate of Amendment of Certificate of Incorporation of the Registrant.** | |
| 3.1.3 | Certificate of Amendment of Certificate of Incorporation of the Registrant.** | |
| 3.1.4 | Certificate of Designations of the Registrant.** | |
| 3.1.5 | Certificate of Amendment of Certificate of Incorporation of the Registrant.** | |
| 3.1.6 | Certificate of Amendment of Certificate of Incorporation of the Registrant.** | |
| 3.1.7 | Certificate of Amendment of Certificate of Incorporation of the Registrant.** | |
| 3.2 | Bylaws of the Registrant.** | |
| 3.2.1 | First Amendment to the Bylaws of the Registrant.** | |
| 3.2.2 | Second Amendment to the Bylaws of the Registrant.** | |
| 4.1 | Reference is made to Exhibits 3.1 through 3.2. | |
| 4.2 | Specimen common stock certificate.** | |
| 4.3 | Amended and Restated Registration Rights Agreement, dated as of September 30, 2004.** | |
| 4.3.1 | Amendment No. 1 to Amended and Restated Registration Rights Agreement, dated as of November 23, 2004.** | |
| 4.3.2 | Amendment No. 2 to Amended and Restated Registration Rights Agreement, dated as of June 9, 2006.** | |
| 4.4 | Stockholders Agreement, dated as of September 30, 2004.** | |
| 4.4.1 | Amendment No. 1 to Stockholders Agreement, dated as of November 23, 2004.** | |
| 4.4.2 | Amendment No. 2 to Stockholders Agreement, dated as of June 16, 2006.** | |
| 5.1 | Opinion of Fried, Frank, Harris, Shriver & Jacobson LLP.** | |
| 5.2 | Opinion of Nora J. Dahlman, Esq., Secretary, General Counsel and Managing Director of the Registrant.** | |
| 10.1 | Credit Agreement dated May 1, 2006 among ACA Capital Holdings, Inc., J.P. Morgan Securities Inc. and JPMorgan Chase Bank, N.A.** | |
| 10.2 | Investment Agreement, dated as of March 11, 2005, between ACA Parliament Funding, L.L.C. and Premium Asset Trust, With Respect to Premium Asset Trust, ACA Trust Series I.** | |
| 10.3 | Indenture, dated as of December 29, 2004, between ACA Capital Holdings, Inc., and Wilmington Trust Company.** | |
| 10.4 | Indenture, dated as of October 29, 2003, between American Capital Access Holdings, Limited, and U.S. Bank National Association.** | |
| 10.5 | Indenture, dated as of May 15, 2003, between American Capital Access Holdings, Limited, and U.S. Bank National Association.** | |
| 10.6 | Indenture, dated as of December 4, 2002, between American Capital Access Holdings, Limited, and State Street Bank and Trust Company of Connecticut, National Association.** | |
| 10.7 | Form of Amended and Restated Employment Agreement, between the Registrant and Alan S. Roseman.** | |
| 10.8 | Amended and Restated Employment Agreement, dated as of September 30, 2004, between the Registrant and Edward U. Gilpin** | |
| 10.8.1 | Form of Amendment No. 1 to Amended and Restated Employment Agreement between the Registrant and Edward U. Gilpin.** | |
| 10.9 | Amended and Restated Employment Agreement, dated as of September 30, 2004, between the Registrant and William Tomljanovic.** | |
| 10.9.1 | Amendment No. 1 to Amended and Restated Employment Agreement, dated as of January 2, 2005, between the Registrant and William Tomljanovic.** | |
| 10.10 | Employment Agreement, dated as of September 30, 2004, between the Registrant and Laura Schwartz.** | |
| 10.11 | Employment Agreement, dated as of September 30, 2004, between the Registrant and James Rothman.** | |
| 10.12 | Amended and Restated 2004 Stock Incentive Plan.** | |
| 10.12.1 | Amendment No. 1 to Amended and Restated 2004 Stock Incentive Plan.** | |
| 10.13 | Omnibus Equity Incentive Compensation Plan.** | |
| 10.14 | Fixed Income Investment Management Agreement, dated as of October 1, 2004, between ACA Financial Guaranty Corporation and J.P. Morgan Investment Management Inc.** | |
| 10.15 | Fixed Income Investment Management Agreement, dated as of March 26, 2002, between ACA Financial Guaranty Corporation and Stephens Inc.** | |
| 10.16 | Indemnity Agreement, dated as of May 10, 2005, between ACA Capital Holdings, Inc. and Douglas Jacobs.** | |
| 10.17 | Indemnity Agreement, dated as of May 10, 2005, between ACA Capital Holdings, Inc. and William Lacy.** | |
| 10.18 | Amended and Restated 2006 Stock Incentive Plan.** | |
| 10.19 | Form of Amended and Restated Incentive Stock Option Agreement.** | |
| 10.20 | Form of Amended and Restated Non-Qualified Stock Option Agreement.** | |
| 10.21 | Form of Restricted Stock Award.** | |
| 16.1 | Letter from PricewaterhouseCoopers LLP.** | |
| 21.1 | List of Subsidiaries.** | |
| 23.1 | Consent of Fried, Frank, Harris, Shriver & Jacobson LLP (included in Exhibit 5.1).** | |
| 23.2 | Consent of Deloitte & Touche LLP. | |
| 23.3 | Consent of PricewaterhouseCoopers LLP. | |
| 24.1 | Power of Attorney (included on signature page).** |
- **
- Previously filed.
TABLE OF CONTENTS
PROSPECTUS SUMMARY
OUR BUSINESS
THE OFFERING
ADDITIONAL INFORMATION
SELECTED CONSOLIDATED FINANCIAL AND OTHER DATA
RISK FACTORS
FORWARD-LOOKING STATEMENTS
USE OF PROCEEDS
DIVIDEND POLICY
CAPITALIZATION
DILUTION
SELECTED CONSOLIDATED FINANCIAL AND OTHER DATA
MANAGEMENT'S DISCUSSION AND ANALYSIS OF FINANCIAL CONDITION AND RESULTS OF OPERATIONS
At Closing
One Year Later
INDUSTRY OVERVIEW
Credit Swaps Outstanding, 2001-1H 2006 (in trillions)
U.S. Municipal Finance Long-Term Market, 1996-2005(1)
Municipal New Issues Low Investment Grade(1) and Non-Investment Grade/Non-Rated(2)
BUSINESS
Notional Amount of Structured Credit Portfolio (in billions)
Insured Municipal Finance Portfolio by Bond Type (in millions)
Municipal Finance Insured Portfolio by State or Territory (in millions)
CDO Assets Under Management—ABS
CDO Assets Under Management—Corporate
CDO Assets Under Management—Leveraged Loan
Net Par Exposure by Business Line
Net Par Exposure by Credit Quality
Non-VIE Investment Portfolio by Security Type(1)
Non-VIE Investment Results(1)(2)
Non-VIE Investment Portfolio by Rating(1)(2)(3)
Distribution of Non-VIE Investments by Maturity(1)(2)(3)
MANAGEMENT
COMMITTEES OF THE BOARD OF DIRECTORS
EXECUTIVE COMPENSATION
PRINCIPAL AND SELLING STOCKHOLDERS
CERTAIN RELATIONSHIPS AND RELATED PARTY TRANSACTIONS
DESCRIPTION OF CAPITAL STOCK
SHARES ELIGIBLE FOR FUTURE SALE
MATERIAL U.S. FEDERAL INCOME TAX CONSIDERATIONS
UNDERWRITING
LEGAL MATTERS
EXPERTS
CHANGE IN INDEPENDENT REGISTERED PUBLIC ACCOUNTING FIRM
WHERE YOU CAN FIND ADDITIONAL INFORMATION
ACA CAPITAL HOLDINGS, INC. AND SUBSIDIARIES INDEX TO CONSOLIDATED FINANCIAL STATEMENTS
ACA CAPITAL HOLDINGS, INC. AND SUBSIDIARIES CONSOLIDATED BALANCE SHEETS (UNAUDITED) AS OF JUNE 30, 2006 AND DECEMBER 31, 2005 (Dollars in thousands)
ACA CAPITAL HOLDINGS, INC. AND SUBSIDIARIES CONSOLIDATED STATEMENTS OF OPERATIONS (UNAUDITED) FOR THE SIX MONTHS ENDED JUNE 30, 2006 AND 2005 (Dollars and shares in thousands, except per share amounts)
ACA CAPITAL HOLDINGS, INC. AND SUBSIDIARIES CONSOLIDATED STATEMENTS OF CASH FLOWS (UNAUDITED) FOR THE SIX MONTHS ENDED JUNE 30, 2006 and 2005 (Dollars in thousands)
ACA CAPITAL HOLDINGS, INC. AND SUBSIDIARIES NOTES TO UNAUDITED CONSOLIDATED FINANCIAL STATEMENTS JUNE 30, 2006
REPORT OF INDEPENDENT REGISTERED PUBLIC ACCOUNTING FIRM
REPORT OF INDEPENDENT REGISTERED PUBLIC ACCOUNTING FIRM
ACA CAPITAL HOLDINGS, INC. AND SUBSIDIARIES CONSOLIDATED BALANCE SHEETS AS OF DECEMBER 31, 2005 AND 2004 (Dollars in thousands)
ACA CAPITAL HOLDINGS, INC. AND SUBSIDIARIES CONSOLIDATED STATEMENTS OF OPERATIONS FOR THE YEARS ENDED DECEMBER 31, 2005, 2004 AND 2003 (Dollars and shares in thousands, except per share amounts)
ACA CAPITAL HOLDINGS, INC. AND SUBSIDIARIES CONSOLIDATED STATEMENTS OF CASH FLOWS FOR THE YEARS ENDED DECEMBER 31, 2005, 2004 and 2003 (Dollars in thousands)
ACA CAPITAL HOLDINGS, INC. AND SUBSIDIARIES NOTES TO CONSOLIDATED FINANCIAL STATEMENTS FOR THE YEARS ENDED DECEMBER 31, 2005, 2004 and 2003
CERTAIN RATINGS INFORMATION
Standard & Poor's Rating Group
PART II Information Not Required in Prospectus
Report of Independent Registered Public Accounting Firm On Financial Statement Schedules
ACA Capital Holdings, Inc. Schedule I Summary of Investments—Other than Investments in Related Parties As of December 31, 2005 (Dollars in Thousands)
ACA Capital Holdings, Inc. Schedule II Condensed Financial Information of Registrant CONDENSED BALANCE SHEETS Parent Company Only (Dollars in Thousands)
ACA Capital Holdings, Inc. Schedule II Condensed Financial Information of Registrant CONDENSED STATEMENT OF INCOME Parent Company Only (Dollars in Thousands)
ACA Capital Holdings, Inc. Schedule II Condensed Financial Information of Registrant CONDENSED STATEMENTS OF CASH FLOWS Parent Company Only (Dollars in Thousands)
ACA Capital Holdings, Inc. Schedule II Condensed Financial Information of Registrant NOTES TO FINANCIAL STATEMENTS Parent Company Only
ACA Capital Holdings, Inc. Schedule III Supplementary Insurance Information As of and for the Years Ended December 31, 2005, 2004 and 2003 (Dollars in thousands)
ACA Capital Holdings, Inc. Schedule IV Reinsurance For the Years Ended December 31, 2005, 2004 and 2003 (Dollars in thousands)
SIGNATURES
EXHIBIT INDEX