

Searchable text section of graphics shown above
Presentation to the Committee of Designated Independent Directors
Confidential Material Regarding:
[GRAPHIC]
November 14, 2006
SANDLER O’NEILL + PARTNERS, L.P.
New York – Atlanta – Boston – Chicago - San Francisco
GENERAL INFORMATION AND LIMITATIONS
This presentation, and the oral or video presentation that supplements it, have been developed by and are proprietary to Sandler O’Neill & Partners, L.P. and were prepared exclusively for the benefit and internal use of the recipient. Neither the printed presentation nor the oral or video presentation that supplements it, nor any of their contents, may be reproduced, distributed or used for any other purpose without the prior written consent of Sandler O’Neill & Partners, L.P.
The analyses contained herein rely upon information obtained from the recipient or from public sources, the accuracy of which has not been verified, and cannot be assured, by Sandler O’Neill & Partners, L.P. Moreover, many of the projections and financial analyses herein are based on estimated financial performance prepared by or in consultation with the recipient and are intended only to suggest reasonable ranges of results. Finally, the printed presentation is incomplete without the oral or video presentation that supplements it.
Sandler O’Neill & Partners, L.P. prohibits employees from offering, directly or indirectly, favorable research, a specific rating or a specific price target, or offering or threatening to change research, a rating or a price target to a company as consideration or inducement for the receipt of business or compensation. The Firm also prohibits research analysts from being compensated for their involvement in, or based upon, specific investment banking transactions.
Sandler O’Neill & Partners, L.P. is a limited partnership, the sole general partner of which is Sandler O’Neill & Partners Corp., a New York corporation. Sandler O’Neill & Partners, L.P. is a registered broker-dealer and a member of the National Association of Securities Dealers, Inc. Sandler O’Neill Mortgage Finance L.P. is an indirect wholly-owned subsidiary of Sandler O’Neill & Partners Corp.
This material is protected under applicable copyright laws and does not carry any rights of publication or disclosure.
2
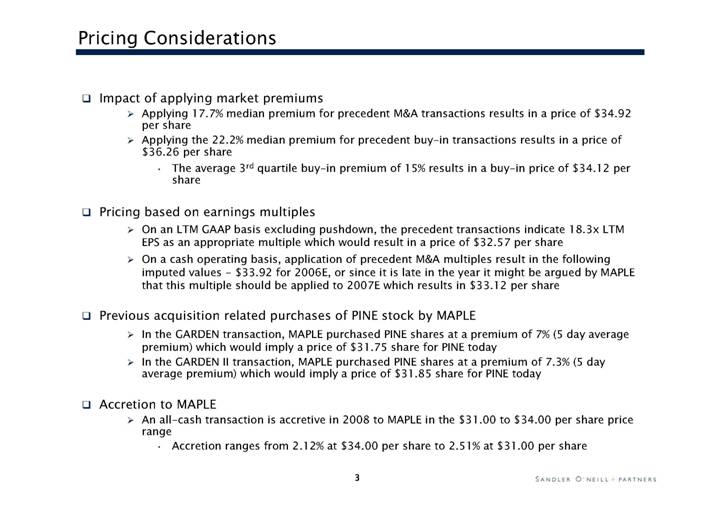
• Impact of applying market premiums
• Applying 17.7% median premium for precedent M&A transactions results in a price of $34.92 per share
• Applying the 22.2% median premium for precedent buy-in transactions results in a price of $36.26 per share
• The average 3rd quartile buy-in premium of 15% results in a buy-in price of $34.12 per share
• Pricing based on earnings multiples
• On an LTM GAAP basis excluding pushdown, the precedent transactions indicate 18.3x LTM EPS as an appropriate multiple which would result in a price of $32.57 per share
• On a cash operating basis, application of precedent M&A multiples result in the following imputed values -$33.92 for 2006E, or since it is late in the year it might be argued by MAPLE that this multiple should be applied to 2007E which results in $33.12 per share
• Previous acquisition related purchases of PINE stock by MAPLE
• In the GARDEN transaction, MAPLE purchased PINE shares at a premium of 7% (5 day average premium) which would imply a price of $31.75 share for PINE today
• In the GARDEN II transaction, MAPLE purchased PINE shares at a premium of 7.3% (5 day average premium) which would imply a price of $31.85 share for PINE today
• Accretion to MAPLE
• An all-cash transaction is accretive in 2008 to MAPLE in the $31.00 to $34.00 per share price range
• Accretion ranges from 2.12% at $34.00 per share to 2.51% at $31.00 per share
3
Previous MAPLE Acquisition Related Purchases of PINE Stock
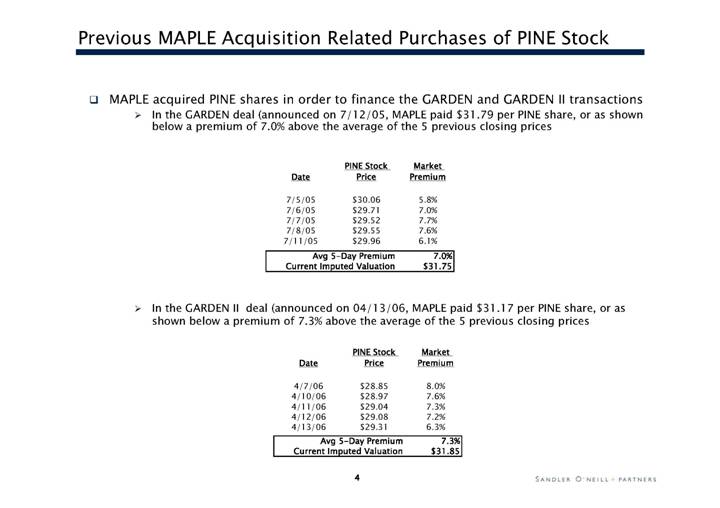
• MAPLE acquired PINE shares in order to finance the GARDEN and GARDEN II transactions
• In the GARDEN deal (announced on 7/12/05, MAPLE paid $31.79 per PINE share, or as shown below a premium of 7.0% above the average of the 5 previous closing prices
Date |
| PINE Stock |
| Market |
| |
|
|
|
|
|
| |
7/5/05 |
| $ | 30.06 |
| 5.8 | % |
7/6/05 |
| $ | 29.71 |
| 7.0 | % |
7/7/05 |
| $ | 29.52 |
| 7.7 | % |
7/8/05 |
| $ | 29.55 |
| 7.6 | % |
7/11/05 |
| $ | 29.96 |
| 6.1 | % |
Avg 5-Day Premium |
| 7.0 | % | |
Current Imputed Valuation |
| $ | 31.75 |
|
• In the GARDEN II deal (announced on 04/13/06, MAPLE paid $31.17 per PINE share, or as shown below a premium of 7.3% above the average of the 5 previous closing prices
Date |
| PINE Stock |
| Market |
| |
|
|
|
|
|
| |
4/7/06 |
| $ | 28.85 |
| 8.0 | % |
4/10/06 |
| $ | 28.97 |
| 7.6 | % |
4/11/06 |
| $ | 29.04 |
| 7.3 | % |
4/12/06 |
| $ | 29.08 |
| 7.2 | % |
4/13/06 |
| $ | 29.31 |
| 6.3 | % |
Avg 5-Day Premium |
| 7.3 | % | |
Current Imputed Valuation |
| $ | 31.85 |
|
4
Key Assumptions
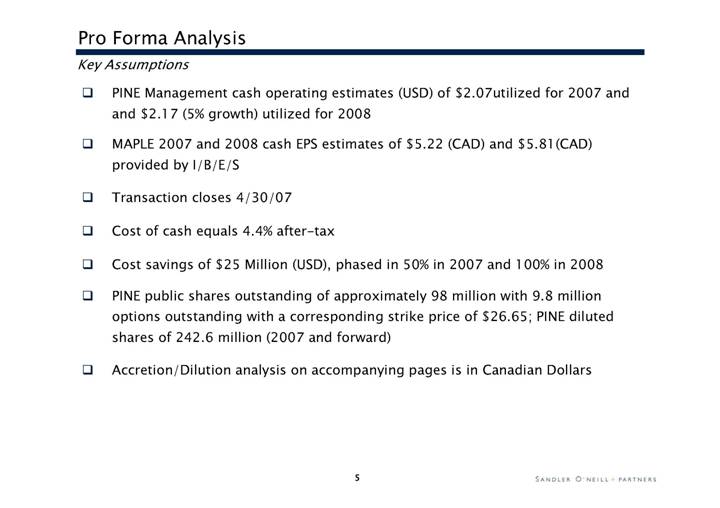
• PINE Management cash operating estimates (USD) of $2.07 utilized for 2007 and and $2.17 (5% growth) utilized for 2008
• MAPLE 2007 and 2008 cash EPS estimates of $5.22 (CAD) and $5.81 (CAD) provided by I/B/E/S
• Transaction closes 4/30/07
• Cost of cash equals 4.4% after-tax
• Cost savings of $25 Million (USD), phased in 50% in 2007 and 100% in 2008
• PINE public shares outstanding of approximately 98 million with 9.8 million options outstanding with a corresponding strike price of $26.65; PINE diluted shares of 242.6 million (2007 and forward)
• Accretion/Dilution analysis on accompanying pages is in Canadian Dollars
5
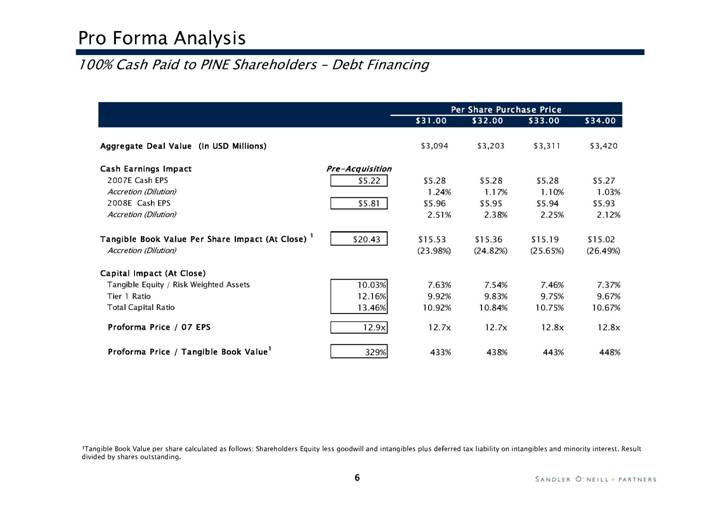
100% Cash Paid to PINE Shareholders - Debt Financing
|
|
|
| Per Share Purchase Price |
| ||||||||||
|
|
|
| $31.00 |
| $32.00 |
| $33.00 |
| $34.00 |
| ||||
|
|
|
|
|
|
|
|
|
|
|
| ||||
Aggregate Deal Value (In USD Millions) |
|
|
| $ | 3,094 |
| $ | 3,203 |
| $ | 3,311 |
| $ | 3,420 |
|
|
| Pre-Acquisition |
|
|
|
|
|
|
|
|
| |||||
Cash Earnings Impact |
|
|
|
|
|
|
|
|
|
|
| |||||
2007E Cash EPS |
| $ | 5.22 |
| $ | 5.28 |
| $ | 5.28 |
| $ | 5.28 |
| $ | 5.27 |
|
Accretion (Dilution) |
|
|
| 1.24 | % | 1.17 | % | 1.10 | % | 1.03 | % | |||||
2008E Cash EPS |
| $ | 5.81 |
| $ | 5.96 |
| $ | 5.95 |
| $ | 5.94 |
| $ | 5.93 |
|
Accretion (Dilution) |
|
|
| 2.51 | % | 2.38 | % | 2.25 | % | 2.12 | % | |||||
|
|
|
|
|
|
|
|
|
|
|
| |||||
Tangible Book Value Per Share Impact (At Close) (1) |
| $ | 20.43 |
| $ | 15.53 |
| $ | 15.36 |
| $ | 15.19 |
| $ | 15.02 |
|
Accretion (Dilution) |
|
|
| (23.98 | )% | (24.82 | )% | (25.65 | )% | (26.49 | )% | |||||
|
|
|
|
|
|
|
|
|
|
|
| |||||
Capital Impact (At Close) |
|
|
|
|
|
|
|
|
|
|
| |||||
Tangible Equity / Risk Weighted Assets |
| 10.03 | % | 7.63 | % | 7.54 | % | 7.46 | % | 7.37 | % | |||||
Tier 1 Ratio |
| 12.16 | % | 9.92 | % | 9.83 | % | 9.75 | % | 9.67 | % | |||||
Total Capital Ratio |
| 13.46 | % | 10.92 | % | 10.84 | % | 10.75 | % | 10.67 | % | |||||
Proforma Price / 07 EPS |
| 12.9 | x | 12.7 | x | 12.7 | x | 12.8 | x | 12.8 | x | |||||
|
|
|
|
|
|
|
|
|
|
|
| |||||
Proforma Price / Tangible Book Value(1) |
| 329 | % | 433 | % | 438 | % | 443 | % | 448 | % | |||||
(1) Tangible Book Value per share calculated as follows: Shareholders Equity less goodwill and intangibles plus deferred tax liability on intangibles and minority interest. Result divided by shares outstanding.
6
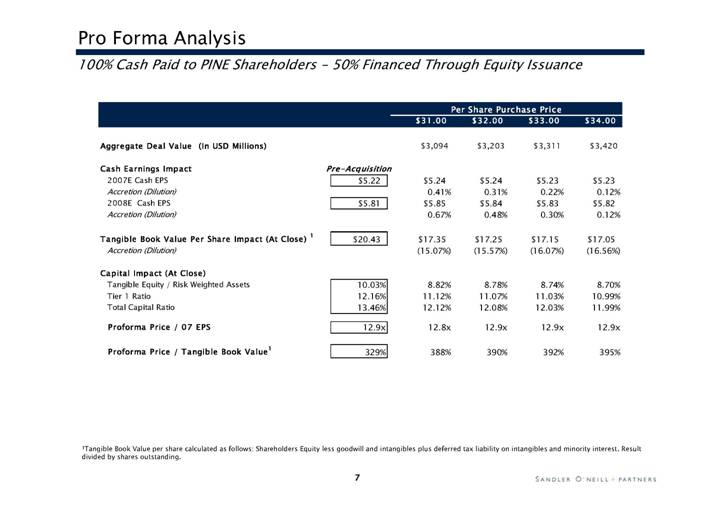
100% Cash Paid to PINE Shareholders - 50% Financed Through Equity Issuance
|
|
|
| Per Share Purchase Price |
| ||||||||||
|
|
|
| $31.00 |
| $32.00 |
| $33.00 |
| $34.00 |
| ||||
|
|
|
|
|
|
|
|
|
|
|
| ||||
Aggregate Deal Value (In USD Millions) |
|
|
| $ | 3,094 |
| $ | 3,203 |
| $ | 3,311 |
| $ | 3,420 |
|
|
| Pre-Acquisition |
|
|
|
|
|
|
|
|
| |||||
Cash Earnings Impact |
|
|
|
|
|
|
|
|
|
|
| |||||
2007E Cash EPS |
| $ | 5.22 |
| $ | 5.24 |
| $ | 5.24 |
| $ | 5.23 |
| $ | 5.23 |
|
Accretion (Dilution) |
|
|
| 0.41 | % | 0.31 | % | 0.22 | % | 0.12 | % | |||||
2008E Cash EPS |
| $ | 5.81 |
| $ | 5.85 |
| $ | 5.84 |
| $ | 5.83 |
| $ | 5.82 |
|
Accretion (Dilution) |
|
|
| 0.67 | % | 0.48 | % | 0.30 | % | 0.12 | % | |||||
|
|
|
|
|
|
|
|
|
|
|
| |||||
Tangible Book Value Per Share Impact (At Close) (1) |
| $ | 20.43 |
| $ | 17.35 |
| $ | 17.25 |
| $ | 17.15 |
| $ | 17.05 |
|
Accretion (Dilution) |
|
|
| (15.07 | )% | (15.57 | )% | (16.07 | )% | (16.56 | )% | |||||
|
|
|
|
|
|
|
|
|
|
|
| |||||
Capital Impact (At Close) |
|
|
|
|
|
|
|
|
|
|
| |||||
Tangible Equity / Risk Weighted Assets |
| 10.03 | % | 8.82 | % | 8.78 | % | 8.74 | % | 8.70 | % | |||||
Tier 1 Ratio |
| 12.16 | % | 11.12 | % | 11.07 | % | 11.03 | % | 10.99 | % | |||||
Total Capital Ratio |
| 13.46 | % | 12.12 | % | 12.08 | % | 12.03 | % | 11.99 | % | |||||
|
|
|
|
|
|
|
|
|
|
|
| |||||
Proforma Price / 07 EPS |
| 12.9 | x | 12.8 | x | 12.9 | x | 12.9 | x | 12.9 | x | |||||
|
|
|
|
|
|
|
|
|
|
|
| |||||
Proforma Price / Tangible Book Value(1) |
| 329 | % | 388 | % | 390 | % | 392 | % | 395 | % | |||||
(1) Tangible Book Value per share calculated as follows: Shareholders Equity less goodwill and intangibles plus deferred tax liability on intangibles and minority interest. Result divided by shares outstanding.
7
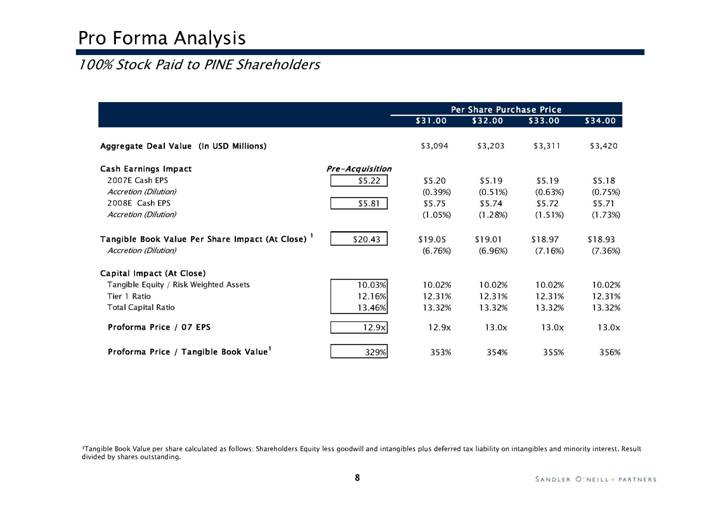
100% Stock Paid to PINE Shareholders
|
|
|
| Per Share Purchase Price |
| ||||||||||
|
|
|
| $31.00 |
| $32.00 |
| $33.00 |
| $34.00 |
| ||||
|
|
|
|
|
|
|
|
|
|
|
| ||||
Aggregate Deal Value (In USD Millions) |
|
|
| $ | 3,094 |
| $ | 3,203 |
| $ | 3,311 |
| $ | 3,420 |
|
|
| Pre-Acquisition |
|
|
|
|
|
|
|
|
| |||||
Cash Earnings Impact |
|
|
|
|
|
|
|
|
|
|
| |||||
2007E Cash EPS |
| $ | 5.22 |
| $ | 5.20 |
| $ | 5.19 |
| $ | 5.19 |
| $ | 5.18 |
|
Accretion (Dilution) |
|
|
| (0.39 | )% | (0.51 | )% | (0.63 | )% | (0.75 | )% | |||||
2008E Cash EPS |
| $ | 5.81 |
| $ | 5.75 |
| $ | 5.74 |
| $ | 5.72 |
| $ | 5.71 |
|
Accretion (Dilution) |
|
|
| (1.05 | )% | (1.28 | )% | (1.51 | )% | (1.73 | )% | |||||
|
|
|
|
|
|
|
|
|
|
|
| |||||
Tangible Book Value Per Share Impact (At Close) (1) |
| $ | 20.43 |
| $ | 19.05 |
| $ | 19.01 |
| $ | 18.97 |
| $ | 18.93 |
|
Accretion (Dilution) |
|
|
| (6.76 | )% | (6.96 | )% | (7.16 | )% | (7.36 | )% | |||||
|
|
|
|
|
|
|
|
|
|
|
| |||||
Capital Impact (At Close) |
|
|
|
|
|
|
|
|
|
|
| |||||
Tangible Equity / Risk Weighted Assets |
| 10.03 | % | 10.02 | % | 10.02 | % | 10.02 | % | 10.02 | % | |||||
Tier 1 Ratio |
| 12.16 | % | 12.31 | % | 12.31 | % | 12.31 | % | 12.31 | % | |||||
Total Capital Ratio |
| 13.46 | % | 13.32 | % | 13.32 | % | 13.32 | % | 13.32 | % | |||||
Proforma Price / 07 EPS |
| 12.9 | x | 12.9 | x | 13.0 | x | 13.0 | x | 13.0 | x | |||||
|
|
|
|
|
|
|
|
|
|
|
| |||||
Proforma Price / Tangible Book Value(1) |
| 329 | % | 353 | % | 354 | % | 355 | % | 356 | % | |||||
(1) Tangible Book Value per share calculated as follows: Shareholders Equity less goodwill and intangibles plus deferred tax liability on intangibles and minority interest. Result divided by shares outstanding.
8