
Goldman Sachs Basic Materials
Conference
Conference
James J. O'Brien
Chairman and Chief Executive Officer
May 21, 2008

2
Forward-Looking Statements
This presentation contains forward-looking statements, within the meaning
of Section 27A of the Securities Act of 1933 and Section 21E of the
Securities Exchange Act of 1934, with respect to Ashland’s operating
performance. These estimates are based upon a number of assumptions,
including those mentioned within this presentation. Such estimates are
also based upon internal forecasts and analyses of current and future
market conditions and trends, management plans and strategies, weather,
operating efficiencies and economic conditions, such as prices, supply and
demand, cost of raw materials, and legal proceedings and claims (including
environmental and asbestos matters).
Although Ashland believes its expectations are based on reasonable
assumptions, it cannot assure the expectations reflected herein will be
achieved. This forward-looking information may prove to be inaccurate and
actual results may differ significantly from those anticipated if one or more
of the underlying assumptions or expectations proves to be inaccurate or
is unrealized or if other unexpected conditions or events occur.
Other factors and risks affecting Ashland are contained in Ashland’s Form
10-K for the fiscal year ended Sept. 30, 2007. Ashland undertakes no
obligation to subsequently update or revise the forward-looking statements
made in this presentation to reflect events or circumstances after the date
of this presentation.
10-K for the fiscal year ended Sept. 30, 2007. Ashland undertakes no
obligation to subsequently update or revise the forward-looking statements
made in this presentation to reflect events or circumstances after the date
of this presentation.

3
Ashland
Distribution
Ashland
Performance
Materials
Materials
Ashland
Water
Technologies
Technologies
Valvoline
* For the six months ended March 31, 2008.
Ashland Today
• Fiscal 2008 YTD* Financial Results
– Sales & Operating Revenue = $4.0 billion
– Operating Income = $98 million
4
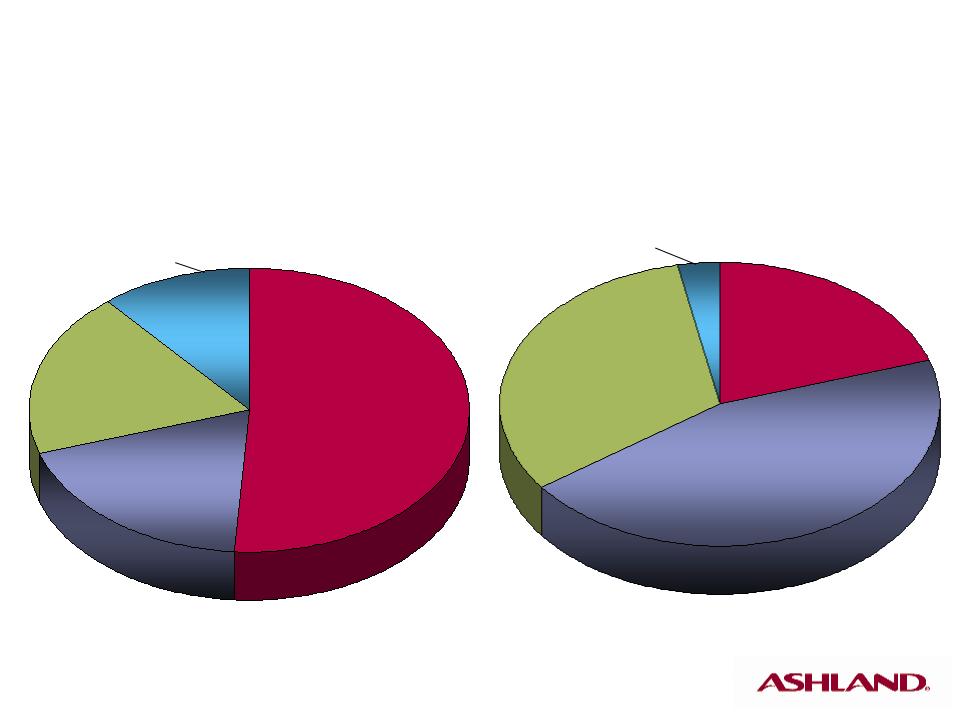
Ashland
Distribution
51%
Distribution
51%
Ashland
Distribution
51%
Distribution
51%
Performance
Materials
19%
Materials
19%
Performance
Materials
19%
Materials
19%
Valvoline
19%
19%
Sales & Operating Revenue
Water
Technologies
Technologies
Water
Technologies
Technologies
Operating Income
Ashland
Distribution
20%
Distribution
20%
Ashland
Distribution
20%
Distribution
20%
Performance
Materials
32%
Materials
32%
Performance
Materials
32%
Materials
32%
Valvoline
45%
45%
Water
Technologies
Technologies
Water
Technologies
Technologies
11%
11%
3%
3%
* For the six months ended March 31, 2008. Sales & Operating Revenue includes intersegment sales.
Operating income excludes Unallocated and Other.
Operating income excludes Unallocated and Other.
Fiscal 2008 YTD*
Revenue and Operating Income
Revenue and Operating Income
5
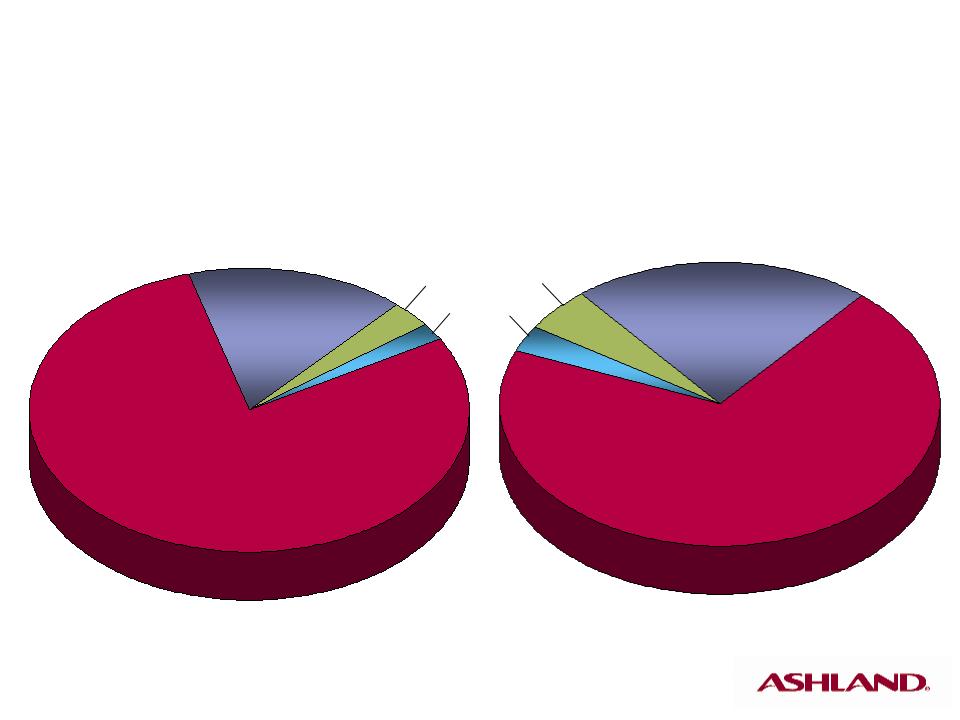
North
America
79%
America
79%
North
America
79%
America
79%
Europe
16%
16%
Europe
16%
16%
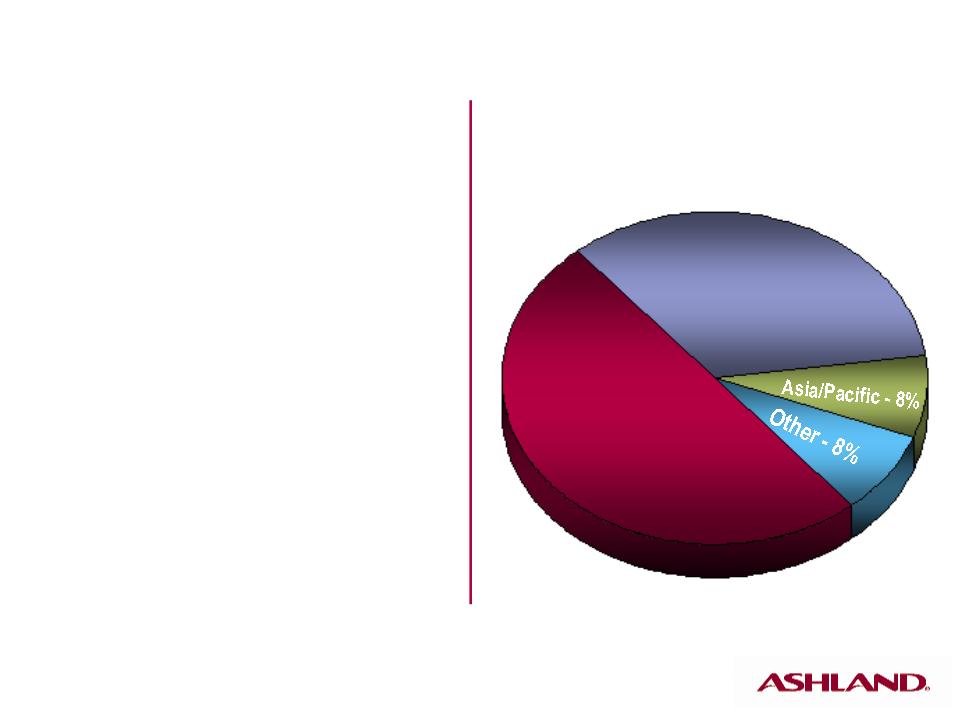
Other
Other
3%
3%
3%
3%
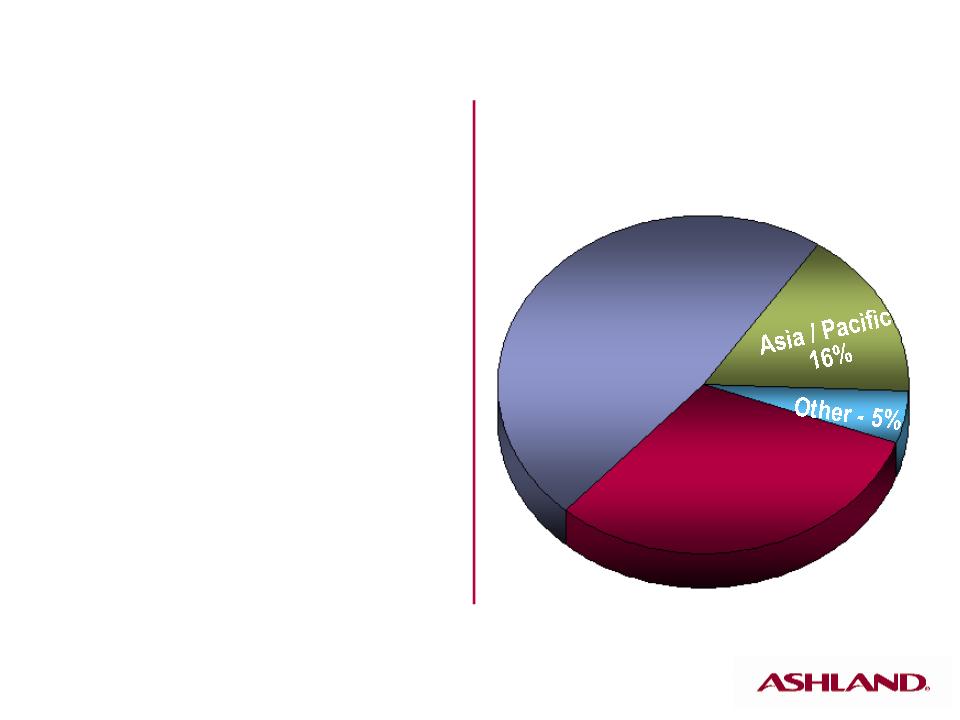
* For the six months ended March 31, 2008.
Revenue by Region
Fiscal 2008 YTD*
Fiscal 2006
Asia/Pacific
Asia/Pacific
North
America
70%
America
70%
North
America
70%
America
70%
Europe
22%
22%
Europe
22%
22%
5%
5%
2%
2%

6
Residential Housing
Transportation
Industrial Construction
Packaging & Converting
Infrastructure
Marine
* For the six months ended March 31, 2008.
Performance Materials
Business Description
• Composite Polymers - Global
manufacturer of unsaturated
polyester resins, vinyl ester
resins and gelcoats for use
in composites
manufacturer of unsaturated
polyester resins, vinyl ester
resins and gelcoats for use
in composites
• Casting Solutions - A leading
worldwide provider of foundry
binder resins, chemicals,
sleeves, filters and design
solutions
worldwide provider of foundry
binder resins, chemicals,
sleeves, filters and design
solutions
• Specialty Polymers and
Adhesives - - A producer of high
-performance, pressure-
sensitive and structural
adhesives and specialty resins
Adhesives - - A producer of high
-performance, pressure-
sensitive and structural
adhesives and specialty resins
Fiscal 2008 YTD* Revenue
by Market (percent)
by Market (percent)
7
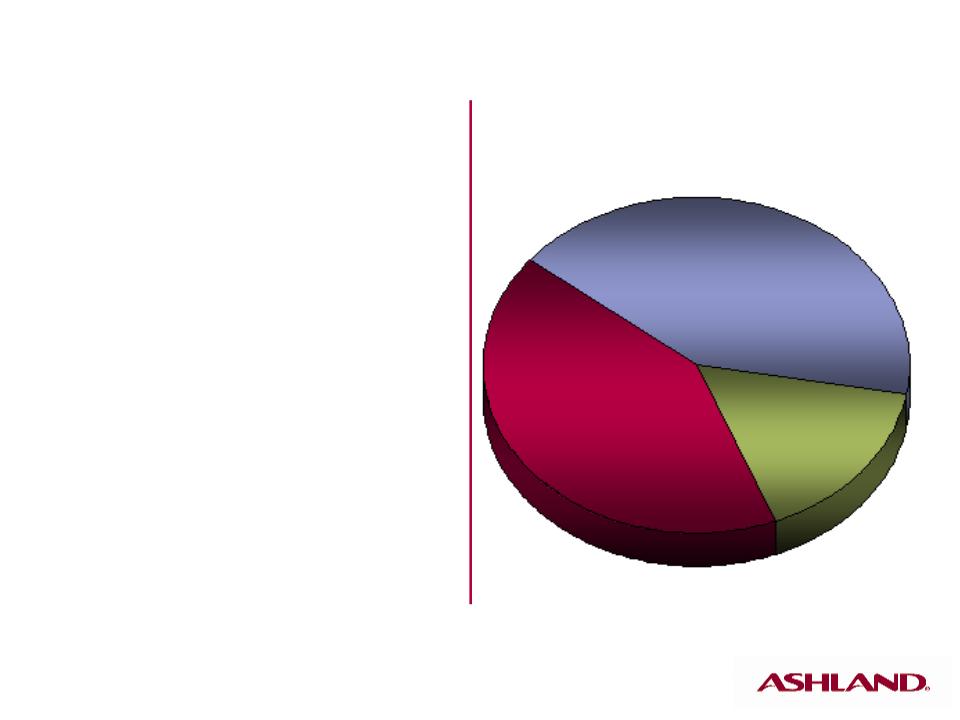
Fiscal 2008 YTD* Revenue
by Region
by Region
North
America
50%
America
50%
Europe
34%
34%
* For the six months ended March 31, 2008.
Performance Materials
Fiscal 2008 YTD*
• Sales & Operating
Revenue: $769 million
Revenue: $769 million
• Operating Income: $31 million
• Operating Income
Percent: 4.0%
Percent: 4.0%
Strategy
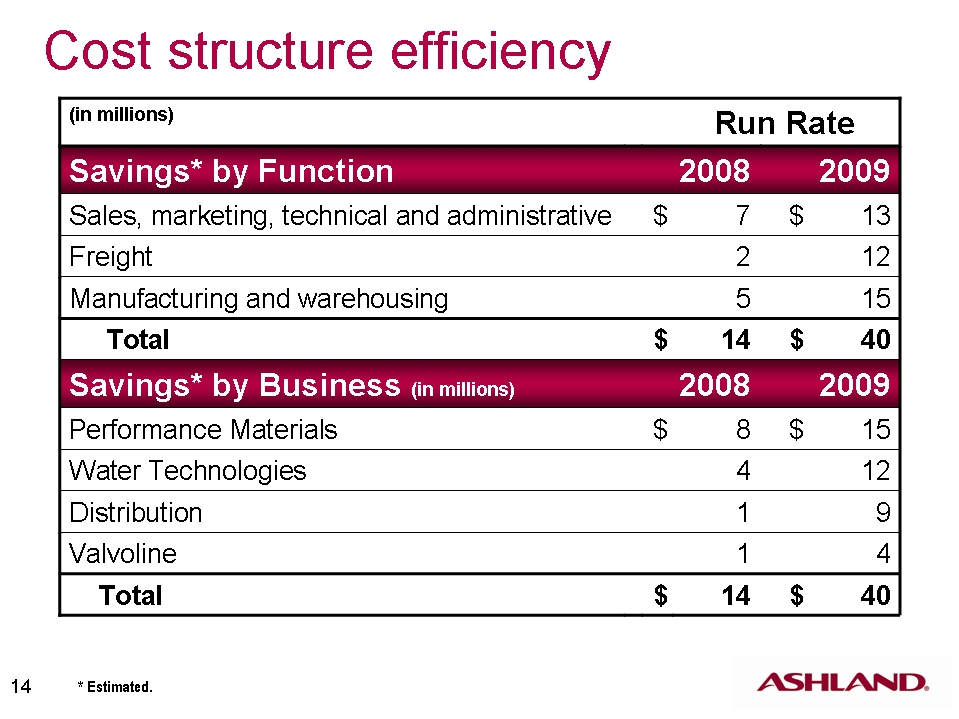
• Cost structure efficiency
• Premium product emphasis
• Growth through expanding
new technology into
existing markets
new technology into
existing markets
• Growth through increasing
global reach of existing
technology
global reach of existing
technology

8
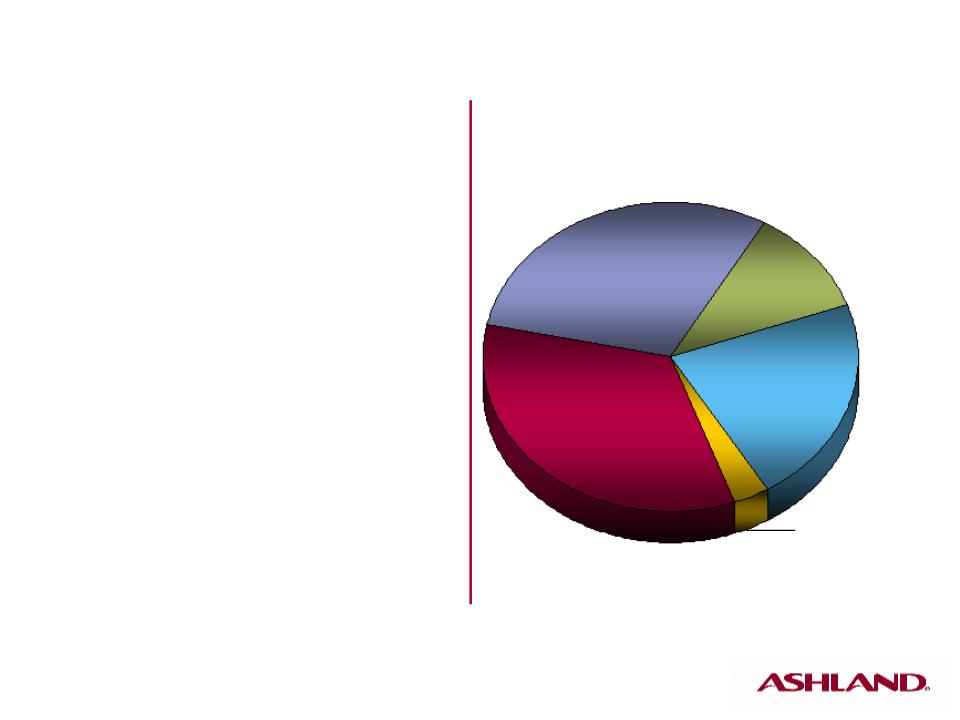
Fiscal 2008 YTD* Revenue
by Market (percent)
by Market (percent)
* For the six months ended March 31, 2008.
Building & Construction
Chemical Mfg
Personal Care
Transportation
Other
Paint & Coatings
Retail Consumer
Marine
Medical
Distribution
Business Description
• Leading North American
distributor of packaged and
bulk chemicals, plastics and
composite materials;
provider of comprehensive
waste-management solutions
distributor of packaged and
bulk chemicals, plastics and
composite materials;
provider of comprehensive
waste-management solutions
• Major plastics distributor
in Europe
in Europe
• Approximately 85 percent
of revenue generated
in North America
of revenue generated
in North America
9
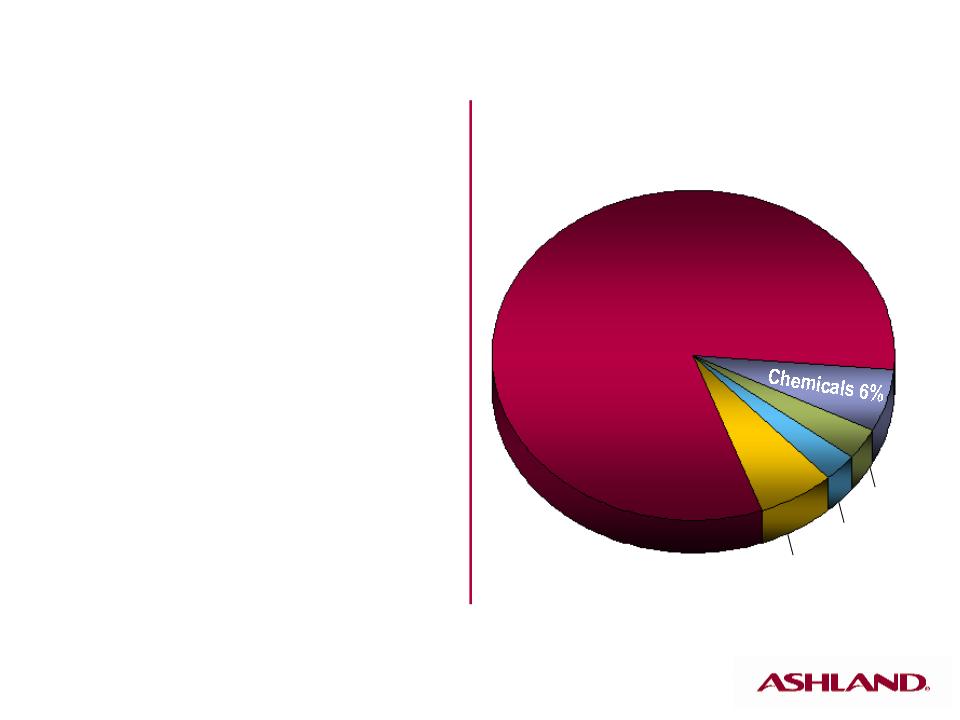
* For the six months ended March 31, 2008.
Environmental
Services/
Other - - 2%
Services/
Other - - 2%
Composites
11%
11%
Plastics
42%
42%
Chemicals
45%
45%
Fiscal 2008 YTD* Revenue
by Product Line
by Product Line
Distribution
Fiscal 2008 YTD*
• Sales & Operating
Revenue: $2.1 billion
Revenue: $2.1 billion
• Operating Income: $19 million
• Operating Income
Percent: 0.9%
Percent: 0.9%
Strategy
• Operational excellence
through systems and process
improvements
through systems and process
improvements
• Customer focus
• Responsible growth
in targeted markets,
products and geographies
in targeted markets,
products and geographies
10
* For the six months ended March 31, 2008. ® Registered trademark, Ashland.
Do-It-Yourself
34%
34%
Do-It-For-Me
30%
30%
Valvoline
Instant Oil
Change
Instant Oil
Change
International
22%
22%
11%
Fiscal 2008 YTD* Revenue
by Channel
by Channel
Specialty/
Other - - 3%
Other - - 3%
Valvoline
Business Description
• Do-It-For-Me - - Branded and
non-branded lubricant and
car-care products for the
automotive service industry
non-branded lubricant and
car-care products for the
automotive service industry
• Valvoline Instant Oil Change®
- Company-owned and
franchised oil-change and
related-service stores
- Company-owned and
franchised oil-change and
related-service stores
• Do-It-Yourself - - Branded
lubricants and appearance
products for the retail market
lubricants and appearance
products for the retail market
• International - - Valvoline
products sold outside
North America
products sold outside
North America
11
* For the six months ended March 31, 2008.
Fiscal 2008 YTD* Revenue
by Product Line
by Product Line
Appearance
Filters
Antifreeze
Lubricants
82%
82%
3%
3%
6%
Valvoline
Fiscal 2008 YTD*
• Sales & Operating
Revenue: $781 million
Revenue: $781 million
• Operating Income: $44 million
• Operating Income
Percent: 5.6%
Percent: 5.6%
Strategy
• Premium business focus
• Optimize business models
• Growth through new
technology development
technology development
• Increase global reach
12
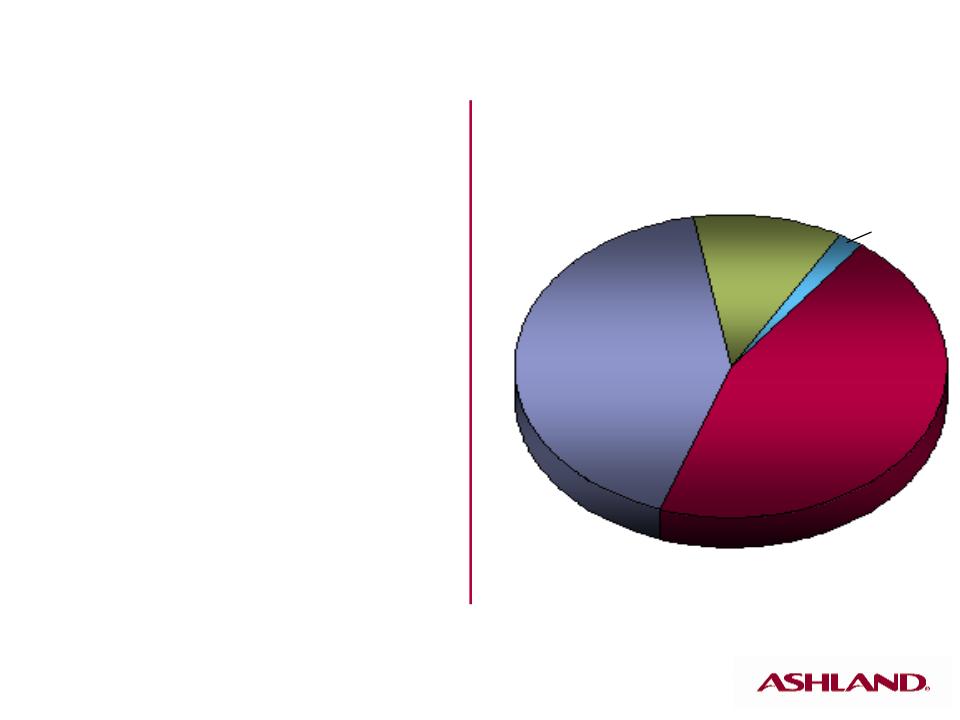
* For the six months ended March 31, 2008.
Fiscal 2008 YTD* Revenue
by Segment
by Segment
Industrial
42%
42%
Marine
16%
16%
E&PS
42%
42%
Water Technologies
Business Description
• Major supplier of chemicals
and services for utility water
treatment, including boiler
water, cooling water, fuel and
waste water
and services for utility water
treatment, including boiler
water, cooling water, fuel and
waste water
• Major supplier and global
producer of process water
treatments for municipal,
mining and pulp/paper
processing
producer of process water
treatments for municipal,
mining and pulp/paper
processing
• A leading worldwide provider
of technical products and
shipboard services for the
merchant marine and cruise
ship industry
of technical products and
shipboard services for the
merchant marine and cruise
ship industry
13
* For the six months ended March 31, 2008.
Fiscal 2008 YTD* Revenue
by Region
by Region
Europe
48%
48%
North
America
31%
America
31%
Water Technologies
Fiscal 2008 YTD*
• Sales & Operating
Revenue: $423 million
Revenue: $423 million
• Operating Income: $3 million
• Operating Income
Percent: 0.7%
Percent: 0.7%
Strategy
• Fix operating issues
• Improve pricing process
• Reduce cost structure
• Improve supply chain
• Align rewards and metrics

15
* For the six months ended March 31, 2008. ** Operating-segment trade working capital includes accounts
receivable, inventory excluding LIFO reserve, and trade and other payables, net.
receivable, inventory excluding LIFO reserve, and trade and other payables, net.
Financial Priorities/Strategic Initiatives
• Focus on price management
• Working capital/cash flow
– Generated $141 million operating cash flow YTD*
• Net of capital expenditures
– Cash inflow from operating-segment trade working
capital** of $11 million YTD*
capital** of $11 million YTD*
• Cash outflow of $229 million during same period of fiscal 2007
• Target working capital reduction of approximately
1 percent of sales versus 2007
1 percent of sales versus 2007
• Capital redeployment

16
Investment Highlights
• Net cash position provides options
• Cost structure efficiency
– Performance Materials
– Water Technologies
• Focus on cash generation

Questions?