EXHIBIT 99.1

19th Annual Citi Chemicals
Conference
Conference
James J. O'Brien
Chairman and Chief Executive Officer
December 2, 2008

2
Forward-Looking Statements
This presentation contains forward-looking statements, within the meaning of Section 27A of the Securities Act of 1933 and Section 21E of the Securities Exchange Act of 1934. Such statements include those made with respect to Ashland’s operating performance and Ashland’s acquisition of Hercules Inc. These expectations are based upon a number of assumptions, including those mentioned within this presentation. Performance estimates are also based upon internal forecasts and analyses of current and future market conditions and trends, management plans and strategies, weather, operating efficiencies and economic conditions, such as prices, supply and demand, cost of raw materials, and legal proceedings and claims (including environmental and asbestos matters). These risks and uncertainties may cause actual operating results to differ materially from those stated, projected or implied. Such risks and uncertainties with respect to Ashland’s acquisition of Hercules include the possibility that the benefits anticipated from the Hercules transaction will not be fully realized; the substantial indebtedness Ashland has incurred to finance the acquisition may impair Ashland’s financial condition; the restrictive covenants under the debt instruments may hinder the successful operation of Ashland’s business; future cash flow may be insufficient to repay the debt; and other risks that are described in filings made by Ashland with the Securities and Exchange Commission (SEC). Although Ashland believes its expectations are based on reasonable assumptions, it cannot assure the expectations reflected herein will be achieved. This forward-looking information may prove to be inaccurate and actual results may differ significantly from those anticipated if one or more of the underlying assumptions or expectations proves to be inaccurate or is unrealized or if other unexpected conditions or events occur. Other factors, uncertainties and risks affecting Ashland are contained in Ashland's periodic filings made with the SEC, including its Form 10-K for the fiscal year ended September 30, 2008, which is available on Ashland’s Investor Relations website at http://investor.ashland.com or the SEC’s website at www.sec.gov. Ashland undertakes no obligation to subsequently update or revise the forward-looking statements made in this presentation to reflect events or circumstances after the date of this presentation.

3
1Rankings are based on internal estimates of competitive specialty chemicals sales; includes Hercules Paper
Technologies and Ventures and Aqualon sales and excludes Ashland Consumer Markets and Ashland Distribution sales.
Specialty chemicals companies are defined as those that generate 70 percent or more of profits from specialty chemicals
sales. Sales and profit estimates used to determine these rankings are based on publicly available data.
Specialty chemicals companies are defined as those that generate 70 percent or more of profits from specialty chemicals
sales. Sales and profit estimates used to determine these rankings are based on publicly available data.
With the Acquisition of Hercules
on Nov. 13, 2008 …
on Nov. 13, 2008 …
• We’ve taken a major step in achieving our objective
to create a leading global specialty chemicals company1
to create a leading global specialty chemicals company1
- Now among the 5th largest in North America and
10th largest in the world
10th largest in the world
• Acquisition enables:
- More stable and predictable earnings
- Stronger cash flows
- Access to higher long-term growth markets worldwide
• Focus on paper and water technologies, specialty resins
and specialty additives and ingredients
and specialty additives and ingredients
• Broad geographical diversity
- Approximately $3.7 billion of pro forma revenues generated
outside North America
outside North America
• Renewable resources represent 33 percent of pro forma EBITDA
4
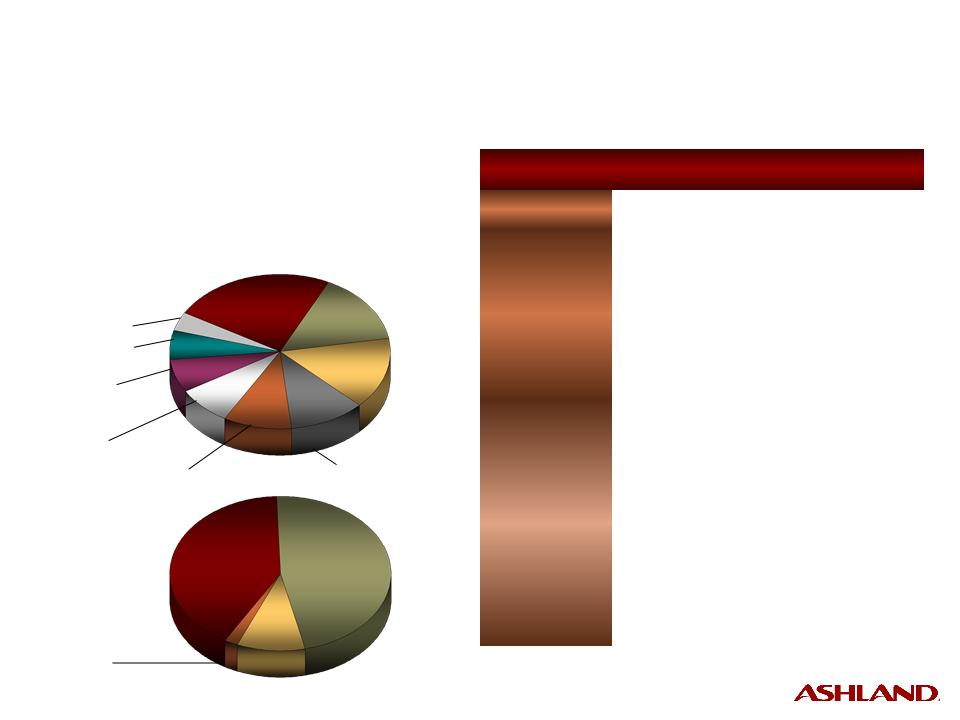
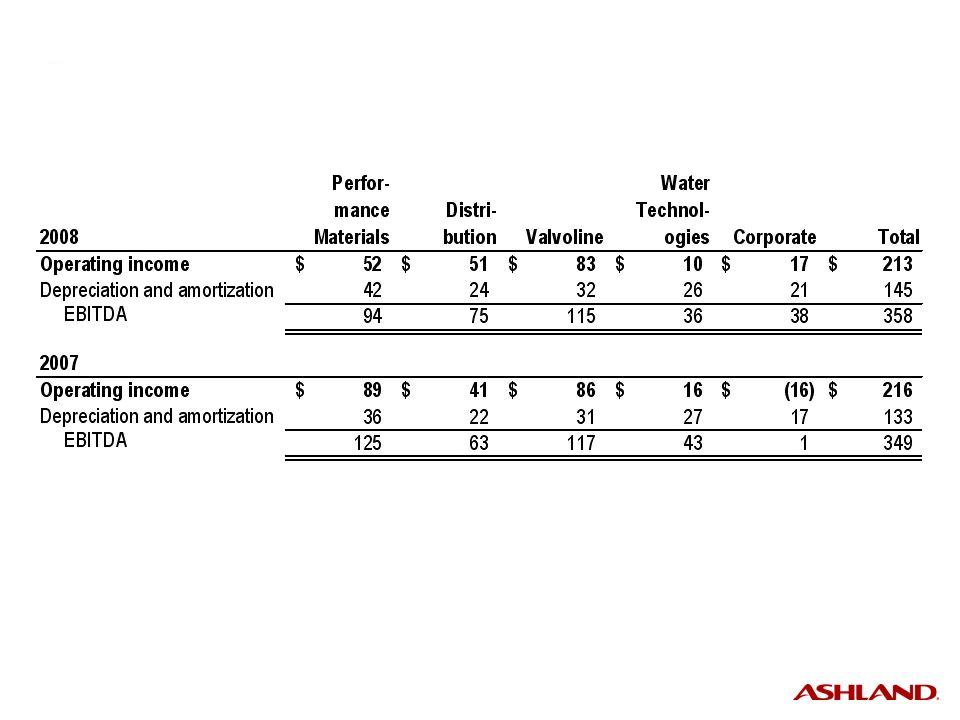
Ashland
Performance
Materials
Materials
Ashland
Hercules
Water
Technologies
Water
Technologies
Ashland
Distribution
Ashland
Consumer
Markets
Consumer
Markets
(Valvoline)
Ashland
Aqualon
Functional
Ingredients
Functional
Ingredients
1 For the 12 months ended Sept. 30, 2008. Revenue includes intersegment, Hercules Paper Technologies &
Ventures and Aqualon sales. See Appendix for reconciliation of pro forma EBITDA.
Ventures and Aqualon sales. See Appendix for reconciliation of pro forma EBITDA.
Ashland Today
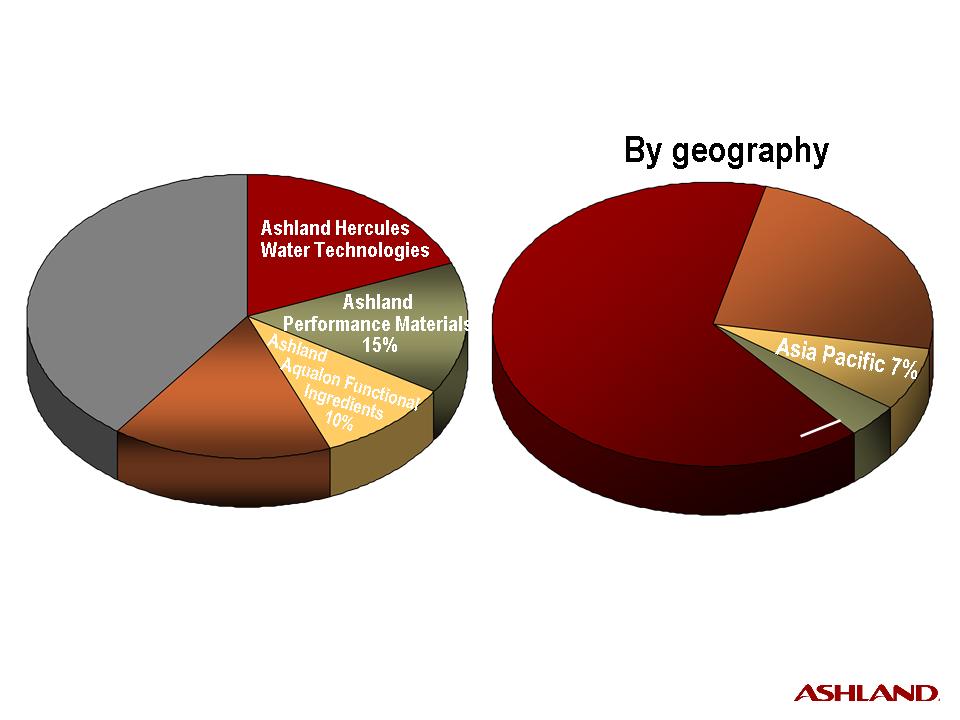
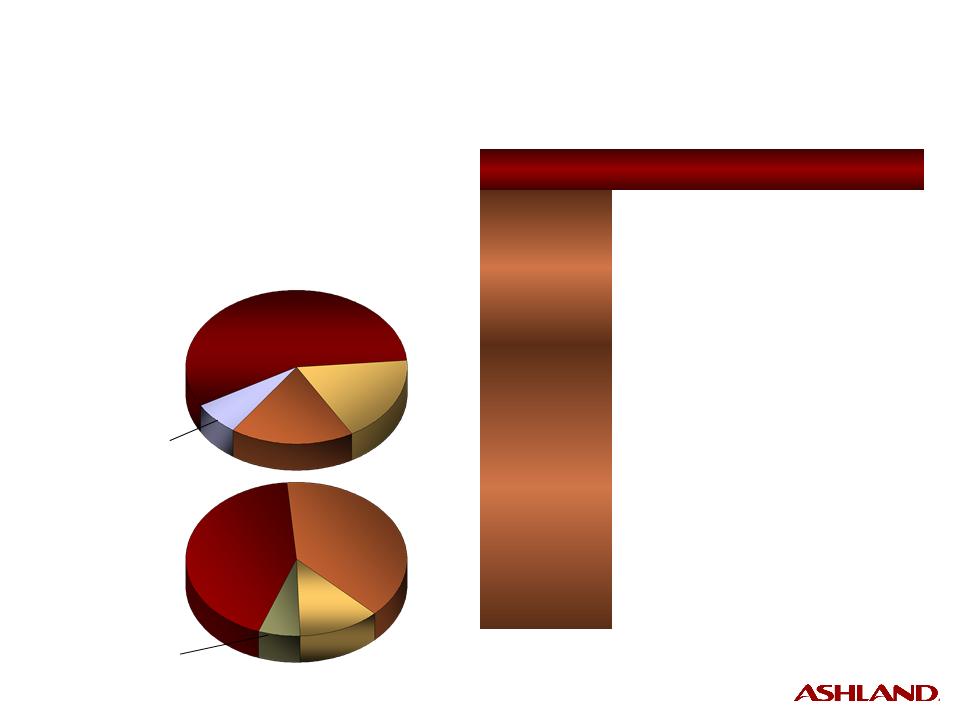
• Pro forma sales and operating revenue1 = $10.7 billion
• Pro forma EBITDA1 = $717 million
5
Ashland
Distribution
40%
Distribution
40%
Ashland
Distribution
40%
Distribution
40%
Ashland
Consumer
Markets
16%
Consumer
Markets
16%
By commercial unit
19%
19%
1 For the 12 months ended Sept. 30, 2008, including intersegment, Hercules Paper Technologies &
Ventures and Aqualon sales.
Ventures and Aqualon sales.
North
America
65%
America
65%
North
America
65%
America
65%
Latin America/
Other - 4%
Other - 4%
Europe
Europe
24%
24%
• 35 percent of total revenue comes
from outside North America
from outside North America
Fiscal 2008 Pro Forma1
Sales and Operating Revenue
Sales and Operating Revenue
6
1 For the 12 months ended Sept. 30, 2008.
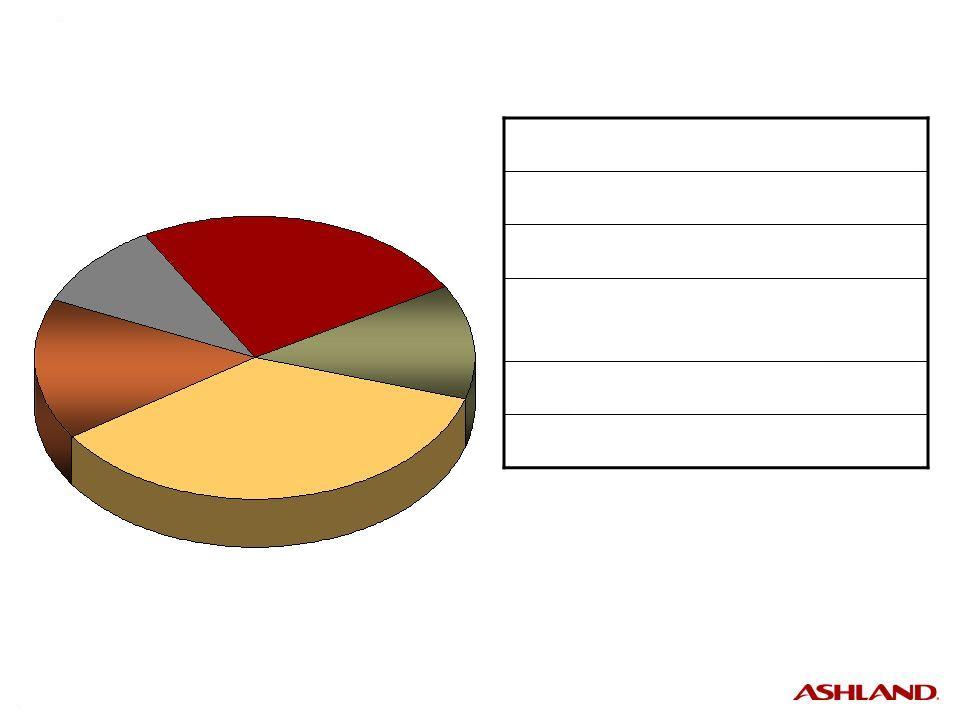
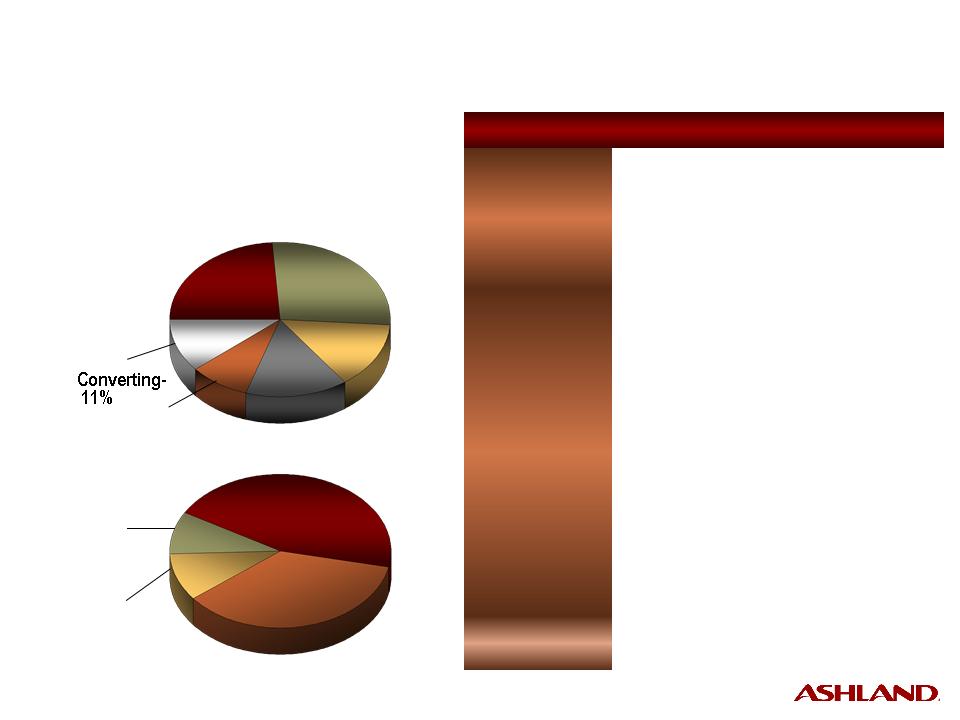
Ashland
Ashland
Distribution
Distribution
10%
10%
Ashland
Ashland
Performance Materials
Performance Materials
13%
13%
Ashland Consumer
Markets
16%
Markets
16%
Ashland Hercules
Water Technologies
Water Technologies
Ashland Hercules
Water Technologies
Water Technologies
25%
25%
Ashland
Ashland
Aqualon Functional
Aqualon Functional
Ingredients
Ingredients
36%
36%
• 74 percent of EBITDA comes from specialty chemicals
• 33 percent of EBITDA comes from renewable materials
Pro Forma EBITDA1
by commercial unit
by commercial unit
ASH
NYSE Ticker Symbol:
2,042
Active patents worldwide:
596
Active patents in U.S.:
More than
100
100
Number of countries
in which Ashland
has sales:
in which Ashland
has sales:
35%
% outside N.A.:
~16,000
Employees:
Corporate Profile
7
Ashland
Performance
Materials
Materials
Ashland
Hercules
Water
Technologies
Water
Technologies
Ashland
Distribution
Ashland
Consumer
Markets
Consumer
Markets
(Valvoline)
Ashland
Aqualon
Functional
Ingredients
Functional
Ingredients
#1 global leader
in unsaturated
polyester resins
and vinyl ester
resins
in unsaturated
polyester resins
and vinyl ester
resins
#3 passenger-
car motor oil
and
#2 quick-lube
chain in the
United States
car motor oil
and
#2 quick-lube
chain in the
United States
#2 plastics
and #3
chemicals
distributor
in North
America
and #3
chemicals
distributor
in North
America
#1 global
producer
of
papermaking
chemicals
producer
of
papermaking
chemicals
#2 global
producer
of cellulose
ethers
producer
of cellulose
ethers
Strong Leadership Positions
in the Markets We Serve
in the Markets We Serve
8
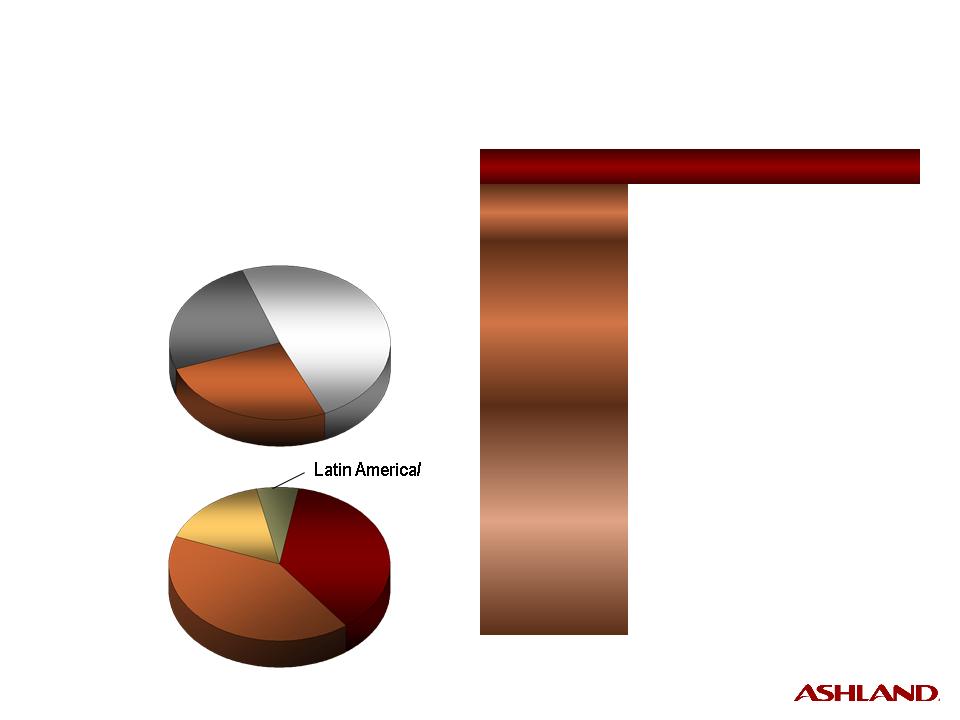
North
America
America
43%
Latin America/
Other - 6%
Other - 6%
E&PS
18%
18%
E&PS
18%
18%
Pulp/ Paper
57%
Business Overview | |
Customers/ Markets | • Pulp and paper processing • Industrial and institutional • Mining • Municipal wastewater treatment • Merchant marine |
Products/ Services | • Process chemicals for microbial and contaminant control, pulping aids and retention aids • Functional chemicals for sizing and wet strength • Utility water treatments • Process water treatments • Technical products and shipboard services for the merchant marine and cruise ship industry |
Revenue
by Geography
by Geography
Revenue
by Market
by Market
Marine - 7%
Asia
Pacific
12%
Pacific
12%
Europe
39%
39%
For the Fiscal Year Ended Sept.30, 2008
Pro Forma Revenue: $2.1 billion
Pro Forma EBITDA: $186 million
Pro Forma EBITDA Margin: 8.9%
Industrial
18%
18%
Industrial
18%
18%
Ashland Hercules Water Technologies
A major global supplier of process and functional chemicals
A major global supplier of process and functional chemicals
9
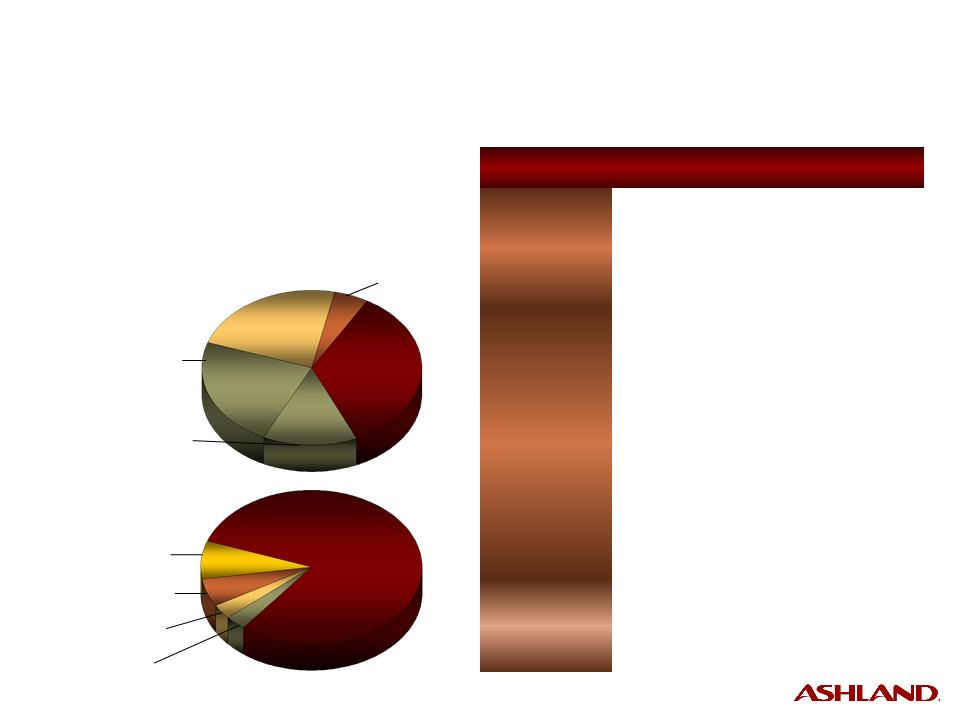
Pkg. &
North
America
America
North
America
America
45%
45%
Europe
36%
Latin
America/
Other -
America/
Other -
9%
Trans-
portation
portation
Trans-
portation
portation
24%
24%
Ind.
Constr.
Constr.
27%
Business Overview | |
Customers | • Auto manufacturers; foundries; pipe and tank fabricators; bathware, countertop and window lineal manufacturers; pipe relining contractors; boat builders; wide and narrow web printers |
Products/ Services | • Adhesives and Composites - Unsaturated polyester resins - Vinyl ester resins - Gelcoats - Pressure-sensitive adhesives - Structural adhesives - Specialty resins • Casting Solutions - Foundry binder resins - Chemicals - Sleeves and filters - Design services |
Markets | • Transportation, construction, marine, packaging and converting |
Revenue
by Geography
by Geography
Revenue
by Market
by Market
For the Fiscal Year Ended Sept. 30, 2008
Revenue: $1.6 billion
EBITDA: $94 million
EBITDA Margin: 5.8%
Res.
Constr.
Constr.
14%
Infra-
structure
structure
15%
Marine - 9%
Asia
Pacific - 10%
Pacific - 10%
Ashland Performance Materials
A global leader in specialty chemicals
A global leader in specialty chemicals
10
Business Overview | |
Customers | • Diversified, global customer base |
Products | • Broad product line based on renewable resources - Water soluble polymers (cellulose ethers and guar derivatives) - Refined wood rosin and natural wood terpenes |
Markets | • Water-based paints • Paper coatings • Construction • Oilfield (chemicals and drilling muds) • Regulated markets - Personal care - Food - Pharmaceuticals |
North
America
America
North
America
America
37%
37%
Asia
Pacific
Pacific
Asia
Pacific
Pacific
16%
16%
Europe
41%
Other - 6%
Coatings &
Construction
49%
Construction
49%
Coatings &
Construction
49%
Construction
49%
Energy &
Spec. Solutions
26%
Spec. Solutions
26%
Regulated
Industries
25%
Industries
25%
Regulated
Industries
25%
Industries
25%
Revenue
by Geography
by Geography
Revenue
by Market
by Market
For the 12 Months Ended Sept. 30, 2008
Revenue: $1.1 billion
Revenue: $1.1 billion
EBITDA: $261 million
EBITDA Margin: 23.7%
EBITDA Margin: 23.7%
Ashland Aqualon Functional Ingredients
A global leader in managing rheology of water-based systems
A global leader in managing rheology of water-based systems
11
Lubricants
80%
Filters - 3%
Valvoline
Int'l - 23%
Int'l - 23%
Valvoline
Int'l - 23%
Int'l - 23%
Do-It-
Yourself
Yourself
35%
Business Overview | |
Customers | • Retail auto parts stores and mass merchandisers who sell to consumers; installers, such as car dealers and quick lubes; distributors |
Products/ Services | • Valvoline® lubricants and automotive chemicals • MaxLife® lubricants for high-mileage vehicles • SynPower® synthetic motor oil • Eagle One® and Car Brite® appearance products • Zerex® antifreeze • Valvoline Instant Oil Change® service |
Market Channels | • Do-It-Yourself (DIY) • Do-It-For-Me (DIFM) • Valvoline International |
Revenue
by Product Line
by Product Line
Revenue
by Market Channel
by Market Channel
Do-It-
For-Me
37%
For-Me
37%
DIFM:
Installer channel
23%
Installer channel
23%
Specialty/
Other - 5%
Other - 5%
DIFM:
Valvoline Instant
Oil Change - 14%
Valvoline Instant
Oil Change - 14%
Chemicals - 6%
Appearance
products - 3%
products - 3%
Antifreeze - 8%
For the Fiscal Year Ended Sept. 30, 2008
Revenue: $1.7 billion
EBITDA: $115 million
EBITDA Margin: 6.9%
Ashland Consumer Markets: A leading worldwide
marketer of premium-branded automotive lubricants and chemicals
marketer of premium-branded automotive lubricants and chemicals
12
Chemicals
Chemicals
47%
47%
Plastics
41%
Environmental
Service/Other -
2%
Service/Other -
2%
Construction
Construction
24%
24%
Other
15%
Business Overview | |
Customers | • Diversified customer base |
Products/ Services | • More than 7,000 packaged and bulk chemicals, solvents, plastics and additives • Comprehensive, hazardous and nonhazardous waste- management solutions in North America |
Markets | • Construction • Transportation • Chemical manufacturing • Paint and coatings • Retail consumer • Personal care • Medical • Marine |
Revenue
by Product
Line
by Product
Line
Revenue
by Market
by Market
Trans-
portation
portation
15%
Paint & Coatings - 10%
Medical - 6%
Marine - 4%
Com-
posites
posites
10%
Chemical Mfg.
- 11%
- 11%
Retail
Consumer - 8%
Consumer - 8%
Personal
Care - 7%
Care - 7%
For the Fiscal Year Ended Sept. 30, 2008
Revenue: $4.4 billion
EBITDA: $75 million
EBITDA Margin: 1.7%
Ashland Distribution
A leading North American chemicals and plastics distributor
A leading North American chemicals and plastics distributor
13
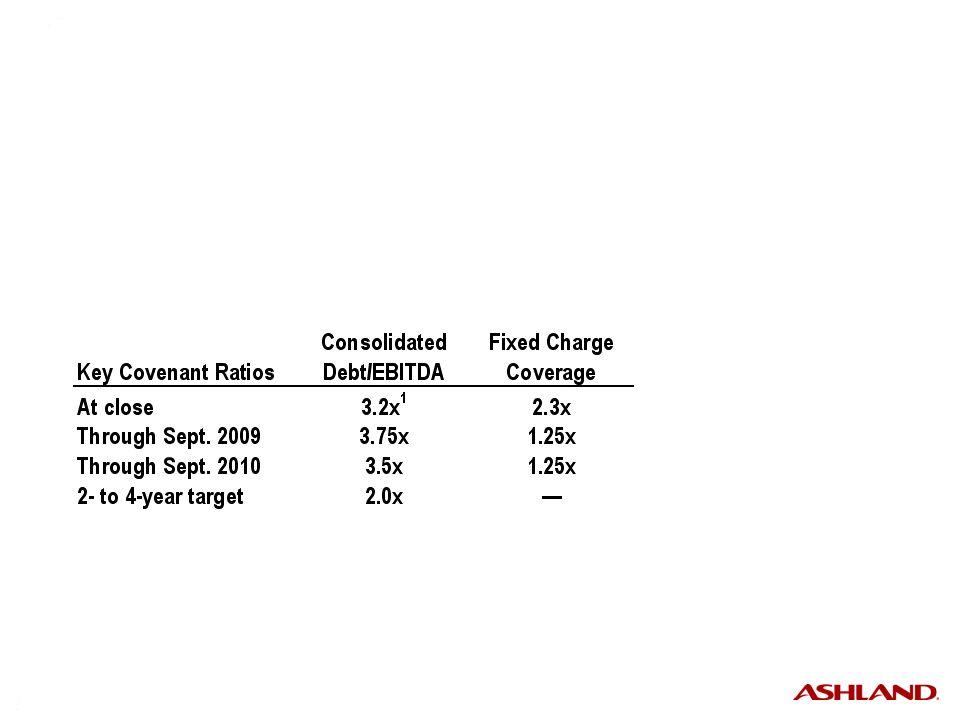
1 As adjusted for bank covenants. Debt/EBITDA ratio of 3.5x based on trailing 12 mos. pro forma EBITDA.
Financial Structure
• $2.6 billion of debt, plus $200 million available revolver capacity
- Term Loan A, Term Loan B, bridge loan, revolver, and A/R securitization
- Approximately $250 million book interest expense
• Approximately 74 million common shares, including 10.5 million issued
as part of Hercules transaction
as part of Hercules transaction
• Approximately $100 million cash
• Goal of attaining investment-grade credit rating in two to four years
- Current corporate credit ratings of BB- / Ba2 from S&P and Moody's

14
October Update
• Legacy Ashland Water Technologies
- Sales down slightly in Europe, but up slightly
in Americas, vs. October 2007
in Americas, vs. October 2007
• Performance Materials
- Volume down 12 percent vs. October 2007
• Consumer Markets (Valvoline)
- Lubricants volume down 17 percent vs. October 2007
- Gross profit percentage up vs. September 2008
• Distribution
- Volume down 11 percent vs. October 2007
- Gross profit percentage down vs. September 2008
• Operating-segment trade working capital
improved to 12.2 percent of sales
improved to 12.2 percent of sales
- $80 million run-rate
by end of FY 2009
by end of FY 2009
- $20 million run-rate
by end of CY 2008
by end of CY 2008
15
Sales & Marketing
Manufacturing
Purchasing
Manufacturing
Purchasing
Sales & Marketing
Manufacturing
Purchasing
Manufacturing
Purchasing
G&A
G&A
• Estimated one-time
integration costs
still being finalized
integration costs
still being finalized
• Key areas for synergy
- Corporate function
restructuring
restructuring
- Global supply chain
- Paper/Water integration
• $120 million estimate
(cost savings only)
(cost savings only)
- Run-rate by the end
of FY 2010
of FY 2010
- $80 million run-rate
by end of FY 2009
by end of FY 2009

16
Focus on Cash Flow
• Reduced dividend reflects levels
of specialty chemical peers
of specialty chemical peers
• Capital expenditures expected to be
approximately $200 million
approximately $200 million
• Accelerate realization of $120 million
of synergies
of synergies
• Focus on expense control and
discretionary spending
discretionary spending
• Other sources

17
Investment in Ashland
• Focus on cash generation producing results
• Realizing cost structure efficiencies
• Completion of Hercules acquisition creates
a major, global specialty chemicals company
a major, global specialty chemicals company
- 74 percent of pro forma EBITDA derived
from specialty chemicals core, with roughly one-third
from bio-based chemistries
from specialty chemicals core, with roughly one-third
from bio-based chemistries
- $10.7 billion in pro forma sales and operating revenue,
with 35 percent from outside North America
with 35 percent from outside North America
- Drives stronger, higher margin, less cyclical earnings

Appendix

19
(20) bp
4.5%
4.3%
EBITDA as a percent of sales
3)%
349)
$
358)
$
Earnings before interest, taxes, depreciation
and amortization (EBITDA)
and amortization (EBITDA)
Twelve months ended Sept. 30,
(in millions, except change)
(30) bp
2.8%
2.5%
Operating income percentage
110) bp
15.0%
13.9%
SG&A percentage
(140) bp
17.2%
15.8%
Gross profit percentage
(1)%
10 %
-)%
(1)%
(9)%
8 %
Fav./(Unfav.)
6,447)
7,056)
Cost of sales
49)
54)
Equity and other income
216)
213)
Operating income
2007
2008
1,171)
1,338)
7,785)
$
1,166)
Selling, general & administrative expenses
1,325)
Gross profit
8,381)
$
Sales and operating revenue
Fiscal 2008
Financial Results
Financial Results
The information provided in this presentation regarding earnings before interest, taxes, depreciation, and amortization (EBITDA) does not conform to generally accepted accounting principles (GAAP) and should not be construed as an alternative to the reported results determined in accordance with GAAP. Management has included this non-GAAP information to assist in understanding the operating performance of the Company and its operating segments. The non-GAAP information provided may not be consistent with the methodologies used by other companies. All non-GAAP information is reconciled with reported GAAP results in the financials that follow in this Appendix.

20
Regulation G: Reconciliation
of Operating Income to EBITDA
of Operating Income to EBITDA
21
(in millions)
Ashland Inc. Fiscal Year Ended Sept. 30
Regulation G: Reconciliation
of Operating Income to EBITDA
Regulation G: Reconciliation
of Operating Income to EBITDA
22
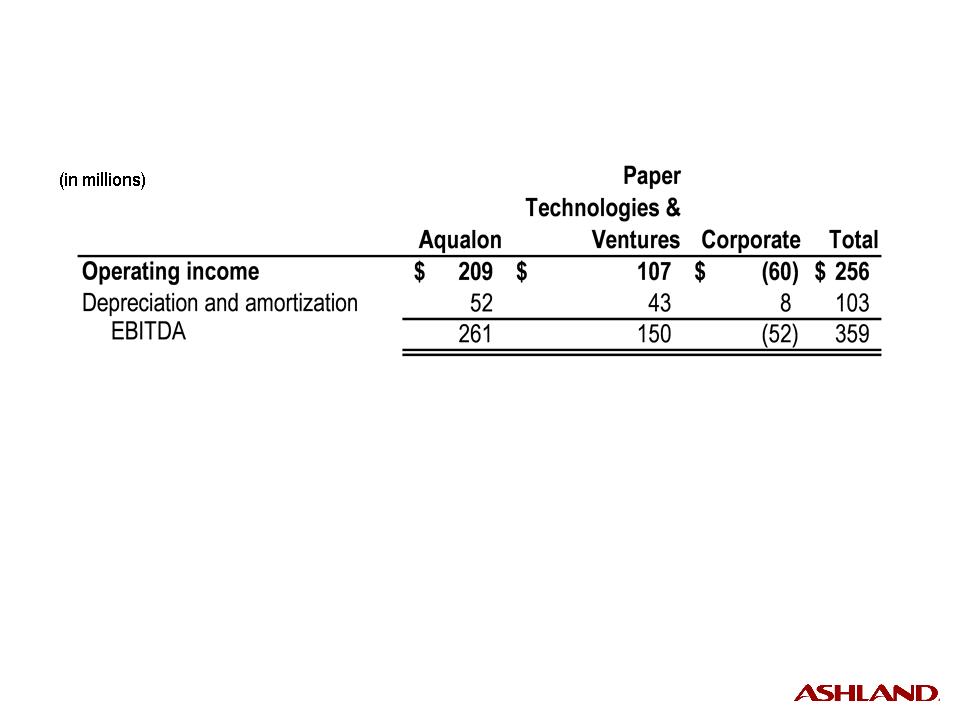
Hercules Inc. 12 Months Ended Sept. 30, 2008
Regulation G: Reconciliation
of Operating Income to EBITDA
Regulation G: Reconciliation
of Operating Income to EBITDA