
Lamar M. Chambers, Senior Vice President and Chief Financial Officer
Third Annual Longbow Research
Paper, Packaging and Chemicals Conference
November 12, 2009
Paper, Packaging and Chemicals Conference
November 12, 2009

2
Forward-Looking Statements
This presentation contains forward-looking statements within the meaning of Section 27A of the Securities
Act of 1933 and Section 21E of the Securities Exchange Act of 1934. These forward-looking statements are
based upon a number of assumptions, including those mentioned within this presentation. Performance
estimates are also based upon internal forecasts and analyses of current and future market conditions and
trends; management plans and strategies; operating efficiencies and economic conditions, such as prices,
supply and demand, and cost of raw materials; legal proceedings and claims (including environmental and
asbestos matters); and weather. These risks and uncertainties may cause actual operating results to differ
materially from those stated, projected or implied. Other risks and uncertainties include the possibility that
the benefits anticipated from Ashland's acquisition of Hercules will not be fully realized; Ashland's
substantial indebtedness may impair its financial condition; the restrictive covenants under the debt
instruments may hinder the successful operation of Ashland’s business; future cash flow may be
insufficient to repay the debt; and other risks that are described in filings made by Ashland with the
Securities and Exchange Commission (the “SEC”). Although Ashland believes its expectations are based
on reasonable assumptions, it cannot assure the expectations reflected herein will be achieved. This
forward-looking information may prove to be inaccurate and actual results may differ significantly from
those anticipated if one or more of the underlying assumptions or expectations proves to be inaccurate or
is unrealized or if other unexpected conditions or events occur. Other factors, uncertainties and risks
affecting Ashland are contained in Ashland's periodic filings made with the SEC, including its Form 10-K for
the fiscal year ended Sept. 30, 2008, and Forms 10-Q for the quarters ended Dec. 31, 2008, and March 31
and June 30, 2009, which are available on Ashland’s Investor Relations website at
http://investor.ashland.com or the SEC’s website at www.sec.gov. Ashland undertakes no obligation to
subsequently update or revise the forward-looking statements made in this presentation to reflect events or
circumstances after the date of this presentation.

3
Ashland
Consumer
Markets
Consumer
Markets
(Valvoline)
Ashland
Performance
Materials
Materials
Ashland
Hercules
Water
Technologies
Water
Technologies
Ashland
Distribution
Ashland
Aqualon
Functional
Ingredients
Functional
Ingredients
#1 global leader
in unsaturated
polyester resins
and vinyl ester
resins
in unsaturated
polyester resins
and vinyl ester
resins
#3 passenger-car
motor oil and
#2 quick-lube
chain in the
United States
motor oil and
#2 quick-lube
chain in the
United States
#2 plastics
and #3
chemicals
distributor
in North
America
and #3
chemicals
distributor
in North
America
#1 global
producer
of specialty
papermaking
chemicals
producer
of specialty
papermaking
chemicals
#2 global
producer
of cellulose
ethers
producer
of cellulose
ethers
Ashland
Strong Leadership Positions
in the Markets We Serve
in the Markets We Serve
4
1 For the 12 months ended Sept. 30, 2009.
Ashland Consumer
Markets
34%
Markets
34%
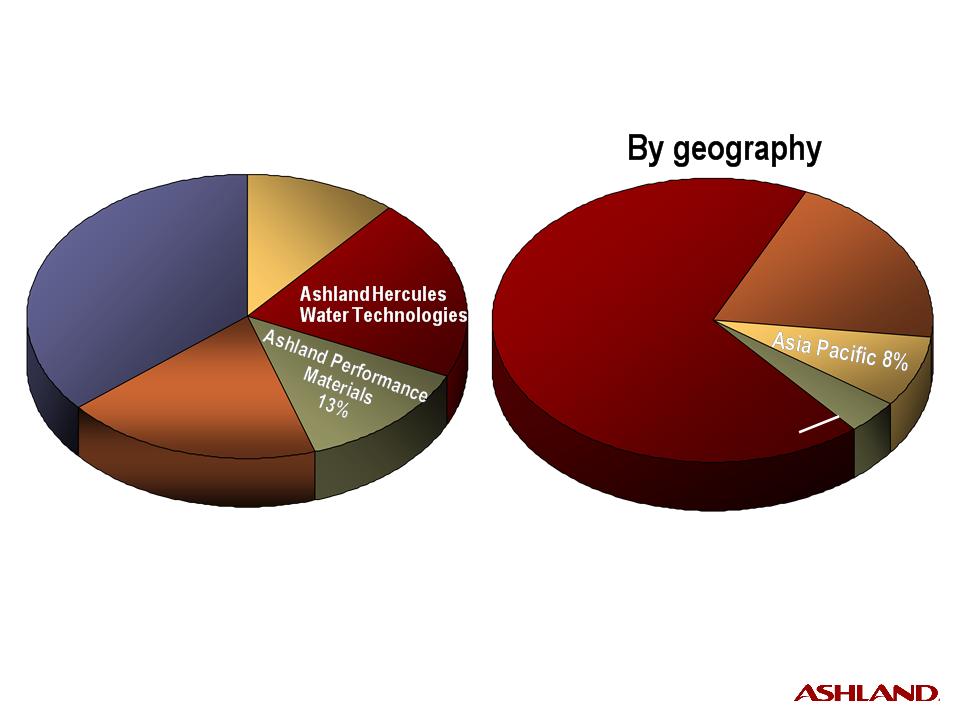
Ashland Hercules
Water Technologies
Water Technologies
Ashland Hercules
Water Technologies
Water Technologies
23%
23%
Ashland
Ashland
Aqualon Functional
Aqualon Functional
Ingredients
Ingredients
24%
24%
• 56 percent of EBITDA comes from specialty chemicals
• Nearly 25 percent from renewable materials
Pro Forma Ongoing EBITDA1
by commercial unit
by commercial unit
NYSE Ticker Symbol: | ASH |
Total Employees: | ~14,700 |
Outside North America | 33% |
Number of Countries in Which Ashland Has Sales: | More than 100 |
Corporate Profile
5
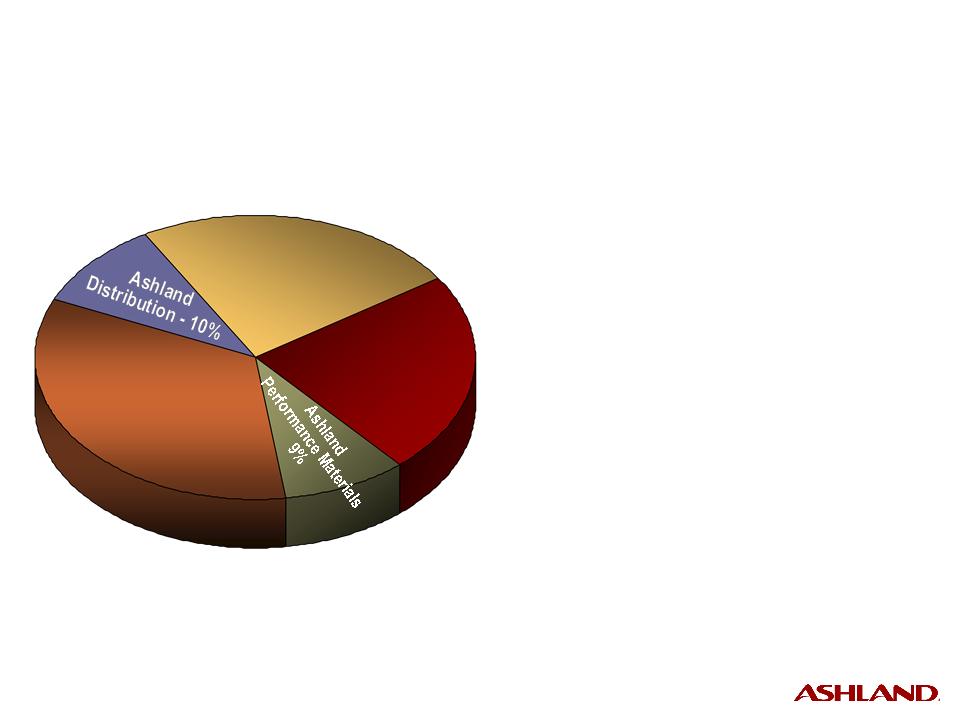
Ashland
Distribution
36%
Distribution
36%
Ashland
Distribution
36%
Distribution
36%
Ashland
Consumer
Markets
19%
Consumer
Markets
19%
By commercial unit
21%
21%
Ashland
Aqualon
Functional
Ingredients
Aqualon
Functional
Ingredients
Ashland
Aqualon
Functional
Ingredients
Aqualon
Functional
Ingredients
11%
11%
1 For the 12 months ended Sept. 30, 2009, including intersegment sales.
North
America
68%
America
68%
North
America
68%
America
68%
Latin America/
Other - 4%
Other - 4%
Europe
Europe
20%
20%
~32 percent of total revenue comes
from outside North America
from outside North America
Trailing 12 Months Pro Forma1
Sales and Operating Revenue
Sales and Operating Revenue

6
To be a leading, global specialty chemicals company
that is a market leader in all major businesses
that is a market leader in all major businesses
Ashland Vision for the Future
• Building on three growth
platforms
platforms
– Ashland Aqualon Functional
Ingredients
Ingredients
– Ashland Hercules Water
Technologies
Technologies
– Ashland Performance Materials
• Investing in two primary
chemistries
chemistries
– Water-soluble polymers
– Thermoset resins
• Sharing three common capabilities
– Application expertise
– Formulation expertise
– Polymerization expertise
• Focusing on five key markets
– Paper and packaging
– Personal care
– Pharmaceutical
– Construction
– Transportation
7
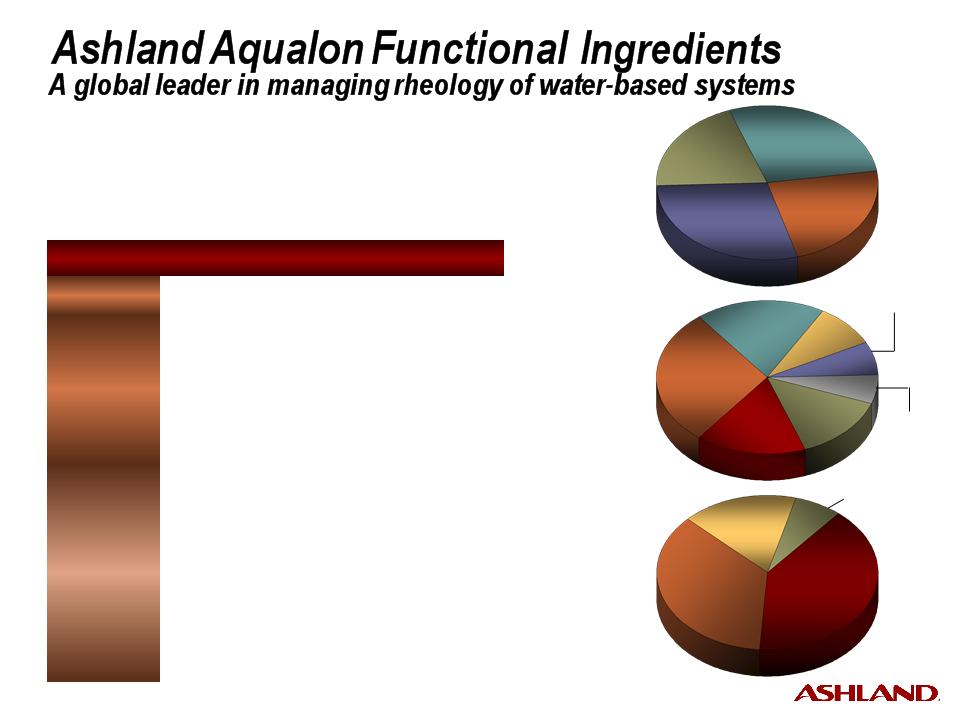
7%
7%
North
America
America
North
America
America
40%
40%
Asia
Pacific
Pacific
Asia
Pacific
Pacific
17%
17%
Europe
36%
Latin America/
Other - - 7%
Coatings
28%
28%
Coatings
28%
28%
Energy & Spec.
Solutions
23%
Solutions
23%
Regulated
Industries
29%
Industries
29%
Regulated
Industries
29%
Industries
29%
Revenue
by Geography
by Geography
Revenue
by Market
by Market
For the 12 Months Ended Sept. 30, 2009
Pro Forma Revenue: $0.9 billion
Pro Forma Ongoing EBITDA: $202 million
Pro Forma Ongoing EBITDA Margin: 22.4%
Business Overview | |
Customers | • Diversified, global customer base |
Products | • Broad product line based on renewable resources - Water-soluble polymers (cellulose ethers and guar derivatives) - Refined wood rosin and natural wood terpenes |
Markets | • Water-based paints • Paper coatings • Construction • Oilfield (chemicals and drilling muds) • Regulated markets - Personal care - Food - Pharmaceuticals |
Revenue
by Product
by Product
CMC
16%
16%
CMC
16%
16%
HEC
29%
29%
HEC
29%
29%
MC
19%
19%
MC
19%
19%
Guar
9%
9%
Guar
9%
9%
Other
14%
14%
Other
14%
14%
Stumpwood
Derivatives
Derivatives
Construction
20%
20%
Construction
20%
20%
Klucel®
6%
6%

8
• Use leadership position in cellulose ethers
to drive growth through product innovation
and geographic expansion
to drive growth through product innovation
and geographic expansion
• Invest in additional water-soluble polymers that can be
leveraged across multiple growth platforms and markets
leveraged across multiple growth platforms and markets
• Leverage deep customer relationships
in core markets (coatings, construction,
personal care and pharmaceutical) to introduce
high-value complementary products
in core markets (coatings, construction,
personal care and pharmaceutical) to introduce
high-value complementary products
Ashland Aqualon Functional Ingredients
Strategy
Strategy
9
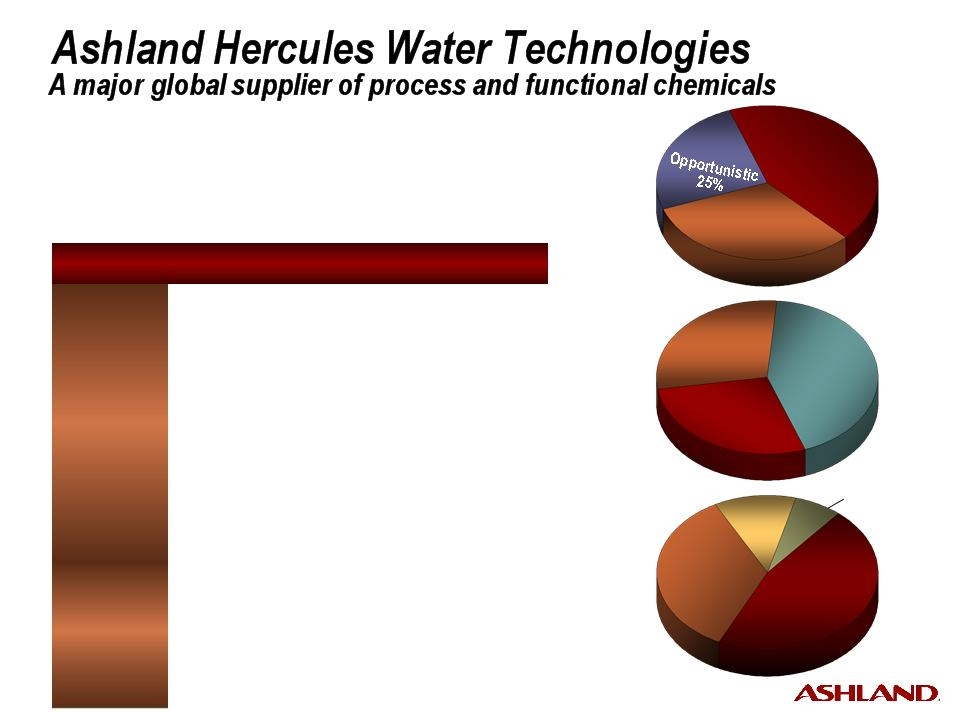
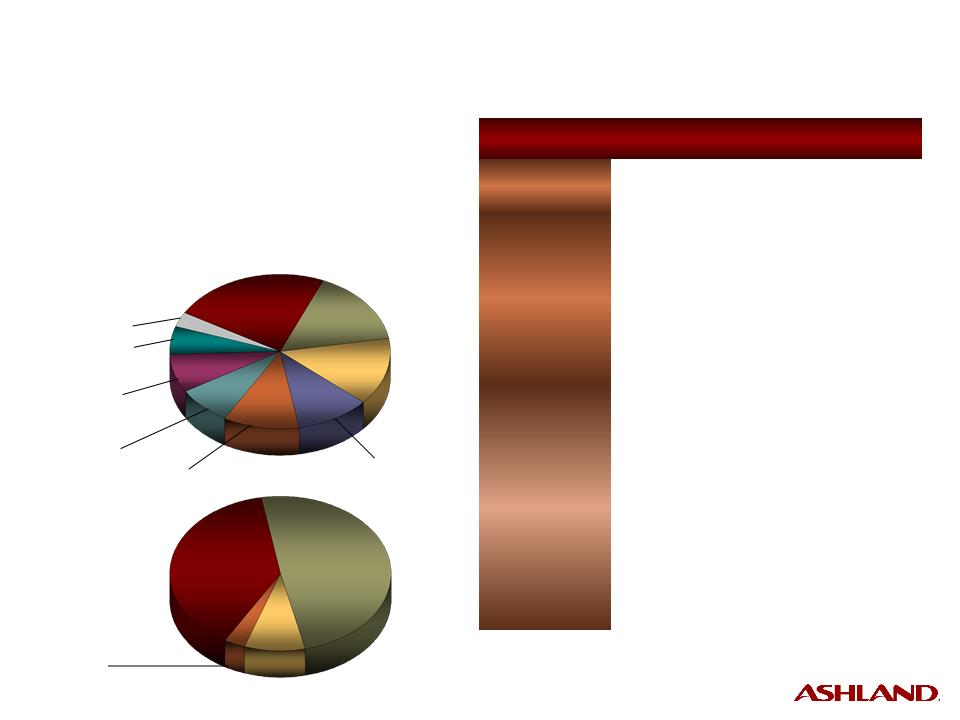
North
America
America
North
America
America
46%
46%
Asia
Pacific
Pacific
Asia
Pacific
Pacific
12%
12%
Europe
35%
Latin America/
Other - - 7%
Growth
43%
43%
Growth
43%
43%
Base
32%
32%
Revenue
by Geography
by Geography
Revenue
by Market
by Market
For the 12 Months Ended Sept. 30, 2009
Pro Forma Revenue: $1.8 billion
Pro Forma Ongoing EBITDA: $198 million
Pro Forma Ongoing EBITDA Margin: 11.0%
Revenue
by Product
by Product
Process
28%
28%
Process
28%
28%
Utility
29%
29%
Utility
29%
29%
Functional
43%
43%
Functional
43%
43%
Business Overview | |
Customers/ Markets | • Growth – Commercial and – Packaging institutional – Pulp – Food and beverage – Tissue/towel – Mining • Base – Chemicals – General manufacturing – Printing and writing • Opportunistic – Lubricants – Marine*/Other – Municipal * Divested 8/31/09 |
Products/ Services | • Process chemicals: microbial and contaminant control, pulping aids, retention aids and defoamers • Utility water treatments • Functional chemicals: sizing/wet strength |

10
• Build upon leadership in specialty papermaking chemicals
through product-line extension and geographic expansion
through product-line extension and geographic expansion
• Extend best-in-class, market-focused business model
to additional water-intensive verticals, leveraging
core process chemical technologies
to additional water-intensive verticals, leveraging
core process chemical technologies
• Continue to optimize operational efficiency
of high-volume functional chemical assets
of high-volume functional chemical assets
Ashland Hercules Water Technologies
Strategy
Strategy
11
North
America
America
North
America
America
57%
57%
Europe
26%
Latin
America/
Other - - 7%
America/
Other - - 7%
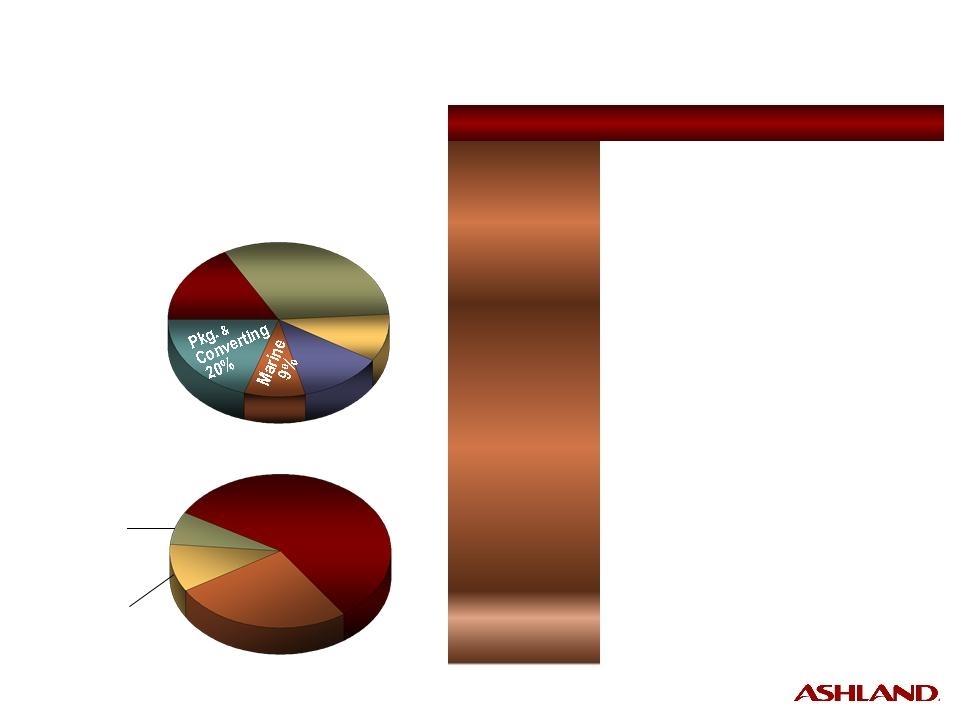
Trans-
portation
portation
Trans-
portation
portation
17%
17%
Ind.
Constr.
Constr.
32%
Business Overview | |
Customers | • Auto manufacturers; foundries; pipe and tank fabricators; packaging and converting; bathware, countertop and window lineal manufacturers; pipe relining contractors; boat builders; wide and narrow web printers |
Products/ Services | • Composites and Adhesives - Unsaturated polyester resins - Vinyl ester resins - Gelcoats - Pressure-sensitive adhesives - Structural adhesives - Specialty resins • Casting Solutions - Foundry binder resins - Chemicals - Sleeves and filters - Design services |
Markets | • Construction, packaging and con- verting, transportation, and marine |
Revenue
by Geography
by Geography
Revenue
by Market
by Market
For the 12 Months Ended Sept. 30, 2009
Pro Forma Revenue: $1.1 billion
Pro Forma Ongoing EBITDA: $77 million
Pro Forma Ongoing EBITDA Margin: 7.0%
Res. Constr.
10%
Infra-
structure
structure
12%
Asia
Pacific - - 10%
Pacific - - 10%
Ashland Performance Materials
A global leader in specialty chemicals
A global leader in specialty chemicals

12
• Use market insight and thermoset chemistry expertise
to create innovative substitutes that are stronger,
lighter and more resistant than traditional materials
for transportation, construction and infrastructure markets
to create innovative substitutes that are stronger,
lighter and more resistant than traditional materials
for transportation, construction and infrastructure markets
• Use leadership position in unsaturated polyester resins
and vinyl ester resins to catalyze growth
in Brazil, Russia, India and China
and vinyl ester resins to catalyze growth
in Brazil, Russia, India and China
• Further build position in packaging and converting market,
leveraging historical strength in high-end, solvent-based
adhesives, while growing through new water-based and
radiation-cured technologies
leveraging historical strength in high-end, solvent-based
adhesives, while growing through new water-based and
radiation-cured technologies
Ashland Performance Materials
Strategy
Strategy

13
Lubricants
84%
Filters - - 2%
Valvoline
Int'l
20%
Int'l
20%
Valvoline
Int'l
20%
Int'l
20%
Do-It-
Yourself
Yourself
38%
Business Overview | |
Customers | • Retail auto parts stores and mass merchandisers who sell to consumers; installers, such as car dealers and quick lubes; distributors |
Products/ Services | • Valvoline® lubricants and automotive chemicals • MaxLife® lubricants for high-mileage vehicles • SynPower® synthetic motor oil • Eagle One® and Car Brite® appearance products • Zerex® antifreeze • Valvoline Instant Oil Change® service |
Market Channels | • Do-It-Yourself (DIY) • Do-It-For-Me (DIFM) • Valvoline International |
Revenue
by Product Line
by Product Line
Revenue
by Market Channel
by Market Channel
Do-It-
For-Me
40%
For-Me
40%
DIFM:
Installer channel
29%
Installer channel
29%
Specialty/
Other - - 2%
Other - - 2%
DIFM:
Valvoline Instant
Oil Change - 11%
Valvoline Instant
Oil Change - 11%
Antifreeze - - 5%
Appearance
products - - 2%
products - - 2%
Chemicals - - 7%
For the 12 Months Ended Sept. 30, 2009
Pro Forma Revenue: $1.7 billion
Pro Forma Ongoing EBITDA: $288 million
Pro Forma Ongoing EBITDA Margin: 16.9%
Ashland Consumer Markets: A leading worldwide
marketer of premium-branded automotive lubricants and chemicals
marketer of premium-branded automotive lubricants and chemicals

14
• Use superior consumer insight to create channel-focused
solutions that leverage the Valvoline brand
solutions that leverage the Valvoline brand
• Build brand loyalty in key growth segments within
D-I-Y channel, such as youth and Hispanics, through
highly targeted advertising, promotions and programs
D-I-Y channel, such as youth and Hispanics, through
highly targeted advertising, promotions and programs
• Continue to deliver preferred customer experience
in D-I-F-M channel through superior employee training,
store traffic optimization, point-of-sale enhancements
and highly targeted service offerings
in D-I-F-M channel through superior employee training,
store traffic optimization, point-of-sale enhancements
and highly targeted service offerings
• Develop and strengthen distribution network
for both passenger-car and commercial lubricants
in international markets
for both passenger-car and commercial lubricants
in international markets
Ashland Consumer Markets
Strategy
Strategy
15
Chemicals
Chemicals
49%
49%
Plastics
39%
Environmental
Services/Other - -
3%
Services/Other - -
3%
Construction
Construction
23%
23%
Other
16%
Business Overview | |
Customers | • Diversified customer base in North America and Europe |
Products/ Services | • More than 28,000 packaged and bulk chemicals, solvents, plastics and additives • Comprehensive, hazardous and nonhazardous waste- management solutions in North America |
Markets | • Construction • Transportation • Chemical manufacturing • Paint and coatings • Retail consumer • Personal care • Medical • Marine |
Revenue
by Product
Line
by Product
Line
Revenue
by Market
by Market
Trans-
portation
portation
14%
Paint & Coatings - 11%
Medical - - 6%
Marine - - 3%
Com-
posites
posites
9%
Chemical Mfg.
- 11%
- 11%
Retail
Consumer - - 8%
Consumer - - 8%
Personal
Care - - 8%
Care - - 8%
For the 12 Months Ended Sept. 30, 2009
Pro Forma Revenue: $3.0 billion
Pro Forma Ongoing EBITDA: $84 million
Pro Forma Ongoing EBITDA Margin: 2.8%
Ashland Distribution
A leading North American chemicals and plastics distributor
A leading North American chemicals and plastics distributor

16
• Continue focus on efficiency to create
highest-value channel for customers and suppliers
highest-value channel for customers and suppliers
• Build best-in-class product offering by aligning
with globally leading suppliers that:
with globally leading suppliers that:
– have low-cost production
– can ensure continuity of supply
– are investing in their business
– are industry leaders in quality and reliability
• Leverage Ashland's technical resources and asset network
to provide mass market penetration for specialty products
to provide mass market penetration for specialty products
Ashland Distribution
Strategy
Strategy
17
18
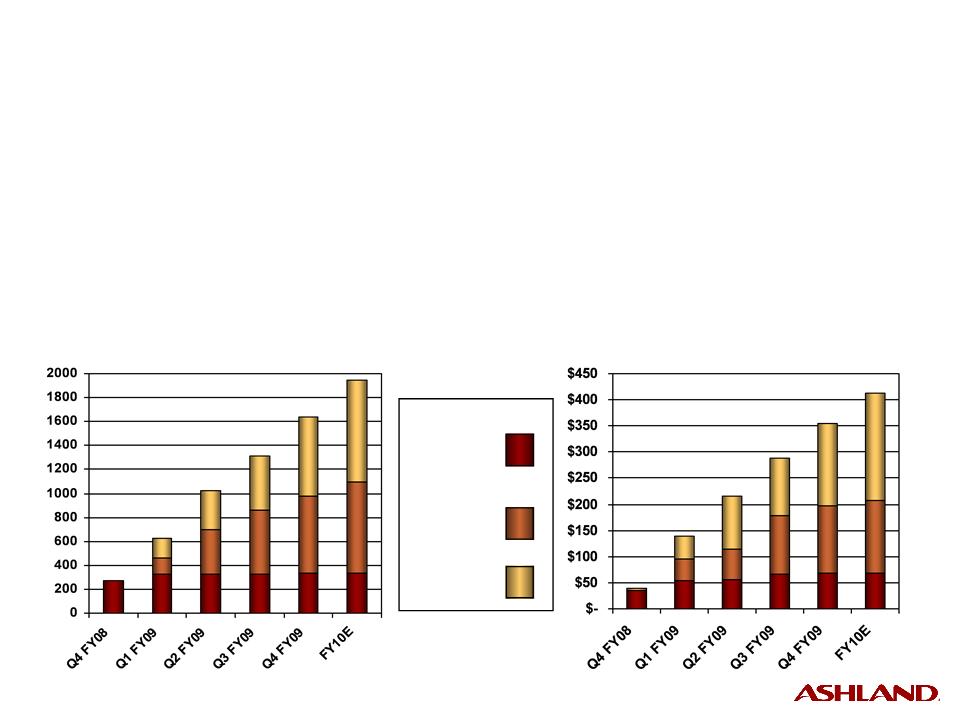
Cumulative Headcount
Reductions
Reductions
Annualized Run-rate
Savings (in millions)
Savings (in millions)
Original
Cost-
Structure
Initiatives
Hercules
Integration
Cost-
Structure
Initiatives
Hercules
Integration
Other
Initiatives
Initiatives
Fiscal Fourth Quarter 2009
Cost-Reduction Program Update
Cost-Reduction Program Update
• Achieved run-rate cost reductions of $355 million
– $84 million achieved in Q4, including $51 million of selling, general and
administrative expenses
administrative expenses

19
1 Free cash flow is defined as Cash Flows Provided by Operating Activities from Continuing Operations less
Additions to Property, Plant and Equipment less Cash Dividends Paid.
Additions to Property, Plant and Equipment less Cash Dividends Paid.
Investment Highlights
• Among top 10 specialty chemicals companies worldwide
• Long-term investment opportunities within specialty
chemicals businesses
chemicals businesses
• Continued emphasis on strong cash flow generation
– Generated free cash flow1 of $831 million in FY 2009
• Reduced debt by $1 billion since Hercules acquisition
in November 2008
in November 2008
– Achieved targeted debt level
• Improved business models, pricing processes and
margin management
margin management
• Expect Consumer Markets' results to be much nearer
2009 record results than previous historical results
2009 record results than previous historical results

20
Investment Highlights
• Successfully integrated Hercules business
– Strong performance from Water Technologies
– Cost-reduction targets achieved
• $355 million in total Ashland run-rate savings
achieved at September 30
achieved at September 30
– $400 million of total cost reductions,
roughly two-thirds permanent
roughly two-thirds permanent
• Ashland is well-positioned to leverage scale
and outperform as the economy improves
and outperform as the economy improves