EXHIBIT 99.2

First-Quarter Fiscal 2016 EarningsJanuary 25, 2016 ® Registered trademark, Ashland or its subsidiaries, registered in various countries™ Trademark, Ashland or its subsidiaries, registered in various countries
Forward-Looking StatementsThis presentation contains forward-looking statements within the meaning of Section 27A of the Securities Act of 1933, as amended, and Section 21E of the Securities Exchange Act of 1934, as amended. Ashland has identified some of these forward-looking statements with words such as “anticipates,” “believes,” “expects,” “estimates,” “is likely,” “predicts,” “projects,” “forecasts,” “may,” “will,” “should” and “intends” and the negative of these words or other comparable terminology. In addition, Ashland may from time to time make forward-looking statements in its annual report, quarterly reports and other filings with the Securities and Exchange Commission (SEC), news releases and other written and oral communications. These forward-looking statements are based on Ashland’s expectations and assumptions, as of the date such statements are made, regarding Ashland’s future operating performance and financial condition, including the proposed separation of its specialty chemicals and Valvoline businesses, the expected timetable for completing the separation, the future financial and operating performance of each company, strategic and competitive advantages of each company, the leadership of each company, and future opportunities for each company, as well as the economy and other future events or circumstances. Ashland’s expectations and assumptions include, without limitation, internal forecasts and analyses of current and future market conditions and trends, management plans and strategies, operating efficiencies and economic conditions (such as prices, supply and demand, cost of raw materials, and the ability to recover raw-material cost increases through price increases), and risks and uncertainties associated with the following: the possibility that the proposed separation will not be consummated within the anticipated time period or at all, including as the result of regulatory market or other factors; the potential for disruption to Ashland’s business in connection with the proposed separation; the potential that the new Ashland and Valvoline do not realize all of the expected benefits of the separation, Ashland’s substantial indebtedness (including the possibility that such indebtedness and related restrictive covenants may adversely affect Ashland’s future cash flows, results of operations, financial condition and its ability to repay debt); the impact of acquisitions and/or divestitures Ashland has made or may make (including the possibility that Ashland may not realize the anticipated benefits from such transactions); the global restructuring program (including the possibility that Ashland may not realize the anticipated revenue and earnings growth, cost reductions and other expected benefits from the program); Ashland’s ability to generate sufficient cash to finance its stock repurchase plans; severe weather, natural disasters, and legal proceedings and claims (including environmental and asbestos matters). Various risks and uncertainties may cause actual results to differ materially from those stated, projected or implied by any forward-looking statements, including, without limitation, risks and uncertainties affecting Ashland that are described in its most recent Form 10-K (including Item 1A Risk Factors) filed with the SEC, which is available on Ashland’s website at http://investor.ashland.com or on the SEC’s website at http://www.sec.gov. Ashland believes its expectations and assumptions are reasonable, but there can be no assurance that the expectations reflected herein will be achieved. Unless legally required, Ashland undertakes no obligation to update any forward-looking statements made in this presentation whether as result of new information, future event or otherwise.Regulation G: Adjusted ResultsThe information presented herein regarding certain unaudited adjusted results does not conform to generally accepted accounting principles in the United States (U.S. GAAP) and should not be construed as an alternative to the reported results determined in accordance with U.S. GAAP. Ashland has included this non-GAAP information to assist in understanding the operating performance of the company and its reportable segments. The non-GAAP information provided may not be consistent with the methodologies used by other companies. All non-GAAP information related to previous Ashland filings with the SEC has been reconciled with reported U.S. GAAP results.
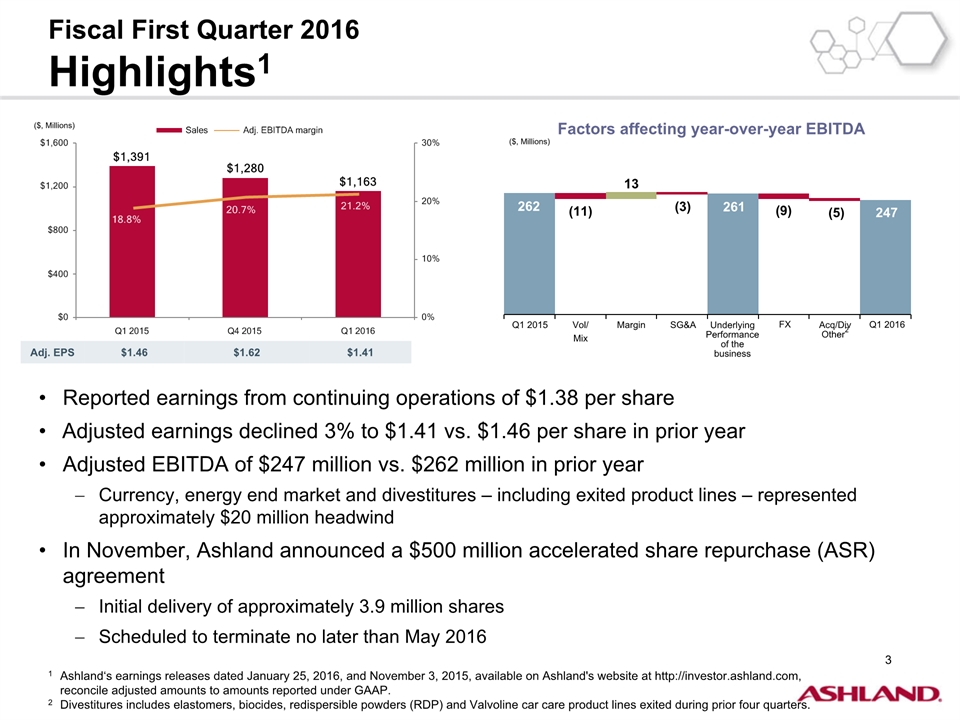
Fiscal First Quarter 2016Highlights1 Reported earnings from continuing operations of $1.38 per shareAdjusted earnings declined 3% to $1.41 vs. $1.46 per share in prior yearAdjusted EBITDA of $247 million vs. $262 million in prior yearCurrency, energy end market and divestitures – including exited product lines – represented approximately $20 million headwind In November, Ashland announced a $500 million accelerated share repurchase (ASR) agreementInitial delivery of approximately 3.9 million sharesScheduled to terminate no later than May 2016 Adj. EPS $1.46 $1.62 $1.41 Q1 2015 Vol/Mix Acq/Div Other2 Margin SG&A 13 (11) 247 262 (3) Q1 2016 (9) ($, Millions) ($, Millions) Factors affecting year-over-year EBITDA (5) FX Underlying Performance of the business 261 1 Ashland‘s earnings releases dated January 25, 2016, and November 3, 2015, available on Ashland's website at http://investor.ashland.com, reconcile adjusted amounts to amounts reported under GAAP. 2 Divestitures includes elastomers, biocides, redispersible powders (RDP) and Valvoline car care product lines exited during prior four quarters.
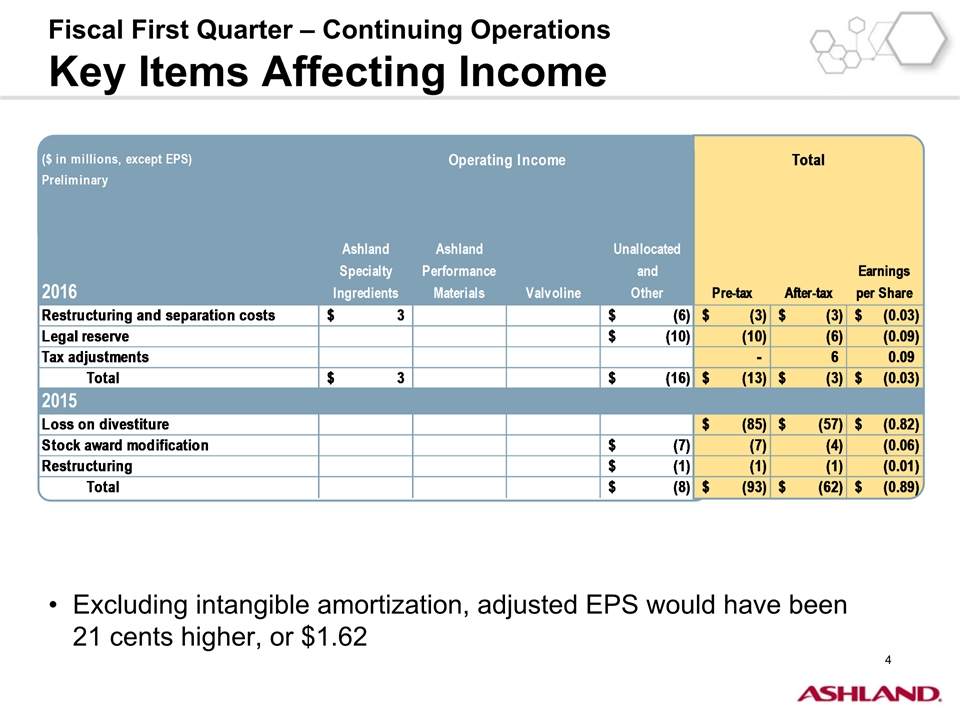
Fiscal First Quarter – Continuing OperationsKey Items Affecting Income Excluding intangible amortization, adjusted EPS would have been 21 cents higher, or $1.62
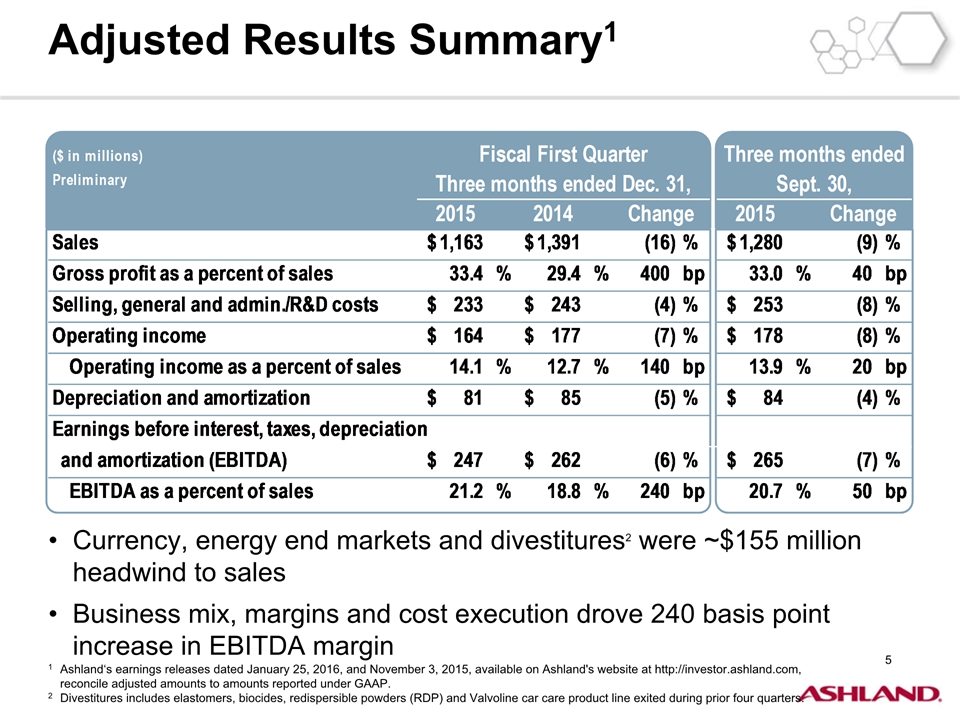
Adjusted Results Summary1 Currency, energy end markets and divestitures2 were ~$155 million headwind to salesBusiness mix, margins and cost execution drove 240 basis point increase in EBITDA margin 1 Ashland‘s earnings releases dated January 25, 2016, and November 3, 2015, available on Ashland's website at http://investor.ashland.com, reconcile adjusted amounts to amounts reported under GAAP. 2 Divestitures includes elastomers, biocides, redispersible powders (RDP) and Valvoline car care product line exited during prior four quarters.
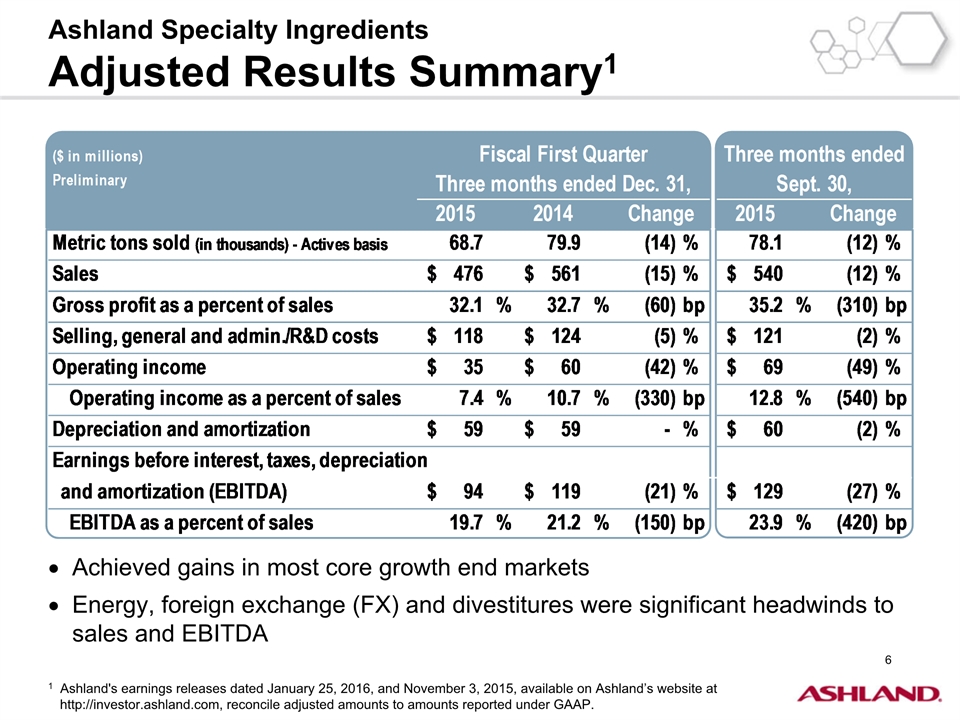
Ashland Specialty IngredientsAdjusted Results Summary1 Achieved gains in most core growth end marketsEnergy, foreign exchange (FX) and divestitures were significant headwinds to sales and EBITDA 1 Ashland's earnings releases dated January 25, 2016, and November 3, 2015, available on Ashland’s website at http://investor.ashland.com, reconcile adjusted amounts to amounts reported under GAAP.
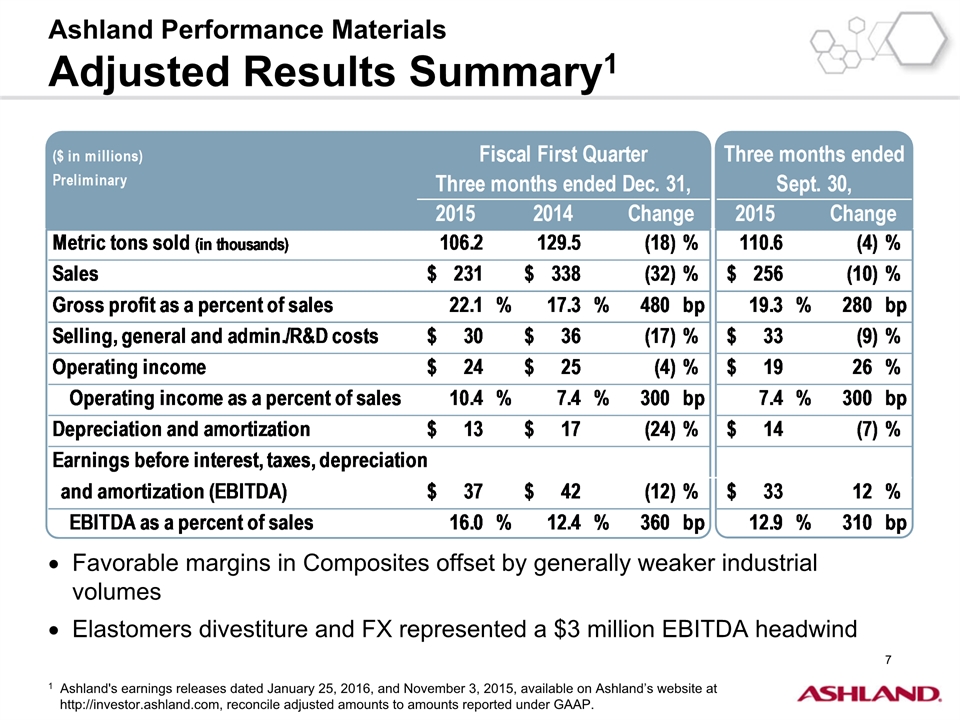
Ashland Performance Materials Adjusted Results Summary1 Favorable margins in Composites offset by generally weaker industrial volumesElastomers divestiture and FX represented a $3 million EBITDA headwind 1 Ashland's earnings releases dated January 25, 2016, and November 3, 2015, available on Ashland’s website at http://investor.ashland.com, reconcile adjusted amounts to amounts reported under GAAP.
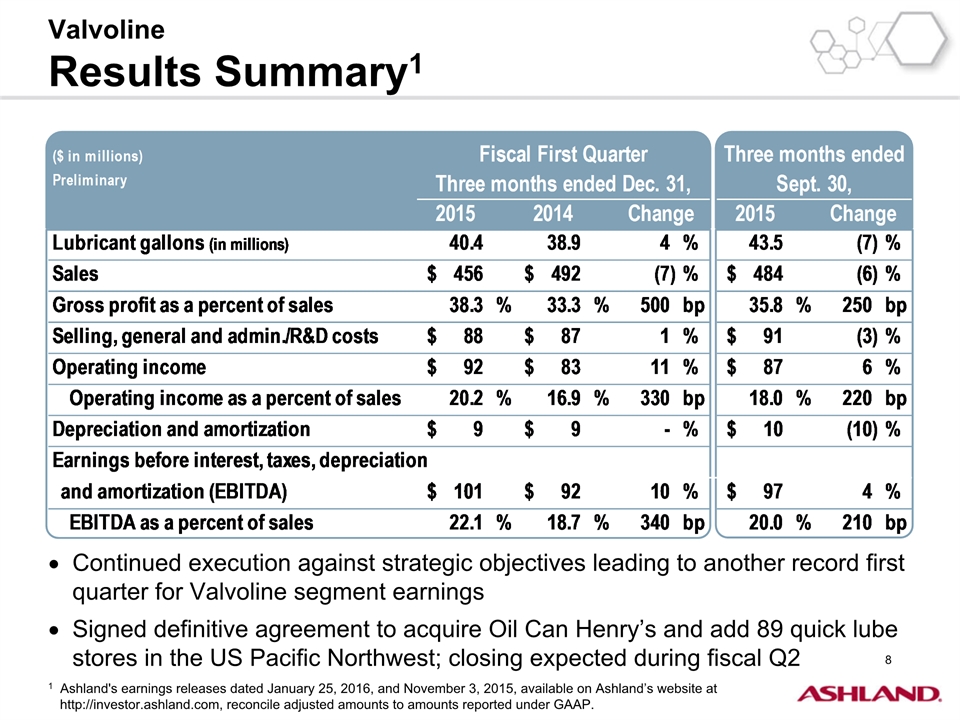
ValvolineResults Summary1 Continued execution against strategic objectives leading to another record first quarter for Valvoline segment earningsSigned definitive agreement to acquire Oil Can Henry’s and add 89 quick lube stores in the US Pacific Northwest; closing expected during fiscal Q2 1 Ashland's earnings releases dated January 25, 2016, and November 3, 2015, available on Ashland’s website at http://investor.ashland.com, reconcile adjusted amounts to amounts reported under GAAP.
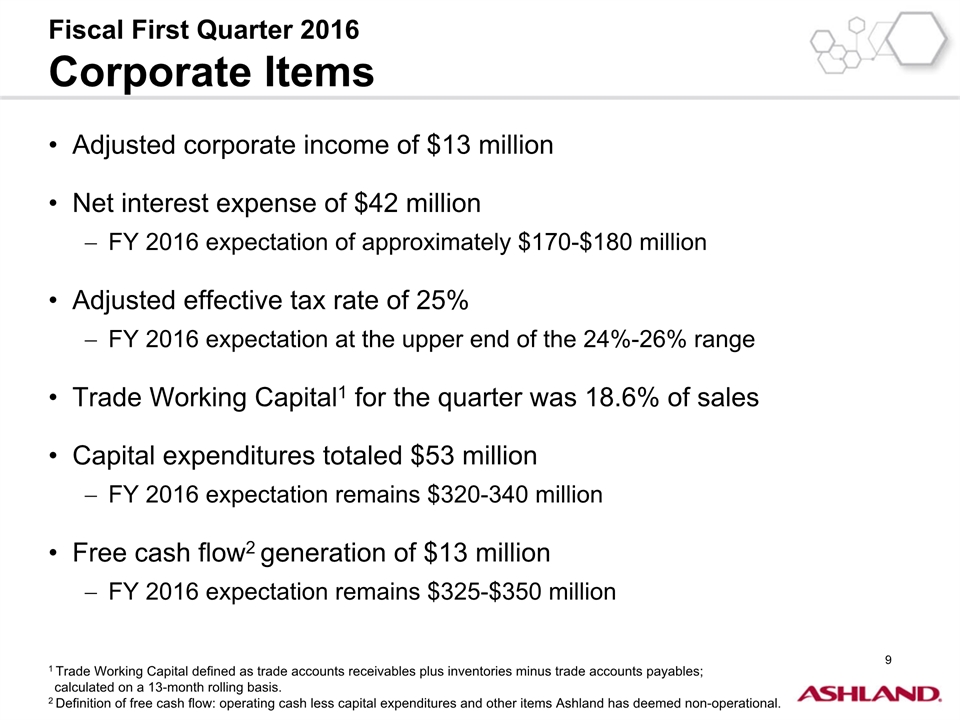
Fiscal First Quarter 2016Corporate Items Adjusted corporate income of $13 millionNet interest expense of $42 millionFY 2016 expectation of approximately $170-$180 millionAdjusted effective tax rate of 25%FY 2016 expectation at the upper end of the 24%-26% rangeTrade Working Capital1 for the quarter was 18.6% of salesCapital expenditures totaled $53 millionFY 2016 expectation remains $320-340 millionFree cash flow2 generation of $13 millionFY 2016 expectation remains $325-$350 million 1 Trade Working Capital defined as trade accounts receivables plus inventories minus trade accounts payables;calculated on a 13-month rolling basis.2 Definition of free cash flow: operating cash less capital expenditures and other items Ashland has deemed non-operational.

Appendix A:Bridges
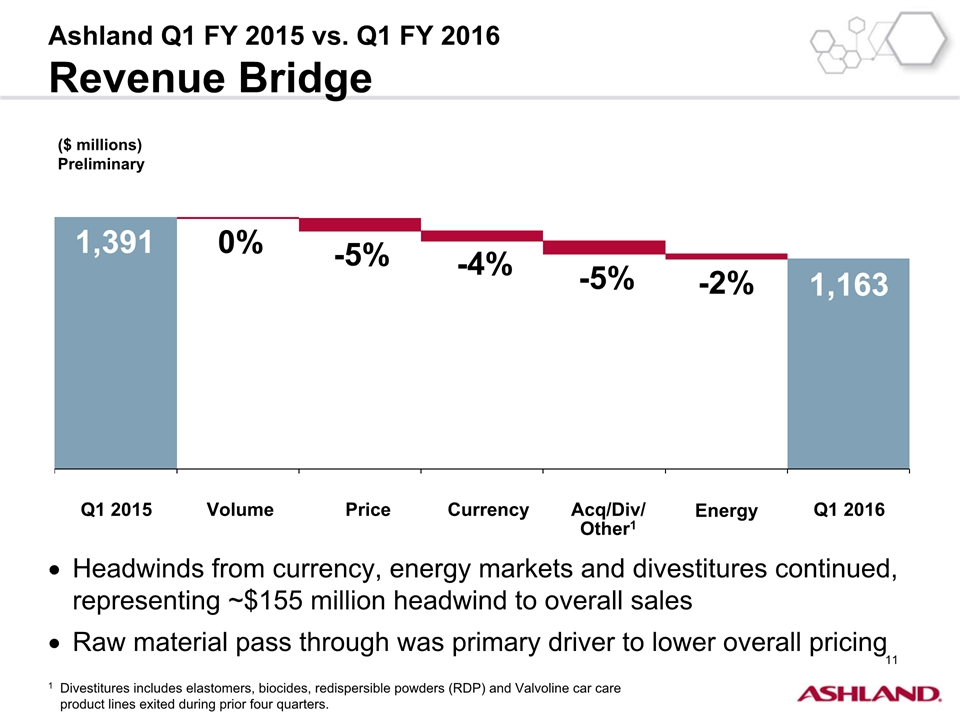
Ashland Q1 FY 2015 vs. Q1 FY 2016Revenue Bridge 0% Q1 2015 Volume Q1 2016 Currency -5% 1,391 1,163 Price -4% Acq/Div/Other1 -5% ($ millions)Preliminary Headwinds from currency, energy markets and divestitures continued, representing ~$155 million headwind to overall salesRaw material pass through was primary driver to lower overall pricing 1 Divestitures includes elastomers, biocides, redispersible powders (RDP) and Valvoline car care product lines exited during prior four quarters. Energy -2%
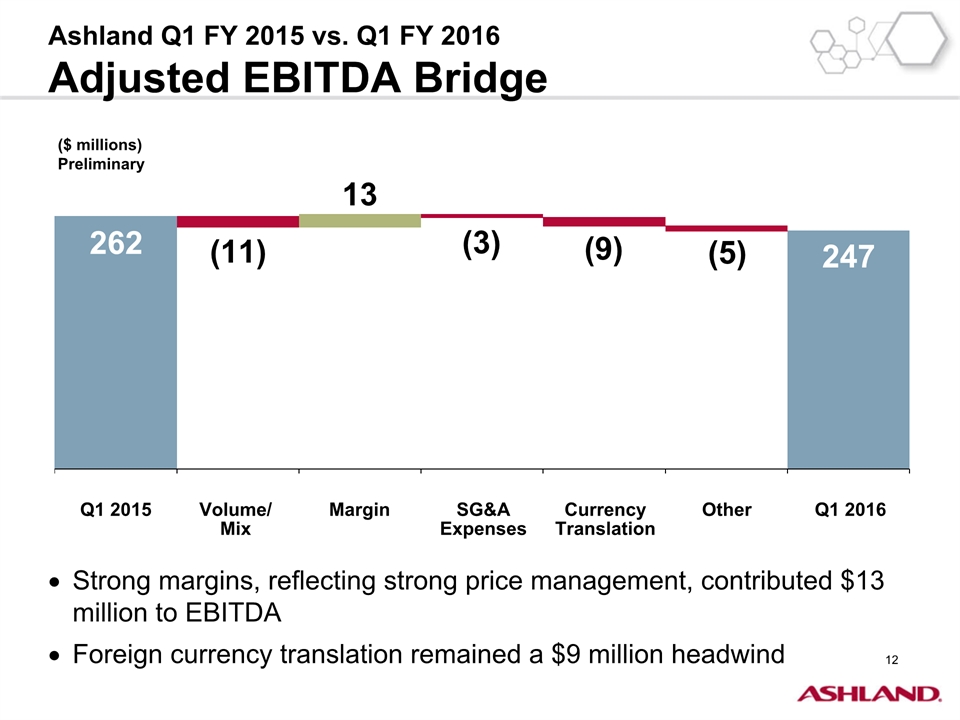
Ashland Q1 FY 2015 vs. Q1 FY 2016Adjusted EBITDA Bridge (11) Q1 2015 Volume/Mix Q1 2016 Currency Translation Margin 13 262 247 SG&AExpenses (3) (9) Other (5) ($ millions)Preliminary Strong margins, reflecting strong price management, contributed $13 million to EBITDAForeign currency translation remained a $9 million headwind
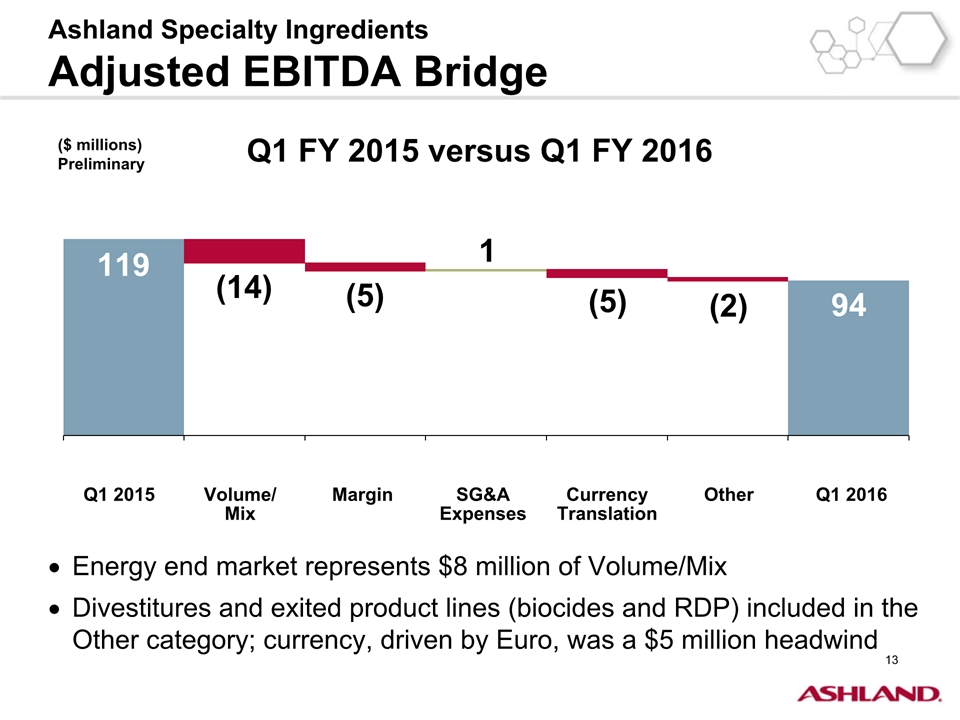
Ashland Specialty Ingredients Adjusted EBITDA Bridge Q1 2015 Volume/ Mix Q1 2016 Currency Translation Margin SG&AExpenses Q1 FY 2015 versus Q1 FY 2016 (14) 1 (5) 94 Energy end market represents $8 million of Volume/MixDivestitures and exited product lines (biocides and RDP) included in the Other category; currency, driven by Euro, was a $5 million headwind ($ millions)Preliminary 119 Other (5) (2)
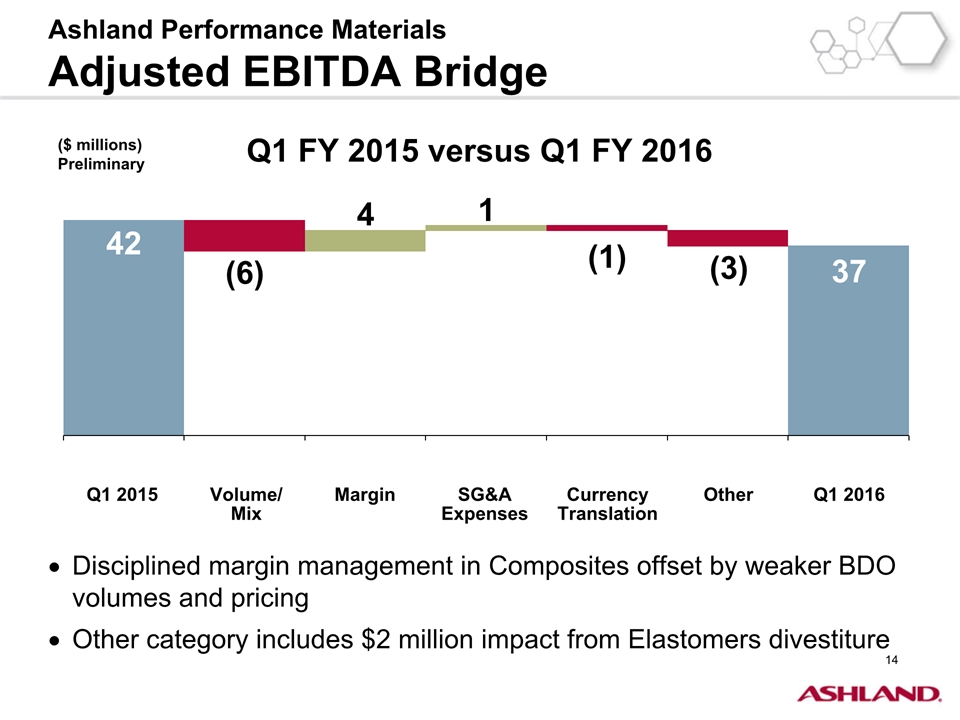
Ashland Performance MaterialsAdjusted EBITDA Bridge Q1 2015 Volume/ Mix Q1 2016 Currency Translation Margin SG&AExpenses Q1 FY 2015 versus Q1 FY 2016 (6) 4 (3) Other 1 37 Disciplined margin management in Composites offset by weaker BDO volumes and pricingOther category includes $2 million impact from Elastomers divestiture 42 ($ millions)Preliminary (1)
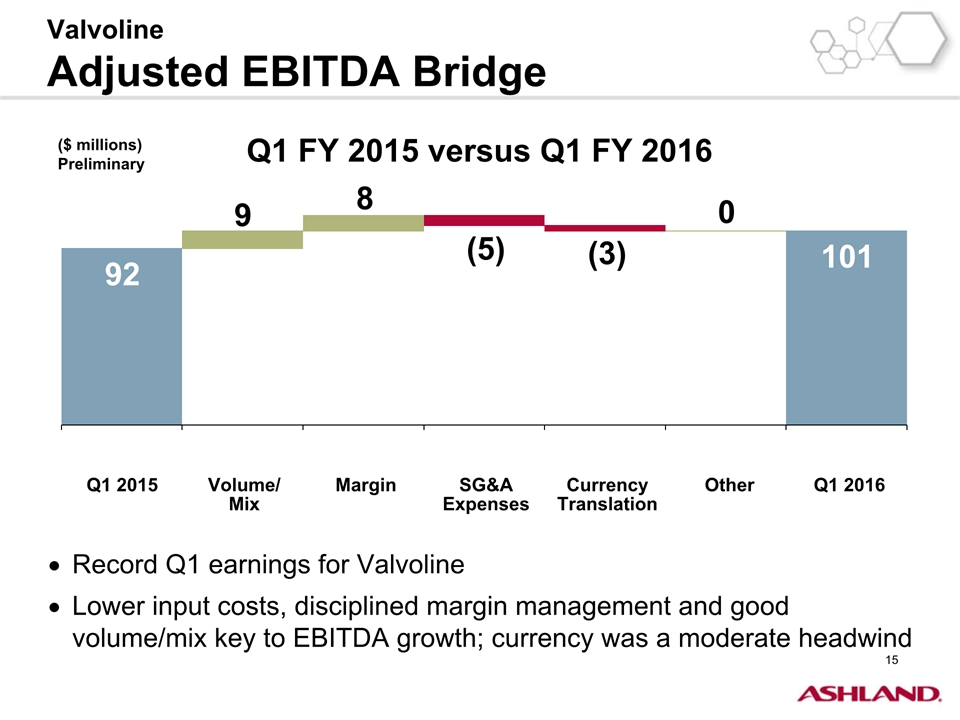
ValvolineAdjusted EBITDA Bridge Q1 2015 Volume/ Mix Q1 2016 Currency Translation Margin SG&AExpenses Q1 FY 2015 versus Q1 FY 2016 Other ($ millions)Preliminary 8 (3) 0 (5) 101 92 9 Record Q1 earnings for ValvolineLower input costs, disciplined margin management and good volume/mix key to EBITDA growth; currency was a moderate headwind

Appendix B: Volume Trends and Liquidity and Net Debt
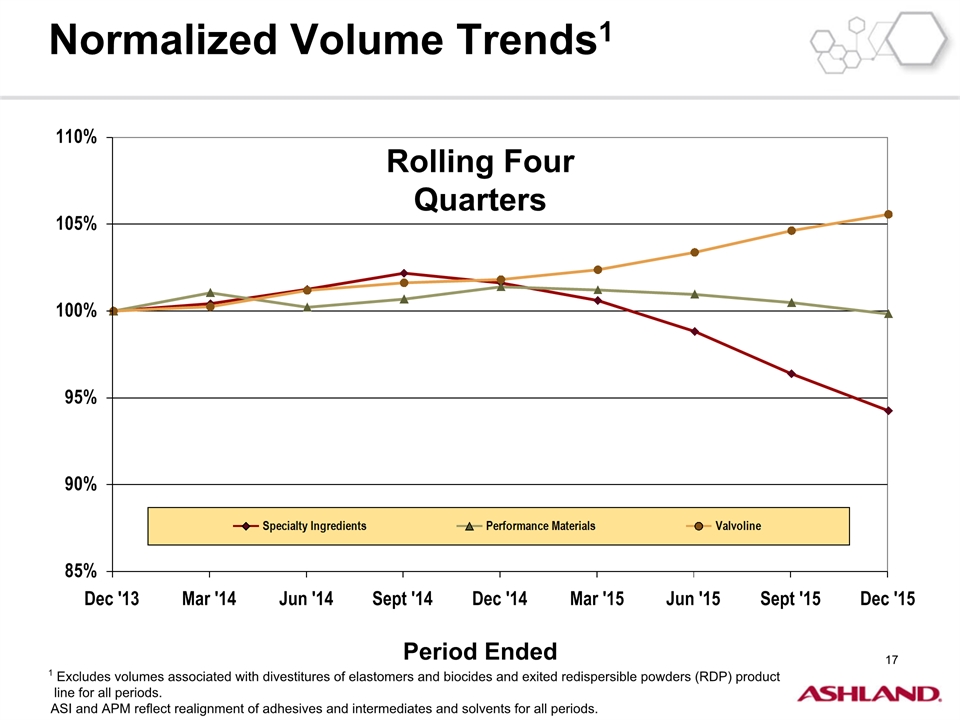
Normalized Volume Trends1 Period Ended 1 Excludes volumes associated with divestitures of elastomers and biocides and exited redispersible powders (RDP) product line for all periods. ASI and APM reflect realignment of adhesives and intermediates and solvents for all periods. Rolling Four Quarters 2 2
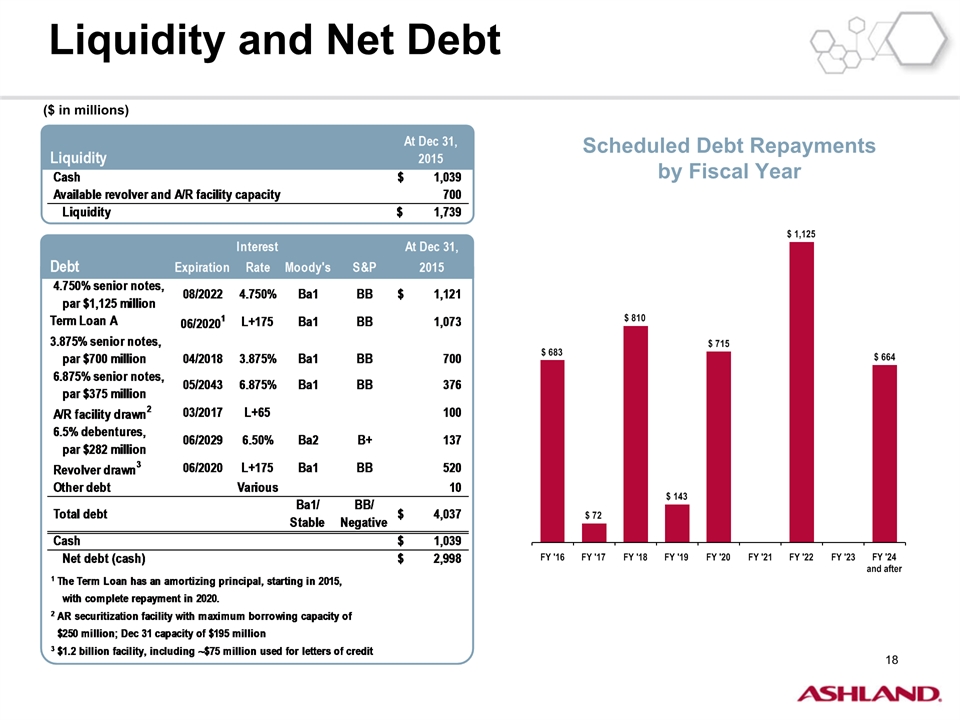
Liquidity and Net Debt ($ in millions) Scheduled Debt Repaymentsby Fiscal Year

Appendix C:Business Profiles 12 Months Ended December 31, 2015
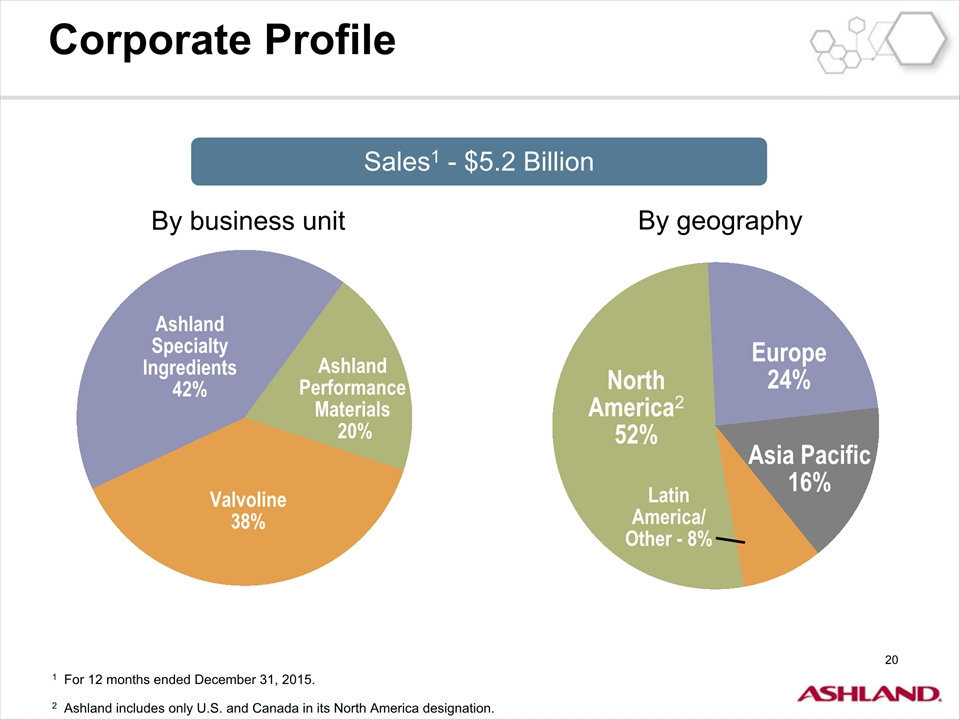
Corporate Profile By business unit By geography 1 For 12 months ended December 31, 2015.2 Ashland includes only U.S. and Canada in its North America designation. North America252% Asia Pacific16% LatinAmerica/Other - 8% Europe24% AshlandSpecialtyIngredients42% AshlandPerformanceMaterials 20% Valvoline38% Sales1 - $5.2 Billion
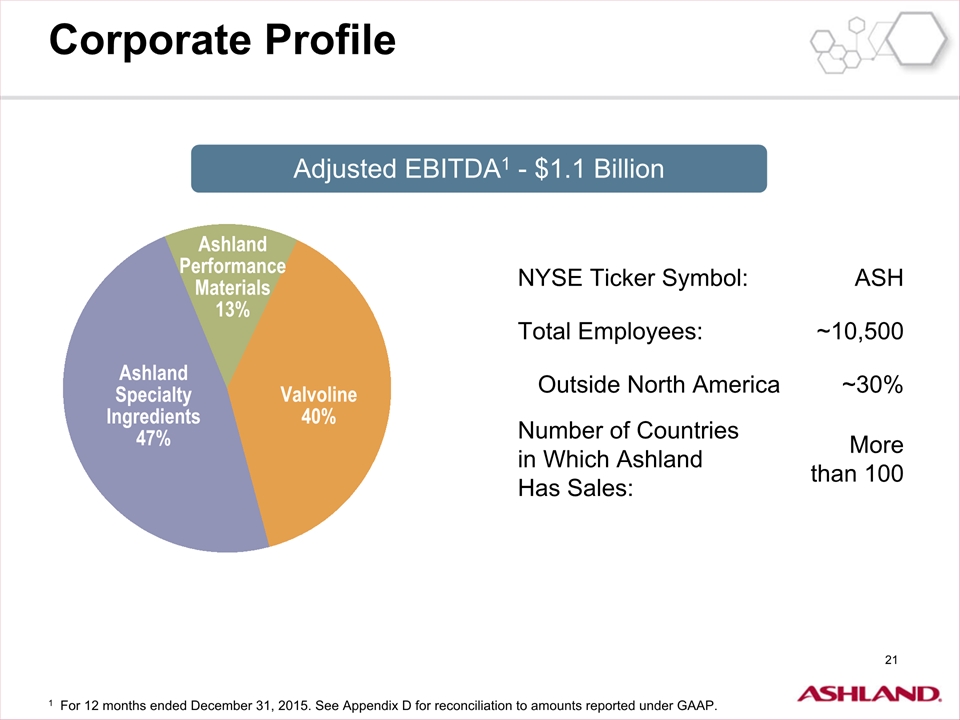
Corporate Profile 1 For 12 months ended December 31, 2015. See Appendix D for reconciliation to amounts reported under GAAP. NYSE Ticker Symbol: ASH Total Employees: ~10,500 Outside North America ~30% Number of Countries in Which Ashland Has Sales: More than 100 AshlandSpecialtyIngredients47% Valvoline40% Adjusted EBITDA1 - $1.1 Billion
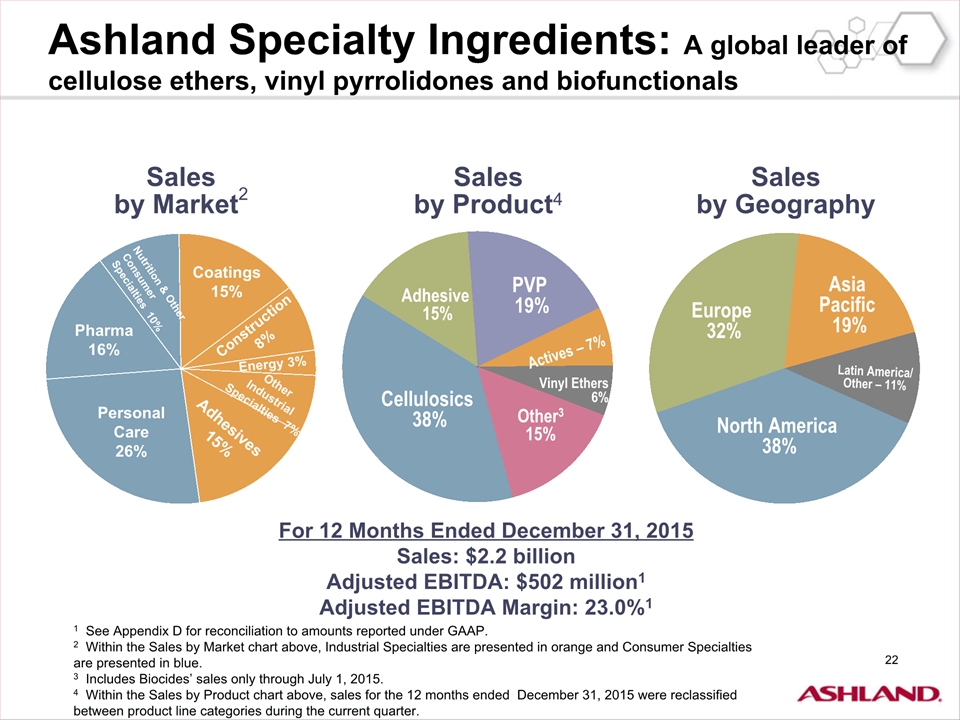
Salesby Market2 Ashland Specialty Ingredients: A global leader of cellulose ethers, vinyl pyrrolidones and biofunctionals For 12 Months Ended December 31, 2015Sales: $2.2 billionAdjusted EBITDA: $502 million1Adjusted EBITDA Margin: 23.0%1 Salesby Product4 Cellulosics 38% PVP 19% Adhesive 15% North America 38% AsiaPacific 19% Europe 32% Latin America/Other – 11% Actives – 7% Vinyl Ethers6% Salesby Geography 1 See Appendix D for reconciliation to amounts reported under GAAP.2 Within the Sales by Market chart above, Industrial Specialties are presented in orange and Consumer Specialties are presented in blue.3 Includes Biocides’ sales only through July 1, 2015.4 Within the Sales by Product chart above, sales for the 12 months ended December 31, 2015 were reclassified between product line categories during the current quarter.
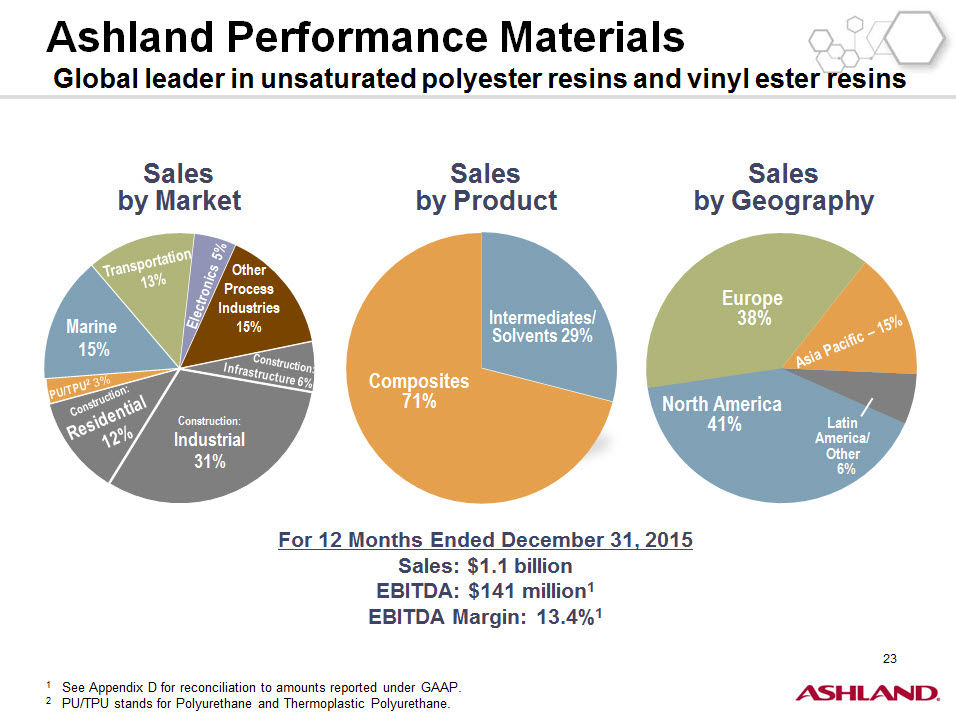
Ashland Performance Materials Global leader in unsaturated polyester resins and vinyl ester resins Salesby Geography For 12 Months Ended December 31, 2015Sales: $1.1 billionEBITDA: $141 million1EBITDA Margin: 13.4%1 Salesby Product Composites71% Intermediates/Solvents 29% Construction: Residential 12% Marine 15% Other Process Industries15% Construction:Industrial31% Salesby Market North America 41% Asia Pacific – 15% Europe 38% Latin America/Other 6% Transportation 13% Construction: Infrastructure 6% 1 See Appendix D for reconciliation to amounts reported under GAAP.2 PU/TPU stands for Polyurethane and Thermoplastic Polyurethane.

Valvoline: A leading worldwide producer and distributor of premium-branded lubricants and automotive chemicals International Salesby Region2 For 12 Months Ended December 31, 2015Sales: $1.9 billionAdjusted EBITDA: $420 million1Adjusted EBITDA Margin: 21.8%1 Salesby Product Lubricants87% Chemicals3 – 6% Do-It-Yourself 29% DIFM: Valvoline Instant Oil Change 20% DIFM: Installer Channel 22% Valvoline International29% Salesby Market Asia Pacificex Australia 37% Europe 23% Latin America/Other – 19% Antifreeze 5% Filters 2% Australia 21% 1 See Appendix D for reconciliation to amounts reported under GAAP.2 Includes nonconsolidated joint ventures.3 Includes car care products’ sales only through June 30, 2015.

Appendix D: Non-GAAP Reconciliation
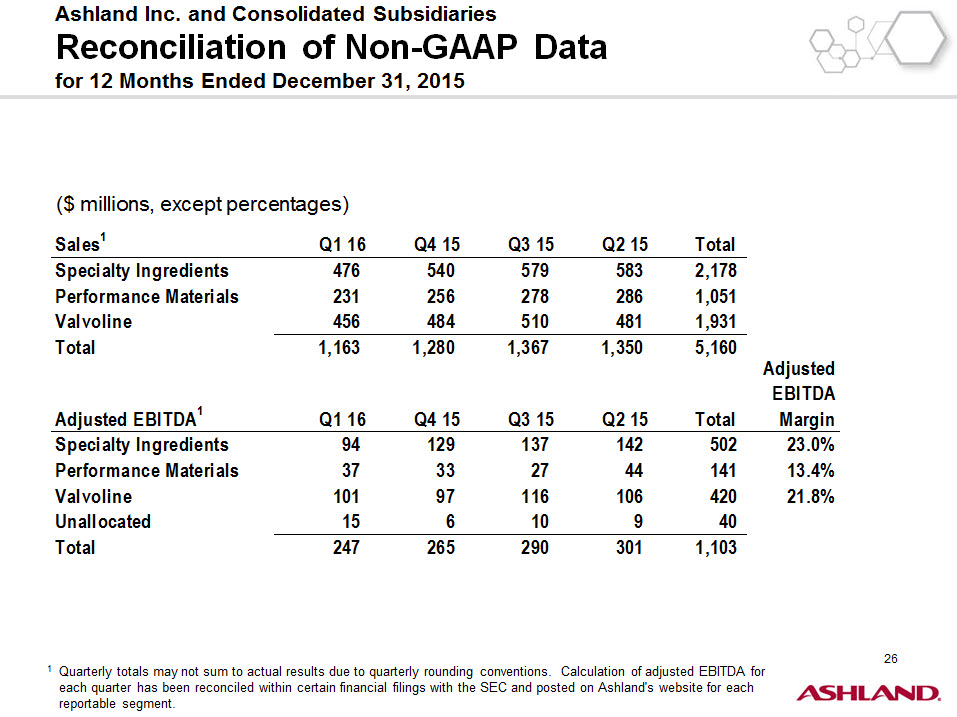
Ashland Inc. and Consolidated SubsidiariesReconciliation of Non-GAAP Data for 12 Months Ended December 31, 2015 1 Quarterly totals may not sum to actual results due to quarterly rounding conventions. Calculation of adjusted EBITDA for each quarter has been reconciled within certain financial filings with the SEC and posted on Ashland's website for each reportable segment.