UNITED STATES
SECURITIES AND EXCHANGE COMMISSION
Washington, D.C. 20549
FORM N-CSR
CERTIFIED SHAREHOLDER REPORT OF REGISTERED MANAGEMENT
INVESTMENT COMPANIES
Investment Company Act file number 811-21652
Fiduciary/Claymore MLP Opportunity Fund
(Exact name of registrant as specified in charter)
227 West Monroe Street, Chicago, IL 60606
(Address of principal executive offices) (Zip code)
Amy J. Lee
227 West Monroe Street, Chicago, IL 60606
(Name and address of agent for service)
Registrant's telephone number, including area code: (312) 827-0100
Date of fiscal year end: November 30
Date of reporting period: December 1, 2016 to May 31, 2017
Item 1. Reports to Stockholders.
The registrant's semi-annual report transmitted to shareholders pursuant to Rule 30e-1 under the Investment Company Act of 1940, as amended (the “Investment Company Act”), is as follows:
GUGGENHEIMINVESTMENTS.COM/FMO
...YOUR PATH TO THE LATEST, MOST UP-TO-DATE INFORMATION ABOUT THE FIDUCIARY/CLAYMORE MLP OPPORTUNITY FUND
The shareholder report you are reading right now is just the beginning of the story.
Online at guggenheiminvestments.com/fmo, you will find:
| · | Daily, weekly and monthly data on share prices, distributions, dividends and more |
| · | Portfolio overviews and performance analyses |
| · | Announcements, press releases and special notices |
| · | Fund and adviser contact information |
Advisory Research, Inc. and Guggenheim Funds Investment Advisors, LLC are constantly updating and expanding shareholder information services on the Fund’s website in an ongoing effort to provide you with the most current information about how your Fund’s assets are managed and the results of our efforts. It is just one more small way we are working to keep you better informed about your investment in the Fund.
DEAR SHAREHOLDER
We thank you for your investment in the Fiduciary/Claymore MLP Opportunity Fund (the “Fund”). This report covers the Fund’s performance for the semi-annual fiscal period ended May 31, 2017.
The Fund’s investment objective is to provide a high level of after-tax total return with an emphasis on current distributions paid to shareholders. The total return sought by the Fund includes appreciation in the net asset value of the Fund’s common shares and all distributions made by the Fund to its common shareholders, regardless of the tax characterization of such distributions. Under normal market conditions, the Fund invests at least 80% of its managed assets in master limited partnerships (“MLPs”) and affiliates of MLPs that own primary interests in an MLP.
All Fund returns cited—whether based on net asset value (“NAV”) or market price—assume the reinvestment of all distributions. For the six-month period ended May 31, 2017, the Fund provided a total return based on market price of 0.10% and a total return based on NAV of -1.65%. Past performance is not a guarantee of future results.
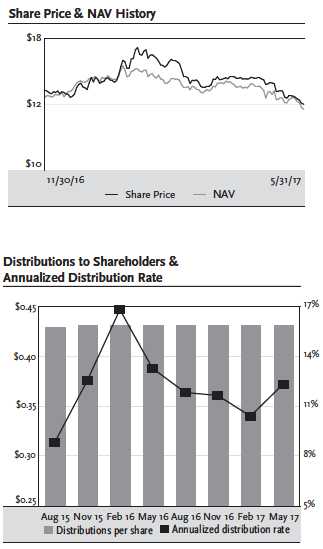
The closing price of the Fund’s shares as of May 31, 2017, was $14.00, representing a 2.26% premium to the NAV of $13.69. The closing price of the Fund’s shares as of November 30, 2016, was $14.82, representing a premium of 0.41% to the NAV of $14.76. The market value of the shares of closed-end funds fluctuates from time to time, and a fund’s market value may be higher or lower than its net asset value. The NAV return includes the deduction of management fees, operating expenses, and all other Fund expenses.
The Fund paid two quarterly distributions per common share during the period. Each distribution was $0.4308. The latest distribution represents an annualized distribution rate of 12.31% based on the Fund’s closing market price of $14.00 on May 31, 2017. Please see Note 2(c) on page 25 for more information on distributions for the period.
Guggenheim Funds Investment Advisors, LLC (“GFIA”) serves as the investment adviser to the Fund. GFIA is a subsidiary of Guggenheim Partners, LLC, a global diversified financial services firm with more than $260 billion in assets under management as of May 31, 2017.
Advisory Research, Inc. (“ARI”) is the Sub-Adviser of the Fund (“Sub-Adviser”) and a wholly-owned subsidiary of Piper Jaffray Companies.
Under the Fund’s Automatic Dividend Reinvestment Plan (the “Plan”), a shareholder whose Common Shares are registered in his or her own name will have all distributions reinvested automatically unless the shareholder elects to receive cash. Distributions with respect to Common Shares registered in the name of a broker-dealer or other nominee (that is, in “street name”) will be reinvested by the broker or nominee in additional Common Shares under the Plan, unless the service is not provided by the broker or nominee or the shareholder elects to receive distributions in cash. The Plan is described in detail on page 47 of this report. When shares trade at a discount to NAV, the Plan takes advantage of the discount by reinvesting the quarterly dividend distribution in common shares of the Fund purchased in the market at a price less than NAV. Conversely, when the market price of the Fund’s common shares is at a
FMO l FIDUCIARY/CLAYMORE MLP OPPORTUNITY FUND SEMIANNUAL REPORT l 3
| | |
(Unaudited) continued | May 31, 2017 |
premium above NAV, the Plan reinvests participants’ dividends in newly-issued common shares at the greater of NAV per share or 95% of the market price per share. The Plan provides a cost-effective means to accumulate additional shares and enjoy the benefits of compounding returns over time.
To learn more about the Fund’s performance and investment strategy, we encourage you to read the Questions & Answers section of this report, which begins on page 5 of this report. You’ll find information on ARI’s investment philosophy, its views on the economy and market environment, and detailed information about the factors that impacted the Fund’s performance.
We appreciate your investment and look forward to serving your investment needs in the future. For the most up-to-date information on your investment, please visit the Fund’s website at guggenheiminvestments.com/fmo.
Sincerely,
Donald C. Cacciapaglia
President and Chief Executive Officer
Fiduciary/Claymore MLP Opportunity Fund
June 30, 2017
4 l FMO l FIDUCIARY/CLAYMORE MLP OPPORTUNITY FUND SEMIANNUAL REPORT
| | |
QUESTIONS & ANSWERS (Unaudited) | May 31, 2017 |
The Fiduciary/Claymore MLP Opportunity Fund (the “Fund”) is managed by Advisory Research, Inc. (“ARI”), a wholly owned subsidiary of Piper Jaffray Companies. In the following interview, Portfolio Managers James J. Cunnane, Jr., CFA, and Quinn T. Kiley discuss the Fund’s performance for the semi-annual fiscal period ended May 31, 2017.
Describe the Fund’s objective and investment strategy.
The Fund’s investment objective is to provide a high level of after-tax total return with an emphasis on current distributions paid to shareholders. The total return sought by the Fund includes appreciation in the net asset value (“NAV”) of the Fund’s common shares and all distributions made by the Fund to its common shareholders, regardless of the tax characterization of such distributions. The Fund has been structured to seek to provide an efficient vehicle through which its shareholders may invest in a portfolio of primarily publicly traded securities of master limited partnerships (“MLPs”) and related entities. MLPs combine the tax benefits of limited partnerships with the liquidity of publicly traded securities.
The Fund anticipates that a significant portion of the distributions received by the Fund from the MLPs in which it invests will consist of return of capital. If this expectation is not realized, the Fund will have a larger corporate income tax expense sooner than expected, which will result in less cash available to distribute to common shareholders. Moreover, although MLP distributions that are treated as returns of capital are generally not taxable to the Fund to that extent, returns of capital reduce the Fund’s tax basis in its investments, resulting in potential increased gains (or decreased losses) upon dispositions of the investments. While the Fund will generally seek to maximize the portion of the Fund’s distribution to common shareholders that will consist of return of capital, no assurance can be given in this regard.
Under normal market conditions, the Fund invests at least 80% of its managed assets in MLPs and affiliates of MLPs that own primary interests in an MLP (collectively “MLP entities”) and at least 65% in equity securities of MLP entities. A substantial portion of the MLP entities in which the Fund invests are engaged primarily in the energy, natural resources and real estate sectors of the economy. The Fund may invest up to 40% of its managed assets in unregistered or otherwise restricted securities, including up to 20% of its managed assets in securities issued by non-public companies. The Fund may invest a total of up to 25% of its managed assets in debt securities of MLP entities and non-MLP entity issuers, including securities rated below investment grade. The Fund may also invest in common stock of large capitalization companies, including companies engaged primarily in such sectors. To seek to generate current gains, the Fund may employ an option strategy of writing (selling) covered call options on common stocks held in the Fund’s portfolio.
The Fund is authorized to implement hedging strategies. ARI, on behalf of the Fund, may determine from time to time whether and when to implement hedging strategies. In particular, ARI may seek to protect the Fund against significant drops in market prices of MLPs when valuation models indicate
FMO l FIDUCIARY/CLAYMORE MLP OPPORTUNITY FUND SEMIANNUAL REPORT l 5
| | |
QUESTIONS & ANSWERS (Unaudited) continued | May 31, 2017 |
that the MLP asset class may be overvalued, after considering the cost of hedging. In such circumstances, the Fund may implement hedging techniques such as purchasing put options on a portion of its portfolio. This strategy may enable the Fund to participate in potential price appreciation while providing some protection against falling prices, although it will also cause the Fund to incur the expense of acquiring the put options. There were no hedging strategies in place as of May 31, 2017.
Discuss changes to the Fund’s use of leverage during the period.
The Board of Trustees of the Fund approved the use of leverage through reverse repurchase agreements at its February 2016 Board meeting. Previously, the Fund was permitted to utilize leverage through the issuance of preferred shares, through borrowing or the issuance of commercial paper or other forms of debt. At period end, the Fund was using leverage exclusively through a line of credit with BNP Paribas. As of May 31, 2017, the Fund had $183 million outstanding in connection with the line of credit and pays interest on the amount borrowed at a rate of 3-month LIBOR plus 95 basis points (2.13%, as of May 31, 2017).
The Fund’s leverage has typically ranged from 22% to 28%. As of May 31, 2017, the Fund’s leverage of $183 million was 27.9% of managed assets, which represented an asset coverage ratio of 358%, which is above the 300% required by the Investment Company Act of 1940, as amended (the “1940 Act”).
Leverage had a negative impact performance for the six months ended May 31, 2017.
ARI intends to use leverage through reverse repurchase agreements for a portion of the Fund’s leverage financing to provide increased leverage flexibility to take advantage of investment opportunities, subject to the leverage limitations imposed by the 1940 Act. With this added flexibility, it is anticipated that the Fund’s leverage may increase opportunistically to a range of approximately 30% to 38% of managed assets, based upon market conditions. Initially, ARI anticipates the targeted range will be approximately 34%.
The purpose of leverage is to fund the purchase of additional securities that provide increased distributions and potentially greater appreciation to common shareholders than could be achieved from an unlevered portfolio. Of course, leverage results in greater NAV volatility and may entail more downside risk than an unlevered portfolio.
Reverse repurchase agreements involve the risks that the total return earned on the investment of the proceeds will be less than the interest expense and Fund expenses associated with the repurchase agreement, that the market value of the securities sold by the Fund may decline below the price at which the Fund is obligated to repurchase such securities and that the securities may not be returned to the Fund.
6 l FMO l FIDUCIARY/CLAYMORE MLP OPPORTUNITY FUND SEMIANNUAL REPORT
| | |
QUESTIONS & ANSWERS (Unaudited) continued | May 31, 2017 |
How would you describe the master limited partnership market over the six-month period ended May 31, 2017?
For the six months ended May 31, 2017, MLPs, as measured by the Alerian MLP Index (the “Index”), returned 2.28%, compared with a return of 10.81% for the Standard & Poor’s (“S&P”) 500 Index, which is generally regarded as a good indicator of the broad U.S. stock market.
The 2017 fiscal year began with domestic election results that appeared positive for the energy space and a tail-wind of the Organization for Petroleum Exporting Countries (OPEC) announcement that they will cut production in 2017. The post-election/OPEC euphoria lasted into March, but as the administration’s agenda was delayed and doubts crept in as to whether the OPEC cuts would persist, energy rolled over once again. Although crude oil prices are lower by only 2.3% for the period, there was a more significant decline in the last three months, much to the dismay of already weary energy investors. The result is that by ARI’s measure, MLPs are once again undervalued and look especially attractive compared to many other listed asset classes that are trading at or near all-time highs.
How did the Fund perform in this market environment?
All Fund returns cited—whether based on NAV or market price—assume the reinvestment of all distributions. For the six-month period ended May 31, 2017, the Fund provided a total return based on market price of 0.10% and a total return based on NAV of -1.65%. Past performance is not a guarantee of future results.
The closing price of the Fund’s shares as of May 31, 2017, was $14.00, representing a 2.26% premium to the NAV of $13.69. The closing price of the Fund’s shares as of November 30, 2016, was $14.82, representing a premium of 0.41% to the NAV of $14.76. The market value of the shares of closed-end funds fluctuates from time to time, and a fund’s market value may be higher or lower than its net asset value. NAV return includes the deduction of management fees, operating expenses, and all other Fund expenses.
It is important to remember that the Fund is a taxable entity—meaning it recognizes either a deferred tax liability on realized and unrealized portfolio gains or a deferred tax benefit on realized and unrealized portfolio losses. This accounting treatment of the tax impact of gains and losses in the portfolio is intended to ensure that the Fund’s NAV reflects the net after-tax value of the Fund’s portfolio. As of May 31, 2017, the Fund’s NAV included a net deferred tax liability of $94.9 million, or $2.75 per share.
FMO l FIDUCIARY/CLAYMORE MLP OPPORTUNITY FUND SEMIANNUAL REPORT l 7
| | |
QUESTIONS & ANSWERS (Unaudited) continued | May 31, 2017 |
Please tell us about the Fund’s distributions.
The Fund paid two quarterly distributions per common share during the period. Each distribution was $0.4308. The latest distribution represents an annualized distribution rate of 12.31% based on the Fund’s closing market price of $14.00 on May 31, 2017. This level of quarterly distribution is the same as the distribution from one year ago.
As of May 31, 2017, the Fund had distributed $18.25891 per common share to its shareholders since the Fund’s inception in 2004. Approximately $10.83203 per common share or 59% of these distributions were considered non-dividend distributions, also known as return of capital, and $7.42688 per common share or 41% of these distributions were considered ordinary dividends for U.S. federal income tax purposes. For 2017 distributions, the Fund is unable to make final determinations as to the tax character of the distributions to shareholders until after the end of the calendar year.
The Fund, ARI and Guggenheim Funds Investment Advisors, LLC do not provide tax advice. Investors should consult their tax advisor for further information.
How was the Fund’s portfolio positioned during the six-month period ended May 31, 2017, and what has that meant for performance?
The Fund was fully invested, levered, and unhedged in the six-month reporting period. As discussed in the Fund’s annual report for the period ended November 30, 2016, the Fund’s portfolio benefitted in 2016 from a series of trades buying a higher yielding, lower growth portfolio. This positioning worked in 2016, but reversed in the reporting period as growth outperformed since the Fund’s fiscal year-end. Due to the large size of the Fund, risk is partly managed by diversifying its holdings across market capitalization. The diversification, compared to the Index, was not additive during the period as the largest MLP in the Index had positive performance but was only a small position in the Fund’s portfolio.
The Fund’s portfolio performance, prior to the impact of leverage and taxes, underperformed the Index for the six months ended May 31, 2017. For the one year period as of the same date, the Fund’s portfolio outperformed the Index. The Fund continues to be invested primarily in midstream energy infrastructure, which includes various subsectors such as those related to moving crude oil and natural gas from the wellhead to the refineries and processors and then to market.
The Fund did not participate in any initial public offerings of an MLP for the six month period ended May 31, 2017, although the IPO market for MLPs is open and three transactions occurred.
What were some of the leading contributors to and detractors from performance?
The contributors and detractors to the Fund’s performance were a mirror image of the prior year. Exposure to higher yielding securities contributed to relative underperformance as higher growth names outperformed. From a sector perspective, large exposure to natural gas oriented infrastructure added to performance as these entities continue to see positive growth in both supply and demand, a good story for midstream assets.
8 l FMO l FIDUCIARY/CLAYMORE MLP OPPORTUNITY FUND SEMIANNUAL REPORT
| | |
QUESTIONS & ANSWERS (Unaudited) continued | May 31, 2017 |
What is the current outlook for the MLP market?
Although crude oil prices were only slightly negative, they were volatile during the full reporting period. Prices rose into OPEC’s May meeting, but quickly fell upon the announcement that the current production cut would be extended for nine more months. Despite continued and improving fundamentals, each new piece of positive news in the energy space is met with disappointment. In such an environment, energy equities are finding it difficult to catch a bid and build some momentum into what is likely to be an improving fundamental story as the year progresses. ARI believes prices are attractive and the recent correction in MLPs presents a buying opportunity. MLPs remain well off their highs, unlike many other asset classes; and with many high yielding MLPs that survived the worst of the energy downturn, investors may be attracted to the asset class as those high payouts are confirmed in coming distribution and earnings announcements. Longer-term investors should be rewarded for buying today, but there should be an expectation of volatility as the global crude oil market continues to seek balance.
Index Definitions:
Indices are unmanaged and it is not possible to invest directly in an index.
The Alerian MLP Index is a composite of the 50 most prominent energy Master Limited Partnerships (MLPs) and is calculated by Alerian using a float-adjusted, capitalization-weighted methodology.
S&P 500 Index is a capitalization-weighted index of 500 stocks. The index is designed to measure performance of the broad domestic economy through changes in the aggregate market value of 500 stocks representing all major industries.
Risks and Other Considerations
Investing involves risk, including the possible loss of principal and fluctuation of value.
The views expressed in this report reflect those of the portfolio managers only through the report period as stated on the cover. These views are expressed for informational purposes only and are subject to change at any time, based on market and other conditions, and may not come to pass. These views may differ from views of other investment professionals at Guggenheim and should not be construed as research, investment advice or a recommendation of any kind regarding the fund or any issuer or security, do not constitute a solicitation to buy or sell any security and should not be considered specific legal, investment or tax advice. The information provided does not take into account the specific objectives, financial situation or particular needs of any specific investor.
The views expressed in this report may also include forward looking statements that involve risk and uncertainty, and there is no guarantee that any predictions will come to pass. Actual results or events may differ materially from those projected, estimated, assumed or anticipated in any such forward-looking statements. Important factors that could result in such differences, in addition to the other factors noted with such forward-looking statements, include general economic conditions such as inflation, recession and interest rates.
FMO l FIDUCIARY/CLAYMORE MLP OPPORTUNITY FUND SEMIANNUAL REPORT l 9
| | |
QUESTIONS & ANSWERS (Unaudited) continued | May 31, 2017 |
There can be no assurance that the Fund will achieve its investment objectives or that any investment strategies or techniques discussed herein will be effective. The value of the Fund will fluctuate with the value of the underlying securities. Historically, closed-end funds often trade at a discount to their net asset value.
Performance data quoted represents past performance, which is no guarantee of future results and current performance may be lower or higher than the figures shown.
Please see guggenheiminvestments.com/fmo for a detailed discussion of the Fund’s risks and other considerations.
This material is not intended as a recommendation or as investment advice of any kind, including in connection with rollovers, transfers, and distributions. Such material is not provided in a fiduciary capacity, may not be relied upon for or in connection with the making of investment decisions, and does not constitute a solicitation of an offer to buy or sell securities. All content has been provided for informational or educational purposes only and is not intended to be and should not be construed as legal or tax advice and/or a legal opinion. Always consult a financial, tax and/or legal professional regarding your specific situation.
10 l FMO l FIDUCIARY/CLAYMORE MLP OPPORTUNITY FUND SEMIANNUAL REPORT
| | |
FUND SUMMARY (Unaudited) | May 31, 2017 |
| | |
Fund Statistics | |
| Share Price | $14.00 |
| Net Asset Value | $13.69 |
| Premium to NAV | 2.26% |
| Net Assets ($000) | $473,074 |
| | | | | | |
AVERAGE ANNUAL TOTAL RETURNS FOR THE | | | |
PERIOD ENDED MAY 31, 2017 | | | | | |
| | Six Month | | | | |
| | (non- | One | Three | Five | |
| | annualized) | Year | Year | Year | 10 Year |
| Fiduciary/Claymore MLP | | | | | |
| Opportunity Fund | | | | | |
| NAV | -1.65% | 7.50% | -11.85% | 1.80% | 1.73% |
| Market | 0.10% | 20.92% | -11.28% | 0.71% | 2.42% |
Performance data quoted represents past performance, which is no guarantee of future results and current performance may be lower or higher than the figures shown. All NAV returns include the deduction of management fees, operating expenses and all other Fund expenses. The deduction of taxes that a shareholder would pay on Fund distributions or the redemption of Fund shares is not reflected in the total returns. For the most recent month-end performance figures, please visit guggenheiminvestments.com/fmo. The investment return and principal value of an investment will fluctuate with changes in market conditions and other factors so that an investor’s shares, when redeemed, may be worth more or less than their original cost.
FMO l FIDUCIARY/CLAYMORE MLP OPPORTUNITY FUND SEMIANNUAL REPORT l 11
| | |
FUND SUMMARY (Unaudited) continued | May 31, 2017 |
| | |
Portfolio Breakdown | % of Net Assets |
| Midstream Oil | 45.2% |
| Diversified Infrastructure | 39.6% |
| Gathering & Processing | 27.5% |
| Midstream Natural Gas | 26.9% |
| Marine Transportation | 8.6% |
| Natural Gas Pipelines & Storage | 7.5% |
| Other Energy Infrastructure | 2.6% |
| Total Investments | 157.9% |
| Short Term Investments | 0.7% |
| Term Loan | 0.0%* |
Total Investments | 158.6% |
Other Assets & Liabilities, net | -58.6% |
Net Assets | 100.0% |
*Less than 0.05%
Portfolio breakdown is subject to change daily. For more information, please visit guggenheiminvestments.com/fmo. The above summary is provided for informational purposes only and should not be viewed as recommendations. Past performance does not guarantee future results.
12 l FMO l FIDUCIARY/CLAYMORE MLP OPPORTUNITY FUND SEMIANNUAL REPORT
| | |
FUND SUMMARY (Unaudited) continued | May 31, 2017 |
All or a portion of the above distributions may be characterized as a return of capital. For the year ended November 30, 2016, 100% of the distributions were characterized as return of capital. For the six-months ended May 31, 2017, 100% of the distributions were estimated to be characterized as return of capital. The final determination of the tax character of the distributions paid by the Fund in 2017 will be reported to shareholders in January 2018.
FMO l FIDUCIARY/CLAYMORE MLP OPPORTUNITY FUND SEMIANNUAL REPORT l 13
| | |
SCHEDULE OF INVESTMENTS (Unaudited) | May 31, 2017 |
| | | |
| | Shares | Value |
COMMON STOCKS† – 1.9% | | |
Gathering & Processing – 1.6% | | |
| Targa Resources Corp. | 165,950 | $ 7,622,084 |
Midstream Oil – 0.3% | | |
SemGroup Corp.1 | 45,423 | 1,408,113 |
Total Common Stocks | | |
| (Cost $9,348,301) | | 9,030,197 |
MASTER LIMITED PARTNERSHIPS AND RELATED ENTITIES† – 156.0% | | |
Midstream Oil – 44.9% | | |
Magellan Midstream Partners, LP1 | 774,827 | 56,244,691 |
Plains All American Pipeline, LP1 | 1,499,132 | 39,697,015 |
Buckeye Partners, LP1 | 615,996 | 39,423,744 |
Genesis Energy, LP1 | 738,150 | 23,022,899 |
| Plains GP Holdings, LP | 850,000 | 22,669,500 |
Delek Logistics Partners, LP1 | 390,285 | 11,825,635 |
USD Partners, LP1 | 568,625 | 7,676,438 |
NGL Energy Partners, LP1 | 404,810 | 5,505,416 |
World Point Terminals, LP1 | 168,065 | 2,873,912 |
| NuStar Energy, LP | 47,335 | 2,157,529 |
PBF Logistics, LP1 | 77,085 | 1,510,866 |
Total Midstream Oil | | 212,607,645 |
Diversified Infrastructure – 39.6% | | |
Energy Transfer Partners, LP1 | 2,752,466 | 59,893,650 |
Enbridge Energy Partners, LP1 | 2,038,990 | 33,765,674 |
MPLX, LP1 | 876,899 | 28,981,513 |
Tesoro Logistics, LP1 | 543,530 | 28,796,219 |
Enterprise Products Partners, LP1 | 816,369 | 21,886,853 |
Enbridge Energy Management LLC*,1,2 | 878,712 | 14,129,688 |
Total Diversified Infrastructure | | 187,453,597 |
Midstream Natural Gas – 26.9% | | |
Williams Partners, LP1 | 1,759,451 | 68,917,696 |
Tallgrass Energy Partners, LP1 | 534,995 | 26,535,752 |
Enable Midstream Partners, LP1 | 1,332,415 | 20,559,163 |
ONEOK Partners, LP1 | 232,060 | 11,350,055 |
Total Midstream Natural Gas | | 127,362,666 |
Gathering & Processing – 25.9% | | |
DCP Midstream, LP1 | 1,811,804 | 61,202,739 |
EnLink Midstream Partners, LP1 | 2,118,335 | 35,948,145 |
Summit Midstream Partners, LP1 | 809,021 | 18,688,385 |
See notes to financial statements.
14 l FMO l FIDUCIARY/CLAYMORE MLP OPPORTUNITY FUND SEMIANNUAL REPORT
| | |
SCHEDULE OF INVESTMENTS (Unaudited) continued | May 31, 2017 |
| | | |
| | Shares | Value |
MASTER LIMITED PARTNERSHIPS AND RELATED ENTITIES† – 156.0% (continued) | | |
Gathering & Processing – 25.9% (continued) | | |
| American Midstream Partners, LP | 349,526 | $ 4,211,788 |
| Noble Midstream Partners, LP | 50,000 | 2,299,500 |
Total Gathering & Processing | | 122,350,557 |
Marine Transportation – 8.6% | | |
KNOT Offshore Partners, LP1 | 612,535 | 12,985,742 |
Teekay Offshore Partners, LP1 | 3,397,582 | 10,634,432 |
Golar LNG Partners, LP1 | 429,700 | 8,490,872 |
Navios Maritime Midstream Partners, LP1 | 720,620 | 7,422,386 |
Teekay LNG Partners, LP1 | 80,000 | 1,216,000 |
Total Marine Transportation | | 40,749,432 |
Natural Gas Pipelines & Storage – 7.5% | | |
TC PipeLines, LP1 | 626,740 | 35,266,660 |
Other Energy Infrastructure – 2.6% | | |
Archrock Partners, LP1 | 523,595 | 8,110,487 |
| Sunoco, LP | 133,015 | 3,966,507 |
Total Other Energy Infrastructure | | 12,076,994 |
Total Master Limited Partnerships and Related Entities | | |
| (Cost $452,510,063) | | 737,867,551 |
SHORT TERM INVESTMENTS† – 0.7% | | |
| Dreyfus Treasury Prime Cash Management – Investor Shares | | |
0.01%3 | 3,362,098 | 3,362,098 |
Total Short Term Investments | | |
| (Cost $3,362,098) | | 3,362,098 |
| | Face | |
| | Amount | Value |
TERM LOAN†† – 0.0%** | | |
| Clearwater Subordinated Note NR | | |
4.75% due 12/31/204,5,6 | $413,329 | $ 4,133 |
Total Term Loan | | |
| (Cost $391,132) | | 4,133 |
Total Investments – 158.6% | | |
| (Cost $465,611,594) | | $ 750,263,979 |
Other Assets & Liabilities, net – (58.6)% | | (277,190,314) |
Total Net Assets – 100.0% | | $ 473,073,665 |
See notes to financial statements.
FMO l FIDUCIARY/CLAYMORE MLP OPPORTUNITY FUND SEMIANNUAL REPORT l 15
| | |
SCHEDULE OF INVESTMENTS (Unaudited) continued | May 31, 2017 |
| * | Non-income producing security. |
| ** | Less than 0.05% |
| † | Value determined based on Level 1 inputs — See Note 4. |
| †† | Value determined based on Level 2 inputs — See Note 4. |
| 1 | All or a portion of these securities have been physically segregated and pledged as collateral. As of May 31, 2017, the total amount segregated was $623,126,771, of which $623,126,771 is related to the outstanding line of credit. |
| 2 | While non-income producing, security makes regular in-kind distributions. |
| 3 | Rate indicated is the 7-day yield as of May 31, 2017. |
| 4 | Security was fair valued by the Valuation Committee at May 31, 2017. The total market value of fair valued securities amounts to $4,133, (cost $391,132) or less than 0.05% of total net assets. |
| 5 | Company has filed for protection in federal bankruptcy court. |
| 6 | Security is restricted and may be resold only in transactions exempt from registration, normally to qualified institutional buyers. These securities are considered illiquid and restricted under guidelines established by the Board of Trustees. At May 31, 2017, restricted securities aggregate market value amount to $4,133, or less than 0.05% of total net assets — see Note 10. |
The following table summarizes inputs used to value the Fund’s investments at May 31, 2017 (See Note 4 in the Notes to Financial Statements):
| | | | | | | | | | | | | |
| | | | | | Level 2 | | | Level 3 | | | | |
| | | | | | Significant | | | Significant | | | | |
| | | Level 1 | | | Observable | | | Unobservable | | | | |
| | | Quoted Prices | | | Inputs | | | Inputs | | | Total | |
Assets: | | | | | | | | | | | | |
| Common Stocks | | $ | 9,030,197 | | | $ | — | | | $ | — | | | $ | 9,030,197 | |
| Master Limited Partnerships | | | | | | | | | | | | | | | | |
| and Related Entities | | | 723,867,551 | | | | — | | | | — | | | | 723,867,551 | |
| Short Term Investments | | | 3,362,098 | | | | — | | | | — | | | | 3,362,098 | |
| Term Loan | | | — | | | | — | | | | 4,133 | | | | 4,133 | |
| Total Assets | | $ | 750,259,846 | | | $ | — | | | $ | 4,133 | | | $ | 750,263,979 | |
If not referenced in the table, please refer to the Schedule of Investments.
The following is a summary of the significant unobservable inputs used in the fair valuation of assets and liabilities categorized within the Level 3 of the fair value hierarchy:
| | Ending Balance at | Valuation | Unobservable |
Category | 5/31/17 | Technique | Inputs |
| Term Loan | $4,133 | Cash flow model | Royalties on coal produced |
Significant changes in royalties on coal produced would generally result in significant changes in the fair value of the security.
Transfers between investment levels may occur as the markets fluctuate and/or the availability of data used in an investment’s valuation changes. Transfers between valuation levels, if any, are in comparison to the valuation levels at the end of the previous fiscal year, and are effective using the fair value as of the end of the current fiscal period.
For the period ended May 31, 2017, there were no transfers between levels.
See notes to financial statements.
16 l FMO l FIDUCIARY/CLAYMORE MLP OPPORTUNITY FUND SEMIANNUAL REPORT
| | |
SCHEDULE OF INVESTMENTS (Unaudited) continued | May 31, 2017 |
Summary of Fair Value of Level 3 Activity
Following is a reconciliation of Level 3 assets for which significant unobservable inputs were used to determine fair value for the period ended May 31, 2017:
| | |
LEVEL 3 – Fair Value measurement using significant unobservable inputs | |
| Assets: | |
| Beginning Balance | $4,133 |
| Purchases | — |
| Sales | — |
| Total change in unrealized gains or losses included in earnings | — |
| Transfers into Level 3 | — |
| Transfers out of Level 3 | — |
| Ending Balance | $4,133 |
| Net change in unrealized appreciation (depreciation) for investments in securities | |
| still held at May 31, 2017 | $ — |
FMO l FIDUCIARY/CLAYMORE MLP OPPORTUNITY FUND SEMIANNUAL REPORT l 17
| | |
STATEMENT OF ASSETS AND LIABILITIES (Unaudited) | May 31, 2017 |
| | | | |
ASSETS: | | | |
| Investments in securities, at value (cost $465,611,594) | | $ | 750,263,979 | |
| Current tax receivable | | | 4,024,645 | |
| Investments sold receivable | | | 4,427,852 | |
| Receivable for fund shares issued through dividend reinvestment | | | 1,170,088 | |
| Prepaid expenses | | | 734 | |
Total assets | | | 759,887,298 | |
LIABILITIES | | | | |
| Borrowings | | | 183,000,000 | |
| Interest due on borrowings | | | 22,193 | |
| Payable for: | | | | |
| Net deferred tax | | | 94,888,262 | |
| Investments purchased | | | 7,893,289 | |
| Investment advisory fees | | | 570,781 | |
| Offering costs | | | 216,651 | |
| Other fees and expenses | | | 222,457 | |
Total liabilities | | | 286,813,633 | |
Net Assets | | $ | 473,073,665 | |
NET ASSETS CONSIST OF: | | | | |
| Common shares, $.01 par value per share; unlimited number of shares authorized, | | | | |
| 34,560,737 shares issued and outstanding | | | 345,607 | |
| Additional paid-in capital | | | 223,413,717 | |
| Accumulated net investment loss, net of tax benefit (expense) | | | (70,146,159 | ) |
| Accumulated net realized gain on investments, net of tax | | | 145,350,156 | |
| Net unrealized appreciation on investments, net of tax | | | 174,110,344 | |
NET ASSETS | | $ | 473,073,665 | |
| Shares outstanding ($0.01 par value with unlimited amount authorized) | | | 34,560,737 | |
| Net Asset Value | | $ | 13.69 | |
See notes to financial statements.
18 l FMO l FIDUCIARY/CLAYMORE MLP OPPORTUNITY FUND SEMIANNUAL REPORT
| | |
STATEMENT OF OPERATIONS | May 31, 2017 |
| For the period ended May 31, 2017 (Unaudited) | |
INVESTMENT INCOME: | | |
| Distributions from master limited partnerships | $ 30,632,079 | |
| Less: Return of capital distributions | (25,934,764) | |
| Less: Distributions classified as realized gains | (2,382,658) | |
| Total investment income | $ 2,314,657 |
EXPENSES | | |
| Investment advisory fees | 3,469,480 | |
| Interest expense | 1,885,398 | |
| Professional fees | 185,626 | |
| Administration fees | 71,987 | |
| Trustees’ fees and expenses* | 67,794 | |
| Fund accounting fees | 62,208 | |
| Printing fees | 40,271 | |
| Registration and filings | 16,744 | |
| Custodian fees | 9,920 | |
| Transfer agent fees | 8,898 | |
| Insurance | 8,367 | |
| Other fees | 623 | |
| Total expenses | | 5,827,316 |
| Advisory fees waived | | (12,610) |
| Net expenses | | 5,814,706 |
Net investment loss before taxes | | (3,500,049) |
| Deferred tax benefit (expense) | | 1,330,447 |
| Net investment loss | | (2,169,602) |
REALIZED AND UNREALIZED GAIN/(LOSS) ON INVESTMENTS | | |
| Net realized gain (loss) on: | | |
| Investments before taxes | | 17,469,834 |
| Deferred tax benefit (expense) | | (6,640,675) |
| Net realized gain/(loss) on investments | | 10,829,159 |
| Net change in unrealized appreciation (depreciation) on: | | |
| Investments before taxes | | (27,122,686) |
| Deferred tax benefit (expense) | | 10,309,940 |
| Net unrealized appreciation (depreciation) on investments | | (16,812,746) |
| Net realized and unrealized loss on investments | | (5,983,587) |
Net Decrease in Net Assets Resulting from Operations | $ (8,153,189) |
| * Relates to Trustees not deemed “interested persons” within the meaning of Section 2(a)(19) of the 1940 Act. | |
See notes to financial statements.
FMO l FIDUCIARY/CLAYMORE MLP OPPORTUNITY FUND SEMIANNUAL REPORT l 19
| | |
STATEMENTS OF CHANGES IN NET ASSETS | May 31, 2017 |
| | | | | | | |
| | | For the | | | For the | |
| | | Period Ended | | | Year Ended | |
| | | May 31, 2017 | | | November 30, 2016 | |
INCREASE (DECREASE) IN NET ASSETS FROM OPERATIONS: | | | | | | |
| Net investment loss | | $ | (2,169,602 | ) | | $ | (4,759,552 | ) |
| Net realized gain (loss) on investments | | | 10,829,159 | | | | (18,902,543 | ) |
| Net change in unrealized appreciation (depreciation) | | | | | | | | |
| on investments | | | (16,812,746 | ) | | | 48,780,433 | |
| Net increase (decrease) in net assets resulting from operations | | | (8,153,189 | ) | | | 25,118,338 | |
DISTRIBUTIONS TO COMMON SHAREHOLDERS | | | | | | | | |
| Return of capital – See Note 2(c) | | | (29,288,573 | ) | | | (57,851,472 | ) |
SHAREHOLDER TRANSACTIONS: | | | | | | | | |
| Net proceeds from common shares issued through at-the- | | | | | | | | |
| market offerings | | | 11,419,466 | | | | — | |
| Shares issued through dividend reinvestment | | | 2,335,017 | | | | 1,171,729 | |
| Common share offering costs charged to paid-in capital | | | (69,558 | ) | | | — | |
| Net increase in net assets from share transactions | | | 13,684,925 | | | | 1,171,729 | |
| Total decrease in net assets | | | (23,756,837 | ) | | | (31,561,405 | ) |
NET ASSETS: | | | | | | | | |
| Beginning of period | | | 496,830,502 | | | | 528,391,907 | |
| End of period | | $ | 473,073,665 | | | $ | 496,830,502 | |
| Accumulated net investment loss, net of tax benefit, at | | | | | | | | |
| end of year | | $ | (70,146,159 | ) | | $ | (67,976,557 | ) |
See notes to financial statements.
20 l FMO l FIDUCIARY/CLAYMORE MLP OPPORTUNITY FUND SEMIANNUAL REPORT
| | |
STATEMENT OF CASH FLOWS | May 31, 2017 |
| For the Period Ended May 31, 2017 (Unaudited) | |
| | | | |
Cash Flows from Operating Activities: | | | |
| Net decrease in net assets resulting from operations | | $ | (8,153,189 | ) |
Adjustments to Reconcile Net Decrease in Net Assets Resulting from Operations to | | | | |
Net Cash Provided by Operating Activities: | | | | |
| Net change in unrealized (appreciation) depreciation on investments before taxes | | | 27,122,686 | |
| Net realized gain on investments before taxes | | | (17,469,834 | ) |
| Purchases of long-term investments | | | (51,123,223 | ) |
| Proceeds from sale of long-term investments | | | 40,662,653 | |
| Net proceeds from sale of short-term investments | | | 5,126,139 | |
| Return of capital distributions received from investee companies | | | 25,934,764 | |
| Distributions classified as realized gains from investee companies | | | 2,382,658 | |
| Increase in current tax receivable | | | (693,546 | ) |
| Decrease in investments sold receivable | | | 14,432,982 | |
| Increase in receivable for fund shares issued through dividend reinvestment | | | (1,170,088 | ) |
| Decrease in prepaid expenses | | | 8,367 | |
| Decrease in net deferred tax payable | | | (4,999,713 | ) |
| Decrease in due to custodian bank | | | (12,514,226 | ) |
| Increase in interest due on borrowings | | | 2,789 | |
| Decrease in investments purchased payable | | | (3,879,095 | ) |
| Increase in investment advisory fees payable | | | 23,865 | |
| Decrease in trustees’ fees and expenses payable | | | (3,607 | ) |
| Decrease in offering costs payable | | | (45,152 | ) |
| Decrease in other fees and expenses payable | | | (41,582 | ) |
| Net Cash Provided by Operating Activities | | $ | 15,603,648 | |
Cash Flows From Financing Activities: | | | | |
| Net proceeds from the issuance of common shares | | | 11,419,466 | |
| Distributions to common shareholders | | | (26,953,556 | ) |
| Offering costs in connection with the issuance of common shares | | | (69,558 | ) |
| Net Cash Used by Financing Activities | | | (15,603,648 | ) |
| Net change in cash | | | — | |
Cash at Beginning of Period | | | — | |
Cash at End of Period | | $ | — | |
Supplemental Disclosure of Cash Flow Information: Cash paid during the | | | | |
period for interest | | $ | 1,882,609 | |
Supplemental Disclosure of Cash Flow Information: Taxes paid during the period | | $ | 693,547 | |
Supplemental Disclosure of Non Cash Financing Activity: Dividend reinvestment | | $ | 2,335,017 | |
Supplemental Disclosure of Non Cash Financing Activity: In kind stock | | | | |
dividends received during the period | | $ | 689,632 | |
See notes to financial statements.
FMO l FIDUCIARY/CLAYMORE MLP OPPORTUNITY FUND SEMIANNUAL REPORT l 21
FINANCIAL HIGHLIGHTS | | May 31, 2017 |
| | | | | | | | | | | | | | | | | | | |
| | | For the | | | For the | | | For the | | | For the | | | For the | | | For the | |
| | | Period Ended | | | Year Ended | | | Year Ended | | | Year Ended | | | Year Ended | | | Year Ended | |
| | | May 31, 2017 | | | November 30, | | | November 30, | | | November 30, | | | November 30, | | | November 30, | |
| | | (unaudited) | | | 2016 | | | 2015 | | | 2014 | | | 2013 | | | 2012 | |
Per Share Data: | | | | | | | | | | | | | | | | | | |
| Net asset value, beginning of period | | $ | 14.76 | | | $ | 15.74 | | | $ | 26.73 | | | $ | 24.60 | | | $ | 20.96 | | | $ | 20.17 | |
| Income from investment operations | | | | | | | | | | | | | | | | | | | | | | | | |
Net investment loss (a)(b) | | | (0.06 | ) | | | (0.14 | ) | | | (0.11 | ) | | | (0.25 | ) | | | (0.25 | ) | | | (0.23 | ) |
Net gain (loss) on investments (realized and unrealized) (b) | | | (0.15 | ) | | | 0.88 | | | | (9.17 | ) | | | 4.06 | | | | 5.54 | | | | 2.53 | |
| Total from investment operations | | | (0.21 | ) | | | 0.74 | | | | (9.28 | ) | | | 3.81 | | | | 5.29 | | | | 2.30 | |
| Common shares’ offering expenses charged to paid-in capital | | | (0.00 | )* | | | (0.00 | ) | | | (0.00 | )* | | | (0.00 | )* | | | (0.02 | ) | | | (0.01 | ) |
| Less distributions from: | | | | | | | | | | | | | | | | | | | | | | | | |
Return of capital (c) | | | (0.86 | ) | | | (1.72 | ) | | | (1.71 | ) | | | (1.68 | ) | | | (1.63 | ) | | | (1.50 | ) |
| Net asset value, end of period | | $ | 13.69 | | | $ | 14.76 | | | $ | 15.74 | | | $ | 26.73 | | | $ | 24.60 | | | $ | 20.96 | |
| Market value, end of period | | $ | 14.00 | | | $ | 14.82 | | | $ | 13.76 | | | $ | 27.51 | | | $ | 25.11 | | | $ | 22.03 | |
Total Return (d) | | | | | | | | | | | | | | | | | | | | | | | | |
| Net asset value | | | -1.65 | % | | | 6.32 | % | | | -36.06 | % | | | 15.61 | % | | | 25.72 | % | | | 11.69 | % |
| Market value | | | 0.10 | % | | | 22.79 | % | | | -45.44 | % | | | 16.58 | % | | | 21.66 | % | | | 8.93 | % |
Ratios/Supplemental Data: | | | | | | | | | | | | | | | | | | | | | | | | |
| Net assets, end of period (thousands) | | $ | 473,074 | | | $ | 496,831 | | | $ | 528,392 | | | $ | 891,626 | | | $ | 800,228 | | | $ | 570,127 | |
| Ratios of net expenses to average net assets: | | | | | | | | | | | | | | | | | | | | | | | | |
| Including current and deferred income tax | | | 0.32 | %(g) | | | 5.05 | % | | | -23.57 | % | | | 10.58 | % | | | 13.09 | % | | | 9.98 | % |
Excluding current and deferred income tax(e) | | | 2.29 | %(g) | | | 2.27 | % | | | 2.01 | % | | | 1.79 | % | | | 1.77 | % | | | 1.99 | % |
| Ratios of net investment income (loss) to average net assets: | | | | | | | | | | | | | | | | | | | | | | | | |
| Including current and deferred income tax | | | 0.59 | %(g) | | | -4.34 | % | | | 24.80 | % | | | -10.33 | % | | | -12.95 | % | | | -9.96 | % |
| Excluding current and deferred income tax | | | -1.38 | %(g) | | | -1.56 | % | | | -0.78 | % | | | -1.54 | % | | | -1.63 | % | | | -1.96 | % |
| Portfolio turnover rate | | | 5 | % | | | 24 | % | | | 17 | % | | | 8 | % | | | 30 | % | | | 18 | % |
See notes to financial statements.
22 l FMO l FIDUCIARY/CLAYMORE MLP OPPORTUNITY FUND SEMIANNUAL REPORT
| | |
FINANCIAL HIGHLIGHTS continued | May 31, 2017 |
| | | | | | | | | | | | | | | | | | | |
| | | For the | | | For the | | | For the | | | For the | | | For the | | | For the | |
| | | Period Ended | | | Year Ended | | | Year Ended | | | Year Ended | | | Year Ended | | | Year Ended | |
| | | May 31, 2017 | | | November 30, | | | November 30, | | | November 30, | | | November 30, | | | November 30, | |
| | | (unaudited) | | | 2016 | | | 2015 | | | 2014 | | | 2013 | | | 2012 | |
| Senior Indebtedness | | | | | | | | | | | | | | | | | | |
| Total borrowings outstanding (in thousands) | | $ | 183,000 | | | $ | 183,000 | | | $ | 263,000 | | | $ | 290,000 | | | $ | 259,000 | | | $ | 190,000 | |
Asset coverage per $1,000 of indebtedness (f) | | $ | 3,585 | | | $ | 3,715 | | | $ | 3,009 | | | $ | 4,075 | | | $ | 4,090 | | | $ | 4,001 | |
| * | Less than $0.005. |
| (a) | Based on average shares outstanding during the period. |
| (b) | The character of dividends received for each period is based upon estimates made at the time the distribution was received. Any necessary adjustments are reflected in the following fiscal year when the actual character is known. See Note 2(b) of the Notes to Financial Statements for additional information. |
| (c) | For the years ended November 30, 2016, 2015, 2014, 2013 and 2012 approximately $0.00, $1.36, $1.23, $1.52 and $0.88 per common share represents qualified dividend income for federal income tax purposes, respectively. The remaining distributions represent return of capital for federal income tax purposes. For GAAP purposes, all of the distributions were considered return of capital. See Note 2(c) of the Notes to Financial Statements for additional information. |
| (d) | Total investment return is calculated assuming a purchase of a common share at the beginning of the period and a sale on the last day of the period reported either at net asset value (“NAV”) or market price per share. Dividends and distributions are assumed to be reinvested at NAV for NAV returns or the prices obtained under the Fund’s Dividend Reinvestment Plan for market value returns. Total investment return does not reflect brokerage commissions. |
| (e) | Excluding current and deferred income taxes and interest expense, the net operating expense ratio for the six months ended May 31 and the years ended November 30 would be: |
May 31, 2017 | | | | | |
(unaudited) | 2016 | 2015 | 2014 | 2013 | 2012 |
| 1.55% | 1.60% | 1.53% | 1.42% | 1.38% | 1.49% |
| (f) | Calculated by subtracting the Fund’s total liabilities (not including the borrowings) from the Fund’s total assets and dividing by the total borrowings. |
| (g) | Annualized. |
See notes to financial statements.
FMO l FIDUCIARY/CLAYMORE MLP OPPORTUNITY FUND SEMIANNUAL REPORT l 23
NOTES TO FINANCIAL STATEMENTS (Unaudited) | May 31, 2017 |
| |
Note 1 – Organization:
Fiduciary/Claymore MLP Opportunity Fund (the “Fund”) was organized as a Delaware statutory trust on October 4, 2004. The Fund is registered as a non-diversified, closed-end management investment company under the Investment Company Act of 1940, as amended (the “1940 Act”).
The Fund’s investment objective is to provide a high level of after-tax total return with an emphasis on current distributions paid to shareholders. The Fund has been structured to seek to provide an efficient vehicle through which its shareholders may invest in a portfolio of publicly traded securities of master limited partnerships (“MLPs”) and MLP affiliates. MLPs combine the tax benefits of limited partnerships with the liquidity of publicly traded securities. The Fund anticipates that a significant portion of the distributions received by the Fund from the MLPs in which it invests will be return of capital. While the Fund will generally seek to maximize the portion of the Fund’s distributions to Common Shareholders that will consist of return of capital, no assurance can be given in this regard. There can be no assurance that the Fund will achieve its investment objective.
Note 2 – Accounting Policies:
The Fund operates as an investment company and accordingly follows the investment company accounting and reporting guidance of the Financial Accounting Standards Board (“FASB”) Accounting Standards Codification Topic 946 Financial Services – Investment Companies.
The following significant accounting policies are in conformity with U.S. generally accepted accounting principles (“GAAP”) and are consistently followed by the Fund. This requires management to make estimates and assumptions that affect the reported amount of assets and liabilities and disclosure of contingent assets and liabilities at the date of the financial statements and the reported amounts of revenues and expenses during the reporting period. Actual results could differ from these estimates. All time references are based on Eastern Time.
(a) Valuation of Investments
The Board of Trustees of the Fund (the “Board”) has adopted policies and procedures for the valuation of the Fund’s investments (the “Valuation Procedures”). Pursuant to the Valuation Procedures, the Board has delegated to a valuation committee, consisting of representatives from Guggenheim’s investment management, fund administration, legal and compliance departments (the “Valuation Committee”), the day-to-day responsibility for implementing the Valuation Procedures, including, under most circumstances, the responsibility for determining the fair value of the Fund’s securities or other assets.
Valuations of the Fund’s securities are supplied primarily by pricing services appointed pursuant to the processes set forth in the Valuation Procedures. The Valuation Committee convenes monthly, or more frequently as needed and will review the valuation of all assets which have been fair valued for reasonableness. The Fund’s officers, through the Valuation Committee and consistent with the monitoring and review responsibilities set forth in the Valuation Procedures, regularly review procedures used by, and valuations provided by, the pricing services.
Equity securities listed on an exchange (New York Stock Exchange (“NYSE”) or American Stock Exchange) are valued at the last quoted sales price as of the close of U.S. business on the NYSE, usually 4:00 p.m. on the valuation date. Equity securities listed on the NASDAQ market system are valued at the NASDAQ Official Closing Price on the valuation date, which may not necessarily
24 l FMO l FIDUCIARY/CLAYMORE MLP OPPORTUNITY FUND SEMIANNUAL REPORT
| | |
NOTES TO FINANCIAL STATEMENTS (Unaudited) continued | May 31, 2017 |
represent the last sale price. If there has been no sale on such exchange or NASDAQ on such day, the security is valued at the mean of the most recent bid and ask prices on such day.
Investments for which market quotations are not readily available are fair valued as determined in good faith by Guggenheim Funds Investment Advisors, LLC (“GFIA” or the “Adviser”), subject to review by the Valuation Committee, pursuant to methods established or ratified by the Board. Valuations in accordance with these methods are intended to reflect each security’s (or asset’s) “fair value.” Each such determination is based on a consideration of all relevant factors, which are likely to vary from one pricing context to another. Examples of such factors may include, but are not limited to: market prices; sale prices; broker quotes; and models which derive prices based on inputs such as prices of securities with comparable maturities and characteristics, or based on inputs such as anticipated cash flows or collateral, spread over Treasuries, and other information analysis.
Investment professionals from Advisory Research, Inc. (“ARI” or the “Sub-Adviser”) prepare preliminary valuations based on their evaluation of financial data, company specific developments, market valuations of comparable companies, market information and other factors. These preliminary valuations are reviewed by the Valuation Committee with subsequent deliberations until an appropriate price is determined for the Level 3 security.
(b) Investment Transactions and Investment Income
Investment transactions are accounted for on the trade date for financial reporting purposes. Realized gains and losses on investments are determined on the identified cost basis. Dividend income and return of capital distributions are recorded on the ex-dividend date. Return of capital distributions received by the Fund are recorded as a reduction to the cost basis for the specific security. Interest income including the amortization of premiums and accretion of discount is accrued daily.
The Fund records the character of dividends received from MLPs based on estimates made at the time such distributions are received. These estimates are based upon a historical review of information available from each MLP and other industry sources. The Fund’s characterization of the estimates may subsequently be revised based on information received from MLPs after their tax reporting periods conclude.
For the six months ended May 31, 2017, the Fund estimated 84.7% of its distributions from MLPs as return of capital, 7.8% of its distributions from MLPs as realized gains and 7.5% of its distributions as investment income, which is reflected in the Statement of Operations.
(c) Distributions
The Fund intends to make quarterly distributions to shareholders. On a book basis, all realized capital gains, if any, net of applicable taxes, will be retained by the Fund. Distributions to shareholders are recorded on the ex-dividend date. Distributions are determined in accordance with GAAP which may differ from their ultimate characterization for federal income tax purposes. A distribution may be wholly or partially taxable to a shareholder if the Fund has current earnings and profits (as determined for U.S. federal income tax purposes) in the taxable year of the distribution, even if the Fund has an overall deficit in the Fund’s accumulated earnings and profits and/or net operating loss or capital loss carryforwards that reduce or eliminate corporate income taxes in that taxable year. The Fund is unable to make final determinations as to the tax character of the
FMO l FIDUCIARY/CLAYMORE MLP OPPORTUNITY FUND SEMIANNUAL REPORT l 25
| | |
NOTES TO FINANCIAL STATEMENTS (Unaudited) continued | May 31, 2017 |
distributions to shareholders until after the end of the calendar year. The Fund will inform shareholders of the final tax character of the distributions on IRS Form 1099 DIV in January 2018. For the year ended November 30, 2016, 0% of the distributions were considered qualified dividend income and 100% were considered return of capital for federal income tax purposes.
| The final tax character of the distributions were as follows: | | | |
| | | 2016 | |
| Dividend Income | | $ | — | |
| Tax return of capital | | | 57,851,472 | |
| Total | | $ | 57,851,472 | |
On a GAAP basis, the source of the Fund’s distributions to shareholders for the year ended November 30, 2016, was paid-in capital.
(d) Indemnifications
Under the Fund’s organizational documents, its Trustees and Officers are indemnified against certain liabilities arising out of the performance of their duties to the Fund. In addition, throughout the normal course of business, the Fund enters into contracts that contain a variety of representations and warranties which provide general indemnifications. The Fund’s maximum exposure under these arrangements is unknown, as this would involve future claims that may be made against the Fund and/or its affiliates that have not yet occurred. However, based on experience, the Fund expects the risk of loss to be remote.
Note 3 – Investment Advisory Agreement, Sub-Advisory Agreement and Other Agreements:
Pursuant to an Investment Advisory Agreement between the Fund and the Adviser, the Adviser furnishes offices, necessary facilities and equipment, provides administrative services, oversees the activities of ARI, provides personnel including certain officers required for its administrative management and compensates the officers and trustees of the Fund who are affiliates of the Adviser. As compensation for these services, the Fund pays the Adviser a fee, payable monthly, in an amount equal to 1.00% of the Fund’s average daily managed assets.
Pursuant to a Sub-Advisory Agreement among the Fund, the Adviser and the Sub-Adviser, the Sub-Adviser under the supervision of the Fund’s Board and the Adviser, provides a continuous investment program for the Fund’s portfolio; provides investment research, makes and executes recommendations for the purchase and sale of securities; and provides certain facilities and personnel, including certain officers required for its administrative management and pays the compensation of officers and trustees (if any) of the Fund who are ARI’s affiliates. As compensation for its services, the Adviser pays the Sub-Adviser a fee, payable monthly, in an annual amount equal to 0.50% of the Fund’s average daily managed assets.
For purposes of calculating the fees payable under the foregoing agreements, average daily managed assets means the average daily value of the Fund’s total assets minus the sum of its accrued liabilities. Total assets means all of the Fund’s assets and is not limited to its investment securities. Accrued liabilities means all of the Fund’s liabilities other than borrowings for investment purposes.
26 l FMO l FIDUCIARY/CLAYMORE MLP OPPORTUNITY FUND SEMIANNUAL REPORT
| | |
NOTES TO FINANCIAL STATEMENTS (Unaudited) continued | May 31, 2017 |
Certain officers of the Fund are also officers, directors and/or employees of the Adviser or Sub-Adviser. The Fund does not compensate its officers who are officers, directors and/or employees of the aforementioned firms.
The Adviser and Sub-Adviser agreed to waive the advisory fees on all shares issued pursuant to the Fund’s shelf registration for the first three months those shares are outstanding and waive half the advisory fees on those shares for the next three months. Advisory fees of $12,610, of which $6,305 was waived by the Sub-Adviser, were waived for the period ended May 31, 2017. See Note 8 for additional information regarding offerings of shares pursuant to the Fund’s shelf registration statement.
MUFG Investor Services (US), LLC (“MUIS”) acts as the Fund’s administrator and accounting agent. As administrator and accounting agent, MUIS is responsible for maintaining the books and records of the Fund’s securities and cash. The Bank of New York (“BNY”) acts as the Fund’s custodian. As custodian, BNY is responsible for the custody of the Fund’s assets. For providing the aforementioned services, MUIS and BNY are entitled to receive a monthly fee equal to an annual percentage of the Fund’s average daily managed assets subject to certain minimum monthly fees and out of pocket expenses.:
Note 4 – Fair Value Measurement:
In accordance with GAAP, fair value is defined as the price that the Fund would receive to sell an investment or pay to transfer a liability in an orderly transaction with an independent buyer in the principal market, or in the absence of a principal market, the most advantageous market for the investment or liability. GAAP establishes a three-tier fair value hierarchy based on the types of inputs used to value assets and liabilities and requires corresponding disclosure. The hierarchy and the corresponding inputs are summarized below:
Level 1 — quoted prices in active markets for identical assets or liabilities.
Level 2 — significant other observable inputs (for example quoted prices for securities that are similar based on characteristics such as interest rates, prepayment speeds, credit risk, etc.).
Level 3— significant unobservable inputs based on the best information available under the circumstances, to the extent observable inputs are not available, which may include assumptions.
The types of inputs available depend on a variety of factors, such as the type of security and the characteristics of the markets in which it trades, if any. Fair valuation determinations that rely on fewer or no observable inputs require greater judgment. Accordingly, fair value determinations for Level 3 securities require the greatest amount of judgment.
Independent pricing services are used to value a majority of the Fund’s investments. When values are not available from a pricing service, they will be determined under the valuation policies that have been reviewed and approved by the Board. In any event, values are determined using a variety of sources and techniques, including: market prices; broker quotes; and models which derive prices
FMO l FIDUCIARY/CLAYMORE MLP OPPORTUNITY FUND SEMIANNUAL REPORT l 27
| | |
NOTES TO FINANCIAL STATEMENTS (Unaudited) continued | May 31, 2017 |
based on inputs such as prices of securities with comparable maturities and characteristics or based on inputs such as anticipated cash flows or collateral, spread over Treasuries, and other information and analysis.
The inputs or methodologies used for valuing securities are not necessarily an indication of the risk associated with investing in those securities. The suitability of the techniques and sources employed to determine fair valuation are regularly monitored and subject to change.
Note 5 – Federal Income Taxes:
The Fund is treated as a regular corporation, or “C” corporation, for U.S. federal income tax purposes. Accordingly, the Fund generally is subject to U.S. federal income tax on its taxable income at the graduated rates applicable to corporations (currently at a maximum rate of 35%). In addition, as a regular corporation, the Fund is subject to various state income taxes by reason of its investments in MLPs. As a limited partner in the MLPs, the Fund includes its allocable share of the MLP’s taxable income in computing its own taxable income. Deferred income taxes reflect the net tax effects of temporary differences between the carrying amounts of assets and liabilities for financial reporting purposes and the amounts used for income tax purposes. The Fund may be subject to a 20% alternative minimum tax to the extent that it exceeds the Fund’s regular income tax liability. The amount which the Fund is required to pay U.S. corporate income tax or alternative minimum tax could materially reduce the Fund’s cash available to make distributions on Common Shares.
As of May 31, 2017, the cost of investments and accumulated unrealized appreciation/depreciation on investments for federal income tax purposes were as follows:
| | Gross Tax | Gross | Net Tax |
Cost of Investments | Unrealized | Tax Unrealized | Unrealized |
for Tax Purposes | Appreciation | Depreciation | Appreciation |
| $432,871,756 | $369,286,418 | $(51,894,195) | $317,392,223 |
The Fund accrues deferred income taxes for its future tax liability or benefit associated with that portion of MLP distributions considered to be a tax-deferred return of capital as well as capital appreciation or depreciation of its investments. To the extent the Fund has a deferred tax asset, consideration is given as to whether or not a valuation allowance is required. The need to establish a valuation allowance for deferred tax assets is assessed periodically by the Fund based on the criterion established by ASC 740, Income Taxes, (“ASC 740”) that it is more likely than not that some portion or all of the deferred tax asset will not be realized. In the assessment for a valuation allowance, consideration is given to all positive and negative evidence related to the realization of the deferred tax asset. This assessment considers, among other matters, the nature, frequency and severity of current and cumulative losses, forecasts of future profitability (which are highly dependent on future MLP cash distributions), the duration of statutory carryforward periods and the associated risk that operating loss carryforwards may expire unused.
The Fund may rely to some extent on information provided by the MLPs, which may not necessarily be timely, to estimate taxable income allocable to the MLP units held in the portfolio and to estimate the associated deferred tax liability. Such estimates are made in good faith. From time to time, as new information becomes available, the Fund modifies its estimates or assumptions regarding the deferred tax liability.
28 l FMO l FIDUCIARY/CLAYMORE MLP OPPORTUNITY FUND SEMIANNUAL REPORT
| | |
NOTES TO FINANCIAL STATEMENTS (Unaudited) continued | May 31, 2017 |
The Fund’s income tax provision consists of the following:
| Current federal income tax expense | | $ | — | |
| Current state income tax expense | | | — | |
| Deferred federal income tax benefit | | | 871,912 | |
| Deferred state income tax benefit | | | 4,127,800 | |
| Total current and deferred tax benefit) | | $ | 4,999,712 | |
Total income tax expense differs from the amount computed by applying the federal statutory income tax rate of 35% to net investment income and realized and unrealized gains before taxes as follows:
| | | | | | Rate | |
| Application of statutory income tax rate | | $ | 4,603,516 | | | | 35.00 | % |
| State income taxes | | | 284,964 | | | | 2.17 | % |
| Permanent differences and other | | | 111,232 | | | | 0.84 | % |
| Total | | $ | 4,999,712 | | | | 38.01 | % |
Permanent differences primarily represent the dividend received deduction and foreign tax credits.
Components of the Fund’s deferred tax assets and liabilities as of May 31, 2017 are as follows:
Deferred tax assets: | | | |
| Deferred tax benefit on capital loss carryover, net operating losses and foreign tax credits | | $ | 25,633,919 | |
Deferred tax liabilities: | | | | |
| Deferred tax on unrealized gain on investments and capital loss carryforward | | $ | (120,522,181 | ) |
| Net deferred tax liability | | $ | (94,888,262 | ) |
For all open tax years and all major jurisdictions, management of the Fund has concluded that there are no significant uncertain tax positions that would require recognition in the financial statements. Uncertain tax positions taken or expected to be taken in the course of preparing the Fund’s tax returns that would not meet a more-likely-than-not threshold of being sustained by the applicable tax authority and would be recorded as tax expense in the current year. Open tax years are those that are open for examination by taxing authorities (i.e. generally the last four tax year ends and the interim tax period since then).
Note 6 – Investments in Securities:
For the period ended May 31, 2017 the cost of purchases and proceeds from sales of investments, excluding short-term securities, were $51,123,223 and $40,662,653, respectively.
Note 7 – Borrowings:
On September 30, 2008, the Fund entered into a credit facility agreement with an approved counterparty. The interest on the amount borrowed is based on 3-month LIBOR plus 0.95%. Effective June 5, 2014, the maximum commitment under the credit facility agreement was increased to $325,000,000. As of May 31, 2017 the amount outstanding in connection with the Fund’s credit
FMO l FIDUCIARY/CLAYMORE MLP OPPORTUNITY FUND SEMIANNUAL REPORT l 29
| | |
NOTES TO FINANCIAL STATEMENTS (Unaudited) continued | May 31, 2017 |
facility was $183,000,000. As of May 31, 2017 securities with a market value of $623,126,771 have been segregated and pledged as collateral for the credit facility.
The average daily amount of borrowings on the credit facility during the period ended May 31, 2017 was $183,000,000 with a related weighted average interest rate of 2.07%. The maximum amount outstanding during the period ended May 31, 2017 was $183,000,000.
Note 8 – Capital:
Common Shares
The Fund has an unlimited amount of common shares, $0.01 par value, authorized and 34,560,737 issued and outstanding.
| Transactions in common shares were as follows: | | |
| | Period Ended | Year Ended |
| | May 31, 2017 | November 30, 2016 |
| Beginning Shares | 33,651,772 | 33,572,117 |
| Shares issued through dividend reinvestment | 159,434 | 79,655 |
| Common shares issued through at-the-market offering | 749,531 | — |
| Common shares issued through overnight offering | — | — |
| Ending shares | 34,560,737 | 33,651,772 |
On May 6, 2011, the Fund’s shelf registration allowing for delayed or continuous offering of additional shares became effective and on April 20, 2012 a post-effective amendment thereto became effective. The shelf registration statement allowed for the issuance of up to an additional $218,859,845 of common shares. On December 16, 2011, the Fund entered into an at-the-market offering sales agreement with the Adviser and Cantor Fitzgerald & Co. to offer and sell 10,165,343 common shares, from time to time, through Cantor Fitzgerald & Co. as agent for the Fund. On May 17, 2013, the Fund’s new shelf registration statement allowing for delayed or continuous offering of additional shares became effective. The shelf registration statement allows for the issuance of up to an additional $268,593,405 of common shares. On July 3, 2013, the Fund entered into an at-the-market offering sales agreement with the Adviser and Cantor Fitzgerald & Co. to offer and sell up to 4,408,676 common shares, from time to time, through Cantor Fitzgerald & Co. as agent for the Fund. On December 7, 2016, the Fund’s new shelf registration statement allowing for delayed or continuous offering of additional shares became effective. On February 28, 2017, the Fund entered into an at-the-market offering sales agreement with the Adviser and Cantor Fitzgerald & Co. to offer and sell 4,750,000 common shares, from time to time, through Cantor Fitzgerald & Co. as agent for the Fund. Under these sales agreements, 749,531 shares were issued during the period ended May 31, 2017 and no shares were issued during the year ended November 30, 2016. The Adviser paid the costs associated with the offerings of shares and was reimbursed by the Fund up to 0.60% of the public offering price of each share sold under these offerings, not to exceed actual offering costs incurred. For the period ended May 31, 2017 and the year ended November 30, 2016, the Fund reimbursed the Adviser $86,117 and $79,394, respectively, for offering costs associated with these offerings, and will be responsible for additional offering costs in the future up to the 0.60% cap.
30 l FMO l FIDUCIARY/CLAYMORE MLP OPPORTUNITY FUND SEMIANNUAL REPORT
| | |
NOTES TO FINANCIAL STATEMENTS (Unaudited) continued | May 31, 2017 |
Note 9 – Concentration of Risk:
Because the Fund is focused in MLP entities in the energy, natural resources and real estate sectors of the economy, such concentration may present more risks than if the Fund were broadly diversified over numerous industries and sectors of the economy. A downturn in the energy, natural resources or real estate sectors of the economy could have a larger impact on the Fund than on an investment company that does not concentrate in such sectors. At times, the performance of securities of companies in the energy, natural resources and real estate sectors of the economy may lag the performance of other sectors or the broader market as a whole.
An investment in MLP units involves risks that differ from a similar investment in equity securities, such as common stock, of a corporation. Holders of MLP units have the rights typically afforded to limited partners in a limited partnership. As compared to common shareholders of a corporation, holders of MLP units have more limited control and limited rights to vote on matters affecting the partnership. There are certain tax risks associated with an investment in MLP units. Additionally, conflicts of interest may exist between common unit holders, subordinated unit holders and the general partner of an MLP; for example, a conflict may arise as a result of incentive distribution payments.
Note 10 – Restricted Securities:
The Fund may invest up to 40% of its managed assets in unregistered or otherwise restricted securities. Restricted securities are securities that are unregistered, held by control persons of the issuer or are subject to contractual restrictions on resale. The Fund will typically acquire restricted securities in directly negotiated transactions. Restricted securities are fair valued in accordance with procedures established in good faith by management and approved by the Fund’s Board. As of May 31, 2017, the Fund held the following restricted securities:
| | | | | | | | | | | | | | | | Price at | | | | |
Date of | | | | | Current | | | Fair Market | | | % of | | | Acquisition | | | 5/31/17 | |
Security | Acquisition | | Shares/Par | | | Cost | | | Value | | | Net Assets | | | Date | | | Price | |
| Clearwater Subordinate Note | 09/29/2008 | | $ | 359,812 | | | $ | 337,615 | | | $ | 3,598 | | | | 0.00 | %* | | $ | 100.00 | | | $ | 1.00 | |
| Clearwater Subordinate Note | 01/09/2009 | | | 53,517 | | | | 53,517 | | | | 535 | | | | 0.00 | %* | | $ | 100.00 | | | $ | 1.00 | |
| Total | | | | | | | $ | 391,132 | | | $ | 4,133 | | | | 0.00 | %* | | | | | | | | |
| * Amount is less than 0.05% of net assets. | | | | | | |
Note 11 – Subsequent Event:
The Fund evaluated subsequent events through the date the financial statements were available for issue and determined there were no additional material events that would require disclosure in the Fund’s financial statements, except as noted below.
The Board of Trustees of the Fund approved the use of reverse repurchase agreements at its February 2016 Board meeting and subsequently the Fund began utilizing leverage through reverse repurchase agreements in June 2017. ARI intends to use reverse repurchase agreements for a portion of the Fund’s leverage financing to provide increased leverage flexibility to take advantage of investment opportunities, subject to the leverage limitations imposed by the 1940 Act. With this added flexibility, it is anticipated that the Fund’s leverage may increase opportunistically to a range of approximately 30% to 38% of managed assets, based upon market conditions. Initially, ARI anticipates the targeted range will be approximately 34%.
FMO l FIDUCIARY/CLAYMORE MLP OPPORTUNITY FUND SEMIANNUAL REPORT l 31
| | |
SUPPLEMENTAL INFORMATION (Unaudited) | May 31, 2017 |
Federal Income Tax Information
In January 2018, you will be advised on IRS Form 1099 DIV or substitute 1099 DIV as to the federal tax status of the distributions received by you in the calendar year 2017.
Results of Shareholder Votes
The Annual Meeting of Shareholders of the Fund was held on May 4, 2017. Shareholders voted on the election of Trustees. With regards to the election of the following Trustees by shareholders of the Fund:
| | | | |
| | # of Shares in Favor | # of Shares Against | # of Shares Abstain |
| Randall C. Barnes | 29,658,482 | 365,645 | 325,146 |
| Donald C. Cacciapaglia | 29,539,288 | 440,942 | 369,043 |
| Donald A. Chubb, Jr. | 29,563,184 | 433,855 | 352,234 |
The other Trustees of the Fund not up for election in 2017 were Jerry B. Farley, Roman Friedrich III, Robert B. Karn III, Ronald A. Nyberg, Maynard F. Oliverius and Ronald E. Toupin, Jr.
Trustees
The Trustees of the Fiduciary/Claymore MLP Fund and their principal business occupations during the past five years:
| | | | | | |
| | Position(s) Held with Trust | Term of Office and Length of Time Served** | | Number of Portfolios in Fund Complex Overseen | |
| | | |
Name, Address* and Year of Birth | Principal Occupation(s) During Past Five Years | Other Directorships Held by Trustees |
Independent Trustees: | | | | |
Randall C. Barnes | Trustee | Since 2004 | Current: Private Investor (2001-present). | 98 | Current: Trustee, Purpose Investments Funds (2014-present). |
| (1951) | | | | |
| | | | Former: Senior Vice President and Treasurer, PepsiCo, Inc. (1993-1997); President, Pizza Hut International (1991-1993); Senior Vice President, Strategic Planning and New Business Development, PepsiCo, Inc. (1987-1990). | | |
Donald A. | Trustee and | Since 2014 | Current: Business broker and manager of commercial real estate, | 95 | Current: Midland Care, Inc. |
Chubb, Jr. | Chairman of | | Griffith & Blair, Inc. (1997-present). | | (2011-present). |
| (1946) | the Valuation | | | | |
| | Oversight | | | | |
| | Committee | | | | |
32 l FMO l FIDUCIARY/CLAYMORE MLP OPPORTUNITY FUND SEMIANNUAL REPORT
| | | |
SUPPLEMENTAL INFORMATION (Unaudited) continued | May 31, 2017 |
| | | | | | |
| | Position(s) Held with Trust | Term of Office and Length of Time Served** | | Number of Portfolios in Fund Complex Overseen | |
| | | |
Name, Address* and Year of Birth | Principal Occupation(s) During Past Five Years | Other Directorships Held by Trustees |
Independent Trustees continued: | | | | |
Jerry B. Farley | Trustee and | Since 2014 | Current: President, Washburn University (1997-present). | 95 | Current: Westar Energy, Inc. |
| (1946) | Chairman of | | | | (2004-present); CoreFirst Bank & Trust (2000-present). |
| | the Audit | | | |
| | Committee | | | | |
Roman | Trustee and | Since 2011 | Current: Founder and Managing Partner, Roman Friedrich & | 95 | Current: Zincore Metals, Inc. |
Friedrich III | Chairman of | | Company (1998-present). | | (2009-present). |
| (1946) | the Contracts | | | | |
| | Review | | Former: Senior Managing Director, MLV & Co. LLC (2010-2011). | | Former: Axiom Gold and Silver Corp. |
| | Committee | | | | (2011-2012). |
Robert B. Karn III | Trustee | Since 2004 | Current: Consultant (1998-present). | 95 | Current: GP Natural Resource Partners, LLC (2002- present). |
| (1942) | | | Former: Arthur Andersen (1965-1997) and Managing Partner, Financial and Economic Consulting, St. Louis office (1987-1997). | |
| | | | | Former: Peabody Energy Company (2003-April 2017). |
| | | | |
Ronald A. Nyberg | Trustee and Chairman of the Nominating and Governance Committee | Since 2004 | Current: Partner, Momkus McCluskey Roberts LLC (2016-present). | 100 | Current: Edward-Elmhurst Healthcare System (2012-present). |
| (1953) | | Former: Partner, Nyberg & Cassioppi, LLC (2000-2016); Executive Vice President, General Counsel, and Corporate Secretary, Van Kampen Investments (1982-1999). | |
| | | | |
| | | | |
| | | | |
| | | | | |
FMO l FIDUCIARY/CLAYMORE MLP OPPORTUNITY FUND SEMIANNUAL REPORT l 33
| | | |
SUPPLEMENTAL INFORMATION (Unaudited) continued | May 31, 2017 |
| | | | | | |
| | Position(s) Held with Trust | Term of Office and Length of Time Served** | | Number of Portfolios in Fund Complex Overseen | |
| | | |
Name, Address* and Year of Birth | Principal Occupation(s) During Past Five Years | Other Directorships Held by Trustees |
Independent Trustees continued: | | | | |
Maynard F. | Trustee | Since 2014 | Current: Retired. | 95 | Current: Robert J. Dole Institute of Politics (2016-present); Stormont-Vail Foundation (2013-present); University of Minnesota MHA Alumni Philanthropy Committee (2009-present); Fort Hays State University Foundation (1999-present). |
Oliverius | | | | |
| (1943) | | | Former: President and CEO, Stormont-Vail HealthCare (1996-2012). | |
| | | | | |
| | | | | |
| | | | | |
| | | | | |
| |
| | | | | | Former: Topeka Community Foundation (2009-2014). |
| | | | | |
Ronald E. | Trustee and | Since 2004 | Current: Portfolio Consultant (2010-present). | 97 | Former: Bennett Group of Funds |
Toupin, Jr. | Chairman of | | | | (2011-2013). |
| (1958) | the Board | | Former: Vice President, Manager and Portfolio Manager, Nuveen Asset Management (1998-1999); Vice President, Nuveen Investment Advisory Corp. (1992-1999); Vice President and Manager, Nuveen Unit Investment Trusts (1991-1999); and Assistant Vice President and Portfolio Manager, Nuveen Unit Investment Trusts (1988-1999), each of John Nuveen & Co., Inc. (1982-1999). | | |
| | | | | |
| | | | | |
| | | | | |
| | | | | |
| | | | | |
34 l FMO l FIDUCIARY/CLAYMORE MLP OPPORTUNITY FUND SEMIANNUAL REPORT
| | | |
SUPPLEMENTAL INFORMATION (Unaudited) continued | May 31, 2017 |
| | Position(s) Held with Trust | Term of Office and Length of Time Served** | | Number of Portfolios in Fund Complex Overseen | |
Name, Address* and Year of Birth | | |
Principal Occupation(s) During Past Five Years | Other Directorships Held by Trustees |
Interested Trustee: | | | | |
Donald C. Cacciapaglia*** (1951) | President, Chief Executive Officer and Trustee | Since 2012 | Current: President and CEO, certain other funds in the Fund Complex (2012-present); Vice Chairman, Guggenheim Investments (2010-present). | 230 | Current: Clear Spring Life Insurance Company (2015-present); Guggenheim Partners Japan, Ltd. (2014-present); Guggenheim Partners Investment Management Holdings, LLC (2014- present); Delaware Life (2013-present); Guggenheim Life and Annuity Company (2011-present); Paragon Life Insurance Company of Indiana (2011-present). |
| | |
| | | |
| | | Former: Chairman and CEO, Channel Capital Group, Inc. (2002-2010). | |
| | | | |
| | | | | |
| | | | | |
| | | | | |
| | | | | |
* The business address of each Trustee is c/o Guggenheim Investments, 227 West Monroe Street, Chicago, IL 60606.
** After a Trustee’s initial term, each Trustee is expected to serve a three-year term concurrent with the class of Trustees for which he serves:
—Messrs. Farley, Friedrich and Nyberg, are Class II Trustees. The Class II Trustees are expected to stand for re-election at the Trust’s annual meeting of shareholders for fiscal year ending May 31, 2018.
—Messrs. Karn, Oliverius and Toupin, are Class III Trustees. The Class III Trustees are expected to stand for re-election at the Trust’s annual meeting of shareholders for fiscal year ending May 31, 2019.
—Messrs. Barnes, Cacciapaglia and Chubb are Class I Trustees. The Class I Trustees are expected to stand for re-election at the Trust’s annual meeting of shareholders for fiscal year ending May 31, 2020.
*** This Trustee is deemed to be an “interested person” of the Trust under the 1940 Act by reason of his position with the Fund’s Adviser and/or the parent of the Adviser.
FMO l FIDUCIARY/CLAYMORE MLP OPPORTUNITY FUND SEMIANNUAL REPORT l 35
| | | |
SUPPLEMENTAL INFORMATION (Unaudited) continued | May 31, 2017 |
Officers
The Officers of the Fiduciary/Claymore MLP Fund, who are not Trustees, and their principal occupations during the past five years:
| | | | |
| | Position(s) held with the Trust | | |
| | Term of Office and Length of Time Served** | |
Name, Address* and Year of Birth | |
Principal Occupations During Past Five Years |
Officers: | | | |
Joanna M. | Chief | Since 2012 | Current: Chief Compliance Officer, certain funds in the Fund Complex (2012-present); Senior Managing Director, Guggenheim Investments (2012-present); AML Officer, certain funds in the Fund Complex (2016-present). |
Catalucci | Compliance | |
| (1966) | Officer | | |
| | | | Former: Chief Compliance Officer and Secretary, certain other funds in the Fund Complex (2008-2012); Senior Vice President & Chief Compliance Officer, Security Investors, LLC and certain affiliates (2010-2012); Chief Compliance Officer and Senior Vice President, Rydex Advisors, LLC and certain affiliates (2010-2011). |
| | | |
| | | |
James M. Howley | Assistant Treasurer | Since 2006 | Current: Managing Director, Guggenheim Investments (2004-present); Assistant Treasurer, certain other funds in the Fund Complex (2006-present). |
| (1972) | |
| | | | Former: Manager of Mutual Fund Administration, Van Kampen Investments, Inc. (1996-2004). |
Keith Kemp (1960) | Assistant Treasurer | Since 2016 | Current: Treasurer and Assistant Treasurer, certain other funds in the Fund Complex (2010-present); Managing Director of Guggenheim Partners Investment Management, LLC (2015-present); Chief Financial Officer, Guggenheim Specialized Products, LLC (2016-present). |
| |
| |
| | | | Former: Managing Director and Director, Transparent Value, LLC (2010-2016); Director, Guggenheim Partners Investment Management, LLC (2010-2015); Chief Operating Officer, Macquarie Capital Investment Management (2007-2009). |
| | | |
Amy J. Lee (1961) | Chief Legal Officer | Since 2013 | Current: Chief Legal Officer, certain other funds in the Fund Complex (2013-present); Senior Managing Director, Guggenheim Investments (2012-present). |
| |
| |
| | | | Former: Vice President, Associate General Counsel and Assistant Secretary, Security Benefit Life Insurance Company and Security Benefit Corporation (2004-2012). |
| | | |
36 l FMO l FIDUCIARY/CLAYMORE MLP OPPORTUNITY FUND SEMIANNUAL REPORT
| | | |
SUPPLEMENTAL INFORMATION (Unaudited) continued | May 31, 2017 |
| | | | |
| | Position(s) | | |
| | held | Term of Office | |
Name, Address* | with the | and Length of | |
and Year of Birth | Trust | Time Served** | Principal Occupations During Past Five Years |
Officers continued: | | | |
Mark E. Mathiasen | Secretary | Since 2007 | Current: Secretary, certain other funds in the Fund Complex (2007-present); Managing Director, Guggenheim Investments (2007-present). |
| (1978) | | | |
Glenn McWhinnie | Assistant | Since 2016 | Current: Vice President, Guggenheim Investments (2009-present). |
| (1969) | Treasurer | | |
| | | | Former: Tax Compliance Manager, Ernst & Young LLP (1996-2009). |
Michael P. Megaris | Assistant Secretary | Since 2014 | Current: Assistant Secretary, certain other funds in the Fund Complex (2014-present); Vice President, Guggenheim Investments (2012-present). |
| (1984) | | |
| | | | Former: J.D., University of Kansas School of Law (2009-2012). |
Adam J. Nelson (1979) | Assistant Treasurer | Since 2015 | Current: Vice President, Guggenheim Investments (2015-present); Assistant Treasurer, certain other funds in the Fund Complex (2015-present). |
| | |
| | | | Former: Assistant Vice President and Fund Administration Director, State Street Corporation (2013-2015); Fund Administration Assistant Director, State Street (2011-2013); Fund Administration Manager, State Street (2009-2011). |
| | | |
Kimberly J. Scott (1974) | Assistant Treasurer | Since 2012 | Current: Director, Guggenheim Investments (2012-present); Assistant Treasurer, certain other funds in the Fund Complex (2012-present). |
| | |
| | | | Former: Financial Reporting Manager, Invesco, Ltd. (2010-2011); Vice President/Assistant Treasurer of Mutual Fund Administration, Van Kampen Investments, Inc./Morgan Stanley Investment Management (2009-2010); Manager, Mutual Fund Administration for Van Kampen Investments, Inc./Morgan Stanley Investment Management (2005-2009). |
| | | |
| | | |
Bryan Stone (1979) | Vice President | Since 2014 | Current: Vice President, certain other funds in the Fund Complex (2014-present); Director, Guggenheim Investments (2013-present). |
| | | |
| | | | Former: Senior Vice President, Neuberger Berman Group LLC (2009-2013); Vice President, Morgan Stanley (2002-2009). |
FMO l FIDUCIARY/CLAYMORE MLP OPPORTUNITY FUND SEMIANNUAL REPORT l 37
SUPPLEMENTAL INFORMATION (Unaudited) continued | May 31, 2017 |
| | Position(s) held with the Trust | | |
| | Term of Office and Length of Time Served** | |
Name, Address* and Year of Birth | |
Principal Occupations During Past Five Years |
Officers continued: | | | |
John L. Sullivan (1955) | Chief Financial Officer, Chief Accounting Officer and Treasurer | Since 2010 | Current: CFO, Chief Accounting Officer and Treasurer, certain other funds in the Fund Complex (2010-present); Senior Managing Director, Guggenheim Investments (2010-present). |
| |
| | | |
| | | Former: Managing Director and CCO, each of the funds in the Van Kampen Investments fund complex (2004-2010); Managing Director and Head of Fund Accounting and Administration, Morgan Stanley Investment Management (2002-2004); CFO and Treasurer, Van Kampen Funds (1996-2004). |
| | |
| | | |
| * | The business address of each officer is c/o Guggenheim Investments, 227 West Monroe Street, Chicago, IL 60606. |
| ** | Each officer serves an indefinite term, until his or her successor is duly elected and qualified. The date reflects the commencement date upon which the officer held any officer position with the Fund. |
38 l FMO l FIDUCIARY/CLAYMORE MLP OPPORTUNITY FUND SEMIANNUAL REPORT
| | |
APPROVAL OF ADVISORY AGREEMENTS – | |
FIDUCIARY/CLAYMORE MLP OPPORTUNITY FUND (FMO) | May 31, 2017 |
Fiduciary/Claymore MLP Opportunity Fund (the “Fund”) is a Delaware statutory trust that is registered as a non-diversified, closed-end management investment company under the Investment Company Act of 1940, as amended (the “1940 Act”). Guggenheim Funds Investment Advisors, LLC (“GFIA” or the “Adviser”), an indirect subsidiary of Guggenheim Partners, LLC, a global, diversified financial services firm (“Guggenheim Partners”), serves as the Fund’s investment adviser and provides certain administrative and other services pursuant to an investment advisory agreement between the Fund and GFIA (the “Investment Advisory Agreement”). (Guggenheim Partners, GFIA, Guggenheim Partners Investment Management, LLC (“GPIM”) and their affiliates may be referred to herein collectively as “Guggenheim.” “Guggenheim Investments” refers to the global asset management and investment advisory division of Guggenheim Partners and includes GFIA, GPIM, Security Investors, LLC and other affiliated investment management businesses of Guggenheim Partners.)
Under the terms of the Investment Advisory Agreement, GFIA is responsible for overseeing the activities of Advisory Research, Inc. (“Advisory Research” or the “Sub-Adviser”), which performs portfolio management and related services for the Fund pursuant to an investment sub-advisory agreement by and among the Fund, the Adviser and Advisory Research (the “Sub-Advisory Agreement” and together with the Investment Advisory Agreement, the “Advisory Agreements”). Under the supervision and oversight of GFIA and the Board of Trustees of the Fund (the “Board,” with the members of the Board referred to individually as the “Trustees”), Advisory Research performs certain of the day-to-day operations of the Fund, which may include one or more of the following services at the request of the Adviser: (i) managing the investment and reinvestment of the Fund’s assets in accordance with the Fund’s investment policies; (ii) arranging for the purchase and sale of securities and other assets for the Fund; (iii) providing investment research and credit analysis concerning the Fund’s assets; (iv) placing orders for purchases and sales of Fund assets; (v) maintaining books and records as are required to support the Fund’s investment operations; (vi) monitoring on a daily basis the investment activities and portfolio holdings relating to the Fund; and (vii) voting proxies relating to the Fund’s portfolio securities in accordance with the Sub-Adviser’s proxy voting policies and procedures. Advisory Research is a wholly owned subsidiary of Piper Jaffray Companies.
Following an initial two-year term, each of the Advisory Agreements continues in effect from year to year provided that such continuance is specifically approved at least annually by (i) the Board or a majority of the outstanding voting securities (as defined in the 1940 Act) of the Fund, and, in either event, (ii) the vote of a majority of the Trustees who are not “interested person[s],” as defined by the 1940 Act, of the Fund (the “Independent Trustees”) casting votes in person at a meeting called for such purpose. At meetings held in person on April 25, 2017 (the “April Meeting”) and on May 23-24, 2017 (the “May Meeting”), the Contracts Review Committee of the Board (the “Committee”), consisting solely of the Independent Trustees, met separately from Guggenheim to consider the proposed renewal of the Advisory Agreements in connection with the Committee’s annual contract review schedule.
As part of its review process, the Committee was represented by independent legal counsel to the Independent Trustees (“Independent Legal Counsel”). Independent Legal Counsel reviewed and discussed with the Committee various key aspects of the Trustees’ legal responsibilities relating to the proposed renewal of the Advisory Agreements and other principal contracts. The Committee took
FMO l FIDUCIARY/CLAYMORE MLP OPPORTUNITY FUND SEMIANNUAL REPORT l 39
| | |
APPROVAL OF ADVISORY AGREEMENTS – | |
FIDUCIARY/CLAYMORE MLP OPPORTUNITY FUND (FMO) continued | May 31, 2017 |
into account various materials received from Guggenheim, Advisory Research and Independent Legal Counsel. Recognizing that the evaluation process with respect to the services provided by each of GFIA and Advisory Research is an ongoing one, the Committee also considered the variety of written materials, reports and oral presentations the Board receives throughout the year regarding performance and operating results of the Fund.
In connection with the contract review process, FUSE Research Network LLC (“FUSE”), an independent, third-party research provider, was engaged to prepare advisory contract renewal reports designed specifically to help the Board fulfill its advisory contract renewal responsibilities. The objective of the reports is to present the subject funds’ relative position regarding fees, expenses and total return performance, with comparisons to a peer group of funds identified by Guggenheim, based on a methodology reviewed by the Board. In addition, Guggenheim provided materials and data in response to formal requests for information sent by Independent Legal Counsel on behalf of the Independent Trustees. Guggenheim also made a presentation at the April Meeting. Throughout the process, the Committee asked questions of management and requested certain additional information, which Guggenheim provided following the April Meeting (collectively with the foregoing reports and materials, the “Contract Review Materials”). The Committee considered the Contract Review Materials in the context of its accumulated experience in governing the Fund and weighed the factors and standards discussed with Independent Legal Counsel.
Following an analysis and discussion of the factors identified below and in the exercise of its business judgment, the Committee concluded that it was in the best interest of the Fund to recommend that the Board approve the renewal of each of the Advisory Agreements for an additional annual term.
Investment Advisory Agreement
Nature, Extent and Quality of Services Provided by the Adviser: With respect to the nature, extent and quality of services currently provided by the Adviser, the Committee noted that the Adviser delegated responsibility for the investment and reinvestment of the Fund’s assets to the Sub-Adviser. The Committee considered the Adviser’s responsibility to oversee the Sub-Adviser and took into account information provided by Guggenheim describing the Adviser’s processes and activities for providing oversight of sub-advisers, including information regarding the Adviser’s Sub-Advisory Oversight Committee.
The Committee also considered the secondary market support services provided by Guggenheim to the Fund and, in this regard, noted the materials describing the activities of Guggenheim’s dedicated Closed-End Fund Team, including with respect to communication with financial advisors, data dissemination and relationship management. In addition, the Committee considered qualifications, experience and skills of key personnel performing services for the Fund, including those personnel providing compliance oversight, as well as the supervisors and reporting lines for such personnel. In this connection, the Committee considered Guggenheim’s resources and related efforts to retain, attract and motivate capable personnel to serve the Fund and noted Guggenheim’s report on recent additions, departures and transitions in personnel who work on matters relating to the Fund or are significant to the operations of the Adviser.
40 l FMO l FIDUCIARY/CLAYMORE MLP OPPORTUNITY FUND SEMIANNUAL REPORT
| | |
APPROVAL OF ADVISORY AGREEMENTS – | |
FIDUCIARY/CLAYMORE MLP OPPORTUNITY FUND (FMO) continued | May 31, 2017 |
The Committee also considered Guggenheim’s attention to relevant developments in the mutual fund industry, and issues germane to closed-end funds in particular, and its observance of compliance and regulatory requirements and noted that on a regular basis the Board receives and reviews information from the Fund’s Chief Compliance Officer regarding compliance policies and procedures established pursuant to Rule 38a-1 under the 1940 Act, as well as from Guggenheim’s Chief Risk Officer. In addition, the Committee noted Guggenheim’s implementation of additional controls and oversight processes relating to risk management, including the establishment of an Enterprise Risk Management Committee comprised of a multi-disciplinary team of senior personnel, as well as enhancements to the organization’s information security program.
In connection with the Committee’s evaluation of the overall package of services provided by the Adviser, the Committee considered Guggenheim’s role in monitoring and coordinating compliance responsibilities with the administrator, custodian and other service providers to the Fund. In this respect, the Committee took into account the initiatives undertaken by Guggenheim in connection with the outsourcing of its fund administration and fund accounting services business resulting from Guggenheim’s sale of Rydex Fund Services, LLC (“RFS”), formerly a Guggenheim affiliate and now known as MUFG Investor Services (US), LLC (“MUFG IS”), to Mitsubishi UFJ Trust and Banking Corporation, the trust banking arm of Mitsubishi UFJ Financial Group, a Japanese financial services organization (the “RFS Transaction”). In particular, the Committee considered Guggenheim’s establishment of the Office of Chief Financial Officer (“OCFO”), its structure and responsibilities, including its role in overseeing the services provided by MUFG IS. The Committee also considered the resources allocated by Guggenheim to support the OCFO and the detailed plans presented by management for functions for the OCFO both during and upon completion of the transition period with MUFG IS.
With respect to Guggenheim’s resources and the Adviser’s ability to carry out its responsibilities under the Investment Advisory Agreement, the Chief Financial Officer of Guggenheim Investments reviewed with the Committee certain unaudited financial information concerning the holding company for Guggenheim Investments, Guggenheim Partners Investment Management Holdings, LLC (“GPIMH”). The Committee received the audited consolidated financial statements of GPIMH as supplemental information.
The Committee also considered the acceptability of the terms of the Investment Advisory Agreement, including the scope of services required to be performed by the Adviser.
Based on the foregoing, and based on other information received (both oral and written) at the April Meeting and the May Meeting, as well as other considerations, including the Committee’s knowledge of how the Adviser performs its duties obtained through Board meetings, discussions and reports during the year, the Committee concluded that the Adviser and its personnel were qualified to serve the Fund in such capacity and may reasonably be expected to continue to provide a high quality of services under the Investment Advisory Agreement with respect to the Fund.
Investment Performance: The Fund commenced investment operations on December 28, 2004. The Committee received data showing the Fund’s total return on a net asset value (“NAV”) and market price basis for the ten-year, five-year, three-year and one-year periods ended December 31, 2016. The Committee compared the Fund’s performance to a peer group of closed-end funds identified by Guggenheim (the “peer group of funds”) and the Fund’s benchmark for the same time periods. The
FMO l FIDUCIARY/CLAYMORE MLP OPPORTUNITY FUND SEMIANNUAL REPORT l 41
| | |
APPROVAL OF ADVISORY AGREEMENTS – | |
FIDUCIARY/CLAYMORE MLP OPPORTUNITY FUND (FMO) continued | May 31, 2017 |
peer group of funds included other closed-end funds that invest primarily in master limited partnerships (each, a “MLP”) and are taxed as “C” corporations. The Committee considered that the peer group of funds is consistent with the peer group used for purposes of the Fund’s quarterly performance reporting. The Committee also noted the Adviser’s statement that due to the unique nature of the C corporation structure and additional tax considerations, such as deferred tax assets or liabilities which impact performance and other metrics, certain of the more recently launched MLP closed-end funds may be less relevant for comparison.
The Committee noted that the Fund’s investment results were consistent with its investment objective of providing a high level of after-tax total return with an emphasis on current distributions paid to shareholders. The Committee also considered that the Adviser does not directly manage the investment portfolio but delegated such duties to the Sub-Adviser.
In addition, the Committee considered the Fund’s structure and form of leverage, and among other information related to leverage, the cost of the leverage and the aggregate leverage outstanding as of December 31, 2016, as well as net yield on leverage assets and net impact on common assets due to leverage for the one-year period ended December 31, 2016 and annualized for the three-year and since-inception periods ended December 31, 2016. Based on the information provided, including with respect to the Adviser’s sub-advisory oversight processes, the Committee concluded that the Adviser had appropriately reviewed and monitored the Sub-Adviser’s investment performance.
Comparative Fees, Costs of Services Provided and the Profits Realized by the Adviser from its Relationship with the Fund: The Committee compared the Fund’s contractual advisory fee (which includes the sub-advisory fee paid to the Sub-Adviser) and total net expense ratio, in each case as a percentage of average net assets for the latest fiscal year, to the peer group of funds and noted the Fund’s percentile rankings in this regard. The Committee also reviewed the average and median advisory fees and expense ratios, including expense ratio components (e.g., transfer agency fees, administration fees and other operating expenses) of the peer group of funds. The Committee considered that the Fund’s contractual advisory fee and total net expense ratio (excluding interest expense) were below the peer group median, ranking in the 15th and 23rd percentiles, respectively. The Committee also noted that the Adviser did not identify any other clients or accounts considered to have similar investment strategies and policies as the Fund.
With respect to the costs of services provided and profits realized by Guggenheim Investments from its relationship with the Fund, the Committee reviewed a profitability analysis and data from management setting forth the average assets under management for the twelve months ended December 31, 2016, ending assets under management as of December 31, 2016, gross revenues received by Guggenheim Investments, expenses allocated to the Fund, earnings and the operating margin/profitability rate, including variance information relative to the foregoing amounts as of December 31, 2015. In addition, the Chief Financial Officer of Guggenheim Investments reviewed with, and addressed questions from, the Committee concerning the expense allocation methodology employed in producing the profitability analysis.
In the course of its review of Guggenheim Investments’ profitability, the Committee took into account the methods used by Guggenheim Investments to determine expenses and profit. The Committee also noted steps taken by management to refine its methodology in preparation for contract review, including, among other things, revisions to the process for allocating expenses for
42 l FMO l FIDUCIARY/CLAYMORE MLP OPPORTUNITY FUND SEMIANNUAL REPORT
| | |
APPROVAL OF ADVISORY AGREEMENTS – | |
FIDUCIARY/CLAYMORE MLP OPPORTUNITY FUND (FMO) continued | May 31, 2017 |
shared service functions, as previously reported to and discussed with the Board. The Committee considered all of the foregoing in evaluating the costs of services provided, the profitability to Guggenheim Investments and the profitability rates presented, and concluded that the profits were not unreasonable.
The Committee considered other benefits available to the Adviser because of its relationship with the Fund and noted Guggenheim’s statement that until the completion of the RFS Transaction on October 4, 2016, the Adviser may have benefited from arrangements whereby an affiliate received fees from the Fund for providing certain administrative and fund accounting services. In addition, the Committee noted the Adviser’s statement that it may benefit from marketing synergies arising from offering a broad spectrum of products, including the Fund.
Economies of Scale: The Committee received and considered information regarding whether there have been economies of scale with respect to the management of the Fund as the Fund’s assets grow, whether the Fund has appropriately benefited from any economies of scale, and whether there is potential for realization of any further economies of scale. The Committee considered whether economies of scale in the provision of services to the Fund were being passed along to the shareholders. In this respect, the Committee considered that advisory fee breakpoints generally are not relevant given the structural nature of closed-end funds, which, though able to conduct additional share offerings periodically, do not continuously offer new shares and thus, do not experience daily inflows and outflows of capital. The Committee also noted the additional shares offered by the Fund through secondary offerings in the past and considered that to the extent the Fund’s assets increase over time (whether through additional periodic offerings or internal growth from asset appreciation), the Fund and its shareholders should realize economies of scale as certain expenses, such as fixed fund fees, become a smaller percentage of overall assets. In addition, as to increases in the Fund’s assets resulting from secondary offerings, the Committee considered the Adviser’s agreement to waive the advisory fees payable with respect to the assets attributable to common shares issued pursuant to the Fund’s shelf registration statement for the first three months after such common shares are issued and to waive half the advisory fees payable with respect to the assets attributable to such common shares for the subsequent three months. The Committee also took into account the competitiveness of the Fund’s advisory fee, which is below both the peer group average and median.
The Committee determined that, taking into account all relevant factors, the Fund’s advisory fee was reasonable.
Sub-Advisory Agreement
Nature, Extent and Quality of Services Provided by the Sub-Adviser: With respect to the nature, extent and quality of services provided by the Sub-Adviser, the Committee considered the qualifications, experience and skills of the Sub-Adviser’s portfolio management and other key personnel and information from the Sub-Adviser describing the scope of its services to the Fund. In addition, the Committee took into account the information provided by the Sub-Adviser regarding, among other things, its risk management processes; strategic initiatives and plans disaster recovery plans; cybersecurity policies, procedures and controls; insurance coverage; the process employed by the Sub-Adviser to assess the adequacy of Fund disclosures to shareholders in light of changing investment risks; the Sub-Adviser’s method for allocating trades among client accounts and the
FMO l FIDUCIARY/CLAYMORE MLP OPPORTUNITY FUND SEMIANNUAL REPORT l 43
| | |
APPROVAL OF ADVISORY AGREEMENTS – | |
FIDUCIARY/CLAYMORE MLP OPPORTUNITY FUND (FMO) continued | May 31, 2017 |
related oversight of that process; the Sub-Adviser’s process for determining whether it is obtaining the most favorable execution of portfolio transactions for the Fund and the factors that the Sub-Adviser considers in allocating brokerage; and information regarding the organization’s compliance program. The Committee also considered the Sub-Adviser’s long-term history of managing the Fund’s investment portfolio and the consistency of the Sub-Adviser’s investment approach. The Committee noted the personal investments that the Sub-Adviser’s key investment personnel have made in the Fund, which further aligns the interests of the Sub-Adviser and its personnel with those of the Fund’s shareholders. With respect to the Sub-Adviser’s resources and its ability to carry out its responsibilities under the Sub-Advisory Agreement, the Committee included as part of its considerations the information provided by the Sub-Adviser regarding the financial condition of its parent company. In this connection, the Committee also considered the Sub-Adviser’s representations concerning its ongoing viability as a business enterprise and available resources.
The Committee also considered the acceptability of the terms of the Sub-Advisory Agreement, including the scope of services required to be performed by the Sub-Adviser. In addition, the Committee considered the Sub-Adviser’s efforts in pursuing the Fund’s investment objective of providing a high level of after-tax total return with an emphasis on current distributions paid to shareholders.
Based on the foregoing, and based on other information received (both oral and written) at the April Meeting and the May Meeting, as well as other considerations, including the Committee’s knowledge of how the Sub-Adviser performs its duties obtained through Board meetings, discussions and reports during the year, the Committee concluded that the Sub-Adviser and its personnel were qualified to serve the Fund in such capacity and may reasonably be expected to continue to provide a high quality of services under the Sub-Advisory Agreement.
Investment Performance: The Committee reviewed the performance of the Fund and the peer group of funds over various periods of time. The Committee noted that the Fund’s performance on a NAV basis outperformed the peer group median for the three-year period ended December 31, 2016 (ranking in the 38th percentile) and ranked in the 50th and 54th percentiles for the five-year and one-year periods ended December 31, 2016, respectively.
The Committee also took into account the Sub-Adviser’s view that the Fund’s performance relative to the Alerian MLP Index over a full market cycle (typically three to five years) is a good metric for determining the adequacy of the Fund’s performance. The Committee observed that the Fund underperformed the benchmark, the Alerian MLP Index, on a NAV basis for the five-year and three-year periods ended December 31, 2016 and outperformed the benchmark with respect to the one-year period ended December 31, 2016.
The Committee noted the Sub-Adviser’s view that the Fund has achieved its investment objective to date. In this regard, the Committee observed that the Fund’s annualized NAV total return since inception was 6.05%, as reported by FUSE.
The Committee also took into account Guggenheim’s belief that there is no single optimal performance metric, nor is there a single optimal time period over which to evaluate performance and that a thorough understanding of performance comes from analyzing measures of returns, risk and risk-adjusted returns, as well as evaluating strategies both relative to their market benchmarks
44 l FMO l FIDUCIARY/CLAYMORE MLP OPPORTUNITY FUND SEMIANNUAL REPORT
| | |
APPROVAL OF ADVISORY AGREEMENTS – | |
FIDUCIARY/CLAYMORE MLP OPPORTUNITY FUND (FMO) continued | May 31, 2017 |
and to peer groups of competing strategies. Thus, the Committee also reviewed and considered the additional performance and risk metrics provided by Guggenheim, including the Fund’s standard deviation, tracking error, beta, Sharpe ratio, information ratio and alpha compared to the benchmark, with the Fund’s risk metrics ranked against its peer group. In assessing the foregoing, the Committee considered Guggenheim’s statement that the Fund’s risk-adjusted returns are generally in the second or third quartile of its peer group.
In addition to the foregoing, the Committee considered information regarding the Sub-Adviser’s use of leverage, including with respect to the process for determining how much leverage to employ at any particular time.
After reviewing the foregoing and related factors, the Committee concluded that the Fund’s performance supported renewal of the Sub-Advisory Agreement.
Comparative Fees, Costs of Services Provided and the Profits Realized by the Sub Adviser from its Relationship with the Fund: The Committee noted that the sub-advisory fees payable to Advisory Research are paid by the Adviser and do not impact the advisory fee paid by the Fund (which the Committee had determined to be reasonable). The Committee also reviewed the total amount of sub-advisory fees paid to the Sub-Adviser for the twelve months ended December 31, 2016, as compared to the prior year. In addition, the Committee compared the sub-advisory fee paid by the Adviser to the Sub-Adviser to the fees charged by the Sub-Adviser to other client accounts, including registered investment companies that have an energy-related equity securities strategy similar to the Fund’s for which the Sub-Adviser serves as sub-adviser. The Committee also considered the Sub-Adviser’s representation that it does not charge a lower advisory or subadvisory fee to any other client as to which it provides comparable services to those it provides to the Fund.
With respect to the costs of services provided and profits realized by the Sub-Adviser from its relationship with the Fund, the Committee reviewed information regarding the revenues the Sub-Adviser received under the Sub-Advisory Agreement and direct and indirect allocated expenses of the Sub-Adviser in providing services under the Sub-Advisory Agreement. The Committee considered other benefits available to the Sub-Adviser because of its relationship with the Fund, including proprietary research information received from brokers who execute trades for the Fund and the Sub-Adviser’s identification of “fallout” benefits by exposure of its name and website to investors and brokers who, in the absence of the Fund, may have had no dealings with the firm.
Based on all of the information provided, the Committee determined that the Sub-Adviser’s profitability from its relationship with the Fund was not unreasonable.
Economies of Scale: The Committee received and considered information regarding whether there have been economies of scale with respect to the management of the Fund as the Fund’s assets grow, whether the Fund has appropriately benefited from any economies of scale, and whether there is potential for realization of any further economies of scale. The Committee considered whether economies of scale in the provision of sub-advisory services to the Fund were being passed along to the shareholders. In this respect, the Committee considered the SubAdviser’s view that economies of scale are realized to the extent that the firm uses systems and employees across client accounts and that, as assets under management increase, the SubAdviser will continue to experience a balance between a reduction in overall costs due to economies of scale and an increase in costs due
FMO l FIDUCIARY/CLAYMORE MLP OPPORTUNITY FUND SEMIANNUAL REPORT l 45
| | |
APPROVAL OF ADVISORY AGREEMENTS – | |
FIDUCIARY/CLAYMORE MLP OPPORTUNITY FUND (FMO) continued | May 31, 2017 |
to additions and expansions. In this regard, the Sub-Adviser noted that it has continually invested in additional personnel and infrastructure in order to enhance its ability to provide quality services to the Fund, but has been able to offset the cost apportioned to the Fund by adding incremental new business. The Committee also noted that the Sub-Adviser believes that the Fund benefits from the increased scale of its business.
Overall Conclusions
Based on the foregoing, the Committee determined that the investment advisory fees are fair and reasonable in light of the extent and quality of the services provided and other benefits received and that the continuation of each Advisory Agreement is in the best interest of the Fund. In reaching this conclusion, no single factor was determinative or conclusive and each Committee member, in the exercise of his business judgment, may attribute different weights to different factors. At the May Meeting, the Committee, constituting all of the Independent Trustees, recommended the renewal of each Advisory Agreement for an additional annual term.
Thereafter, on May 24, 2017, the Board, including all of the Independent Trustees, approved the renewal of each of the Advisory Agreements for an additional annual term.
46 l FMO l FIDUCIARY/CLAYMORE MLP OPPORTUNITY FUND SEMIANNUAL REPORT
| | |
DIVIDEND REINVESTMENT PLAN (Unaudited) | May 31, 2017 |
Unless the registered owner of common shares elects to receive cash by contacting Computershare Trust Company, N.A. (the “Plan Administrator”), all dividends declared on common shares of the Fund will be automatically reinvested by the Plan Administrator for shareholders in the Fund’s Dividend Reinvestment Plan (the “Plan”), in additional common shares of the Fund. Participation in the Plan is completely voluntary and may be terminated or resumed at any time without penalty by notice if received and processed by the Plan Administrator prior to the dividend record date; otherwise such termination or resumption will be effective with respect to any subsequently declared dividend or other distribution. Some brokers may automatically elect to receive cash on your behalf and may re-invest that cash in additional common shares of the Fund for you. If you wish for all dividends declared on your common shares of the Fund to be automatically reinvested pursuant to the Plan, please contact your broker.
The Plan Administrator will open an account for each common shareholder under the Plan in the same name in which such common shareholder’s common shares are registered. Whenever the Fund declares a dividend or other distribution (together, a “Dividend”) payable in cash, nonparticipants in the Plan will receive cash and participants in the Plan will receive the equivalent in common shares. The common shares will be acquired by the Plan Administrator for the participants’ accounts, depending upon the circumstances described below, either (i) through receipt of additional unissued but authorized common shares from the Fund (“Newly Issued Common Shares”) or (ii) by purchase of outstanding common shares on the open market (“Open-Market Purchases”) on the New York Stock Exchange or elsewhere. If, on the payment date for any Dividend, the closing market price plus estimated brokerage commission per common share is equal to or greater than the net asset value per common share, the Plan Administrator will invest the Dividend amount in Newly Issued Common Shares on behalf of the participants. The number of Newly Issued Common Shares to be credited to each participant’s account will be determined by dividing the dollar amount of the Dividend by the net asset value per common share on the payment date; provided that, if the net asset value is less than or equal to 95% of the closing market value on the payment date, the dollar amount of the Dividend will be divided by 95% of the closing market price per common share on the payment date. If, on the payment date for any Dividend, the net asset value per common share is greater than the closing market value plus estimated brokerage commission, the Plan Administrator will invest the Dividend amount in common shares acquired on behalf of the participants in Open-Market Purchases.
If, before the Plan Administrator has completed its Open-Market Purchases, the market price per common share exceeds the net asset value per common share, the average per common share purchase price paid by the Plan Administrator may exceed the net asset value of the common shares, resulting in the acquisition of fewer common shares than if the Dividend had been paid in Newly Issued Common Shares on the Dividend payment date. Because of the foregoing difficulty with respect to Open-Market Purchases, the Plan provides that if the Plan Administrator is unable to invest the full Dividend amount in Open-Market Purchases during the purchase period or if the market discount shifts to a market premium during the purchase period, the Plan Administrator may cease making Open-Market Purchases and may invest the uninvested portion of the Dividend amount in Newly Issued Common Shares at net asset value per common share at the close of business on the Last Purchase Date provided that, if the net asset value is less than or equal to 95% of the then current market price per common share; the dollar amount of the Dividend will be divided by 95% of the market price on the payment date.
FMO l FIDUCIARY/CLAYMORE MLP OPPORTUNITY FUND SEMIANNUAL REPORT l 47
| | |
DIVIDEND REINVESTMENT PLAN (Unaudited) continued | May 31, 2017 |
The Plan Administrator maintains all shareholders’ accounts in the Plan and furnishes written confirmation of all transactions in the accounts, including information needed by shareholders for tax records. Common shares in the account of each Plan participant will be held by the Plan Administrator on behalf of the Plan participant, and each shareholder proxy will include those shares purchased or received pursuant to the Plan. The Plan Administrator will forward all proxy solicitation materials to participants and vote proxies for shares held under the Plan in accordance with the instruction of the participants.
There will be no brokerage charges with respect to common shares issued directly by the Fund. However, each participant will pay a pro rata share of brokerage commission incurred in connection with Open-Market Purchases. The automatic reinvestment of Dividends will not relieve participants of any Federal, state or local income tax that may be payable (or required to be withheld) on such Dividends.
The Fund reserves the right to amend or terminate the Plan. There is no direct service charge to participants with regard to purchases in the Plan; however, the Fund reserves the right to amend the Plan to include a service charge payable by the participants.
All correspondence or questions concerning the Plan should be directed to the Plan Administrator, Computershare Trust Company, N.A., P.O. Box 30170 College Station, TX 77842-3170: Attention: Shareholder Services Department, Phone Number: (866) 488-3559 or online at www.computershare.com/investor.
48 l FMO l FIDUCIARY/CLAYMORE MLP OPPORTUNITY FUND SEMIANNUAL REPORT
| | |
FUND INFORMATION | May 31, 2017 |
| | |
Board of Trustees | Investment Adviser |
| Board of Trustees | Guggenheim Funds Investment |
| Randall C. Barnes | Advisors, LLC |
| Donald C. Cacciapaglia* | Chicago, IL |
| Donald A. Chubb, Jr. |
| Jerry B. Farley | Investment Sub-Adviser Advisory Research, Inc. St. Louis, MO |
| Roman Friedrich III |
| Robert B. Karn III |
| Ronald A. Nyberg |
| Maynard F. Oliverius |
| Ronald E. Toupin, Jr., | MUFG Investor Services (US), LLC |
Chairman | Rockville, MD |
| |
| * Trustee is an “interested person” (as defined | |
| in section 2(a)(19) of the 1940 Act) |
| (“Interested Trustee”) of the Trust because of | Custodian |
| his position as the President and CEO of the | The Bank of New York Mellon Corp. |
| Investment Adviser and the Distributor. | New York, NY |
| |
Principal Executive Officers | Legal Counsel |
| Donald C. Cacciapaglia | Skadden, Arps, Slate, Meagher & |
President and Chief Executive Officer | Flom LLP |
| New York, NY |
| Joanna M. Catalucci | |
Chief Compliance Officer |
| Independent Registered Public |
| Amy J. Lee | Accounting Firm |
Chief Legal Officer | Ernst & Young LLP |
| | Tysons, VA |
| Mark E. Mathiasen | |
Secretary | |
| |
| John L. Sullivan | |
Chief Financial Officer, Chief Accounting | |
Officer and Treasurer |
| |
| |
| |
| |
| |
| |
FMO l FIDUCIARY/CLAYMORE MLP OPPORTUNITY FUND SEMIANNUAL REPORT l 49
| | |
FUND INFORMATION continued | May 31, 2017 |
Privacy Principles of Fiduciary/Claymore MLP Opportunity Fund for Shareholders
The Fund is committed to maintaining the privacy of its shareholders and to safeguarding its non-public personal information. The following information is provided to help you understand what personal information the Fund collects, how we protect that information and why, in certain cases, we may share information with select other parties.
Generally, the Fund does not receive any non-public personal information relating to its shareholders, although certain non-public personal information of its shareholders may become available to the Fund. The Fund does not disclose any non-public personal information about its shareholders or former shareholders to anyone except as permitted by law or as is necessary in order to service shareholder accounts (for example, to a transfer agent or third party administrator).
The Fund restricts access to non-public personal information about the shareholders to Guggenheim Funds Investment Advisors, LLC employees with a legitimate business need for the information. The Fund maintains physical, electronic and procedural safeguards designed to protect the non-public personal information of its shareholders.
Questions concerning your shares of Fiduciary/Claymore MLP Opportunity Fund?
| · | If your shares are held in a Brokerage Account, contact your Broker. |
| · | If you have physical possession of your shares in certificate form, contact the Fund’s Transfer Agent:
Computershare Trust Company, N.A., P.O. Box 30170 College Station, TX 77842-3170; (866) 488-3559 or online at www.computershare.com/investor |
This report is sent to shareholders of Fiduciary/Claymore MLP Opportunity Fund for their information. It is not a Prospectus, circular or representation intended for use in the purchase or sale of shares of the Fund or of any securities mentioned in this report.
A description of the Fund’s proxy voting policies and procedures related to portfolio securities is available without charge, upon request, by calling the Fund at (888) 991-0091.
Information regarding how the Fund voted proxies for portfolio securities, if applicable, during the most recent 12-month period ended June 30, is also available, without charge and upon request by calling (888) 991-0091, by visiting the Fund’s website at guggenheiminvestments.com/fmo or by accessing the Fund’s Form N-PX on the U.S. Securities and Exchange Commission’s (SEC) website at www.sec.gov.
The Fund files its complete schedule of portfolio holdings with the SEC for the first and third quarters of each fiscal year on Form N-Q. The Fund’s Form N-Q is available on the SEC website at www.sec.gov or at guggenheiminvestments.com/fmo. The Fund’s Form N-Q may also be viewed and copied at the SEC’s Public Reference Room in Washington, DC; information on the operation of the Public Reference Room may be obtained by calling (800) SEC-0330.
Notice to Shareholders
Notice is hereby given in accordance with Section 23(c) of the Investment Company Act of 1940, as amended, that the Fund from time to time may purchase shares of its common stock in the open market or in private transactions.
50 l FMO l FIDUCIARY/CLAYMORE MLP OPPORTUNITY FUND SEMIANNUAL REPORT
This Page Intentionally Left Blank.
FMO l FIDUCIARY/CLAYMORE MLP OPPORTUNITY FUND SEMIANNUAL REPORT l 51
ABOUT THE FUND MANAGERS
Advisory Research, Inc.
Advisory Research, Inc., a registered investment adviser, is a wholly-owned subsidiary of Piper Jaffray Companies. As of May 31, 2017, the MLP & Energy Infrastructure team (“MLP Team”) at Advisory Research, Inc. managed approximately $4.3 billion in MLP and energy infrastructure assets for open and closed end mutual funds, public and corporate pension plans, endowments and foundations and private wealth individuals.
Investment Philosophy
The MLP team’s investment philosophy is based on our belief that strategy dominates tactics. It is our expectation that a portfolio incorporating a well-founded top-down strategy, rigorous quantitative analysis, and strong fundamental research increases the probability of generating excess return relative to the benchmark. To manage risks in our portfolios, we limit concentration and generally exclude those issues that we believe to be of lower quality, and thus higher risk.
Our style is best described as a core, risk-aware approach with a bias over the long term towards higher-quality, higher-growth, and smaller capitalization MLPs and energy infrastructure companies.
Investment Process
The MLP Team seeks to achieve the Fund’s investment objective by investing primarily in securities of MLP (Master Limited Partnership) entities that the MLP Team believes offer attractive distribution rates and capital appreciation potential. Energy and natural resources represent a substantial portion of the MLP entities. In seeking investments, the MLP Team looks for MLPs that offer a combination of quality, growth and yield; intended to produce superior total returns over the long run. In selecting individual positions, the manager employs the MLP Team top-down process which considers a combination of quantitative, qualitative and relative value factors. The MLP Team emphasizes rigorous proprietary analysis and valuation models constructed and maintained by its in-house investment analysts, while maintaining active dialogues with research analysts covering the MLP entities and an ongoing relationship with company management. In applying its selection criteria, the manager considers a company’s proven track record, business prospects, strong record of distribution or dividend growth, ratios of debt to cash flow, coverage ratios with respect to distributions to unit holders, distribution incentive structure and the composition and goals of the company management team.
| | |
Advisory Research, Inc. 8235 Forsyth Boulevard
Suite 700
St. Louis, MO 63105 | Guggenheim Funds Distributors, LLC 227 West Monroe Street
Chicago, IL 60606
Member FINRA/SIPC
(07/17) |
NOT FDIC-INSURED l NOT BANK-GUARANTEED l MAY LOSE VALUE
CEF-FMO-SAR-0517