Exhibit 99.2
Dave Weidman, Chairman and CEO Steven Sterin, Senior Vice President and CFO Celanese 3Q 2007 Earnings Conference Call / Webcast Tuesday, October 23, 2007 10:00 a.m. ET |
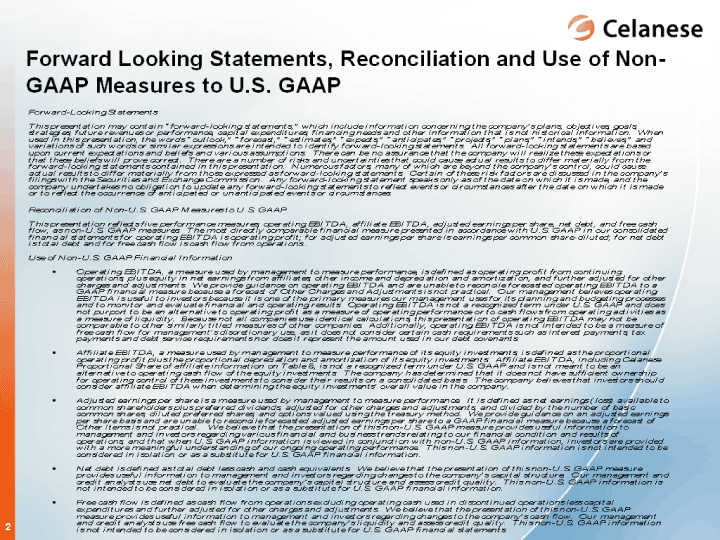
Forward Looking Statements, Reconciliation and Use of Non- GAAP Measures to U.S. GAAP |
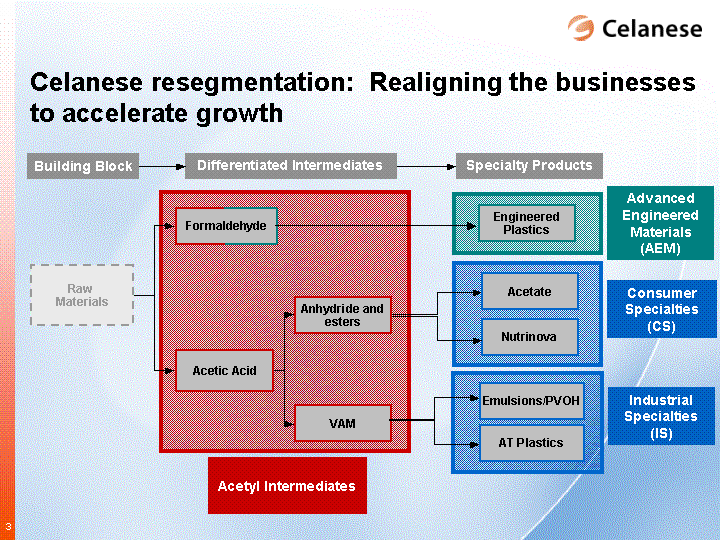
Acetyl Intermediates Formaldehyde VAM Acetic Acid Differentiated Intermediates Specialty Products Building Block Celanese resegmentation: Realigning the businesses to accelerate growth Raw Materials Advanced Engineered Materials (AEM) Industrial Specialties (IS) Anhydride and esters Consumer Specialties (CS) Engineered Plastics Emulsions/PVOH Nutrinova Acetate AT Plastics |
Dave Weidman Chairman and Chief Executive Officer |
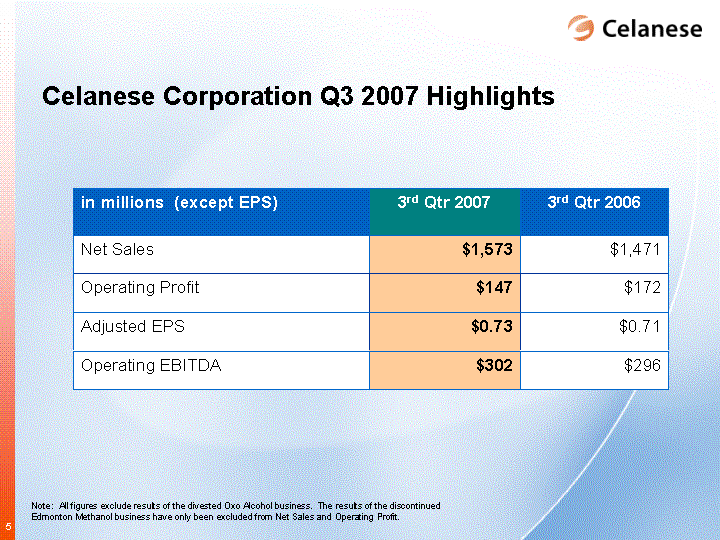
Celanese Corporation Q3 2007 Highlights in millions (except EPS) 3rd Qtr 2007 3rd Qtr 2006 Net Sales $1,573 $1,471 Operating Profit $147 $172 Adjusted EPS $0.73 $0.71 Operating EBITDA $302 $296 Note: All figures exclude results of the divested Oxo Alcohol business. The results of the discontinued Edmonton Methanol business have only been excluded from Net Sales and Operating Profit. |
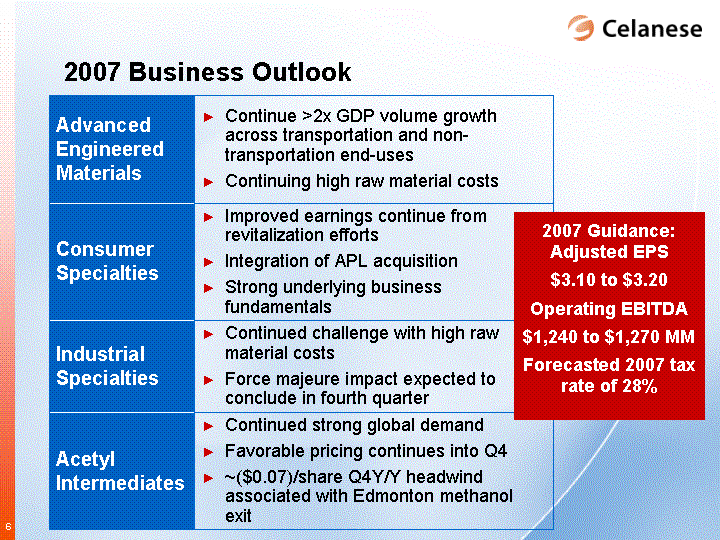
Advanced Engineered Materials Continue >2x GDP volume growth across transportation and non-transportation end-uses Continuing high raw material costs Consumer Specialties Improved earnings continue from revitalization efforts Integration of APL acquisition Strong underlying business fundamentals Industrial Specialties Continued challenge with high raw material costs Force majeure impact expected to conclude in fourth quarter Acetyl Intermediates Continued strong global demand Favorable pricing continues into Q4 ~($0.07)/share Q4Y/Y headwind associated with Edmonton methanol exit 2007 Business Outlook 2007 Guidance: Adjusted EPS $3.10 to $3.20 Operating EBITDA $1,240 to $1,270 MM Forecasted 2007 tax rate of 28% |
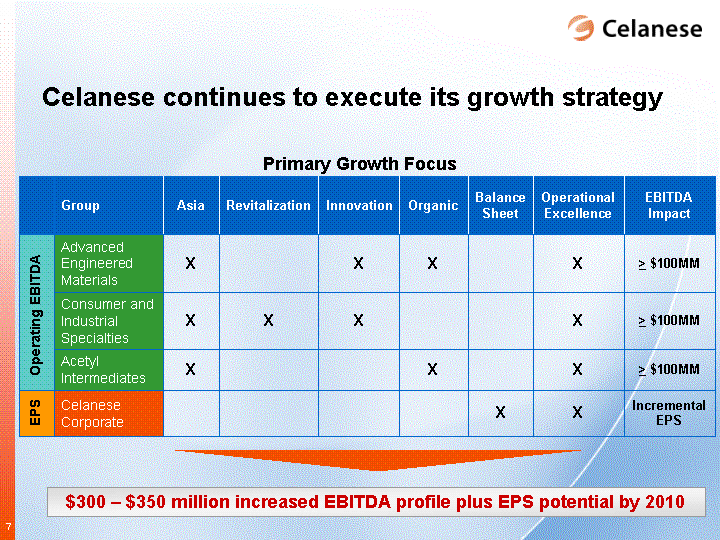
Celanese continues to execute its growth strategy $300 - $350 million increased EBITDA profile plus EPS potential by 2010 Group Asia Revitalization Innovation Organic Balance Sheet Operational Excellence EBITDA Impact Advanced Engineered Materials X X X X > $100MM Consumer and Industrial Specialties X X X X > $100MM Acetyl Intermediates X X X > $100MM Celanese Corporate X X Incremental EPS Primary Growth Focus Operating EBITDA EPS |
Steven Sterin Senior Vice President and CFO |
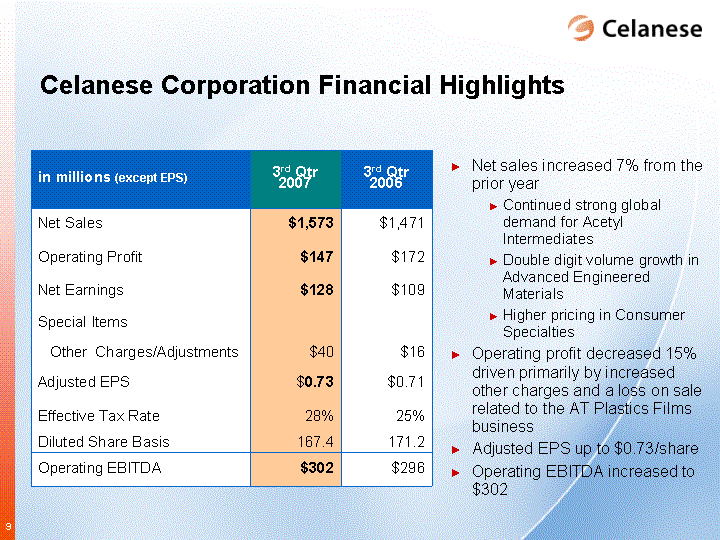
Celanese Corporation Financial Highlights in millions (except EPS) 3rd Qtr 2007 3rd Qtr 2006 Net Sales $1,573 $1,471 Operating Profit $147 $172 Net Earnings $128 $109 Special Items Other Charges/Adjustments $40 $16 Adjusted EPS $0.73 $0.71 Effective Tax Rate 28% 25% Diluted Share Basis 167.4 171.2 Operating EBITDA $302 $296 Net sales increased 7% from the prior year Continued strong global demand for Acetyl Intermediates Double digit volume growth in Advanced Engineered Materials Higher pricing in Consumer Specialties Operating profit decreased 15% driven primarily by increased other charges and a loss on sale related to the AT Plastics Films business Adjusted EPS up to $0.73/share Operating EBITDA increased to $302 |
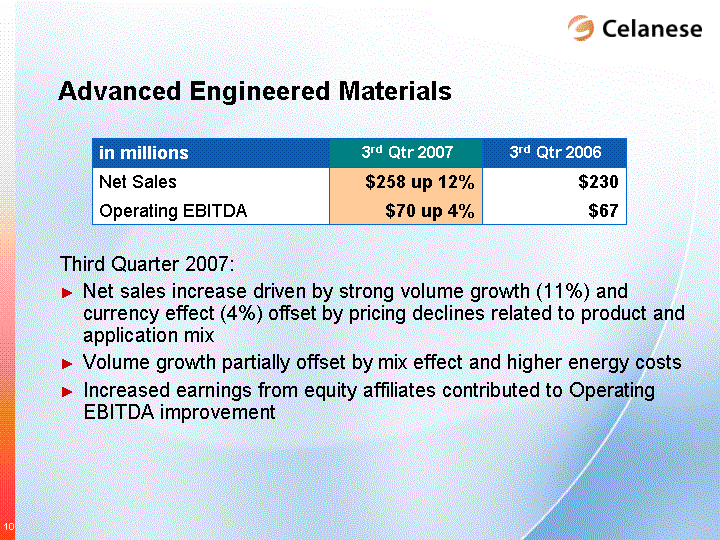
in millions 3rd Qtr 2007 3rd Qtr 2006 Net Sales $258 up 12% $230 Operating EBITDA $70 up 4% $67 Advanced Engineered Materials Third Quarter 2007: Net sales increase driven by strong volume growth (11%) and currency effect (4%) offset by pricing declines related to product and application mix Volume growth partially offset by mix effect and higher energy costs Increased earnings from equity affiliates contributed to Operating EBITDA improvement |
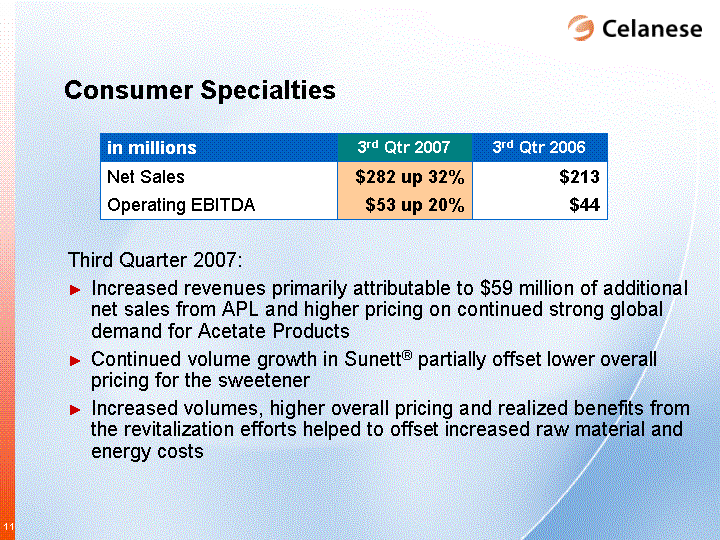
Third Quarter 2007: Increased revenues primarily attributable to $59 million of additional net sales from APL and higher pricing on continued strong global demand for Acetate Products Continued volume growth in Sunett(r) partially offset lower overall pricing for the sweetener Increased volumes, higher overall pricing and realized benefits from the revitalization efforts helped to offset increased raw material and energy costs Consumer Specialties in millions 3rd Qtr 2007 3rd Qtr 2006 Net Sales $282 up 32% $213 Operating EBITDA $53 up 20% $44 |
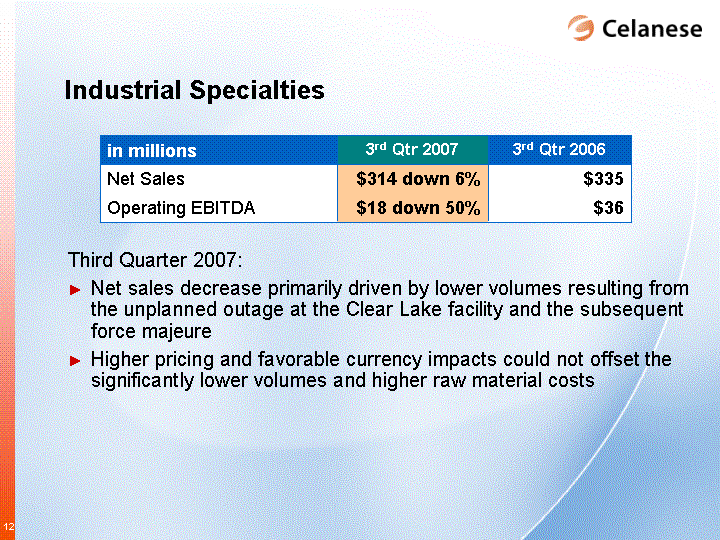
Third Quarter 2007: Net sales decrease primarily driven by lower volumes resulting from the unplanned outage at the Clear Lake facility and the subsequent force majeure Higher pricing and favorable currency impacts could not offset the significantly lower volumes and higher raw material costs Industrial Specialties in millions 3rd Qtr 2007 3rd Qtr 2006 Net Sales $314 down 6% $335 Operating EBITDA $18 down 50% $36 |
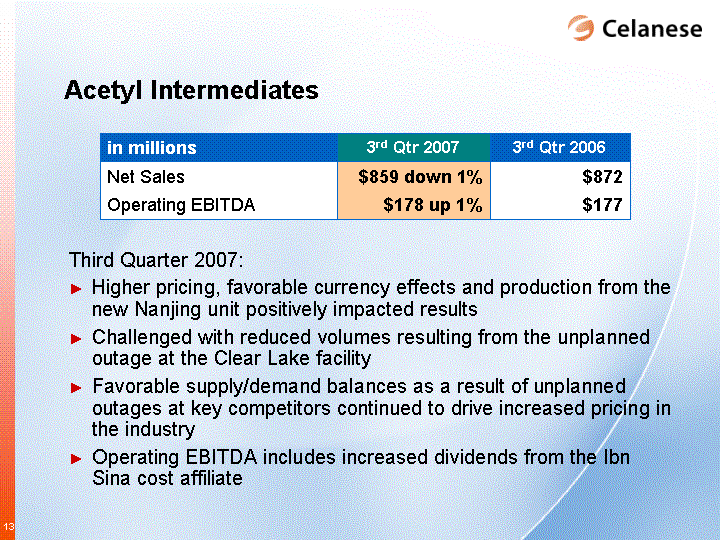
Acetyl Intermediates in millions 3rd Qtr 2007 3rd Qtr 2006 Net Sales $859 down 1% $872 Operating EBITDA $178 up 1% $177 Third Quarter 2007: Higher pricing, favorable currency effects and production from the new Nanjing unit positively impacted results Challenged with reduced volumes resulting from the unplanned outage at the Clear Lake facility Favorable supply/demand balances as a result of unplanned outages at key competitors continued to drive increased pricing in the industry Operating EBITDA includes increased dividends from the Ibn Sina cost affiliate |
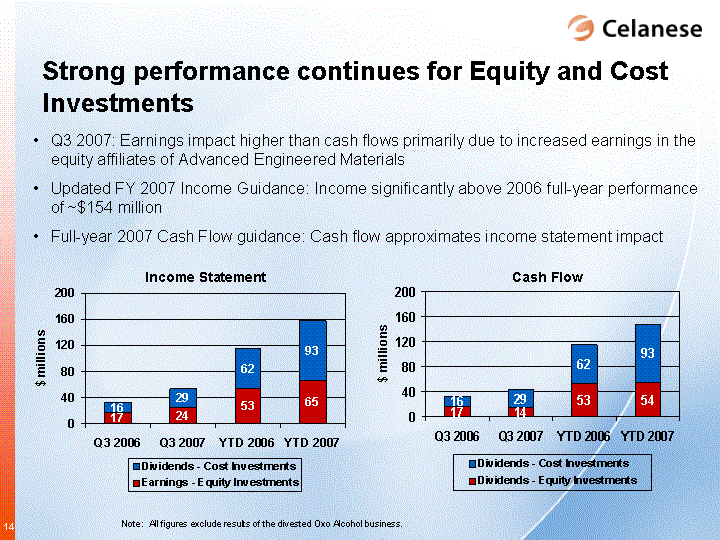
Q3 2006 Q3 2007 YTD 2006 YTD 2007 Q3 2006 Q3 2007 YTD 2006 YTD 2007 Q3 2007: Earnings impact higher than cash flows primarily due to increased earnings in the equity affiliates of Advanced Engineered Materials Updated FY 2007 Income Guidance: Income significantly above 2006 full-year performance of ~$154 million Full-year 2007 Cash Flow guidance: Cash flow approximates income statement impact Income Statement Cash Flow Strong performance continues for Equity and Cost Investments Note: All figures exclude results of the divested Oxo Alcohol business. |
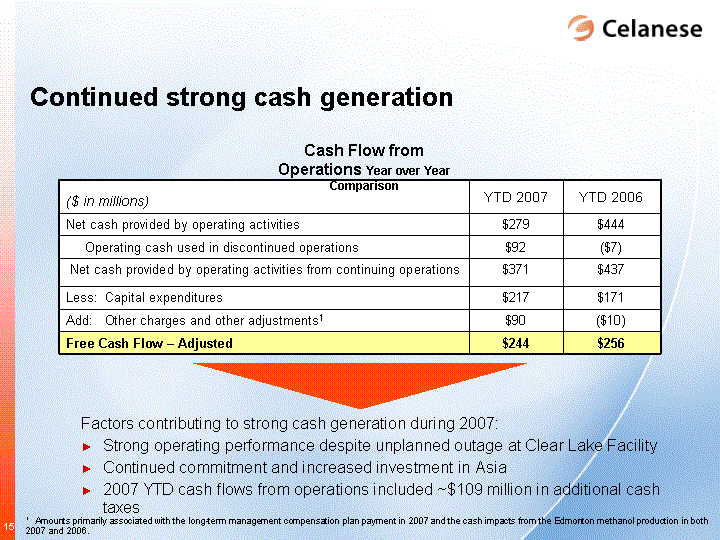
Continued strong cash generation ($ in millions) YTD 2007 YTD 2006 Net cash provided by operating activities $279 $444 Operating cash used in discontinued operations $92 ($7) Net cash provided by operating activities from continuing operations $371 $437 Less: Capital expenditures $217 $171 Add: Other charges and other adjustments1 $90 ($10) Free Cash Flow - Adjusted $244 $256 Cash Flow from Operations Year over Year Comparison Factors contributing to strong cash generation during 2007: Strong operating performance despite unplanned outage at Clear Lake Facility Continued commitment and increased investment in Asia 2007 YTD cash flows from operations included ~$109 million in additional cash taxes 1 Amounts primarily associated with the long-term management compensation plan payment in 2007 and the cash impacts from the Edmonton methanol production in both 2007 and 2006. |
Appendix |
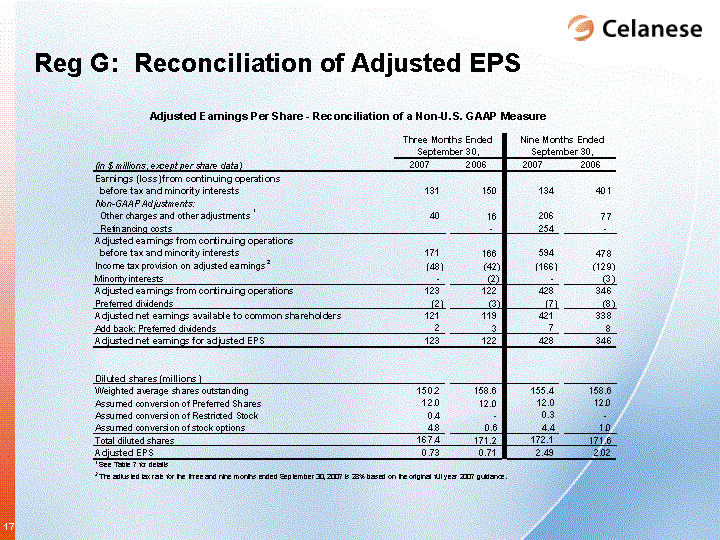
Reg G: Reconciliation of Adjusted EPS |
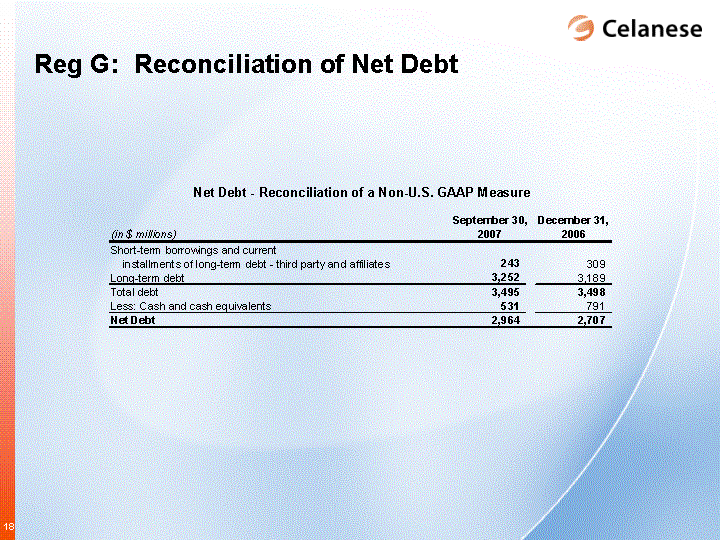
Reg G: Reconciliation of Net Debt |
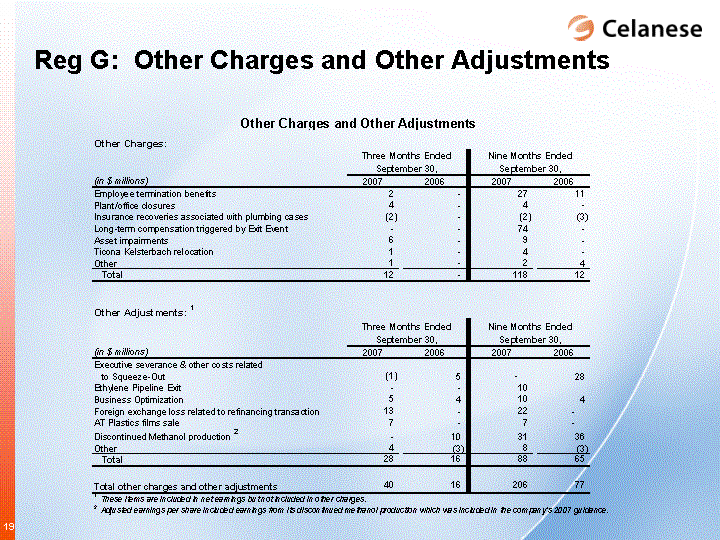
Reg G: Other Charges and Other Adjustments |
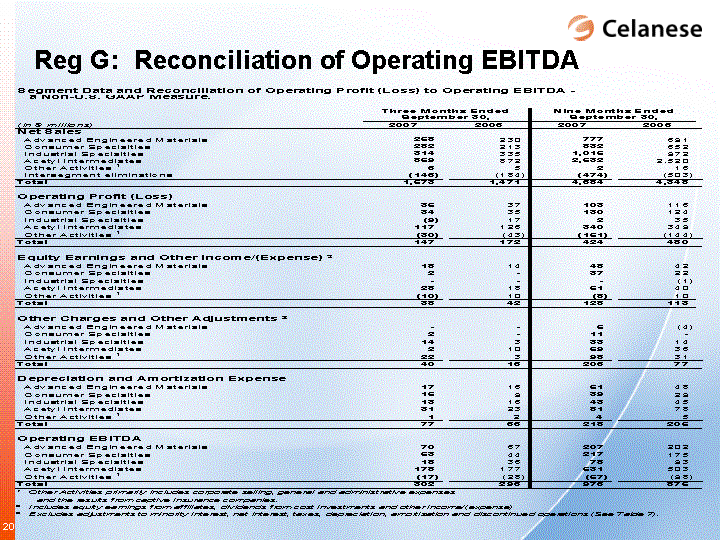
Reg G: Reconciliation of Operating EBITDA |