EXHIBIT 99.2
Celanese 2007 Investor Day December 11, 2007 St. Regis Hotel, New York |
Mark Oberle Vice President, Investor Relations and Public Affairs Introduction/Agenda |
Agenda 7:30 a.m. Registration & Continental Breakfast 8:30 a.m. Introduction/Agenda Mark Oberle, Vice President, Investor Relations and Public Affairs 8:35 a.m. Pursue. Premier. David Weidman, Chairman & CEO 9:00 a.m. Advanced Engineered Materials Sandra Beach Lin, Executive Vice President and President, Ticona 9:25 a.m. Consumer and Industrial Specialties Doug Madden, President, Acetate, AT Plastics and Emulsions & PVOH 9:50 a.m. Morning Break 10:00 a.m. Acetyl Intermediates John J. Gallagher III, Executive Vice President and President, Acetyls and Celanese Asia 10:25 a.m. Global Operational Excellence Jim Alder, Senior Vice President, Operations & Technical 10:50 a.m. Value Creation Steven Sterin, Senior Vice President and Chief Financial Officer 11:15 a.m. Closing Comments & Final Q&A David Weidman, Chairman & CEO 12:00 p.m. Luncheon Celanese Corporation 2007 Investor Day |
Forward Looking Statements, Reconciliation and Use of Non-GAAP Measures to U.S. GAAP This presentation may contain "forward-looking statements," which include information concerning the company's plans, objectives, goals, strategies, future revenues or performance, capital expenditures, financing needs and other information that is not historical information. When used in this presentation, the words "outlook," "forecast," "estimates," "expects," "anticipates," "projects," "plans," "intends," "believes," and variations of such words or similar expressions are intended to identify forward-looking statements. All forward-looking statements are based upon current expectations and beliefs and various assumptions. There can be no assurance that the company will realize these expectations or that these beliefs will prove correct. There are a number of risks and uncertainties that could cause actual results to differ materially from the forward-looking statements contained in this release. Numerous factors, many of which are beyond the company's control, could cause actual results to differ materially from those expressed as forward-looking statements. Certain of these risk factors are discussed in the company's filings with the Securities and Exchange Commission. Any forward-looking statement speaks only as of the date on which it is made, and the company undertakes no obligation to update any forward-looking statements to reflect events or circumstances after the date on which it is made or to reflect the occurrence of anticipated or unanticipated events or circumstances. This presentation reflects four performance measures, operating EBITDA, adjusted earnings per share, net debt and adjusted free cash flow as non-U.S. GAAP measures. The most directly comparable financial measure presented in accordance with U.S. GAAP in our consolidated financial statements for operating EBITDA is operating profit; for adjusted earnings per share is earnings per common share-diluted; for net debt is total debt; and for adjusted free cash flow is cash flow from operations. Operating EBITDA, a measure used by management to measure performance, is defined as operating profit from continuing operations, plus equity in net earnings from affiliates, other income and depreciation and amortization, and further adjusted for other charges and adjustments. We provide guidance on operating EBITDA and are unable to reconcile forecasted operating EBITDA to a GAAP financial measure because a forecast of other charges and other adjustments is not practical. Our management believes operating EBITDA is useful to investors because it is one of the primary measures our management uses for its planning and budgeting processes and to monitor and evaluate financial and operating results. Operating EBITDA is not a recognized term under U.S. GAAP and does not purport to be an alternative to operating profit as a measure of operating performance or to cash flow from operations as a measure of liquidity. Because not all companies use identical calculations, this presentation of operating EBITDA may not be comparable to other similarly titled measures of other companies. Additionally, operating EBITDA is not intended to be a measure of free cash flow for management's discretionary use, as it does not consider certain cash requirements such as interest payments, tax payments and debt service requirements nor does it represent the amount used in our debt covenants. Adjusted earnings per share is a measure used by management to measure performance. It is defined as net earnings (loss) available to common shareholders plus preferred dividends, adjusted for other charges and adjustments, and divided by the number of basic common shares, diluted preferred shares, and options valued using the treasury method. We provide guidance on an adjusted earnings per share basis and are unable to reconcile forecasted adjusted earnings per share to a GAAP financial measure because a forecast of other charges and other adjustments is not practical. We believe that the presentation of this non-U.S. GAAP measure provides useful information to management and investors regarding various financial and business trends relating to our financial condition and results of operations, and that when U.S. GAAP information is viewed in conjunction with non-U.S. GAAP information, investors are provided with a more meaningful understanding of our ongoing operating performance. This non-U.S. GAAP information is not intended to be considered in isolation or as a substitute for U.S. GAAP financial information. Net debt is defined as total debt less cash and cash equivalents. We believe that the presentation of this non-U.S. GAAP measure provides useful information to management and investors regarding changes to the company's capital structure. Our management and credit analysts use net debt to evaluate the company's capital structure and assess credit quality. This non-U.S. GAAP information is not intended to be considered in isolation or as a substitute for U.S. GAAP financial information. Adjusted free cash flow is defined as cash flow from operations less capital expenditures, other productive asset purchases, operating cash from discontinued operations and certain other charges. We believe that the presentation of this non-U.S. GAAP measure provides useful information to management and investors regarding changes to the company's cash flow. Our management and credit analysts use adjusted free cash flow to evaluate the company's liquidity and assess credit quality. This non-U.S. GAAP |
David N. Weidman Chairman and CEO Pursue. Premier. |
Who is Celanese? Leading Global Integrated Producer of Chemicals and Advanced Materials Execution Demonstrated track record of delivering results Strategy Clear focus on growth and value creation Culture Strong performance built on shared principles and objectives Superior Value Creation Industry Leader Geographically balanced global positions Diversified end market exposure Strong Cash Generation Significant Growth Capability Track record of execution Clearly defined opportunities |
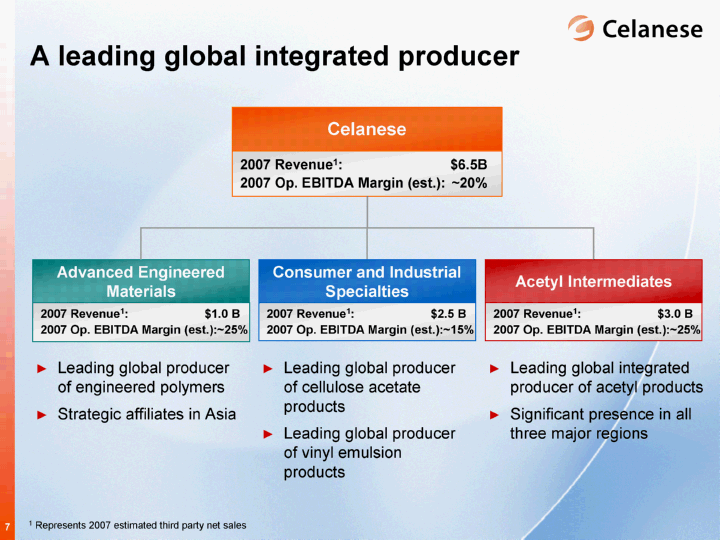
A leading global integrated producer 1 Represents 2007 estimated third party net sales Celanese 2007 Revenue1: $6.5B 2007 Op. EBITDA Margin (est.): ~20% Acetyl Intermediates Consumer and Industrial Specialties Advanced Engineered Materials Leading global producer of engineered polymers Strategic affiliates in Asia Leading global producer of cellulose acetate products Leading global producer of vinyl emulsion products Leading global integrated producer of acetyl products Significant presence in all three major regions 2007 Revenue1: $3.0 B 2007 Op. EBITDA Margin (est.):~25% 2007 Revenue1: $2.5 B 2007 Op. EBITDA Margin (est.):~15% 2007 Revenue1: $1.0 B 2007 Op. EBITDA Margin (est.):~25% |
An attractive intermediate and specialty business model Commodity Chemicals Intermediate Products Oil & Gas Consumer Products Motorola Toyota Sherwin- Williams Siemens Dow* Lyondell Methanex Rohm & Haas* ICI* Specialty Products Dow* Eastman* PPG* FMC* * Celanese internal peer group Exxon BP Shell Celanese 2001 2007 Celanese |
28% 44% 28% Geographically balanced global positions and diversified end market exposure Notes: End market breakdown based on 2007 estimated gross sales Geographic breakdown based on 2007 estimated gross sales to external customers by destination Other 10% Construction 7% Paints & Coatings 15% Automotive 9% Consumer & Medical Applications 11% Filter Media 16% Consumer & Industrial Adhesives 4% Textiles 6% Food & Beverage 5% Chemical Additives 5% Paper & Packaging 8% Performance Industrial Applications 4% |
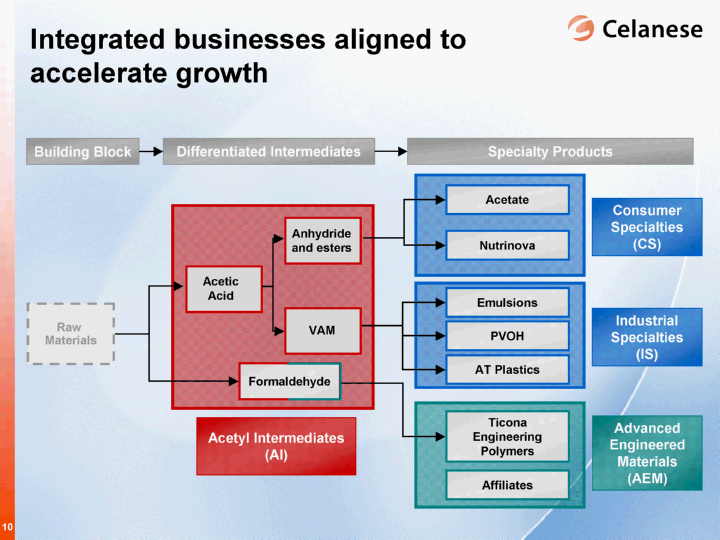
Integrated businesses aligned to accelerate growth Acetyl Intermediates (AI) Formaldehyde Differentiated Intermediates Specialty Products Building Block Raw Materials Advanced Engineered Materials (AEM) Industrial Specialties (IS) Consumer Specialties (CS) Ticona Engineering Polymers Emulsions Acetate AT Plastics Nutrinova PVOH Affiliates Acetic Acid Anhydride and esters VAM |
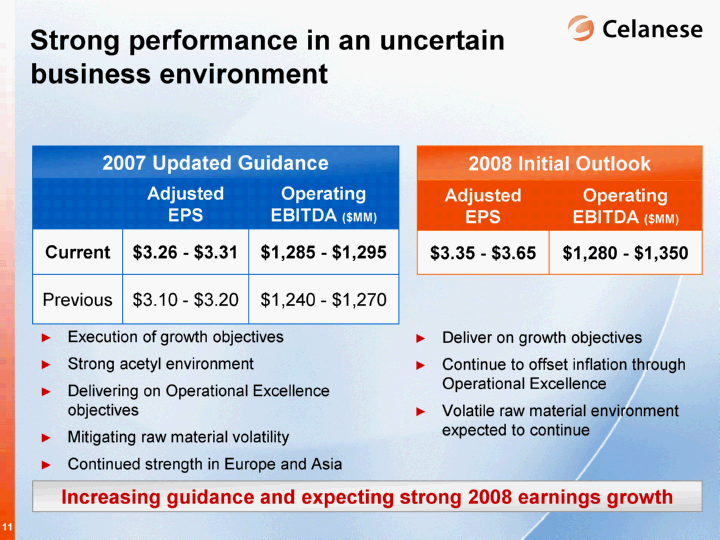
Strong performance in an uncertain business environment Execution of growth objectives Strong acetyl environment Delivering on Operational Excellence objectives Mitigating raw material volatility Continued strength in Europe and Asia 2007 Updated Guidance 2007 Updated Guidance 2007 Updated Guidance Adjusted EPS Operating EBITDA ($MM) Current $3.26 - $3.31 $1,285 - $1,295 Previous $3.10 - $3.20 $1,240 - $1,270 2008 Initial Outlook 2008 Initial Outlook Adjusted EPS Operating EBITDA ($MM) $3.35 - $3.65 $1,280 - $1,350 Deliver on growth objectives Continue to offset inflation through Operational Excellence Volatile raw material environment expected to continue Increasing guidance and expecting strong 2008 earnings growth |
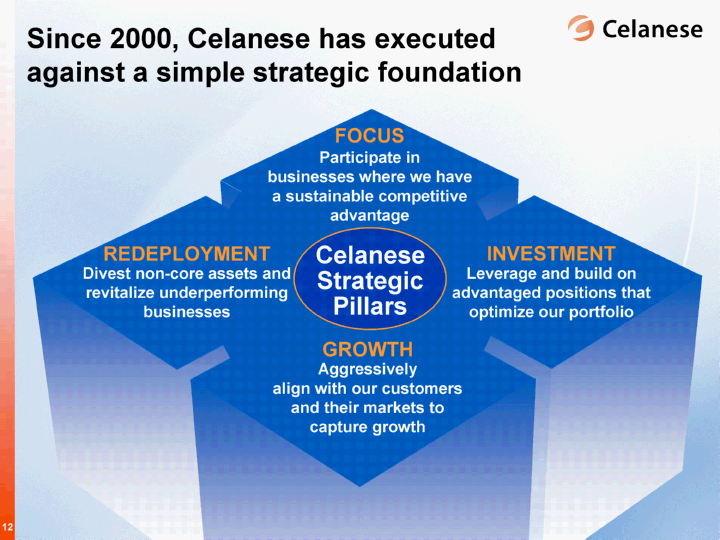
Since 2000, Celanese has executed against a simple strategic foundation Divest non-core assets and revitalize underperforming businesses Aggressively align with our customers and their markets to capture growth Participate in businesses where we have a sustainable competitive advantage Leverage and build on advantaged positions that optimize our portfolio FOCUS GROWTH REDEPLOYMENT INVESTMENT Celanese Strategic Pillars |
2000 2001 2002 2003 2004 2005 2006 2007E As Reported 0.11 0.1 0.11 0.11 0.16 0.17 0.19 0.2 Pro Forma for Current Portfolio 0.16 0.15 0.15 0.17 0.19 0.2 0.19 0.2 Operating EBITDA Margin Today's portfolio: more resilient and less volatile Current portfolio provides overall higher level of earnings Historic view with today's portfolio reflects significantly less volatility Current portfolio range: 15% - 20% Historic portfolio range: 10% - 20% One-third of portfolio is new to the company since 2000 Growth objectives will continue to bolster portfolio |
Operating EBITDA1 Today's portfolio: higher growth, more specialty Strategic growth plans continue to accelerate earnings of specialty businesses Essentially all growth has come from specialty businesses Two-thirds of 2010 Growth Objectives expected from specialty businesses Resulting in: Higher growth rates Increased overall earnings power of the portfolio Reduced volatility 2005 2007E AI 680 739 CIS 214 366 AEM 205 266 12005 and 2007E Operating EBITDA excludes Other Activities of ($122) and ~($100) respectively for the periods presented 62% 38% ~55% ~45% Acetyl Intermediates Consumer and Industrial Specialties Advanced Engineered Materials $ in millions |
$300-$350 million EBITDA Growth $350-$400 million EBITDA Growth Operational Excellence Innovation 2010 Growth Objectives are aligned with the strategic pillars Celanese 2010 Objective: Increasing 2010 Growth Objectives by $50 million to $350 - $400 million Balance Sheet Organic Revitalization Asia $140 million in estimated cost improvements Significant improvement in energy efficiency AEM: 9% volume growth Growth in 'green' applications ~$200 million debt pay down Debt refinancing to near- investment grade $400 million share repurchase AI: sustained growth and high industry utilization AEM: increased lbs. per auto APL acquisition Acquired EBITDA Realizing synergies Announced plans for Industrial Specialties Nanjing complex Launched acetic acid and emulsions units 4 units under construction Announced compounding unit AEM: direct to China CS: continued growth of Acetate venture relationships ? ? ? ? ? ? ? ? Exceeding initial expectations |
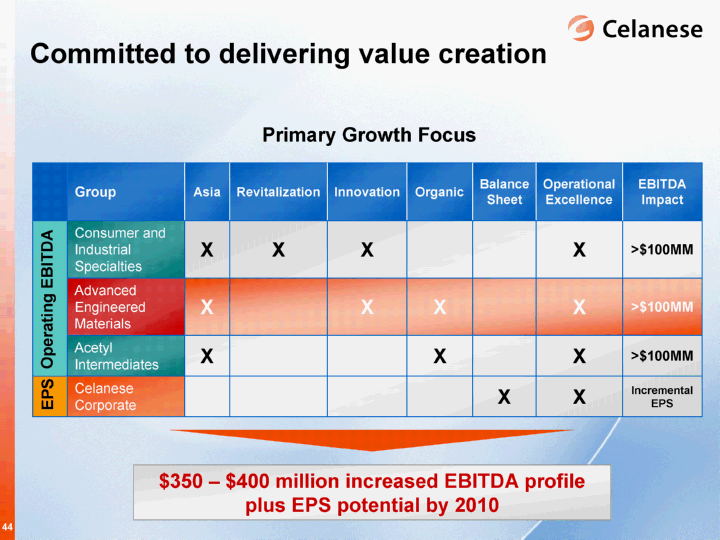
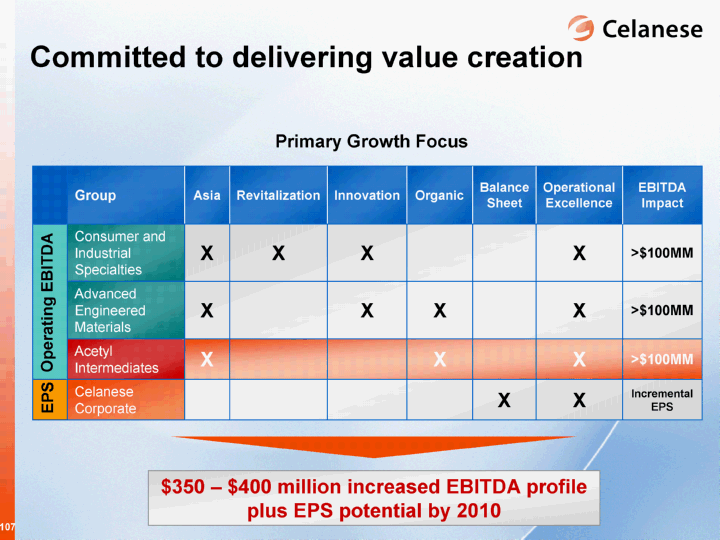
Committed to delivering value creation $350 - $400 million increased EBITDA profile plus EPS potential by 2010 Group Asia Revitalization Innovation Organic Balance Sheet Operational Excellence EBITDA Impact Consumer and Industrial Specialties X X X X >$100MM Advanced Engineered Materials X X X X >$100MM Acetyl Intermediates X X X >$100MM Celanese Corporate X X Incremental EPS Primary Growth Focus Operating EBITDA EPS |
2007 2008 2009 2010 AI 20 80 100 120 CIS 44 82 108 130 AEM 25 50 65 110 Operating EBITDA Growth Objectives On track and clear path forward to accelerate 2010 Growth Objectives AEM: volume growth > 2X GDP through further penetration CIS: Acetate continues execution on revitalization strategy; Emulsions/PVOH revitalization commences AI: Nanjing acetic acid plant startup leads integrated complex Acetyl Intermediates Consumer and Industrial Specialties Advanced Engineered Materials $ in millions |
Asia: enhancing Celanese's geographic lead Note: Revenue breakdown based on 2007 estimated net sales 1 Earnings breakdown based on 2007 estimated Operating Profit Approximately 50% of earnings from the fastest growing region 2007E Regional Split Asia East 67 33 Asia1 ~33% Asia East 72 28 Asia 28% Revenue Earnings Asia East 50 50 2010E Regional Split Asia ~50% Asia East 65 35 Asia ~35% Revenue Earnings |
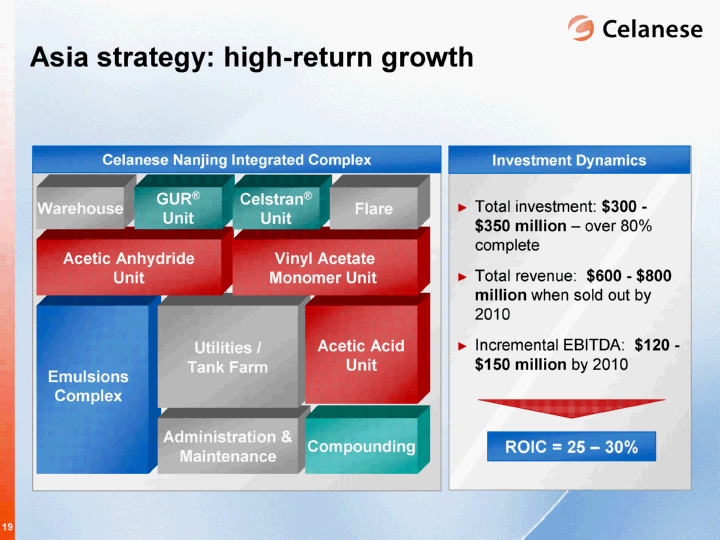
Asia strategy: high-return growth Total investment: $300 - $350 million - over 80% complete Total revenue: $600 - $800 million when sold out by 2010 Incremental EBITDA: $120 - $150 million by 2010 ROIC = 25 - 30% Investment Dynamics Emulsions Complex Administration & Maintenance Utilities / Tank Farm Compounding Acetic Acid Unit Acetic Anhydride Unit Vinyl Acetate Monomer Unit Warehouse GUR(r) Unit Celstran(r) Unit Flare Celanese Nanjing Integrated Complex |
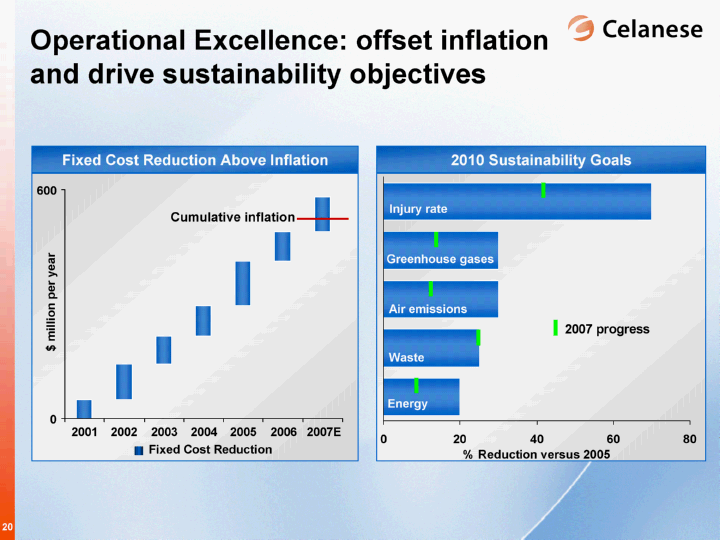
Operational Excellence: offset inflation and drive sustainability objectives 2010 Sustainability Goals Energy Waste Air emissions Greenhouse Gases Injury rate East 20 25 30 30 70 8.5 North $1 billion / year overall productivity Fixed Cost Reduction Above Inflation 0 600 2001 2002 2003 2004 2005 2006 2007E $ million per year Cumulative inflation Injury rate Greenhouse gases Air emissions Waste Energy Fixed Cost Reduction |
Enterprise Value2 Cumulative Adjusted Free Cash Flow Results have led to significant value creation 2000 2001 2002 2003 2004 2005 2006 2007E Adjusted free cash flow 156 271 144 195 184 545 458 400 Cumulative - 156 427 571 766 950 1495 1953 YE 2000 IPO Current Net debt 1071 2957 2969 Equity 971.51 2538.8 6015.56 $ in millions $ in millions 1 Adjusted free cash flow calculated as cash flow from operations less capital expenditures less other productive asset purchases less operating cash from discontinued operations plus certain other charges 2 Enterprise value represents market capitalization (Current - as of December 7, 2007) plus net debt and minority interest 1 Adjusted free cash flow Cumulative Net debt Equity |
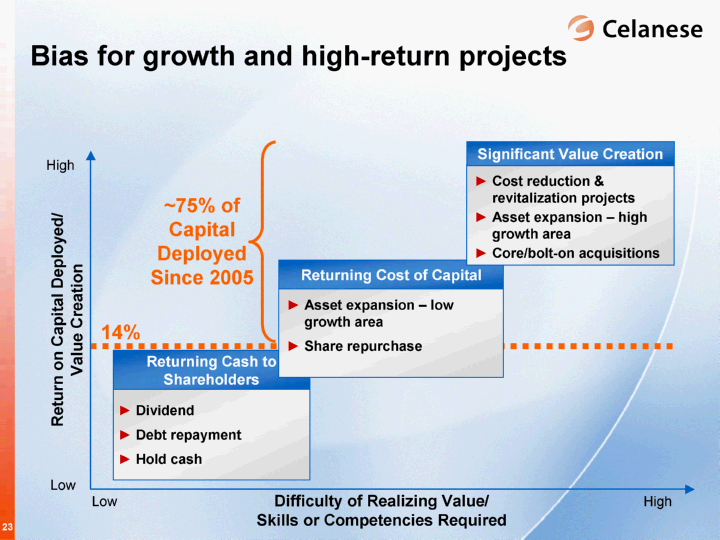
Return on Capital Deployed/ Value Creation Low High Low High Current balance sheet strategy for cash deployment Dividend Debt repayment Hold cash Returning Cash to Shareholders Difficulty of Realizing Value/ Skills or Competencies Required Return on Capital Deployed/ Value Creation Difficulty of Realizing Value/ Skills or Competencies Required Asset expansion - low growth area Share repurchase Returning Cost of Capital Cost reduction & revitalization projects Asset expansion - high growth area Core/bolt-on acquisitions Significant Value Creation |
14% Low High Low High Bias for growth and high-return projects Dividend Debt repayment Hold cash Returning Cash to Shareholders Asset expansion - low growth area Share repurchase Returning Cost of Capital Cost reduction & revitalization projects Asset expansion - high growth area Core/bolt-on acquisitions Significant Value Creation Return on Capital Deployed/ Value Creation Difficulty of Realizing Value/ Skills or Competencies Required |
Celanese core values: our DNA 47 ....a precondition... ....highest standards... ....attract, develop and retain... ....continuously learn... ....think globally... ....create growth opportunities... ....sense of urgency... ....performance driven... |
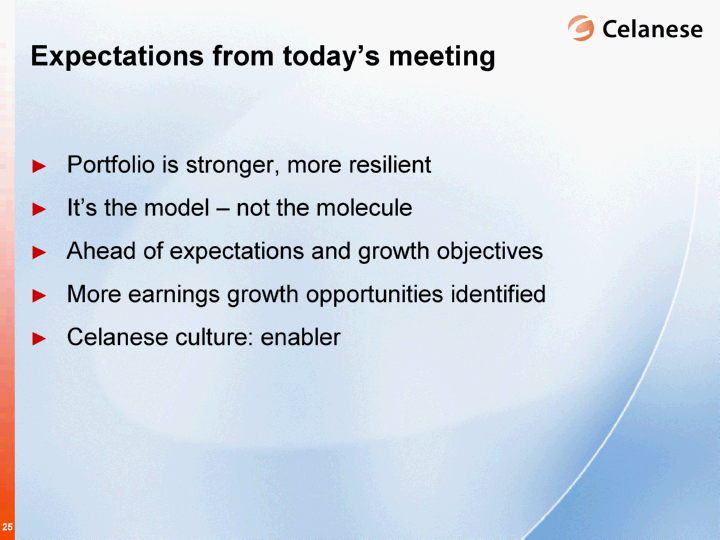
Expectations from today's meeting Portfolio is stronger, more resilient It's the model - not the molecule Ahead of expectations and growth objectives More earnings growth opportunities identified Celanese culture: enabler |
Sandra Beach Lin Executive Vice President and President, Ticona Advanced Engineered Materials |
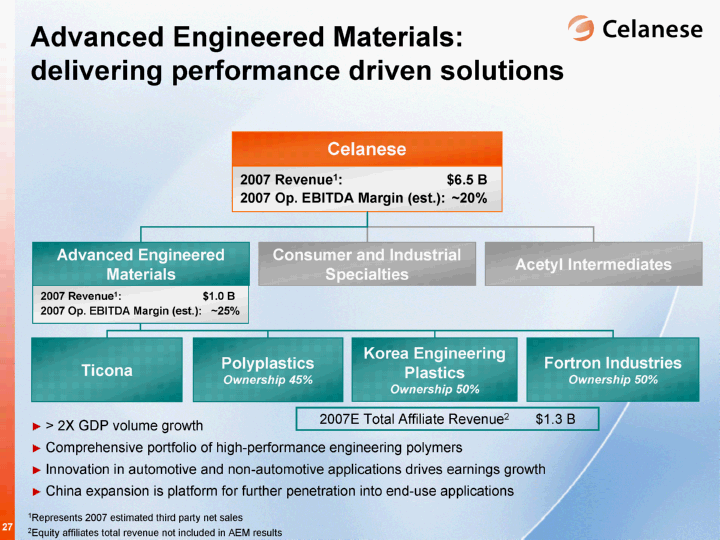
> 2X GDP volume growth Comprehensive portfolio of high-performance engineering polymers Innovation in automotive and non-automotive applications drives earnings growth China expansion is platform for further penetration into end-use applications Advanced Engineered Materials: delivering performance driven solutions Celanese 2007 Revenue1: $6.5 B 2007 Op. EBITDA Margin (est.): ~20% Acetyl Intermediates Consumer and Industrial Specialties Advanced Engineered Materials 2007 Revenue1: $1.0 B 2007 Op. EBITDA Margin (est.): ~25% Ticona 1Represents 2007 estimated third party net sales 2Equity affiliates total revenue not included in AEM results Polyplastics Ownership 45% Korea Engineering Plastics Ownership 50% Fortron Industries Ownership 50% 2007E Total Affiliate Revenue2 $1.3 B |
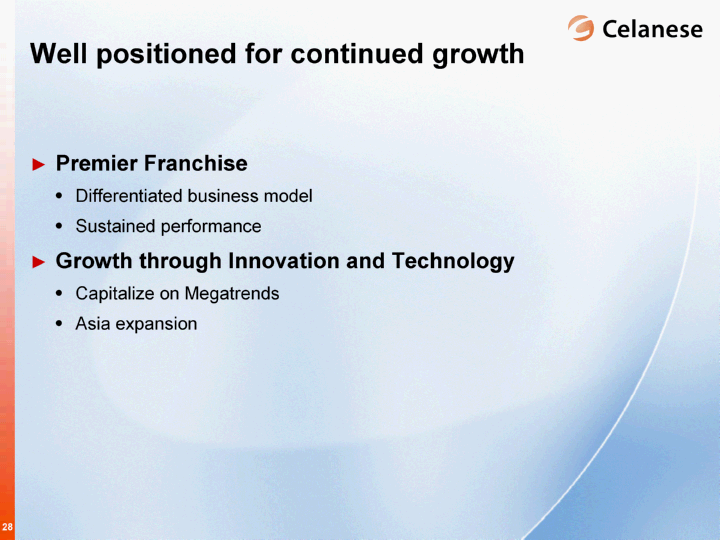
Well positioned for continued growth Premier Franchise Differentiated business model Sustained performance Growth through Innovation and Technology Capitalize on Megatrends Asia expansion |
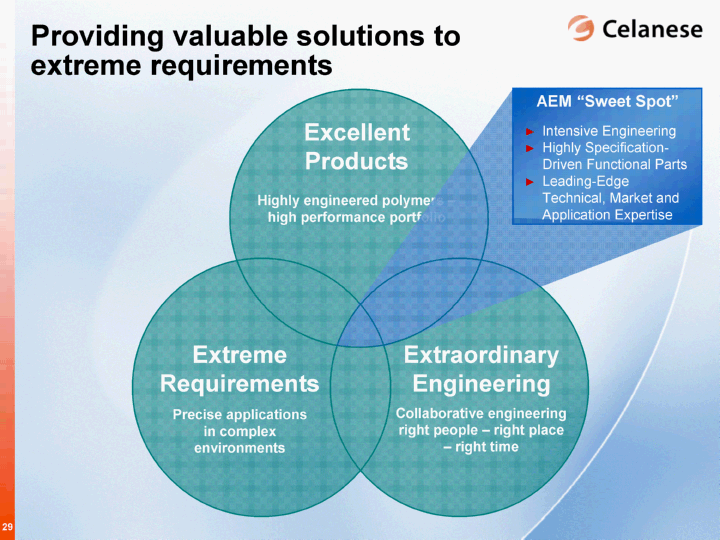
Providing valuable solutions to extreme requirements Precise applications in complex environments Extreme Requirements Highly engineered polymers - high performance portfolio Excellent Products Collaborative engineering right people - right place - - right time Extraordinary Engineering AEM "Sweet Spot" Intensive Engineering Highly Specification- Driven Functional Parts Leading-Edge Technical, Market and Application Expertise |
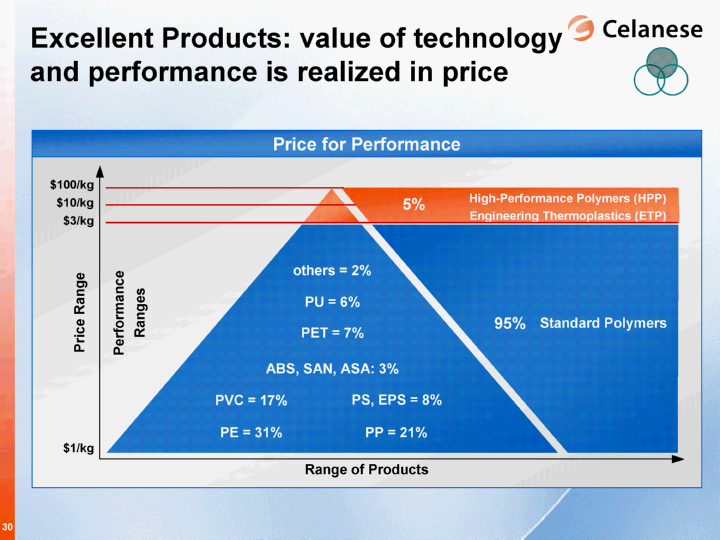
Excellent Products: value of technology and performance is realized in price $1/ kg $100 / kg $10 / kg $3 / kg Price for Performance 95% 5% Standard Polymers High-Performance Polymers (HPP) Engineering Thermoplastics (ETP) ABS, SAN, ASA: 3% PE = 31% PP = 21% PET = 7% PU = 6% PVC = 17% PS, EPS = 8% others = 2% Range of Products $1/kg $100/kg $10/kg $3/kg Price Range Performance Ranges |
^ ^ ^ ^ ^ ^ Chemical Resistance ^ ^ ^ ^ ^ Medical Grade ^ ^ ^ Abrasion Resistance ^ ^ ^ ^ ^ ^ Dielectric Strength ^ ^ ^ ^ Functional Aesthetics ^ ^ ^ ^ Extreme Temperature High performance product portfolio with attributes that customers require Fortron(r) (Polyphenylensulfide) Celstran(r) (Long fiber reinforced thermoplastics) Vectra(r) (Liquid Crystal Polymer) Celanex(r) (Polyester engineering resins) GUR(r) (Ultra-high molecular weight PE) Hostaform(r)/POM (Polyacetals) Product |
Extreme Temperature Bulk polymers PP, PE, PVC Critical Part Specification Bulk polymers PET, PEN Riteflex(r) Hostaform(r) GUR(r) Celanex Fortron(r), Vectra(r),Celstran(r) Ticona polymers (40)°F extreme cold 600°F extreme heat Continuous Use Temperature Range of Temperature Requirements |
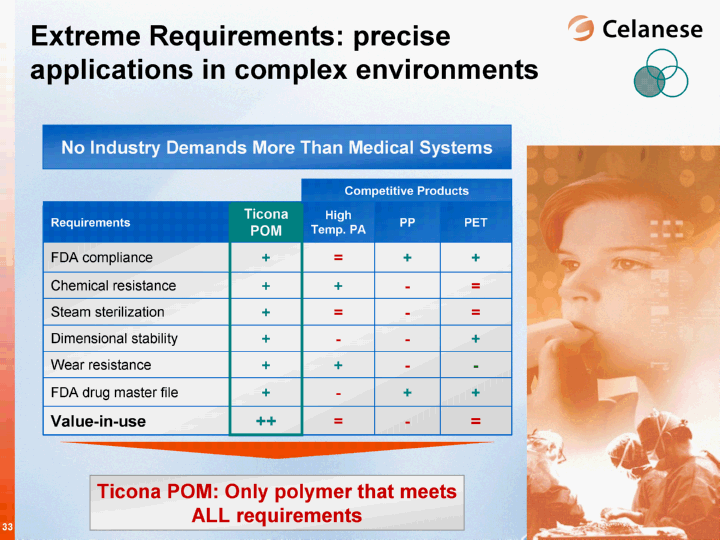
Ticona POM: Only polymer that meets ALL requirements No Industry Demands More Than Medical Systems Competitive Products Competitive Products Competitive Products Requirements Ticona POM High Temp. PA PP PET FDA compliance + = + + Chemical resistance + + - = Steam sterilization + = - = Dimensional stability + - - + Wear resistance + + - - FDA drug master file + - + + Value-in-use ++ = - = Extreme Requirements: precise applications in complex environments |
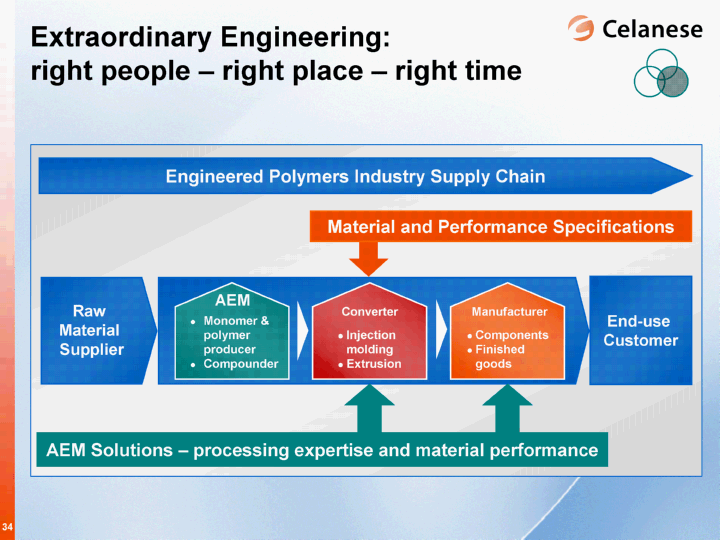
End-use Customer Extraordinary Engineering: right people - right place - right time Engineered Polymers Industry Supply Chain Raw Material Supplier AEM Solutions - processing expertise and material performance Material and Performance Specifications Monomer & polymer producer Compounder AEM Injection molding Extrusion Converter Components Finished goods Manufacturer |
OEM Specification Opportunity Generation Testing Part Design Part Validation Prototype Intellectual capital enables performance-driven solutions Modeling & Simulation Overall development cycle: 18 - 24 months ~70% of Ticona business is specification-based |
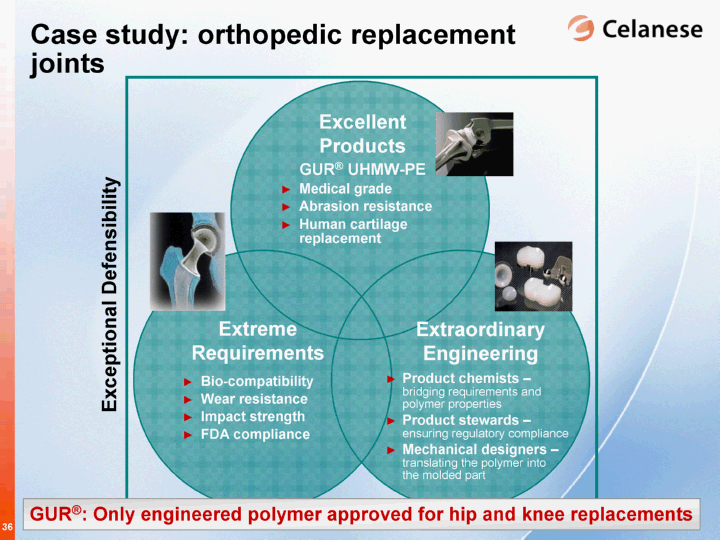
Case study: orthopedic replacement joints Exceptional Defensibility Bio-compatibility Wear resistance Impact strength FDA compliance Extreme Requirements GUR(r) UHMW-PE Medical grade Abrasion resistance Human cartilage replacement Excellent Products Product chemists - bridging requirements and polymer properties Product stewards - ensuring regulatory compliance Mechanical designers - translating the polymer into the molded part Extraordinary Engineering GUR(r): Only engineered polymer approved for hip and knee replacements |
Other 6% Broad range of end-use applications to targeted niches... 1st Qtr 2nd Qtr 3rd Qtr 4th Qtr East 47 8 12 10 12 5 6 West 30.6 38.6 34.6 31.6 North 45.9 46.9 45 43.9 Revenue by End-Use 2007E ~ $1 billion Alternate Fabrication 12% Transportation 47% Fuel systems Safety systems Mechanical components Electrical & Electronics 8% Communication systems LED lighting Connectors Consumer & Appliance 12% Water purification Durable household goods Bakeware Industrial 10% Fluid handling Gearing Drug delivery systems Medical implants Medical 5% Emissions filtration Textiles |
....requiring a consistent global brand experience China Europe Americas Application development Compound development Polymer development Testing Processing optimization Application development Compound development Polymer development Testing Injection molding Application development Compound development Testing Processing optimization |
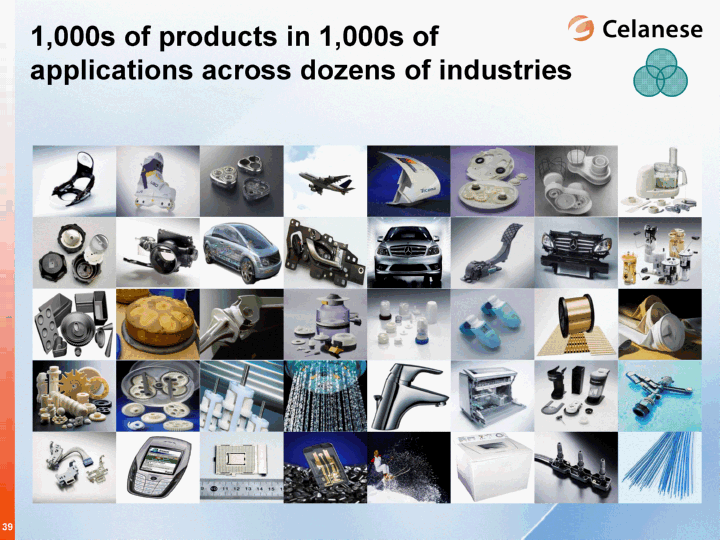
1,000s of products in 1,000s of applications across dozens of industries |
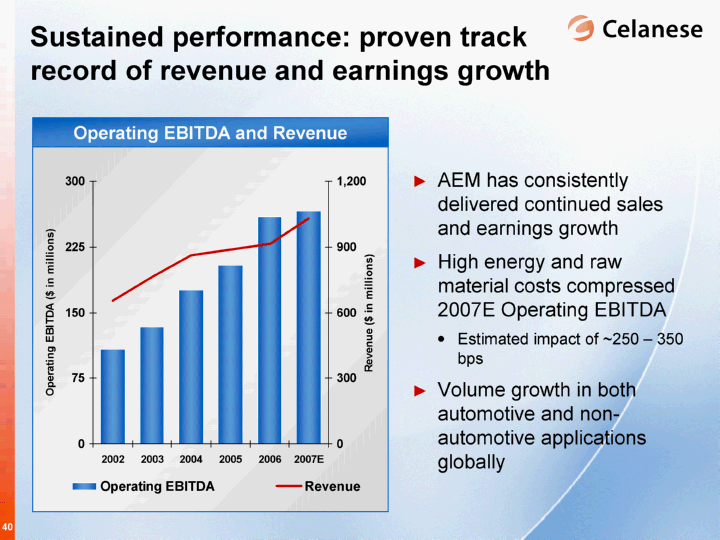
Sustained performance: proven track record of revenue and earnings growth AEM has consistently delivered continued sales and earnings growth High energy and raw material costs compressed 2007E Operating EBITDA Estimated impact of ~250 - 350 bps Volume growth in both automotive and non- automotive applications globally Operating EBITDA and Revenue 2002 2003 2004 2005 2006 2007E Operating EBITDA 108 134 176 204 260 266 Revenue 656 762 863 887 915 1031 |
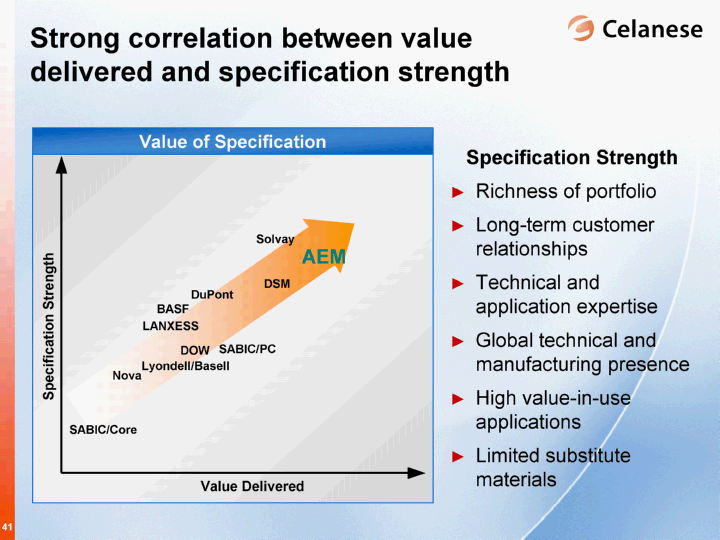
Strong correlation between value delivered and specification strength Specification Strength Richness of portfolio Long-term customer relationships Technical and application expertise Global technical and manufacturing presence High value-in-use applications Limited substitute materials Value Delivered Specification Strength LANXESS AEM DuPont SABIC/PC BASF DSM Solvay DOW Lyondell/Basell SABIC/Core Nova Value of Specification |
Premier franchise Fastest earnings growth Highest relative profitability EBITDA multiple continues to trail peers despite continued earnings strength Peer group: corresponding segments of BASF, DSM, DuPont, GE Plastics, Solvay Plastics YTD 2007 figures include one quarter of GE plastics, now SABIC/SIP AEM results exclude certain other charges, COC divestiture and equity earnings from affiliates Relative Financial Performance versus AEM Peer Group Operating Profit as a % of Sales BASF DSM DuPont Solvay GE Plastics BASF DuPont Solvay SABIC/SIP 15% 2003 YTD 2007 Celanese AEM DSM Celanese AEM |
Well positioned for continued growth Premier Franchise Differentiated business model Sustained performance Growth through Innovation and Technology Capitalize on Megatrends Asia expansion |
Committed to delivering value creation $350 - $400 million increased EBITDA profile plus EPS potential by 2010 Group Asia Revitalization Innovation Organic Balance Sheet Operational Excellence EBITDA Impact Consumer and Industrial Specialties X X X X >$100MM Advanced Engineered Materials X X X X >$100MM Acetyl Intermediates X X X >$100MM Celanese Corporate X X Incremental EPS Primary Growth Focus Operating EBITDA EPS |
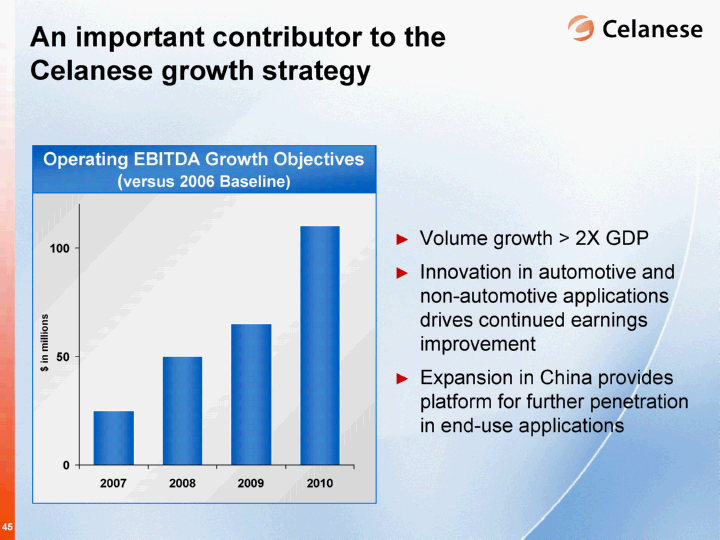
Operating EBITDA Growth Objectives (versus 2006 Baseline) An important contributor to the Celanese growth strategy Volume growth > 2X GDP Innovation in automotive and non-automotive applications drives continued earnings improvement Expansion in China provides platform for further penetration in end-use applications 2007 2008 2009 2010 AEM 25 50 65 110 $ in millions |
Power Empower sustainable technologies |
Technologies to reduce emissions and improve fuel efficiency Weight reduction Engine combustion efficiency Alternative fuels Fuel cells Hybrid-engine systems Alternative renewable fuel sources help reduce CO2 Advanced air management enhances engine combustion efficiency Development time to full commercialization |
Leading engineered polymers in emissions innovation and fuel efficiency E85 Compatible Polymers Drivers: Alternative fuels - Bio-fuels Air quality SORE emissions Legislation - environmental & safety Chemical resistance Impact resistance Dimensional stability High heat 65 million lbs. acetal in 2006 Fuel Module Hostaform(r) XF Turbocharged Engine Fortron(r) PPS Air Cooler Source: Celanese estimates Customer Requirements 80 million lbs. ETPs in 2010 |
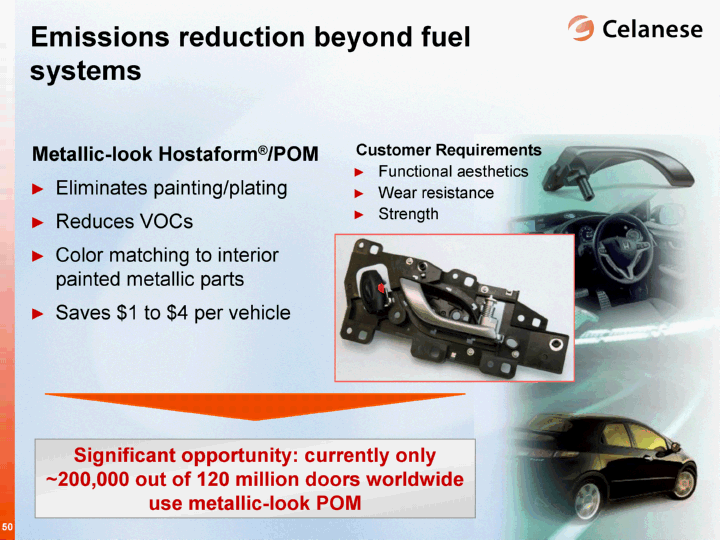
Emissions reduction beyond fuel systems Metallic-look Hostaform(r)/POM Eliminates painting/plating Reduces VOCs Color matching to interior painted metallic parts Saves $1 to $4 per vehicle Customer Requirements Functional aesthetics Wear resistance Strength Significant opportunity: currently only ~200,000 out of 120 million doors worldwide use metallic-look POM |
Safety Advance intelligent systems |
Vectra(r) LCP: Translating connector leadership into LED lighting $17.4 billion in 2017 Drivers: Improved safety Lower energy consumption Miniaturization Aesthetics Design trends LED Street Lamps Audi A8 Daytime Running Lights Audi R8 54 LEDs per Headlamp Customer Requirements High flow Low emissions Dimensional stability Pinpoint light source Source: Philips Applying Connector Expertise to New Technologies $5.1 billion in 2006 |
Life Enhance living comfort |
5.5 billion with clean water access - 2006 Shower Filter Faucet Filter Drinking Water Filter Customer Requirements NSF specification Proprietary binding agent to boost filtration efficiency GUR(r) UHMW-PE: well positioned to provide solutions for global water filtration 2000 2003 2006 2008 2010 Total Drinking Water 300 615 1177 1605 1926 Drivers: Population growth Global requirements Economical alternative to bottled water World Health Organization standards 20% GUR(r) Growth 6.1 billion with clean water access - 2015 |
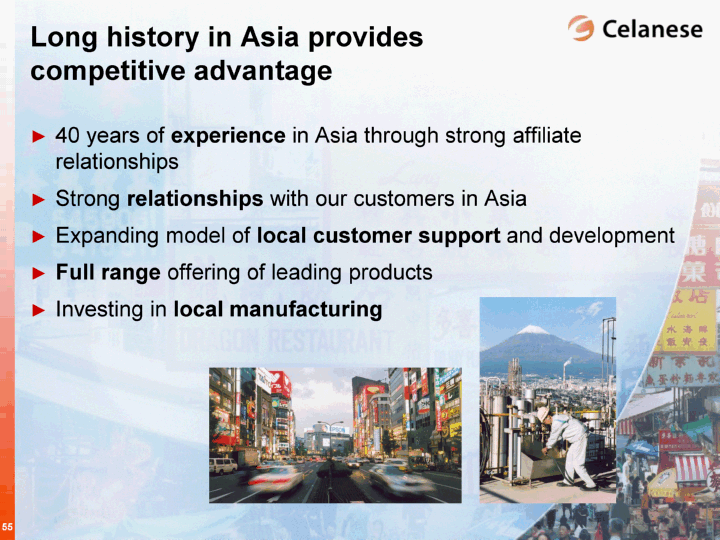
Long history in Asia provides competitive advantage 40 years of experience in Asia through strong affiliate relationships Strong relationships with our customers in Asia Expanding model of local customer support and development Full range offering of leading products Investing in local manufacturing 109 |
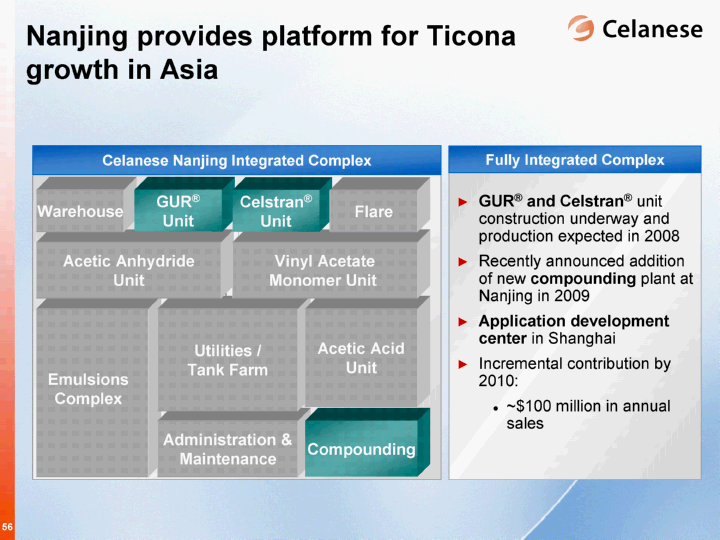
GUR(r) and Celstran(r) unit construction underway and production expected in 2008 Recently announced addition of new compounding plant at Nanjing in 2009 Application development center in Shanghai Incremental contribution by 2010: ~$100 million in annual sales Fully Integrated Complex Emulsions Complex Administration & Maintenance Utilities / Tank Farm Compounding Acetic Acid Unit Acetic Anhydride Unit Vinyl Acetate Monomer Unit Warehouse GUR(r) Unit Celstran(r) Unit Flare Celanese Nanjing Integrated Complex Nanjing provides platform for Ticona growth in Asia |
2,100 GW coal-fired power in 2020 Customer Requirements Chemical resistance High heat Technologies to reduce particulate emissions: coal-fired power plants Drivers: Increased global power consumption More coal-fired power plants Air quality Environmental legislation Fortron(r) PPS Air Filter Bags Coal-fired Power Plant Coal-fired Power Plant Air Filter System 1,300 GW coal-fired power in 2006 |
Coal-fired power plants provide significant growth opportunity Characteristics of filter bags Typically 6 inches in diameter and 26 feet in length Up to 20,000 bags used per house Life span of 3 to 5 years Filter bags contain an average of 4.0 to 4.5 lbs. of Fortron(r) PPS Electricity from coal in China will increase more than 80% by 2020 2006: 413 GW coal-fired power 2020: 760 GW coal-fired power Flue Gas Cleaning Bag House for Coal-fired Power Plants |
China Current Highest Current Model 2010E 2007E 2001 Lbs/ car 60 2.5 40 18 13 6 Source: Global Insight Pounds per Vehicle Source: Celanese Estimates Significant opportunity for increased penetration in high growth region 2006 Production Production Growth 2006-2012 Mexico 1955 312 Canada 2496.9 176.3 Spain 2677.9 61.4 Brazil 2275.8 923.8 France 3111.4 102.8 S. Korea 3797.4 180.6 India 1692.9 2748.4 Germany 5634.6 732.4 U.S. 10813.7 -86.7 Japan 11075.7 -152.9 China 6667.1 5912.3 China production nearly doubles within 5 years Trend Global Auto Production 2001 2010E Highest Current Model China Current 2007E Advanced Engineered Materials Type of Resins |
Translating auto application expertise to Asia Door Systems Window lifts Door locks Door modules Power motor housings Fuel Delivery Systems Fuel reservoirs Fuel limit valves Roll-over valves Fuel flanges Fuel pumps Structural Parts Front-end modules Instrument panels Sunroof systems Select Interior Components Instrument clusters Metallic-look controls Safety restraints Overhead consoles |
Application development requirement: a global network to serve global demand Application Development Center Frankfurt New Application Development Center Shanghai Application Development Centers Florence, KY Auburn Hills, MI |
Industry recognition of innovation Winner Of SPE 2007 Grand Innovation Award Mercedes-Benz C-Class Vectra(r) LCP active safety sensor Detects moisture, activates wipers, dries brakes Winner Of SPE Innovation Award BMW X5 Celstran(r) LFRT fender carrier Strong, lightweight |
AEM is well positioned for continued growth Premier Franchise Differentiated business model Sustained performance Growth through Innovation and Technology Capitalize on Megatrends Asia expansion |
Doug Madden President, Acetate, AT Plastics and Emulsions & PVOH Consumer and Industrial Specialties |
Consumer and Industrial Specialties: value-added specialty businesses Celanese 2007 Revenue1: $6.5 B 2007 Op. EBITDA Margin (est.): ~20% Acetyl Intermediates Consumer and Industrial Specialties Advanced Engineered Materials 2007 Revenue1: $2.5 B 2007 Op. EBITDA Margin (est.): ~15% Industrial Specialties Leading global positions in both businesses Significant consumers of Acetyl Intermediates products Downstream integration mitigates raw material volatility GDP+ growth Consumer Specialties 2007 Revenue1: $1.4 B 2007 Op. EBITDA Margin (est.): ~8% 2007 Revenue1: $1.1 B 2007 Op. EBITDA Margin (est.): ~25% 1Represents 2007 estimated third party net sales |
Group Asia Revitalization Innovation Organic Balance Sheet Operational Excellence EBITDA Impact Consumer and Industrial Specialties X X X X >$100MM Advanced Engineered Materials X X X X >$100MM Acetyl Intermediates X X X >$100MM Celanese Corporate X X Incremental EPS Operating EBITDA EPS Committed to delivering value creation $350 - $400 million increased EBITDA profile plus EPS potential by 2010 Primary Growth Focus |
Operating EBITDA Growth Objectives (versus 2006 Baseline) CIS: path to improved earnings Ahead of schedule to deliver > $100 million in additional EBITDA Consumer Specialties Successful completion of Acetate revitalization Integration of Acetate Products Limited (APL) acquisition Industrial Specialties Revitalization of emulsions and PVOH businesses Innovation in key customer applications Globalization in emerging economies 2007 2008 2009 2010 Consumer Specialties 44 65 70 70 Industrial Specialties 0 17 38 60 $ in millions >$100 million by 2009 |
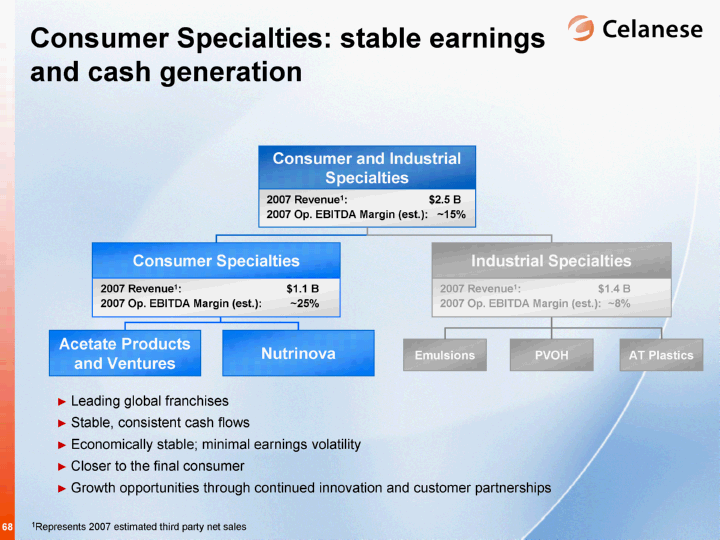
Consumer Specialties: stable earnings and cash generation Acetate Products and Ventures Nutrinova PVOH Emulsions AT Plastics Consumer and Industrial Specialties 2007 Revenue1: $2.5 B 2007 Op. EBITDA Margin (est.): ~15% Industrial Specialties Leading global franchises Stable, consistent cash flows Economically stable; minimal earnings volatility Closer to the final consumer Growth opportunities through continued innovation and customer partnerships Consumer Specialties 2007 Revenue1: $1.4 B 2007 Op. EBITDA Margin (est.): ~8% 2007 Revenue1: $1.1 B 2007 Op. EBITDA Margin (est.): ~25% 1Represents 2007 estimated third party net sales |
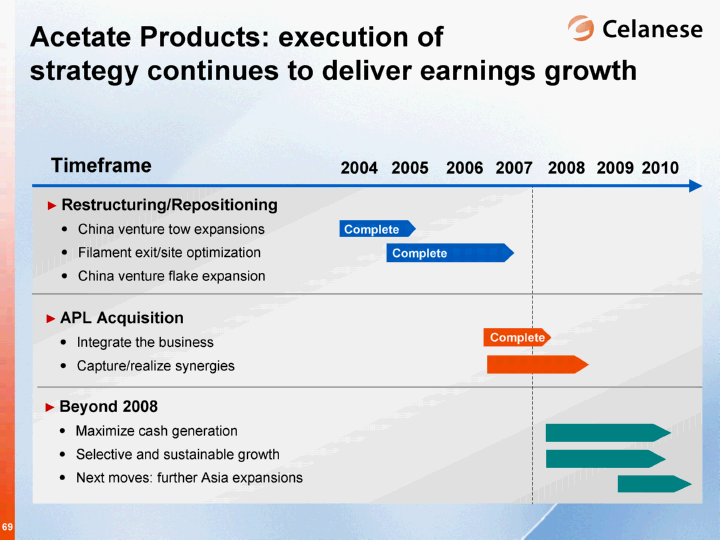
Acetate Products: execution of strategy continues to deliver earnings growth Timeframe APL Acquisition Integrate the business Capture/realize synergies 2004 2005 2006 2007 2008 2009 Restructuring/Repositioning China venture tow expansions Filament exit/site optimization China venture flake expansion Complete Complete Complete Beyond 2008 Maximize cash generation Selective and sustainable growth Next moves: further Asia expansions 2010 |
Successful revitalization and strategy progress for Acetate Products Significant improvement to manufacturing cost structure Consolidated manufacturing footprint to lower-cost regions Closed the Edmonton flake plant in 1Q 2007 Completed planned China venture expansions - more than doubled Expanded flake plant in 2Q 2007 Increased dividend flow in 2007 and 2008E Acquired cellulose acetate flake, tow and film business of APL - adding ~$250 million in revenue North America 2005 North America 2008E Europe 2005 Europe 2008E China Ventures 2005 to 2008E Flake 4 sites 2 sites 0 sites 1 site Expanded Tow 3 sites 2 sites 1 site 2 sites Expanded Filament 2 sites Fully exited Optimized Operations and Market Focus |
Benefits to Celanese Acetate Products Limited APL Acquisition: a strategic fit Acquired cellulose acetate flake, tow and film business of APL Purchase price ~$110 million Additional $30 million for synergies 2 U.K. manufacturing facilities: Spondon Little Heath - Closed 3Q 2007 Customers - Broadens mix and reach Integration - Enables European flake production Captive consumption - Increases downstream integration Procurement and logistics - Network enhancements Synergies - Full capture by 2008 2006 2008 Purchased EBITDA 20 20 Synergies 0 20 Acquisition Synergies Purchased EBITDA ~$20 million ~$20 million ~$20 million Manufacturing SG&A Logistics |
Acetate Products: optimized global manufacturing footprint Tow Production Flake Production Nantong, China Lanaken, Belgium Spondon, United Kingdom Narrows, Virginia Ocotlan, Mexico Kunming, China Zhuhai, China Only integrated producer in each region of the world |
Asia Europe Americas ROW Total CE 0.47 0.42 0.3 0.6 0.43 Others 0.53 0.58 0.7 0.4 0.57 Celanese Share of Global Acetate Tow Market (2007E) CAGR 2005 - 2010E 2 - 3% 1 - 2% (1 - 2)% 1 - 2% Strategically positioned for further expansion in growth regions 1Includes share attributable to China ventures Source: Celanese estimates Global Market Size: ~720kt 1 1 Global Acetate Tow Market by Region (2007E) Asia Europe Americas ROW North 0.51 0.3 0.15 0.04 |
CS Operating EBITDA 2004 - 2010E 2004 2005 2006 2007E 2008E 2009E 2010E Perf. Prod. Seg. EBITDA 55 63 65 67 64 58 58 Acetate Seg. EBITDA 77 77 77 77 77 77 77 North America/EU Revitalization 0 17 62 71 64 75 75 APL 20 40 41 41 JV Dividends 6 4 24 38 42 47 47 Consumer Specialties: successful revitalization and continued execution of current strategy Acetate Products revitalization completed in 2007 Full synergy capture of APL acquisition by 2008 Nutrinova to offset price declines with volume increases Modest growth beyond 2008: Growth in Asia continues at 2-3% per year Sustainable Operating EBITDA 1Dividends from cost investments Asian Growth1 Growth Objective Nutrinova Operating EBITDA Acetate Base Operating EBITDA European Initiative North America/Europe Revitalization |
Industrial Specialties: integrated technology solutions Acetate Products and Ventures Nutrinova Consumer and Industrial Specialties 2007 Revenue1: $2.5 B 2007 Op. EBITDA Margin (est.): ~15% Industrial Specialties Significant consumer of Acetyl Intermediates products Earnings improvement through revitalization Growth opportunities through continued innovation and globalization Consumer Specialties 2007 Revenue1: $1.4 B 2007 Op. EBITDA Margin (est.): ~8% 2007 Revenue1: $1.1 B 2007 Op. EBITDA Margin (est.): ~25% 1Represents 2007 estimated third party net sales PVOH Emulsions AT Plastics |
Profit Added Through Chain Production and Market Driven Profit Range per Ton of Acetic Acid Increased Value Acid Margin Sell Acid as VAM Technology and Customer Driven Integrated model captures value and mitigates volatility Reduced Volatility Peak 9 Average 30 Trough 37 Earnings Improvement per Ton of Acetic Acid ~30% Cycle volatility reduction ~10% ~35% Acetyls versus Integrated Downstream Sell VAM as VAE Total Margin Available Higher overall earnings through integrated chain Lower earnings volatility with downstream integration |
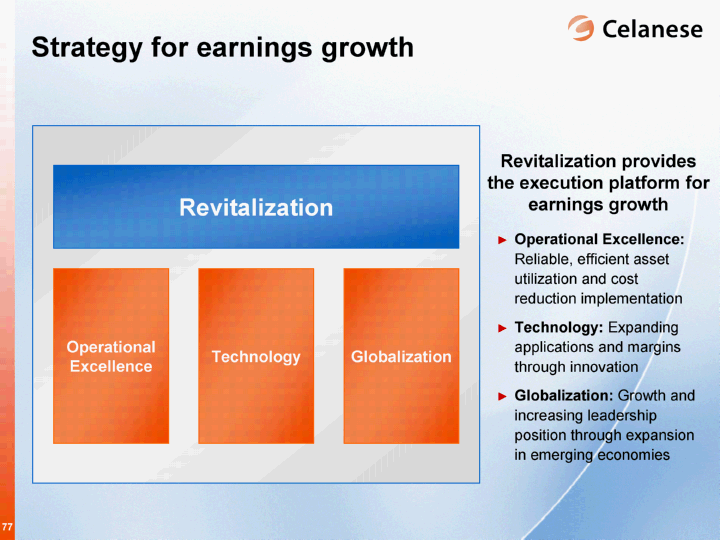
Strategy for earnings growth Operational Excellence Technology Globalization Revitalization Operational Excellence: Reliable, efficient asset utilization and cost reduction implementation Technology: Expanding applications and margins through innovation Globalization: Growth and increasing leadership position through expansion in emerging economies Revitalization provides the execution platform for earnings growth |
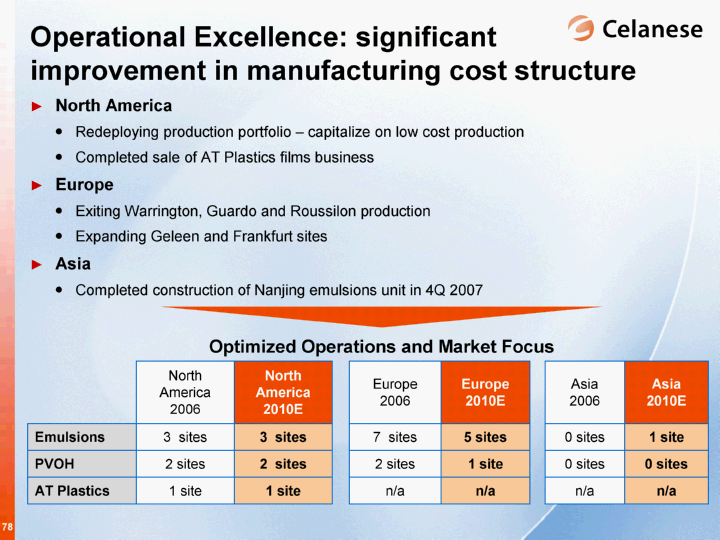
Operational Excellence: significant improvement in manufacturing cost structure North America Redeploying production portfolio - capitalize on low cost production Completed sale of AT Plastics films business Europe Exiting Warrington, Guardo and Roussilon production Expanding Geleen and Frankfurt sites Asia Completed construction of Nanjing emulsions unit in 4Q 2007 North America 2006 North America 2010E Europe 2006 Europe 2010E Asia 2006 Asia 2010E Emulsions 3 sites 3 sites 7 sites 5 sites 0 sites 1 site PVOH 2 sites 2 sites 2 sites 1 site 0 sites 0 sites AT Plastics 1 site 1 site n/a n/a n/a n/a Optimized Operations and Market Focus |
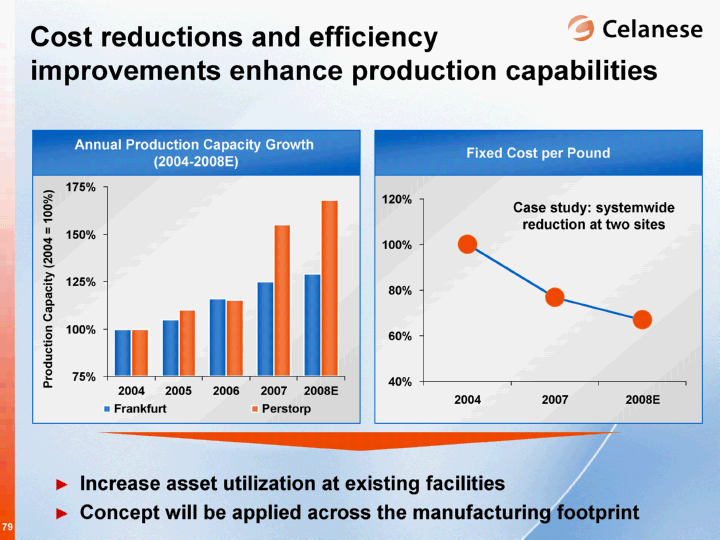
Fixed Cost per Pound Annual Production Capacity Growth (2004-2008E) 2004 2005 2006 2007 2008E Frankfurt 1 1.05 1.16 1.25 1.29 Perstorp 1 1.1 1.15 1.55 1.68 Cost reductions and efficiency improvements enhance production capabilities Production Capacity (2004 = 100%) 2004 2007 2008E 1 0.766 0.67 Increase asset utilization at existing facilities Concept will be applied across the manufacturing footprint Case study: systemwide reduction at two sites |
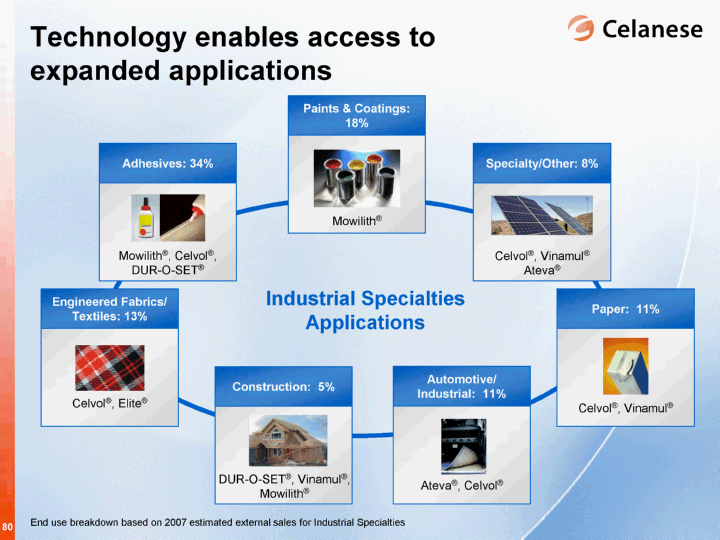
Technology enables access to expanded applications Industrial Specialties Applications Engineered Fabrics/ Textiles: 13% Celvol(r), Elite(r) Paints & Coatings: 18% Mowilith(r) Specialty/Other: 8% Celvol(r), Vinamul(r) Ateva(r) Paper: 11% Celvol(r), Vinamul(r) Construction: 5% DUR-O-SET(r), Vinamul(r), Mowilith(r) Automotive/ Industrial: 11% Ateva(r), Celvol(r) Mowilith(r), Celvol(r), DUR-O-SET(r) Adhesives: 34% End use breakdown based on 2007 estimated external sales for Industrial Specialties |
2006 2010E Others 2.294 3.041 Celanese 0.86 1.14 Global Vinyl Emulsions Applications Driving 2010 Growth Others Celanese Technology enhancements open $1.0 billion of new opportunities $ in billions Applications 2010E Application Sales ($MM) Growth Rate Low VOC and nano paints $400 - $500 10+% Engineered fabrics/glass fiber $200 - $300 3% - 5% Enviro-friendly adhesives $100 - $200 8% China building/ construction $100 - $200 30+% ~25% $1.0 billion expansion = >$250 million in revenue ~30% increase in vinyl space >25% |
European Interior Paint Industry Development Case study: Celanese is the global leader in low-emission binders European success driven by increasing consumer awareness and regulatory requirements of low-VOC products Celanese technology position: clear leader 1996 2006 2010E Celanese 0.02 0.25 0.33 Others 0.03 0.03 European VAE Success VAE Share of Interior Paints 1990 2006 VOC Content EU VOC parts/liter |
Current trends in U.S. following European precedent In 2008, Southern California will further restrict emission requirements in paints Today, less than 25% of the interior paints meet the contemplated guidelines $100 - $2001 per ton estimated cost for non-VAE emulsions to achieve standard U.S. interior paint opportunity ~$1.0 billion VAE provides favorable substitution for low-VOC requirements 1999 2008 US VOC grams/liter 1999 VOC (g/L): 250 - 380 2004 VOC (g/L): 100 - 150 VOC Regulatory Trends for Flat to Semi-Gloss Paints VAE industry opportunity: current regulatory trends in U.S. 1 Based on Celanese estimates European Standard |
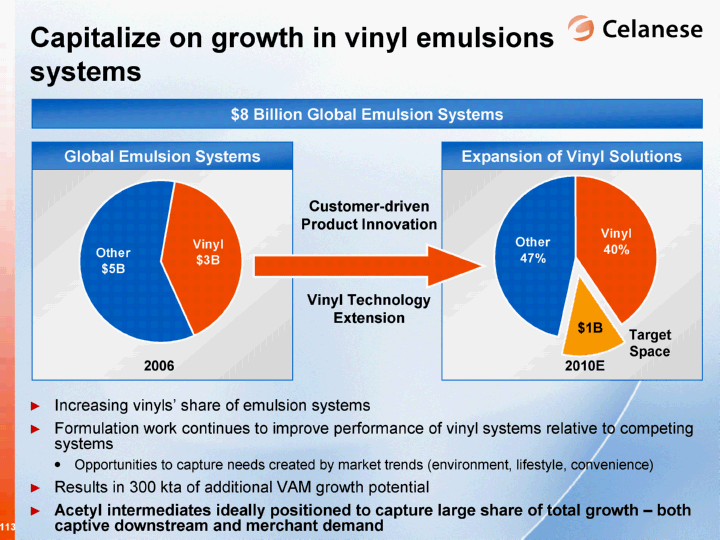
Technology provides access to new applications and improves earnings profile Expanding the available application space Anticipating the future needs of a changing world Creating opportunities for favorable substitution and improved product mix Vinyl Other 3154 4630 Vinyl Target Space Other 3154 1000 3630 $8 Billion Global Emulsion Systems Target Space Customer-driven Product Innovation Vinyls Technology Extension Global Emulsion Systems Expansion of Vinyl Solutions 2010E 2006 $1B |
Globalization: significant opportunities in high growth regions Percent of Celanese Emulsions Net Sales1 by Region 37% 62% 1% 1 Based on 2006 sales |
Estimated Regional Balance - 2010 Percent of Celanese Emulsions Net Sales1 by Region 30 - 35% 50 - 55% 15+% 1 Based on Celanese estimates |
Nanjing allows Celanese to capture significant growth in Asia 60 wet kt capacity Construction completed in October 2007 Commercial sales underway Primary supply for customer locations in China and the rest of Asia Application development center in Shanghai Fully Integrated Complex Emulsions Complex Celanese Nanjing Integrated Complex Industrial Specialties Nanjing Phase 1 Administration & Maintenance Utilities / Tank Farm Compounding Acetic Acid Unit Acetic Anhydride Unit Vinyl Acetate Monomer Unit Warehouse GUR(r) Unit Celstran(r) Unit Flare |
2005 2010E Other Systems 1.8245 3.096 Vinyl Systems 0.4593 1.093 Significant growth expected in China vinyl systems Industry trends driving significant growth in China Vinyl systems growing faster than other systems $ in billions 19% Growth 11% Growth Adhesives Coatings Construction Nonwovens Size of China Market 330 444 170 115 Annual Growth Rate 0.12 0.13 0.3 0.09 12+% 13+% 30+% 10+% Other Systems Vinyl Systems System Applications and Growth Rates for China China Latex Demand Source: Kline and Celanese estimates |
2006 2007E 2008E 2009E 2010E 183 395 0.03 0.08 0.14 Nanjing provides platform for vinyl systems growth in China through VAE VAE industry in China growing at ~20% Began commercial sales in 2006 Nanjing unit operational in 2007 Capturing growth at faster- than-expected rate Objective by 2010: ~25% of fast growing industry China VAE Celanese Share Projected ~20% CAGR China VAE |
Other emerging economies... the next frontier for emulsions 1985 1995 2005 2015 2025 Low 6 194 315 363 339 Middle 0.5 24 73 363 993 Upper 0.5 12 24 97 339 India: Our next focus of expansion India is poised to significantly grow its middle class Rising wealth and consumption will drive vinyl product demand at even greater rates India and China represent over 30% of the global population $ in millions Source: McKinsey&Co. 2007 1995 2005 2015 2025 Housing & Personal 291 457 814 1442 USD Income Groups 2005 - 2025 CAGR: 6% Housing and Personal: India Average Consumption India Aggregate Consumption |
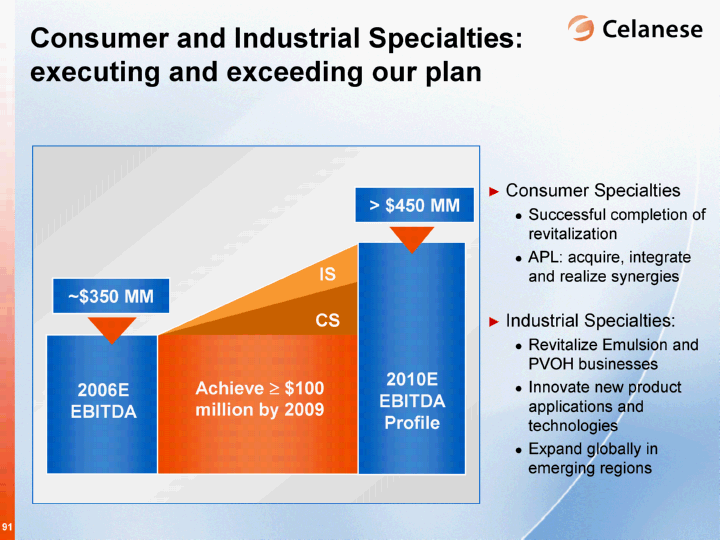
Consumer and Industrial Specialties: executing and exceeding our plan ~$350 MM > $450 MM 2010E EBITDA Profile Achieve ? $100 million by 2009 2006E EBITDA CS IS Consumer Specialties Successful completion of revitalization APL: acquire, integrate and realize synergies Industrial Specialties: Revitalize Emulsion and PVOH businesses Innovate new product applications and technologies Expand globally in emerging regions |
John Gallagher Executive Vice President and President, Acetyls and Celanese Asia Acetyl Intermediates |
Acetyl Intermediates: leading global franchise of intermediate products 1Represents 2007 estimated third party net sales Celanese 2007 Revenue1: $6.5 B 2007 Op. EBITDA Margin (est.): ~20% Acetyl Intermediates Consumer and Industrial Specialties Advanced Engineered Materials 2007 Revenue1: $3.0 B 2007 Op. EBITDA Margin (est.): ~25% Leading global position in each product GDP+ growth in each business Strong and growing position in Asia Continuous improvement on favorable raw material supply positions globally Significant advantages in technology, operating costs and capital costs Acetic Acid Acetic Anhydride Vinyl Acetate Monomer Acetate Esters and Other Derivatives |
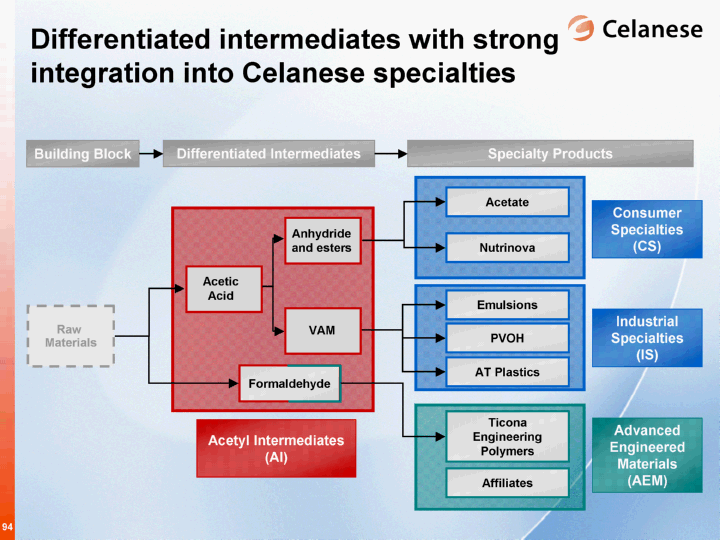
Differentiated intermediates with strong integration into Celanese specialties Acetyl Intermediates (AI) Formaldehyde Acetic Acid Differentiated Intermediates Specialty Products Building Block Raw Materials Advanced Engineered Materials (AEM) Industrial Specialties (IS) Anhydride and esters Consumer Specialties (CS) Ticona Engineering Polymers Emulsions Acetate AT Plastics Nutrinova PVOH Affiliates VAM |
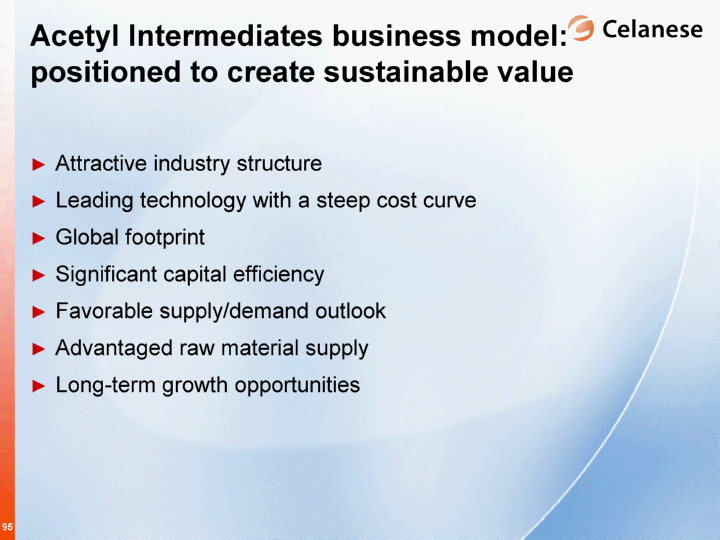
Acetyl Intermediates business model: positioned to create sustainable value Attractive industry structure Leading technology with a steep cost curve Global footprint Significant capital efficiency Favorable supply/demand outlook Advantaged raw material supply Long-term growth opportunities |
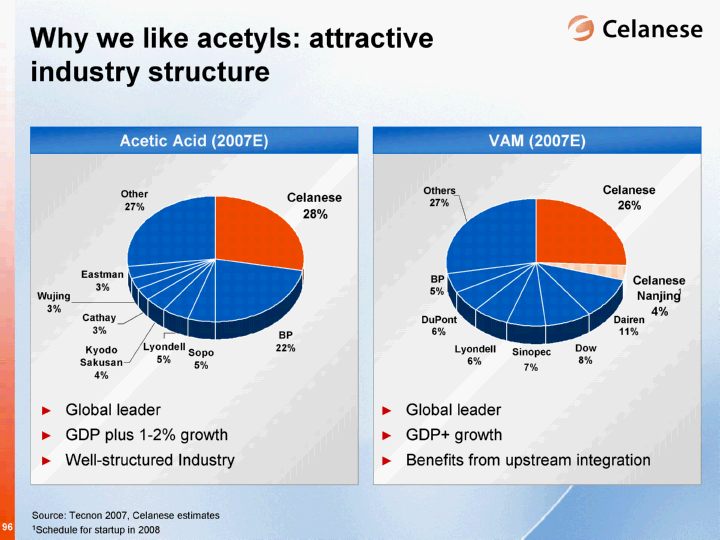
VAM Acetic Acid (2007E) Why we like acetyls: attractive industry structure Global leader GDP plus 1-2% growth Well-structured Industry Source: Tecnon 2007, Celanese estimates 1Schedule for startup in 2008 Global leader GDP+ growth Benefits from upstream integration VAM (2007E) 1 Dairen 11% Celanese 26% Celanese Nanjing 4% Dow 8% Sinopec 7% DuPont 6% Others 27% BP 5% Lyondell 6% |
Celanese technology drives leading operating costs Source: Celanese estimates, available public data 2010E Acetic Acid Cost Curve (kt) (based on nameplate capacity) By- prod High Cost Supply Celanese Technology 0 2,000 4,000 6,000 8,000 10,000 14,000 Conventional MeOH/CO AOPlus(tm)/Leading Competition Ethanol Ethylene 12,000 High-cost technology ~2.0 to 2.5X higher production cost versus leading technology Conventional methanol carbonylation technology ~20-30% higher cost Celanese technology: a long-term competitive advantage |
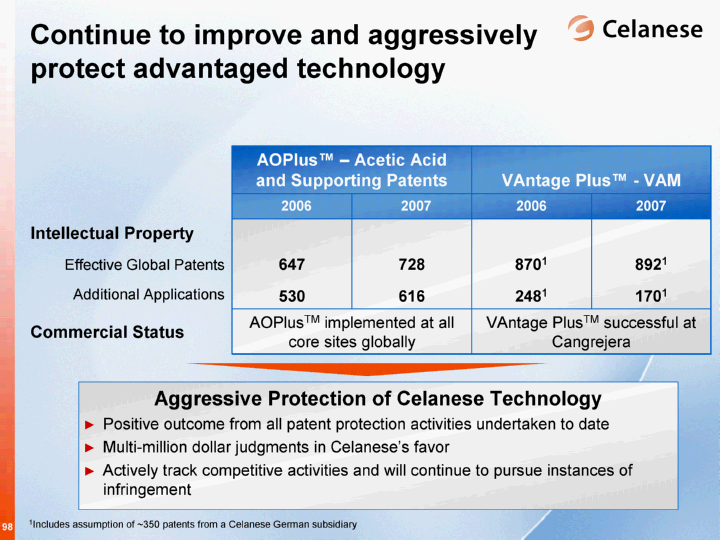
Aggressive Protection of Celanese Technology Positive outcome from all patent protection activities undertaken to date Multi-million dollar judgments in Celanese's favor Actively track competitive activities and will continue to pursue instances of infringement Continue to improve and aggressively protect advantaged technology AOPlus(tm) - Acetic Acid and Supporting Patents AOPlus(tm) - Acetic Acid and Supporting Patents VAntage Plus(tm) - VAM VAntage Plus(tm) - VAM 2006 2007 2006 2007 Intellectual Property Effective Global Patents Additional Applications 647 530 728 616 8701 2481 8921 1701 Commercial Status AOPlusTM implemented at all core sites globally AOPlusTM implemented at all core sites globally VAntage PlusTM successful at Cangrejera VAntage PlusTM successful at Cangrejera 1Includes assumption of ~350 patents from a Celanese German subsidiary |
A global footprint positioned to capture emerging demand Americas Europe Asia Acetic Acid 1,490 440 1,200 VAM 725 635 510 Anhydride 235 30 100 Esters 165 40 130 All values shown in kt per year 1Startup schedule for 2008 Singapore Acid = 600 VAM = 210 Esters = 130 Frankfurt, Germany VAM = 285 Esters = 40 Tarragona VAM = 200 Bay City, TX VAM = 300 Clear Lake, TX Acid = 1,200 VAM = 310 Cangrejera, Mexico VAM = 115 Anhydride = 90 Esters = 105 Pardies, France Acid = 440 VAM = 150 Anhydride = 30 Nanjing, China Acid = 600 VAM = 3001 Anhydride = 1001 Pampa, TX Acid = 290 Anhydride = 145 Esters = 60 Scheduled for closure in 2009 New Location Celanese Global Manufacturing Locations Well positioned to capture continued growth in established, high- demand regions (Americas, Europe) Nanjing facility to capture strong growth in China Singapore facility to support India and other Southeast Asia demand |
Significantly lower capital intensity versus other new acetyl complexes Nanjing Phase 1: delivers capital advantage that is between ~2 to 3 times greater than all other acetyl projects Nanjing Phase 2: a fraction of Phase 1 capital for the same production capabilities Celanese capital efficiency: a long-term competitive advantage Capital Intensity Information from various press releases, 2007 China Acetic Acid Conference, and Celanese estimates CE Nanjing Phase 2 CE Nanjing Phase 1 Local Chinese Sipchem East 5 80 180 280 10 40 40 40 (Relative $Capital/$Acetyl Sales) |
Historical Industry Effective Capacity1 Less efficient new capacity has been reducing effective utilization New entrants with less reliable acetic acid technology Significantly longer startup curves Higher number of outages Less reliable equipment Natural gas restrictions in emerging regions Further restrictions on chemical applications announced in China September 2007 Higher frequency of raw material (primarily CO) disruptions since 2003 2008 to 2010 effective utilization assumed at 88% through at least 2010 2002 2003 2004 2005 2006 2007E 2008E East 0.9 0.9 0.89 0.89 0.89 0.855 0.88 0.025 Previously assumed industry effective utilization 1Source: Tecnon Orbichem 3rd party analysis, Celanese estimates 2007 Clear Lake impact Actual industry effective utilization |
A Delays continue to be common for acetyl projects = Project delay Company announced startup A CE 2005 update CE 2006 update CE 2007 update 500kt Acetex (Tasnee) 150kt Sopo 150kt Fanavaran 200kt Lunan Cathay 200kt Wujing 150kt BP / Yaraco 300kt BP/FPC 2008 2007 2006 2005 425kt 550kt 600kt Capacity BP / Sinopec Celanese Nanjing (Phase 1) Sipchem 2010 2009 Company A A A A A A A A A A A SU X SU SU X X X X SU SU Cancelled X X X X X X X X X SU SU X SU X X X X X = Actual plant startup SU X |
Acetic acid high utilization rates continue into 2010 2004 2005 2006 2007E 2008E 2009E 2010E Low Cost 6919 7166 7694 8204 8798 9766 10388 12008E-2010E effective utilization based on external analysis assumptions Source: available public data Utilization of Effective Capacity1(Nov, 2007 ): 91% 93% 92% 94% 93% 91% 91% Acetic Acid Supply/Demand Balance |
Acetyls remains an advantaged industry Acetyls: differentiated and less cyclical versus mainstream commodities 1Source: Tecnon 2007 2Source: CMAI Acetyls Ethylene Advantage Industry Structure Attractive Top 2 producers1: ~50% of the global market Fragmented Top 2 producers1: ~ 15% of the total global market Acetyls Cost Curve Steep cost curve Relatively flat within a region Acetyls Technology Leading technology not widely licensed Readily available Acetyls Asset Location Close to customer Feedstock dependent Acetyls Supply/demand Outlook Favorable supply/ demand balance Overcapacity by early 20092 Acetyls |
Group Asia Revitalization Innovation Organic Balance Sheet Operational Excellence EBITDA Impact Consumer and Industrial Specialties X X X X >$100MM Advanced Engineered Materials X X X X >$100MM Acetyl Intermediates X X X >$100MM Celanese Corporate X X Incremental EPS Operating EBITDA EPS Committed to delivering value creation $350 - $400 million increased EBITDA profile plus EPS potential by 2010 Primary Growth Focus |
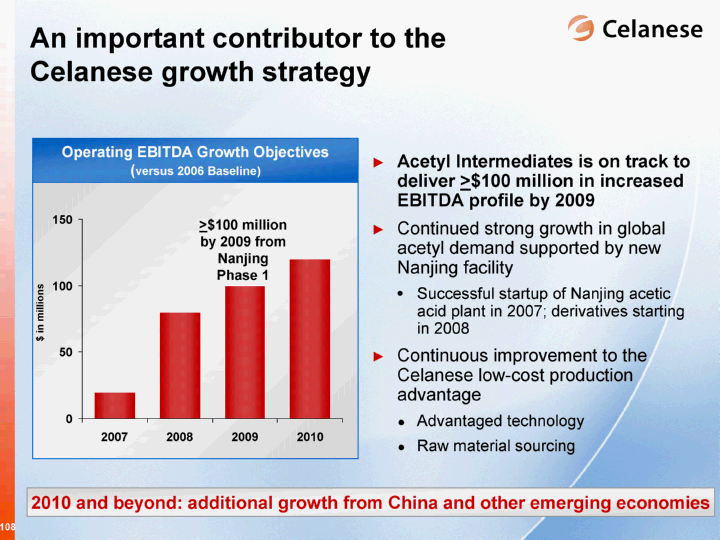
Operating EBITDA Growth Objectives (versus 2006 Baseline) An important contributor to the Celanese growth strategy Acetyl Intermediates is on track to deliver >$100 million in increased EBITDA profile by 2009 Continued strong growth in global acetyl demand supported by new Nanjing facility Successful startup of Nanjing acetic acid plant in 2007; derivatives starting in 2008 Continuous improvement to the Celanese low-cost production advantage Advantaged technology Raw material sourcing 2007 2008 2009 2010 AI 20 80 100 120 40 2010 and beyond: additional growth from China and other emerging economies >$100 million by 2009 from Nanjing Phase 1 $ in millions |
Nanjing allows Celanese to capture significant growth in Asia Successful startup of acetic acid facility in June 2007 Downstream acetyl products startup on schedule Acetic anhydride: 1H 2008 Vinyl acetate: mid-2008 Primary target is China and the rest of Asia ~$500 million of total additional revenues for Acetyl Intermediates from Nanjing Phase 1 by 2009 Fully Integrated Complex Celanese Nanjing Integrated Complex Emulsions Complex Administration & Maintenance Utilities / Tank Farm Compounding Acetic Acid Unit Acetic Anhydride Unit Vinyl Acetate Monomer Unit Warehouse GUR(r) Unit Celstran(r) Unit Flare Acetyl Intermediates Nanjing Phase 1 Nanjing advantaged cost profile: EBITDA margins greater than segment average |
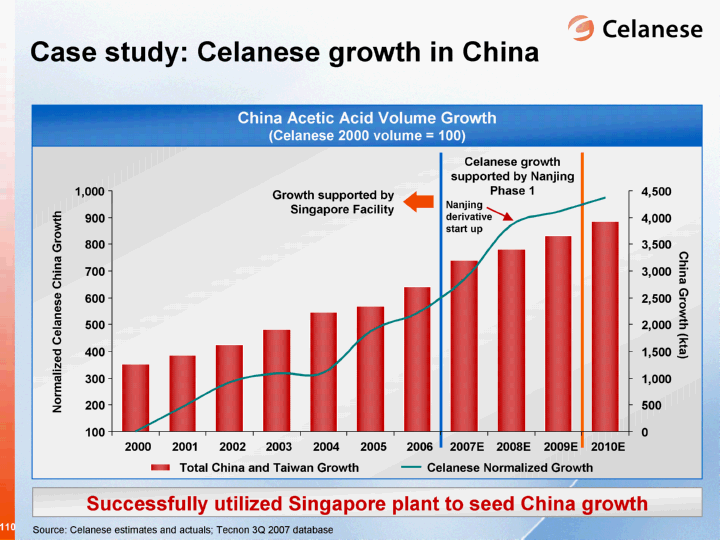
Case study: Celanese growth in China Normalized Celanese China Growth Growth supported by Singapore Facility China Growth (kta) Source: Celanese estimates and actuals; Tecnon 3Q 2007 database Successfully utilized Singapore plant to seed China growth Celanese growth supported by Nanjing Phase 1 Nanjing derivative start up China Acetic Acid Volume Growth (Celanese 2000 volume = 100) 100 200 300 400 500 600 700 800 900 1,000 2000 2001 2002 2003 2004 2005 2006 2007E 2008E 2009E 2010E 0 500 1,000 1,500 2,000 2,500 3,000 3,500 4,000 4,500 Total China and Taiwan Growth Celanese Normalized Growth |
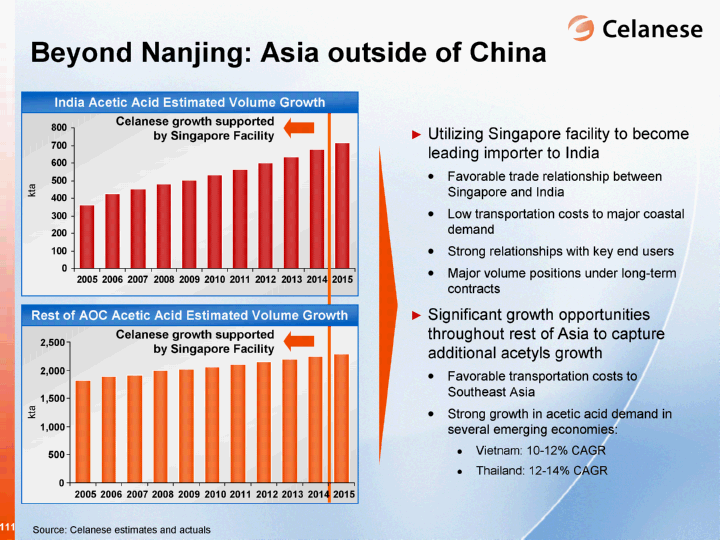
Beyond Nanjing: Asia outside of China 2005 2006 2007 2008 2009 2010 2011 2012 2013 2014 2015 India Market Growth 360 425 450 480 504 530 562.9420065 597.9315146 635.095786 674.5699927 716.497708 Celanese growth supported by Singapore Facility Utilizing Singapore facility to become leading importer to India Favorable trade relationship between Singapore and India Low transportation costs to major coastal demand Strong relationships with key end users Major volume positions under long-term contracts Significant growth opportunities throughout rest of Asia to capture additional acetyls growth Favorable transportation costs to Southeast Asia Strong growth in acetic acid demand in several emerging economies: Vietnam: 10-12% CAGR Thailand: 12-14% CAGR Celanese growth supported by Singapore Facility Rest of AOC Acetic Acid Estimated Volume Growth India Acetic Acid Estimated Volume Growth kta kta 0 500 1,000 1,500 2,000 2,500 2005 2006 2007 2008 2009 2010 2011 2012 2013 2014 2015 Source: Celanese estimates and actuals |
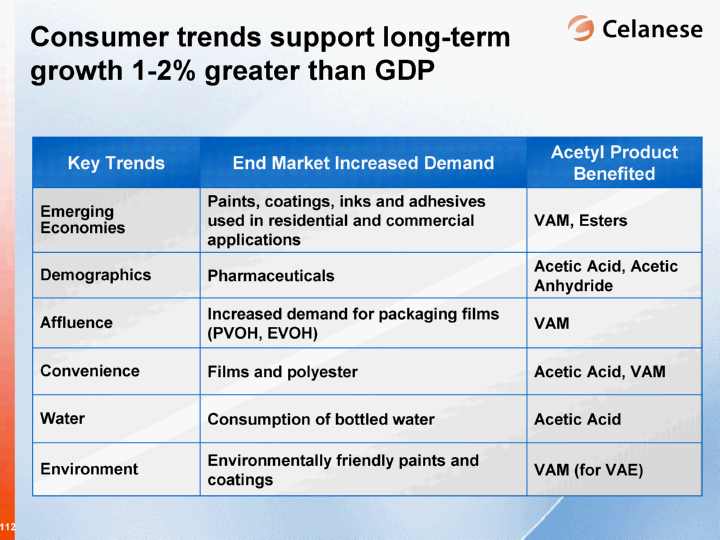
Consumer trends support long-term growth 1-2% greater than GDP Key Trends End Market Increased Demand Acetyl Product Benefited Emerging Economies Paints, coatings, inks and adhesives used in residential and commercial applications VAM, Esters Demographics Pharmaceuticals Acetic Acid, Acetic Anhydride Affluence Increased demand for packaging films (PVOH, EVOH) VAM Convenience Films and polyester Acetic Acid, VAM Water Consumption of bottled water Acetic Acid Environment Environmentally friendly paints and coatings VAM (for VAE) |
Capitalize on growth in vinyl emulsions systems Increasing vinyls' share of emulsion systems Formulation work continues to improve performance of vinyl systems relative to competing systems Opportunities to capture needs created by market trends (environment, lifestyle, convenience) Results in 300 kta of additional VAM growth potential Acetyl intermediates ideally positioned to capture large share of total growth - both captive downstream and merchant demand Vinyl Other 3154 4630 Vinyl Target Space Other 3154 1000 3630 $8 Billion Global Emulsion Systems Target Space Customer-driven Product Innovation Vinyl Technology Extension Global Emulsion Systems Expansion of Vinyl Solutions 2010E 2006 $1B |
Celanese Acetic Acid Volume Growth Using downstream integration to drive continued earnings growth Celanese merchant acetic acid volume has grown at 7% CAGR Forward integration into downstream specialty businesses has more than doubled since 2000 Merchant versus Downstream Specialty Integration 2000 2001 2002 2003 2004 2005 2006 2007E Merchant Capacity 1 1.06 1.24 1.24 1.29 1.57 1.66 1.65 Downstream Specialty 1 1.01 1.16 1.4 1.51 1.89 1.93 2.1 7% CAGR Acetyl Intermediates benefits from downstream specialty growth 12% CAGR |
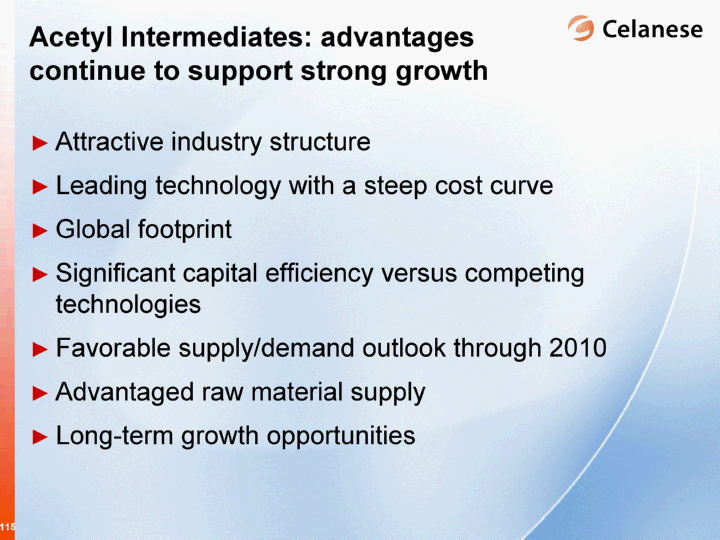
Acetyl Intermediates: advantages continue to support strong growth Attractive industry structure Leading technology with a steep cost curve Global footprint Significant capital efficiency versus competing technologies Favorable supply/demand outlook through 2010 Advantaged raw material supply Long-term growth opportunities |
Jim Alder Senior Vice President, Operations and Technical Global Operational Excellence |
Global Operational Excellence Operational Excellence Culture Manufacturing and beyond Corporate sustainability Nanjing Competitive Advantages Demonstrated success Transferable platform for growth |
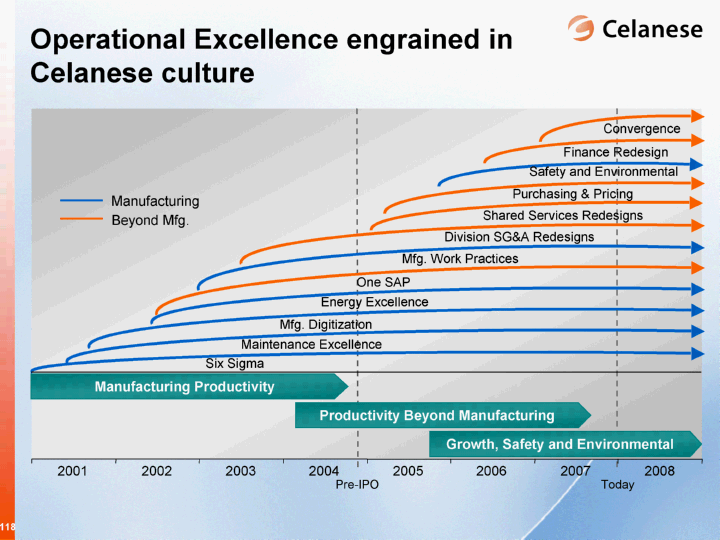
Operational Excellence engrained in Celanese culture 2001 2002 2003 2004 2005 2006 2007 2008 Manufacturing Productivity Productivity Beyond Manufacturing Growth, Safety and Environmental Pre-IPO Today Manufacturing Beyond Mfg. Six Sigma Maintenance Excellence Mfg. Digitization Energy Excellence One SAP Mfg. Work Practices Division SG&A Redesigns Shared Services Redesigns Purchasing & Pricing Finance Redesign Convergence Safety and Environmental |
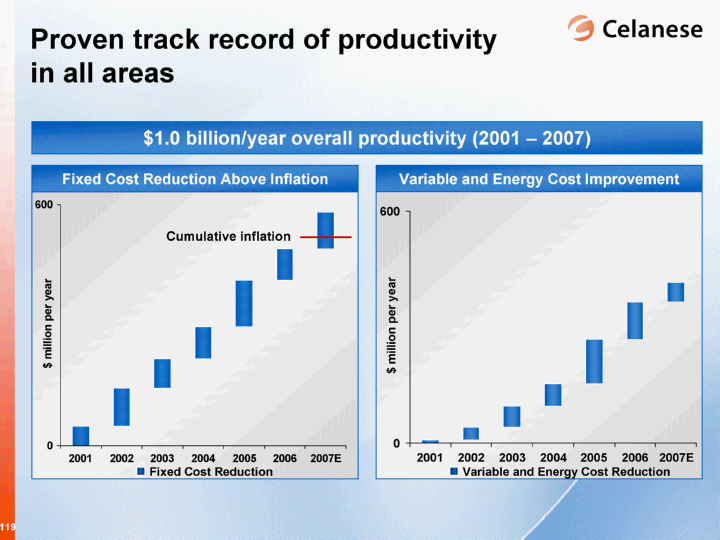
2001 2002 2003 2004 2005 2006 2007E 2008B 0 49.2 142.9 215.5 296.5 412.7 489.8 49.2 93.7 72.6 81 116.2 77.1 90.7 524 Variable and Energy Cost Improvement $1 Billion / Year Overall Productivity Proven track record of productivity in all areas Fixed Cost Reduction Above Inflation $1.0 billion/year overall productivity (2001 - 2007) 2001 2002 2003 2004 2005 2006 2007E 2008B 0 8 41.6 94.5 153.1 268.8 365.6 437.6 8 33.6 52.9 58.6 115.7 96.8 49.3 Cumulative inflation Variable and Energy Cost Reduction Fixed Cost Reduction |
Energy Usage (MM BTU/lb) What's Next Site specific projects Nanjing startup Pampa sale/shutdown Kelsterbach relocation (2011) Manufacturing productivity will continue in 2008 and beyond Accomplishments: 2001 - 2007 28% reduction > $150 million per year sustainable productivity > 40 % reduction vs. 2001 2001 2002 2003 2004 2005 2006 2007E 2008 2010E 5.096 4.663 4.499 4.672 4.001 3.84 3.66 2.9 North 45.9 46.9 45 43.9 |
Finance Cost Productivity beyond manufacturing will also continue in 2008 and beyond What's Next Optimize Budapest shared service center Treasury function redesign Finance back office consolidation Consolidation and optimization of U.S. finance operations 5-day close Systems consolidation Shared service center in Budapest 2003 2004 2005 2006 2007E 2008E 2009E Base* 100 79.4 77.7 67.6 67.2 54.7 61 Productivity Projects 50 14.8 15.9 17.2 10.8 2.2 60 60 60 60 60 > 30 % reduction vs. 2005 *Excludes Investor Relations, Risk Management, and audit fees Top quartile Accomplishments: 2004 - 2007 |
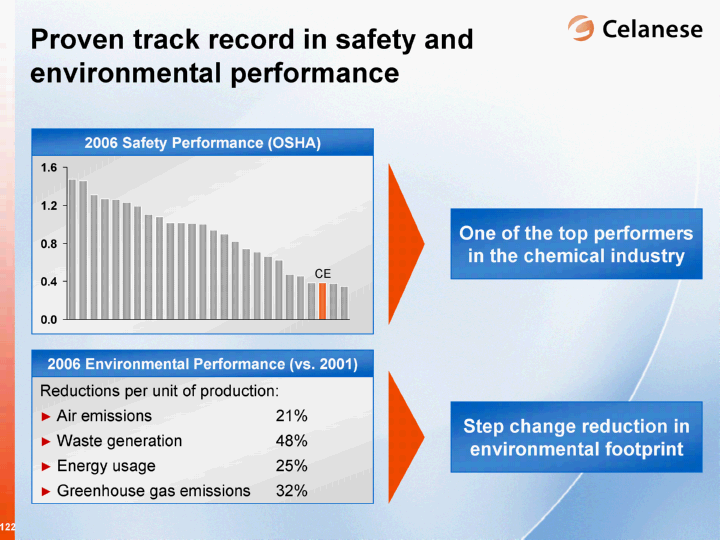
2006 Safety Performance (OSHA) Proven track record in safety and environmental performance CE One of the top performers in the chemical industry Reductions per unit of production: Air emissions 21% Waste generation 48% Energy usage 25% Greenhouse gas emissions 32% 2006 Environmental Performance (vs. 2001) Step change reduction in environmental footprint Company OIR LTIR Hours Sika Corporation 4.61 0.85 2123843 |
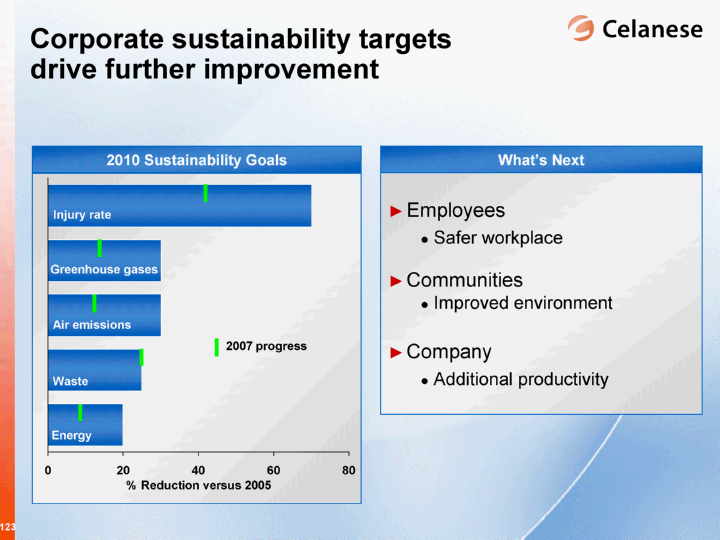
2010 Sustainability Goals Corporate sustainability targets drive further improvement Energy Waste Air Emissions Greenhouse Gases Injury Rate East 20 25 30 30 70 8.5 North Employees Safer workplace Communities Improved environment Company Additional productivity What's Next Injury rate Greenhouse gases Air emissions Waste Energy |
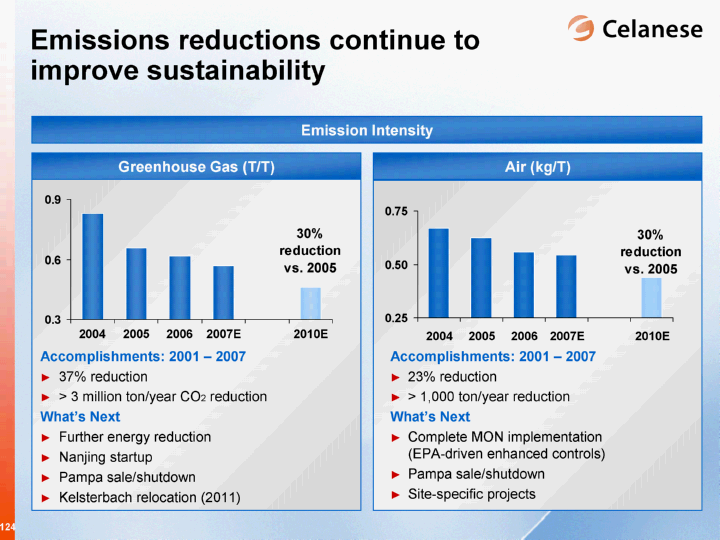
Air (kg/T) Emissions reductions continue to improve sustainability 2001 2002 2003 2004 2005 2006 2007E 2008 2010E 0.904 0.843 0.823 0.828 0.659 0.618 0.57 0.46 North 45.9 46.9 45 43.9 Accomplishments: 2001 - 2007 37% reduction > 3 million ton/year CO2 reduction What's Next Further energy reduction Nanjing startup Pampa sale/shutdown Kelsterbach relocation (2011) Greenhouse Gas (T/T) Accomplishments: 2001 - 2007 23% reduction > 1,000 ton/year reduction What's Next Complete MON implementation (EPA-driven enhanced controls) Pampa sale/shutdown Site-specific projects Emission Intensity 2001 2002 2003 2004 2005 2006 2007E 2008 2010E 0.7074 0.6589 0.6307 0.6713 0.6245 0.5593 0.545 0.4371 North 45.9 46.9 45 43.9 |
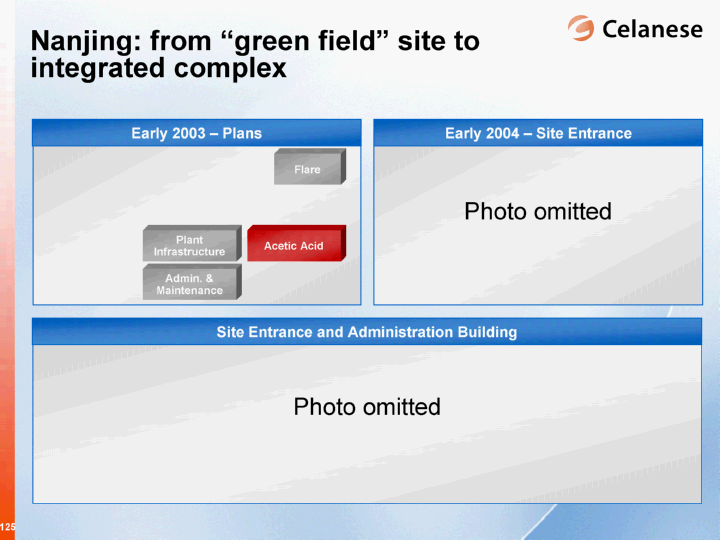
Nanjing: from "green field" site to integrated complex Site Entrance and Administration Building Early 2004 - Site Entrance Early 2003 - Plans Admin. & Maintenance Plant Infrastructure Acetic Acid Flare Photo omitted Photo omitted |
Acetic acid and emulsions units operating; two acetyl units under construction VAM Emulsions Acetic Anhydride Acetic Acid Photo omitted Photo omitted Photo omitted Photo omitted |
Construction underway for two AEM units and one additional unit planned Compounding Celstran(r) 2009 - Plans GUR(r) Emulsions Complex Admin. & Maintenance Plant Infrastructure Acetic Anhydride Warehouse Compounding Acetic Acid Vinyl Acetate Monomer Celstran(r) Flare GUR(r) Photo omitted Photo omitted Photo omitted |
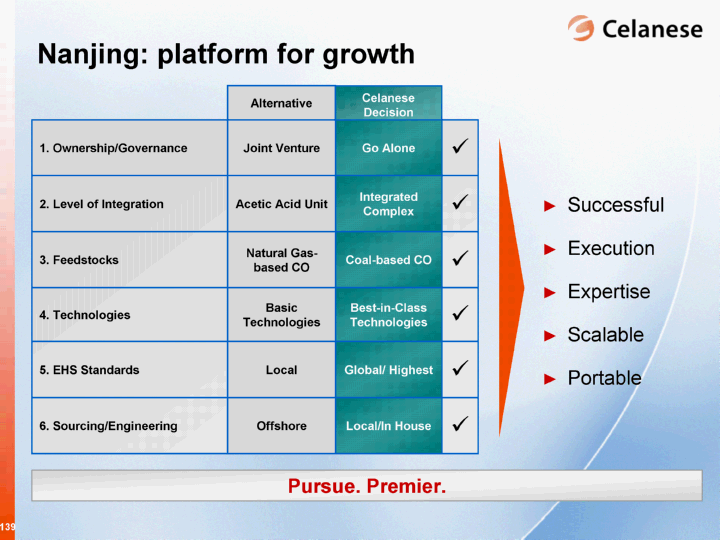
Nanjing: key decisions have positioned Celanese to generate significant value 1. Ownership/Governance Global/Highest Local Offshore Local/In-house Basic Technologies Best-in-Class Technologies Natural Gas- based CO Coal Based CO ? Global/Highest 5. EHS Standards 6. Sourcing/Engineering ? Best-in-Class Technologies 4. Technologies ? Coal-based CO 3. Feedstocks Acetic Acid Unit Integrated Complex ? Integrated Complex 2. Level of Integration Joint Venture Go Alone ? Go Alone 255 Alternative Celanese Decision ? Local/In-house |
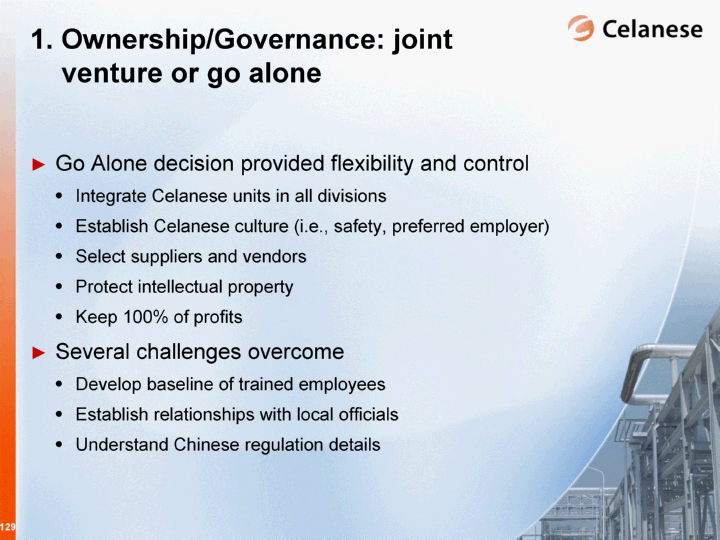
257 1. Ownership/Governance: joint venture or go alone Go Alone decision provided flexibility and control Integrate Celanese units in all divisions Establish Celanese culture (i.e., safety, preferred employer) Select suppliers and vendors Protect intellectual property Keep 100% of profits Several challenges overcome Develop baseline of trained employees Establish relationships with local officials Understand Chinese regulation details |
2. Level of Integration: highly integrated complex M e r c h a n t S a l e s Methanol Coal-based CO Ethylene ~40% 100% ~90% ~10% 100% 20% ~40% 100% Emulsions Acetic Acid GUR(r) Vinyl Acetate Polypropylene Celstran(r) 100% Polymer Resin Acetic Anhydride Compounding Infrastructure |
Nanjing: facts and figures Acetic Acid Capacity - 600 kt (expandable to 1,200 kt) AOPlus(tm) Technology Acetic Anhydride Capacity - 100 kt Vinyl Acetate Monomer Capacity - 300 kt VAntage Plus(tm) Technology Celstran(r) Capacity - 4 kt (expandable to 8 kt) 2007 2008 Emulsions Capacity - 60 kt VAE - 48 kt Conventional Emulsions - 12 kt GUR(r) Capacity - 16 kt (expandable to 32 kt) Nanjing Facts Location - Nanjing City Industrial Park (NCIP) Only one of two state- approved industrial parks Total area of NCIP ~45 kilometers ~19 hectares of land use rights acquired Employees - 234 currently and ~300+ expected by 2009 (including shared services) 2009 Compounding Capacity - 15 kt |
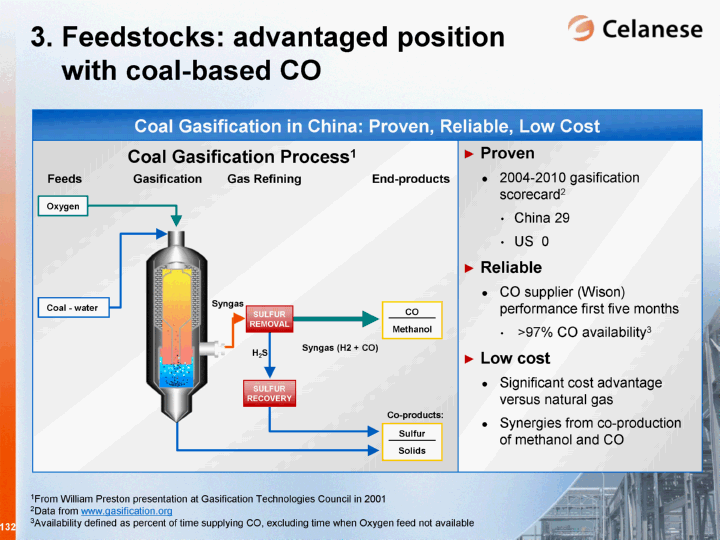
263 Proven 2004-2010 gasification scorecard2 China 29 US 0 Reliable CO supplier (Wison) performance first five months >97% CO availability3 Low cost Significant cost advantage versus natural gas Synergies from co-production of methanol and CO 3. Feedstocks: advantaged position with coal-based CO 1From William Preston presentation at Gasification Technologies Council in 2001 2Data from www.gasification.org 3Availability defined as percent of time supplying CO, excluding time when Oxygen feed not available Feeds H2S Syngas Gasification Gas Refining End-products Syngas (H2 + CO) CO Methanol Sulfur Solids Co-products: SULFUR RECOVERY SULFUR REMOVAL Oxygen Coal - water Coal Gasification Process1 Coal Gasification in China: Proven, Reliable, Low Cost |
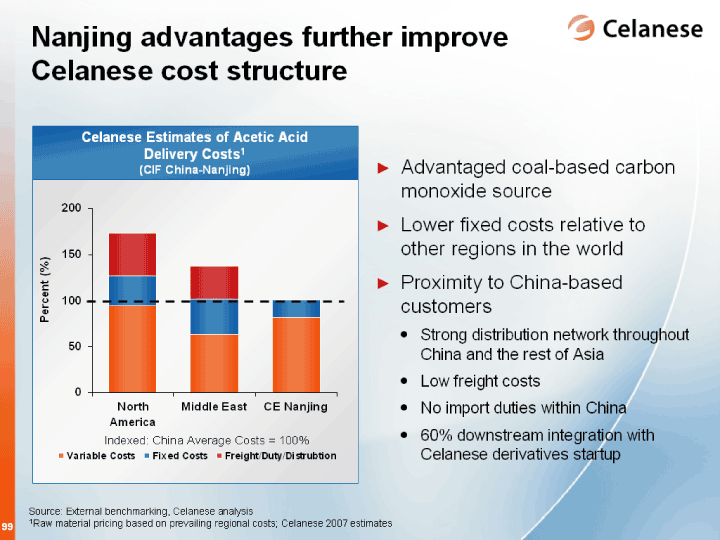
Coal Gasification in China: Cost Advantage versus Natural Gas1 265 Nanjing: advantaged feedstock position with coal-based CO Coal has a 40% cost advantage vs. natural gas at current natural gas pricing Cost advantage likely to increase given relative coal versus natural gas reserves 1Proforma economics based on current Nanjing coal and natural gas prices ($8 per MM BTU) plus 15% return $4 NG $ 5 NG $6 NG $7 NG $8 NG Coal to CO NG to CO Variable and Fixed Cost 186.45 178.44 170.41 162.38 154.11 69.11 200.25 Capital Return 187.51 204.94 222.37 239.8 257.75 85 57 |
AOPlus(tm) Implementation in Clear Lake 4. Technologies: leading Celanese acetic acid technology (AOPlus(tm)) protected with patents 25 years of Celanese technology development integrated in Nanjing design Celanese patents worldwide 531 total with 473 active 400 additional applications Celanese patents in China 24 total with 22 active 12 additional applications 1978 1983 1988 1993 1998 2003 2008 Unit Capacity, kta 200 1,300 Technology 2 Technologies 2 Technologies 2 Technologies Technology Technology 2 Technologies Technology Technology Technology Technology More CO Technology 2 Technologies 2 Technologies More CO Technology 2 Technologies |
VAntage(tm) Implementation in Bay City Nanjing: leading Celanese VAM technology (VAntageTM) 0 350 1970 1975 1980 1985 1990 1995 2000 2005 Unit Capacity, kta Debottlenecking and Technology Technology Technology Technology Debottlenecking and Technology Technology Technology 2008 35 years of Celanese technology development integrated in Nanjing design Celanese patents worldwide 902 total with 892 active 170 additional applications Celanese patents in China 21 total with 21 active 12 additional applications |
5. EHS Standards: committed to safety and environmental excellence and environmental excellence and environmental excellence and environmental excellence and environmental excellence U.S. or China standards, whichever greater No significant environmental incidents to date China standards higher Integrating Celanese standards and culture No lost time injuries in site history (> 7 million man-hours) Safety Environmental 271 |
Capital Intensity 6. Sourcing/Engineering: lowest capital acetyl complex in the world Information obtained from various press releases, 2007 China Acetic Acid Conference, and Celanese estimates CE Nanjing Local Chinese Sipchem 80 180 280 East 40 40 40 s g CE Nanjing vs. Local Chinese CE Nanjing vs. Sipchem Geography + +++++ Technology +++++ +++ Scale +++++ ++ Integration +++++ +++ Timing of Investment + +++++ Overall +++ ++++ Relative $Capital/$Acetyl Sales CE Nanjing vs. Local Chinese CE Nanjing vs. Sipchem |
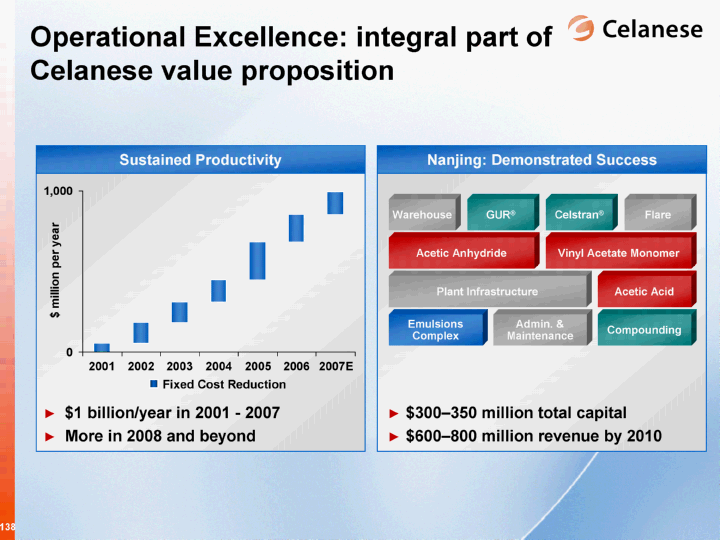
Operational Excellence: integral part of Celanese value proposition $300-350 million total capital $600-800 million revenue by 2010 $1 billion/year in 2001 - 2007 More in 2008 and beyond Sustained Productivity Nanjing: Demonstrated Success 2001 2002 2003 2004 2005 2006 2007E 2008B 0 57.2 184.5 310 449.6 681.5 855.4 437.6 57.2 127.3 125.5 139.6 231.9 173.9 140 Emulsions Complex Admin. & Maintenance Plant Infrastructure Acetic Anhydride Warehouse Compounding Acetic Acid Vinyl Acetate Monomer Celstran(r) Flare GUR(r) Fixed Cost Reduction |
Nanjing: platform for growth Successful Execution Expertise Scalable Portable Pursue. Premier. 1. Ownership/Governance Global/Highest Local Offshore Basic Technologies Natural Gas Based CO Acetic Acid Unit Joint Venture Local Best-in-Class Technologies Coal Based CO Integrated Complex Go Alone ? Global/ Highest Local 5. EHS Standards Offshore ? Local/In House 6. Sourcing/Engineering Basic Technologies ? Best-in-Class Technologies 4. Technologies Natural Gas- based CO ? Coal-based CO 3. Feedstocks Acetic Acid Unit ? Integrated Complex 2. Level of Integration Joint Venture ? Go Alone Alternative Celanese Decision |
Steven M. Sterin Senior Vice President and CFO Value Creation |
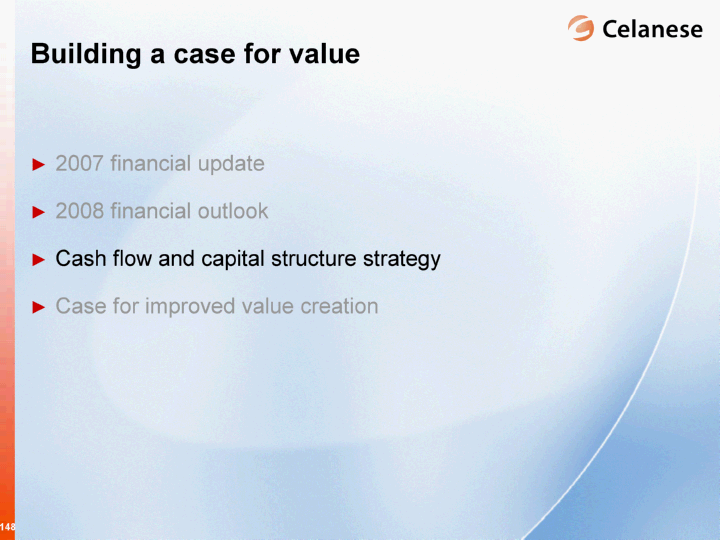
Building a case for value 2007 financial update 2008 financial outlook Cash flow and capital structure strategy Case for improved value creation |
Progression of Adjusted EPS Outlook Continued strength in 2007: increasing guidance Adjusted EPS guidance range increased to $3.26 to $3.31 per share Current full-year 2007 guidance range above high end of original estimates Continued strong global demand for acetyl products Ticona volume growth in Europe Acetate Products revitalization successfully completed Discontinued Edmonton methanol operations contributed $31 million of Operating EBITDA in 2007 FY 2007 Guidance ($ in millions) 3rd Qtr 2007 9 months ended 9/30/07 Sales $1,573 $4,684 up 8% Adjusted EPS $0.73 $2.49 up 23% Operating EBITDA $302 $976 up 12% 12/1/2006 Feb-07 5/1/2007 7/1/2007 10/1/2007 12/1/2007 Blank 0 Bottom of Range 2.6 2.7 2.8 2.85 3.1 3.26 Size of Range 0.3 0.3 0.3 0.15 0.1 0.05 |
2006 Rptd Oxo Disc. Ops. 2006 Base Strategy Market 2007E Base 1144 1144 1218 Add 74 71 Subtract 100 Total 1244 1144 1289 Realizing progress in 2007 1,280 - 1,310 85 - 90 56 - 61 Delivering on strategic growth objectives Consumer Specialties on track with revitalization Nanjing acetic acid plant startup ahead of previous estimate Benefiting from strong market conditions Favorable acetyl conditions expected to more than offset volatile raw material costs and impact of Clear Lake outage Strong performance of affiliates, particularly Ibn Sina 2007 Performance Operating EBITDA 1,285 - 1,295 1,244 (100) 1,144 $ in millions |
Building a case for value 2007 financial update 2008 financial outlook Cash flow and capital structure strategy Case for improved value creation |
2008 business outlook Volume growth >2x GDP across both transportation and non-transportation applications Aggressive cost control offsets continued high energy and raw material costs Significant progress expected in Nanjing production capabilities Advanced Engineered Materials Synergy capture from APL integration Strong underlying business fundamentals Consumer Specialties High raw material costs continue Realize benefits from revitalization efforts Emulsions production in Nanjing Industrial Specialties 2008 Guidance: Adjusted EPS $3.35 to $3.65 Operating EBITDA $1,280 to $1,350 million Forecasted 2008 adjusted tax rate of 26% |
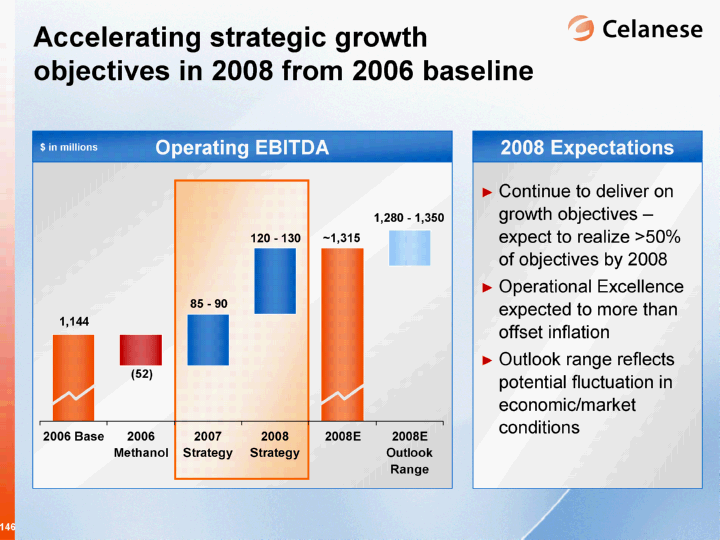
2006 Base 2006 Methanol 2007 Strategy 2008 Strategy 2008E 2008E Outlook Range Base 1092 1092 1177 1257 Add 85 110 60 Subtract 52 Total 1144 1287 Continue to deliver on growth objectives - expect to realize >50% of objectives by 2008 Operational Excellence expected to more than offset inflation Outlook range reflects potential fluctuation in economic/market conditions 2008 Expectations Operating EBITDA Accelerating strategic growth objectives in 2008 from 2006 baseline 85 - 90 120 - 130 (52) 1,144 ~1,315 1,280 - 1,350 $ in millions |
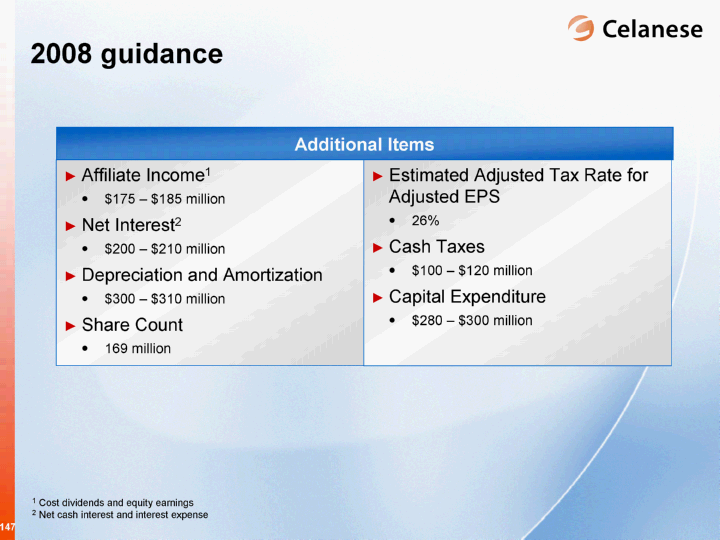
2008 guidance Additional Items Affiliate Income1 $175 - $185 million Net Interest2 $200 - $210 million Depreciation and Amortization $300 - $310 million Share Count 169 million 1 Cost dividends and equity earnings 2 Net cash interest and interest expense Estimated Adjusted Tax Rate for Adjusted EPS 26% Cash Taxes $100 - $120 million Capital Expenditure $280 - $300 million |
Building a case for value 2007 financial update 2008 financial outlook Cash flow and capital structure strategy Case for improved value creation |
Strong cash flow generation continues Strong operating results Lower cash taxes Working capital productivity 2008 estimate excludes Kelsterbach relocation Adjusted Free Cash Flow1 2006 2007E 2008E EBITDA/Net Interest 458 400 500 458 ~400 500 - 550 1 Adjusted free cash flow calculated as cash flow from operations less capital expenditures less other productive asset purchases less operating cash from discontinued operations plus certain other charges $ in millions |
14% Difficulty of Realizing Value/ Skills or Competencies Required Low High Low High Bias for growth and high-return projects Return on Capital Deployed/ Value Creation Dividend Debt repayment Hold cash Returning Cash to Shareholders Asset expansion - low growth area Share repurchase Returning Cost of Capital Cost reduction & revitalization projects Asset expansion - high growth area Core/bolt-on acquisitions Significant Value Creation |
Cost Reduction & Revitalization Projects Growth Projects Core/Bolt-on Acquisitions Cash flow and capital structure strategy Share Repurchase Dividends Debt Repayment Execute Growth Strategy Optimize Capital Structure Cash Available for Strategic Use Cost Stability Flexibility Maximize shareholder value Capital Structure Objectives Aligned with Strategic Pillars 2 - 4 year simple payback period > 20 - 50% ROIC Investment Criteria |
Effective use of cash to create shareholder value in 2007 Execute Growth Strategy ~$400 million Optimize Capital Structure ~$875 million ~$140 million APL for ~$110 million ~$30 million additional spend for synergies ~$60 million Industrial Specialties revitalization SG&A improvement Energy reduction programs ~$400 million ~$70 million Dutch Auction ~$330 million open-market repurchase ~$35 million Common and preferred dividends ~$440 million ~$200 million debt reduction $240 million high- yield debt refinancing costs ~$190 million Primarily Nanjing High-return projects Cash Available for Strategic Use ~$1,275 million Includes Oxo Divestiture Net Proceeds ~$580 million Cost Reduction & Revitalization Projects Growth Projects Core/Bolt-on Acquisitions Share Repurchase Dividends Debt Repayment |
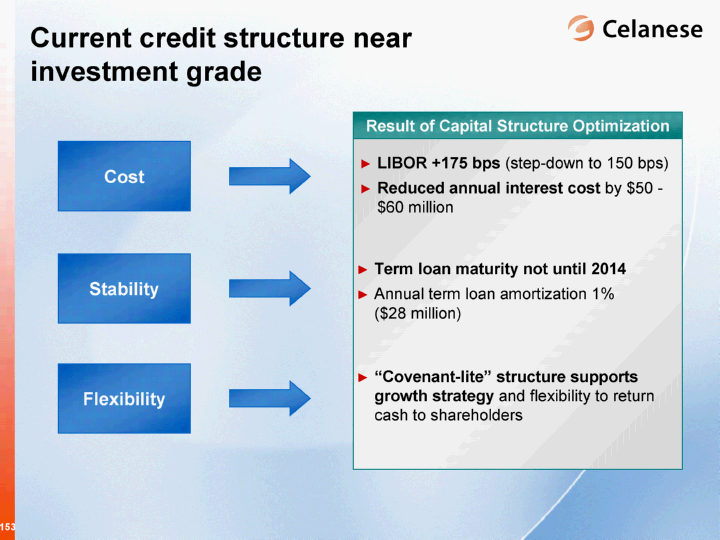
Current credit structure near investment grade Cost LIBOR +175 bps (step-down to 150 bps) Reduced annual interest cost by $50 - $60 million "Covenant-lite" structure supports growth strategy and flexibility to return cash to shareholders Stability Flexibility Term loan maturity not until 2014 Annual term loan amortization 1% ($28 million) Result of Capital Structure Optimization |
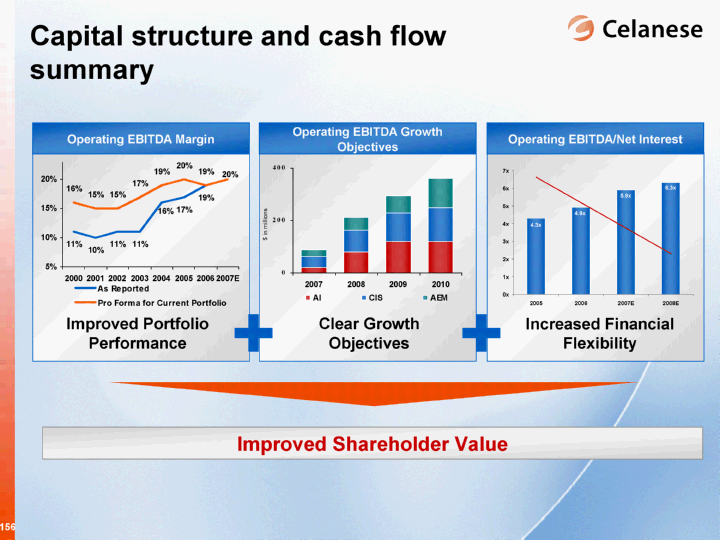
Improved leverage profile reduces risk and increases earnings Decrease in overall borrowing costs since 2005 Continued improvement in interest coverage ratio Improved capital flexibility Further debt reduction provides minimal value at this time 2005 2006 2007E 2008E EBITDA/Net Interest 4.3 4.9 5.9 6.3 Borrowing Rate 0.08 0.079 0.071 0.069 Operating EBITDA/Net Interest 6.9% 8.0% Borrowing Rate |
2005 2006 2007E 2008E East 0.172 0.224 0.225 0.238 Improvement in credit statistics Current performance at or above BB credit rating Financial performance and growth plans support current capital structure 1Adjusted FFO (Funds from Operations) equals Net Income plus D&A, Deferred Taxes, Non-Cash Charges, Adjustment for Pension/OPEB and Operating Leases 2Adjusted Total Debt equals Reported Debt plus After-tax Unfunded Pension/OPEB Obligations and Operating Lease Adjustments BB BB - Adjusted FFO1/Adjusted Total Debt2 Improved credit performance - primed for upgrade |
Capital structure and cash flow summary Operating EBITDA Growth Objectives 2007 2008 2009 2010 AI 20 80 120 120 CIS 44 82 108 130 AEM 25 50 65 110 Clear Growth Objectives Improved Shareholder Value Operating EBITDA/Net Interest Increased Financial Flexibility Operating EBITDA Margin Improved Portfolio Performance 2000 2001 2002 2003 2004 2005 2006 2007E As Reported 0.11 0.1 0.11 0.11 0.16 0.17 0.19 0.2 Pro Forma for Current Portfolio 0.16 0.15 0.15 0.17 0.19 0.2 0.19 0.2 2005 2006 2007E 2008E EBITDA/Net Interest 4.3 4.9 5.9 6.3 Borrowing Rate 0.08 0.079 0.071 0.069 $ in millions |
Building a case for value 2007 financial update 2008 financial outlook Cash flow and capital structure strategy Case for improved value creation |
Additional value in affiliates $20 $50 $10 $5 2007E Unreported Proportional EBITDA $85 $20 $30 $15 $15 2007E Reported Equity Earnings $80 $165 $40 $80 $25 $20 2007E Proportional EBITDA Subtotal AI <50% Infraservs AEM 45% Polyplastics AEM 50% Korea Engineered Plastics AEM 50% Fortron Industries Reporting Segment Celanese Ownership Affiliate Equity Affiliates Total EBITDA from Affiliates $275 $190 2007E Total Reported CIS 30-31% Acetate China Ventures AI 25% Ibn Sina Reporting Segment Celanese Ownership Affiliate Cost Affiliates 2007E Cash Dividends Subtotal $110 $36 $74 |
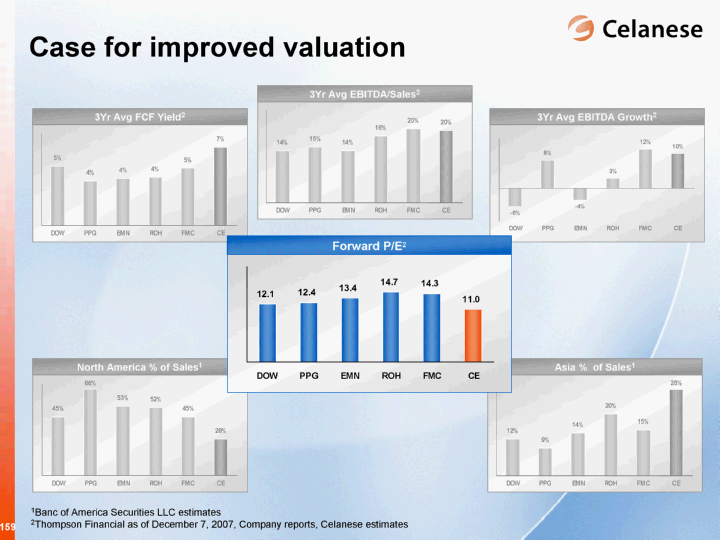
DOW PPG EMN ROH FMC CE FCF/Yield 0.051858056 0.038835515 0.041167458 0.042278652 0.05027073 0.068040892 3Yr Avg FCF Yield2 DOW PPG EMN ROH FMC CE EBITDA/Sales 0.14 0.15 0.14 0.18 0.2 0.196018315 3Yr Avg EBITDA/Sales2 DOW PPG EMN ROH FMC CE Emerging Market 0.12 0.09 0.14 0.2 0.15 0.28 Asia % of Sales1 DOW PPG EMN ROH FMC CE Emerging Market 0.45 0.66 0.53 0.52 0.45 0.28 North America % of Sales1 DOW PPG EMN ROH FMC CE EBTIDA Growth -0.056 0.084 -0.035 0.029 0.117 0.102876779 3Yr Avg EBITDA Growth2 DOW PPG EMN ROH FMC CE EBITDA/Sales 0.14 0.15 0.14 0.18 0.2 0.196018315 3Yr Avg EBITDA/Sales2 DOW PPG EMN ROH FMC CE EBTIDA Growth -0.056 0.084 -0.035 0.029 0.117 0.102876779 3Yr Avg EBITDA Growth2 DOW PPG EMN ROH FMC CE FCF/Yield 0.051858056 0.038835515 0.041167458 0.042278652 0.05027073 0.068040892 3Yr Avg FCF Yield2 DOW PPG EMN ROH FMC CE Emerging Market 0.45 0.66 0.53 0.52 0.45 0.28 North America % of Sales1 DOW PPG EMN ROH FMC CE Emerging Market 0.12 0.09 0.14 0.2 0.15 0.28 Asia % of Sales1 Case for improved valuation 1Banc of America Securities LLC estimates 2Thompson Financial as of December 7, 2007, Company reports, Celanese estimates DOW PPG EMN ROH FMC CE P/E 12.1 12.4 13.4 14.7 14.3 11 Forward P/E2 |
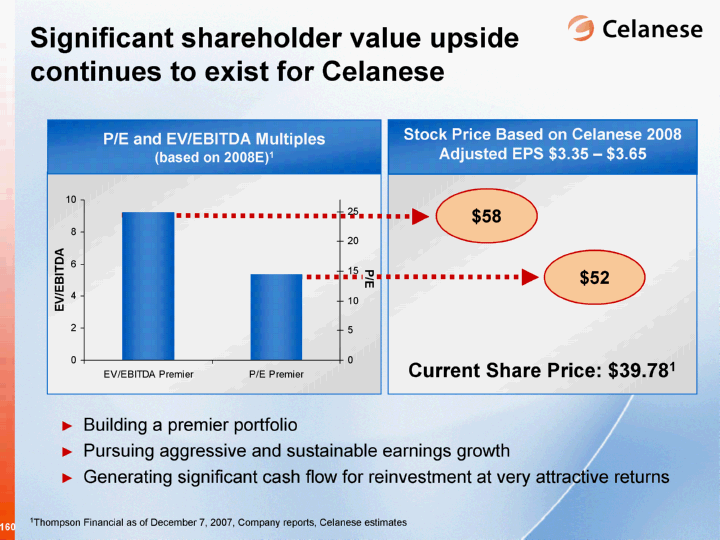
P/E Significant shareholder value upside continues to exist for Celanese Building a premier portfolio Pursuing aggressive and sustainable earnings growth Generating significant cash flow for reinvestment at very attractive returns 1Thompson Financial as of December 7, 2007, Company reports, Celanese estimates P/E and EV/EBITDA Multiples (based on 2008E)1 Stock Price Based on Celanese 2008 Adjusted EPS $3.35 - $3.65 Current Share Price: $39.781 EV/EBITDA EV/EBITDA Premier P/E Premier EV/EBITDA Premier 9.24 P/E Premier 14.47 $58 $52 |
Key takeaways from today's meeting Portfolio is stronger, more resilient It's the model - not the molecule Ahead of expectations and growth objectives More earnings growth opportunities identified Celanese culture: enabler |
Appendix |
Reg G: Reconciliation of Diluted Adjusted EPS |
Reg G: Reconciliation of Net Debt Net Debt - Reconciliation of a Non-U.S. GAAP Measure |
Reg G: Reconciliation of Other Charges and Other Adjustments |
Reg G: Equity Affiliate Data |
Reg G: Reconciliation of Operating EBITDA |
Reg G: Reconciliation of 2000 - 2006 Operating EBITDA |
Reg G: Other Items Adjusted Total Debt Adjusted Funds from Operations 2000 - 2006 Adjusted Free Cash Flow |