Exhibit 99.2

| Dave Weidman, Chairman and CEO Steven Sterin, Senior Vice President and CFO Celanese 1Q 2008 Earnings Conference Call / Webcast Tuesday, April 22, 2008 10:00 a.m. ET |

| Forward Looking Statements, Reconciliation and Use of Non- GAAP Measures to U.S. GAAP Forward-Looking Statements This presentation may contain "forward-looking statements," which include information concerning the company's plans, objectives, goals, strategies, future revenues or performance, capital expenditures, financing needs and other information that is not historical information. When used in this release, the words "outlook," "forecast," "estimates," "expects," "anticipates," "projects," "plans," "intends," "believes," and variations of such words or similar expressions are intended to identify forward-looking statements. All forward-looking statements are based upon current expectations and beliefs and various assumptions. There can be no assurance that the company will realize these expectations or that these beliefs will prove correct. There are a number of risks and uncertainties that could cause actual results to differ materially from the forward- looking statements contained in this release. Numerous factors, many of which are beyond the company's control, could cause actual results to differ materially from those expressed as forward-looking statements. Certain of these risk factors are discussed in the company's filings with the Securities and Exchange Commission. Any forward-looking statement speaks only as of the date on which it is made, and the company undertakes no obligation to update any forward-looking statements to reflect events or circumstances after the date on which it is made or to reflect the occurrence of anticipated or unanticipated events or circumstances. Reconciliation of Non-U.S. GAAP Measures to U.S. GAAP This presentation reflects five performance measures, operating EBITDA, affiliate EBITDA, adjusted earnings per share, net debt and adjusted free cash flow, as non-U.S. GAAP measures. The most directly comparable financial measure presented in accordance with U.S. GAAP in our consolidated financial statements for operating EBITDA is operating profit; for affiliate EBITDA is equity in net earnings of affiliates; for adjusted earnings per share is earnings per common share-diluted; for net debt is total debt; and for adjusted free cash flow is cash flow from operations. Use of Non-U.S. GAAP Financial Information Operating EBITDA, a measure used by management to measure performance, is defined as operating profit from continuing operations, plus equity in net earnings from affiliates, other income and depreciation and amortization, and further adjusted for other charges and adjustments. We provide guidance on operating EBITDA and are unable to reconcile forecasted operating EBITDA to a GAAP financial measure because a forecast of Other Charges and Adjustments is not practical. Our management believes operating EBITDA is useful to investors because it is one of the primary measures our management uses for its planning and budgeting processes and to monitor and evaluate financial and operating results. Operating EBITDA is not a recognized term under U.S. GAAP and does not purport to be an alternative to operating profit as a measure of operating performance or to cash flows from operating activities as a measure of liquidity. Because not all companies use identical calculations, this presentation of operating EBITDA may not be comparable to other similarly titled measures of other companies. Additionally, operating EBITDA is not intended to be a measure of free cash flow for management's discretionary use, as it does not consider certain cash requirements such as interest payments, tax payments and debt service requirements nor does it represent the amount used in our debt covenants. Affiliate EBITDA, a measure used by management to measure performance of its equity investments, is defined as the proportional operating profit plus the proportional depreciation and amortization of its equity investments. Affiliate EBITDA, including Celanese Proportional Share of affiliate information on Table 8, is not a recognized term under U.S. GAAP and is not meant to be an alternative to operating cash flow of the equity investments. The company has determined that it does not have sufficient ownership for operating control of these investments to consider their results on a consolidated basis. The company believes that investors should consider affiliate EBITDA when determining the equity investments' overall value in the company. Adjusted earnings per share is a measure used by management to measure performance. It is defined as net earnings (loss) available to common shareholders plus preferred dividends, adjusted for other charges and adjustments, and divided by the number of basic common shares, diluted preferred shares, and options valued using the treasury method. We provide guidance on an adjusted earnings per share basis and are unable to reconcile forecasted adjusted earnings per share to a GAAP financial measure without unreasonable effort because a forecast of Other Items is not practical. We believe that the presentation of this non- U.S. GAAP measure provides useful information to management and investors regarding various financial and business trends relating to our financial condition and results of operations, and that when U.S. GAAP information is viewed in conjunction with non-U.S. GAAP information, investors are provided with a more meaningful understanding of our ongoing operating performance. This non-U.S. GAAP information is not intended to be considered in isolation or as a substitute for U.S. GAAP financial information. The tax rate used for adjusted earnings per share is the tax rate based on our original guidance communicated at the company's investor day in December 2007. We adjust this tax rate during the year only if there is a substantial change in our underlying operations; an updated forecast would not necessarily result in a change to our tax rate used for adjusted earnings per share. The adjusted tax rate may differ significantly from the tax rate used for U.S. GAAP reporting in any given reporting period. It is not practical to reconcile our prospective adjusted tax rate to the actual U.S. GAAP tax rate in any future period. Net debt is defined as total debt less cash and cash equivalents. We believe that the presentation of this non-U.S. GAAP measure provides useful information to management and investors regarding changes to the company's capital structure. Our management and credit analysts use net debt to evaluate the company's capital structure and assess credit quality. This non-U.S. GAAP information is not intended to be considered in isolation or as a substitute for U.S. GAAP financial information Adjusted free cash flow is defined as cash flow from operations less capital expenditures, other productive asset purchases, operating cash from discontinued operations and certain other charges. We believe that the presentation of this non-U.S. GAAP measure provides useful information to management and investors regarding changes to the company's cash flow. Our management and credit analysts use adjusted free cash flow to evaluate the company's liquidity and assess credit quality. This non-U.S. GAAP information is not intended to be considered in isolation or as a substitute for U.S. GAAP financial information. Results Unaudited The results presented in this presentation, together with the adjustments made to present the results on a comparable basis, have not been audited and are based on internal financial data furnished to management. Quarterly results should not be taken as an indication of the results of operations to be reported for any subsequent period or for the full fiscal year. |

| Dave Weidman Chairman and Chief Executive Officer |

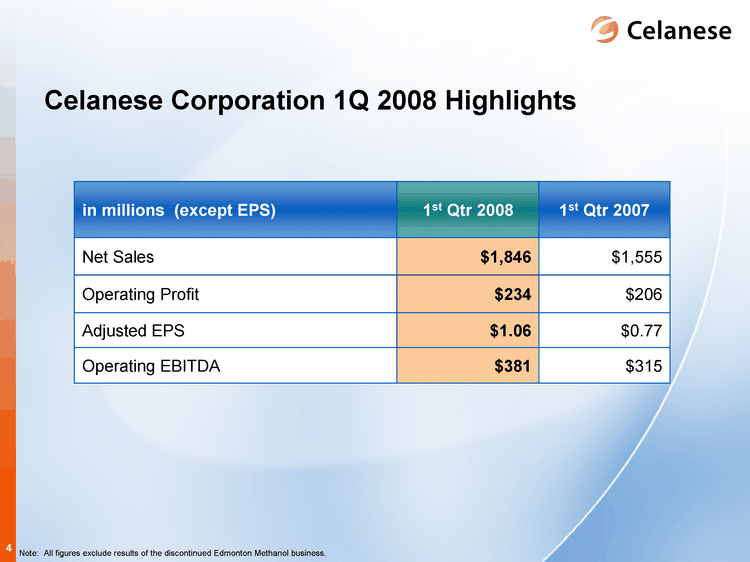
| Celanese Corporation 1Q 2008 Highlights in millions (except EPS) 1st Qtr 2008 1st Qtr 2007 Net Sales $1,846 $1,555 Operating Profit $234 $206 Adjusted EPS $1.06 $0.77 Operating EBITDA $381 $315 Note: All figures exclude results of the discontinued Edmonton Methanol business. |

| Committed to Delivering Value Creation $350 - $400 million increased EBITDA profile plus EPS potential by 2010 Group Asia Revitalization Innovation Organic Balance Sheet Operational Excellence EBITDA Impact Consumer and Industrial Specialties (CIS) X X X X >$100MM Advanced Engineered Materials (AEM) X X X X >$100MM Acetyl Intermediates (AI) X X X >$100MM Celanese Corporate X X Incremental EPS Primary Growth Focus Operating EBITDA EPS |

| 2007 2008 2009 2010 AI 20 80 100 120 CIS 44 82 108 130 AEM 25 50 65 110 Operating EBITDA Growth Objectives Clear Path to 2010 Growth Objectives AEM: volume growth > 2X GDP through further penetration CIS: Acetate continues execution on revitalization strategy; Emulsions/PVOH revitalization commences AI: Nanjing acetic acid plant startup leads integrated complex Acetyl Intermediates Consumer and Industrial Specialties Advanced Engineered Materials $ in millions |

| Steven Sterin Senior Vice President and CFO |

| Celanese Corporation Financial Highlights in millions (except EPS) 1st Qtr 2008 1st Qtr 2007 Net Sales $1,846 $1,555 Operating Profit $234 $206 Net Earnings $145 $201 Special Items Other Charges/Adjustments $22 $18 Adjusted EPS $1.06 $0.77 Effective Tax Rate 26% 28% Diluted Share Basis 167.3 174.4 Operating EBITDA $381 $315 Net sales increased 19% from prior year Higher pricing on strong demand Growth in Asia Favorable currency impacts Operating profit improved 14% to $234 as increased sales offset increase raw material costs and China spending Adjusted EPS up 38% to $1.06/share Diluted share basis reflects share repurchase programs 1.6 million shares repurchased under current authorization Operating EBITDA increased to $381 |

| in millions 1st Qtr 2008 1st Qtr 2007 Net Sales $294 up 12% $262 Operating EBITDA $60 down 10% $67 Advanced Engineered Materials First Quarter 2008: Net sales increase driven by volume growth (6%) and positive currency effects (8%) Growth in China continues to drive results Slight pricing declines due to geographic and product mix Higher raw material and energy costs continue to pressure margins Overall lower earnings from equity affiliates contributed to decrease in Operating EBITDA |

| First Quarter 2008: Net sales increase primarily driven by European acquisition, improved pricing on global demand and favorable currency impacts Pricing more than offset significantly higher energy costs Operating EBITDA improvement also includes acquisition synergies Consumer Specialties in millions 1st Qtr 2008 1st Qtr 2007 Net Sales $282 up 5% $269 Operating EBITDA $65 up 8% $60 |

| First Quarter 2008: Increase in net sales primarily driven by favorable pricing and foreign currency effects Volumes pressured by continued softness in U.S. housing and construction segments Increased revenues offset raw material cost pressures Industrial Specialties in millions 1st Qtr 2008 1st Qtr 2007 Net Sales $365 up 5% $346 Operating EBITDA $36 up 38% $26 |

| Acetyl Intermediates in millions 1st Qtr 2008 1st Qtr 2007 Net Sales $1,096 up 31% $839 Operating EBITDA $246 up 41% $174 First Quarter 2008: Strong global demand sustained higher pricing levels and drove record sales for the quarter Incremental volumes from the Nanjing plant also contributed to increase Favorable supply/demand environment and increased dividends from Ibn Sina more than offset higher raw material and energy costs |

| 1Q 2007 1Q 2008 1Q 2007 1Q 2008 Earnings - Equity Investments 18 10 Dividends - Cost Investments 15 28 Total affiliate earnings impact improved 15% to $38 million from prior year Increased dividends from Ibn Sina methanol and MTBE cost affiliate more than offset performance of AEM affiliates currently pressured by high raw material and energy costs Cash from affiliates increased with higher dividends from Ibn Sina and our equity partners due to timing Total Operating EBITDA of $381 excludes ~$30 million of proportional Affiliate EBITDA Income Statement Cash Flow Affiliates Continue to Deliver Value |

| Continued Strong Cash Generation Adjusted Free Cash Flow Adjusted Free Cash Flow Adjusted Free Cash Flow in millions 1st Qtr 2008 1st Qtr 2007 Net cash provided by operating activities $166 $12 Adjustments to operating cash for discontinued operations $1 $61 Net cash provided by operating activities from continuing operations $167 $73 Less: Capital expenditures $81 $49 Other adjustments1 $19 $11 Adjusted Free Cash Flow $67 $13 Factors contributing to strong cash generation during 2008: Strong operating performance Increased dividends from cost and equity affiliates Lower cash taxes Continued commitment and increased investment in Asia 1Amounts primarily associated with the cash outflows for purchases of other productive assets that are classified as 'investing activities' for U.S. GAAP purposes. |

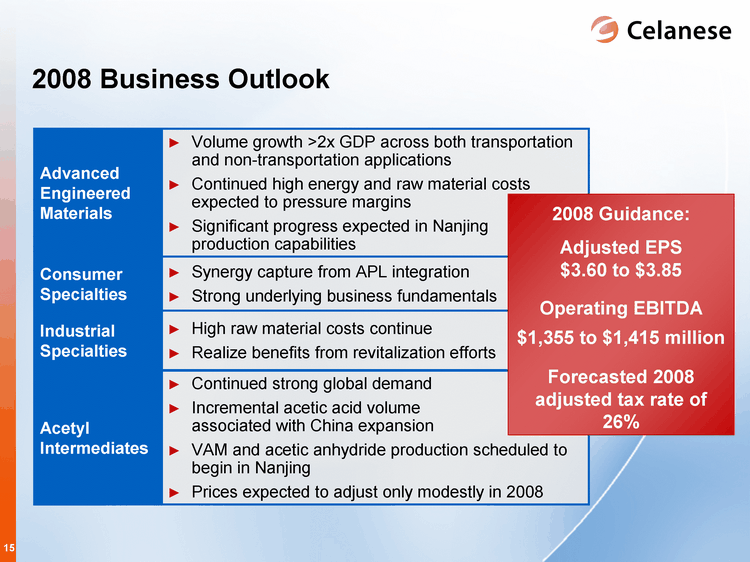
| 2008 Business Outlook Continued strong global demand Incremental acetic acid volume associated with China expansion VAM and acetic anhydride production scheduled to begin in Nanjing Prices expected to adjust only modestly in 2008 Acetyl Intermediates Volume growth >2x GDP across both transportation and non-transportation applications Continued high energy and raw material costs expected to pressure margins Significant progress expected in Nanjing production capabilities Advanced Engineered Materials Synergy capture from APL integration Strong underlying business fundamentals Consumer Specialties High raw material costs continue Realize benefits from revitalization efforts Industrial Specialties 2008 Guidance: Adjusted EPS $3.60 to $3.85 Operating EBITDA $1,355 to $1,415 million Forecasted 2008 adjusted tax rate of 26% |

| Affiliate Income increased on strong performance of Ibn Sina Net Interest updated to reflect strong Euro translation on foreign debt Diluted Share Count updated to reflect 1.6 million shares repurchased in 1Q Depreciation and Amortization increased on foreign currency impacts Cash Taxes expected to be higher primarily as a result of increased earnings outlook Update to 2008 Guidance in millions Previous Current Affiliate Income1 $175 - $185 $200 - $215 Net Interest2 $200 - $210 $210 - $220 Diluted Share Count 169 167 Depreciation and Amortization $300 - $310 $310 - $320 Cash Taxes $100 -$120 $125 - $145 Capital Expenditures $280 - $300 $280 - $300 Estimated Adjusted Tax Rate for EPS 26% 26% 1Cost dividends and equity earnings 2Net interest income and interest expense Adjusted Free Cash Flow Adjusted Free Cash Flow $500 - $550 $550 - $600 Previous Current Operating EBITDA $1,355 - $1,415 |

| Appendix |

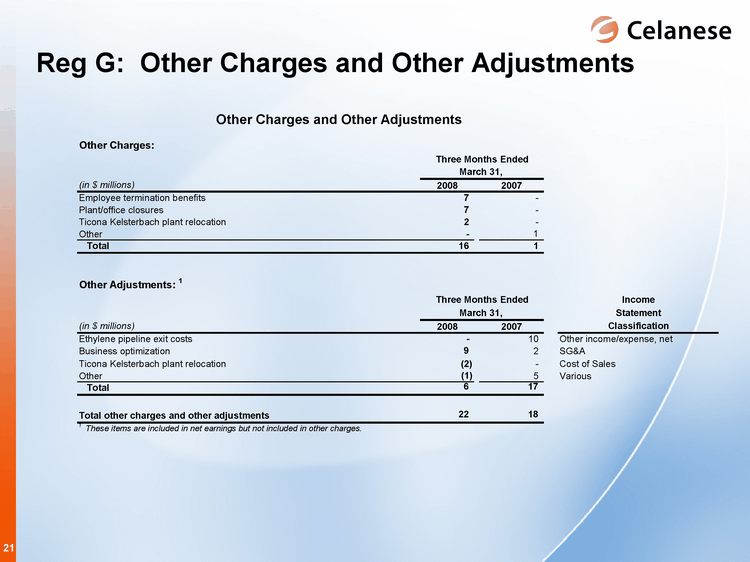
| 1Q 2008 Other Charges and Other Adjustments by Segment $ in millions AEM CS IS AI Other Total Employee termination benefits 1 1 1 2 2 7 Plant/office closures - - 2 5 - 7 Ticona Kelsterbach relocation 2 - - - - 2 Total other charges 3 1 3 7 2 16 Business optimization - - 2 - 7 9 Ticona Kelsterbach relocation (2) - - - - (2) Other - - - 1 (2) (1) Total other adjustments (2) - 2 1 5 6 Total other charges and other adjustments 1 1 5 8 7 22 |

| Reg G: Reconciliation of Adjusted EPS |

| Reg G: Reconciliation of Net Debt |

| Reg G: Other Charges and Other Adjustments |

| Reg G: Reconciliation of Operating EBITDA |

| Reg G: Equity Affiliate Preliminary Results and Celanese Proportional Share - Unaudited |