Exhibit 99
![]()
Transformation and
Results
Celanese 4Q2004 Earnings
Conference Call/Webcast
Mon., Feb. 28, 2005 10 a.m CT
David Weidman, CEO
C.J. Nelson, CFO
![]()
| Forward-Looking Statements |
This presentation may contain “forward-looking statements,” which include information concerning the Company’s plans, objectives, goals, strategies, future revenues or performance, capital expenditures, financing needs and other information that is not historical information. When used in this presentation, the words “estimates,” “expects,” “anticipates,” “projects,” “plans,” “intends,” “believes,” and variations of such words or similar expressions are intended to identify forward-looking statements. All forward-looking statements are based upon current expectations and beliefs and various assumptions. There can be no assurance that the Company will realize these expectations or that these beliefs will prove correct.
There are a number of risks and uncertainties that could cause actual results to differ materially from the forward-looking statements contained in this presentation. Numerous factors, many of which are beyond the Company’s control, could cause actual results to differ materially from those expressed as forward-looking statements. For a discussion of some of the factors, we recommend that you review the Company’s Registration Statement on Form S-1 at the SEC’s website at www.sec.gov. Any forward-looking statement speaks only as of the date on which it is made, and the Company undertakes no obligation to update any forward-looking statements to reflect events or circumstances after the date on which it is made or to reflect the occurrence of anticipated or unanticipated events or circumstances.
![]()
| Reconciliation of Non-GAAP Measures to U.S. GAAP |
This presentation reflects our performance measures, net debt, and Segment Earnings as non-U.S. GAAP measures. The most directly comparable financial measure presented in accordance with U.S. GAAP in our financial statements for net debt is total debt and for Segment Earnings is earnings (loss) from continuing operations before tax and minority interests. This presentation also reflects our debt covenant measure Adjusted EBITDA. The most directly comparable financial measure presented in accordance with U.S. GAAP in our financial statements for this is net earnings (loss). This presentation also reflects the 2004 net sales, operating profit, net income and depreciation and amortization as a summation of these measures derived from (i) the financial statements for the predecessor for the three months ended March 31, 2004, and (ii) the financial statements for the successor for the nine months ended December 31, 2004, for each period prepared on a basis consistent with U.S. GAAP. The combined presentation is not in accordance with GAAP. For a reconciliation of these non-U.S. GAAP measures to U.S. GAAP figures see the accompanying schedules to this presentation. Reconciliations of any forward-looking non-U.S. GAAP measure to U.S. GAAP measures are not available.
![]()
| Use of Non-GAAP Financial Information |
Adjusted EBITDA, a performance measure used by management, is defined as earnings (loss) from continuing operations, plus interest expense net of interest income, income taxes and depreciation and amortization, and further adjusted for certain cash and non-cash charges. Our management believes Adjusted EBITDA is useful to investors because it is used in our debt instruments to determine compliance with financial covenants and our ability to engage in certain activities such as incurring additional debt and making certain payments. Segment Earnings, another performance measure used by management, is defined as earnings (loss) from continuing operations before tax and minority interests excluding depreciation and amortization, special charges, stock appreciation rights and inventory step up.
Adjusted EBITDA and Segment Earnings are the primary measures our management uses for its planning and budgeting processes and to monitor and evaluate financial and operating results. Adjusted EBITDA and Segment Earnings are not recognized terms under U.S. GAAP and do not purport to be alternatives to net earnings as measures of operating performance or to cash flows from operating activities as a measure of liquidity. Because not all companies use identical calculations, this presentation of Adjusted EBITDA and Segment Earnings may not be comparable to other similarly titled measures of other companies. Additionally, Adjusted EBITDA and Segment Earnings are not intended to be measures of free cash flow for management’s discretionary use, as they do not consider certain cash requirements such as interest payments, tax payments and debt service requirements. We believe that the presentation of all of the non-GAAP information provides useful information to management and investors regarding various financial and business trends relating to our financial condition and results of operations, and that when GAAP information is viewed in conjunction with non-GAAP information, investors are provided with a more meaningful understanding of our ongoing operating performance. This non-GAAP information is not intended to be considered in isolation or as a substitute for GAAP financial information.
![]()
| Q4 and ’04 Results |
(in $millions) | Q404 | Combined FY04 | |||||
Sales | $1,332 up 15% | $5,069 up 10% | |||||
Gross Profit | $303 up 98% | $975 up 35% | |||||
Net Earnings (loss) | $(57 | ) | $(175 | ) | |||
Dividends from Affiliates | $11 | $77 | |||||
Adjusted EBITDA | $187 up 3% | $801 up 19% |
| Strong demand across all lines, regions | ||
| Results occurred during time of transformation |
Underlying results reflect strength of strategy
![]()
C. J. Nelson
Executive Vice President and Chief Financial Officer
![]()
| Financial Overview |
| Fourth Quarter | Full Year | |||||||
| (in $millions) | Successor | Predecessor | Combined | Predecessor | ||||
2004 | 2003 | 2004 | 2003 | |||||
| Sales | 1,332 | 1,155 | 5,069 | 4,603 | ||||
| Gross Profit | 303 | 153 | 975 | 720 | ||||
| SG&A | (220) | (126) | (635) | (510) | ||||
| Special Charges | (33) | (14) | (119) | (5) | ||||
| Operating Profit (Loss) | 28 | (10) | 130 | 118 | ||||
| Interest Expense | (72) | (13) | (306) | (49) | ||||
| Tax | (12) | 8 | (87) | (53) | ||||
| Net Earnings (Loss) | (57) | 18 | (175) | 148 | ||||
| Affiliate Dividends | 11 | 29 | 77 | 76 | ||||
| Adjusted EBITDA | 187 | 182 | 801 | 675 | ||||
![]()
| Net Earnings to Adjusted EBITDA walk - 2004 |

![]()
| Significant Contribution from Joint Ventures |
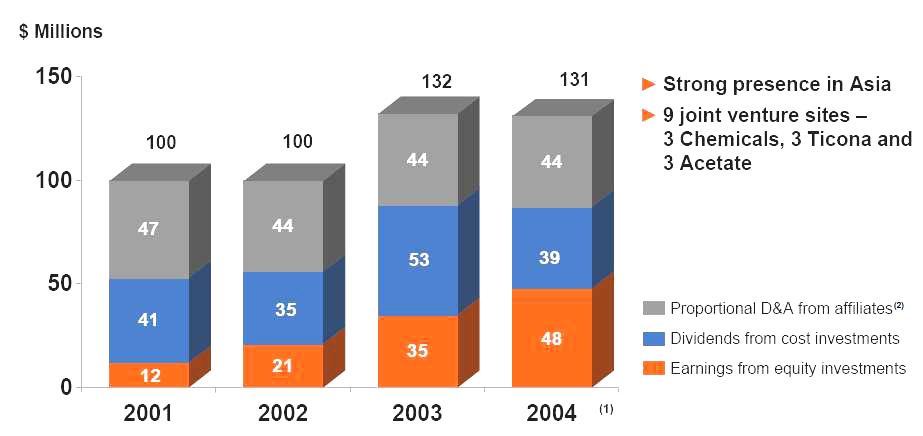
Joint Venture Investments Drive Strategic Growth and Financial Performance |
| Note: | (1) | 2004 Proportional D&A from affiliates shown is an estimate |
| (2) | D&A as presented in the chart above represents the amount recorded by the investees based on local generally accepted accounting principles, computed in proportion to our ownership percentage. These amounts are not included in the D&A reported by Celanese. | |
![]()
| Pro Forma Capitalization (1) |
| Pro-Forma as of 12/31/04 | |||||||
December 31, 2004 | Post- IPO | With Acquisitions | |||||
| Cash | $838 | $838 | $838 | ||||
| Existing Term Loan B(2) | $624 | $0 | $0 | ||||
| New Term Loan B(3) | $0 | $1,569 | $1,769 | ||||
| New Delayed Draw Term Loan C | $0 | $0 | $242 | ||||
| Floating Rate Term Loan | $350 | $0 | $0 | ||||
| Total Senior Debt | $974 | $1,569 | $2,011 | ||||
| Senior Sub Notes ($) | $1,231 | $800 | $800 | ||||
| Senior Sub Notes (€)(4) | $272 | $177 | $177 | ||||
| Acetex Notes | $0 | $0 | $265 | ||||
| Assumed Debt | $383 | $383 | $383 | ||||
| Total Cash Pay Debt | $2,860 | $2,929 | $3,636 | ||||
| Discount Notes Series A | $103 | $66 | $66 | ||||
| Discount Notes Series B | $424 | $276 | $276 | ||||
| Total Debt | $3,387 | $3,271 | $3,978 | ||||
| Convertible Preferred | $240 | $240 | |||||
| Market Capitalization | $2,741(5) | $2,741(5) | |||||
| Total Capitalization | $6,252 | $6,959 | |||||
| 1 Table shows debt balances and pro forma adjustments as of 12/31/04 | 4 | Converted at €1 =$1.3621 | |
| 2 Includes €125 million of Euro denominated debt (converted at €1 = $1.3621) | 5 | Based on closing price of $17.27 on 2/25/05 | |
| 3 Includes €275 million of Euro denominated debt (converted at €1 = $1.3621) |
![]()
| Pension and OPEB Plan Obligations |
Aggressive contributing increased funded status dramatically | ||
| • | Plan contributions of $500 million increased ABO funded status from 77% at FYE ‘03 to 90% at FYE ’04 | |
Total benefit obligations decreased | ||
| • | Total benefit obligations decreased from $1.165 billion to $1.006 billion as plan contributions offset increases from purchase accounting | |
2005 pension contribution expense is half of 2004 levels | ||
| • | As a result of purchase accounting and plan contributions, 2005 pension expense is expected to be $26 million and 2005 OPEB expense is also expected to be $26 million. On a historical basis, 2004 cost was over $110 million | |
Under current pension legislation, we do not anticipate making pension plan contributions for the foreseeable future | ||
![]()
| 2004 Capital Expenditures |

![]()
Business Segment/2005 Outlook
David Weidman
Chief Executive Officer
![]()
| 2004 Business Highlights |
| Vinamul acquisition* extends Acetyls chain | |
| Announced Acetex acquisition provides for reliable supply to global market | |
| Acetate restructuring to enhance profitability of a leading Celanese business | |
| Nanjing, China plant becoming reality | |
| SG&A actions in all major businesses and administrative centers | |
| Procurement initiatives on track | |
* Announced ’04, completed ‘05
![]()
| Chemicals Products Historical Perspective: |
| Margin expansion in Q4 and full year | |
| Strong demand, favorable pricing in all regions during year, and improved productivity | |
| Fourth quarter results particularly strong | |
| (in $millions) | |||
Q404 | FY2004 Combined | ||
| Sales | $925 up 21% | $3,391 up 11% | |
| Segment Earnings(1) | $142 up 78% | $476 up 38% | |
| (1) – | Earnings from continuing operations before tax and minority interests excluding Depreciation and amortization, Special Charges, Stock Appreciation Rights, Inventory Step up |
![]()
| Chemical Products Outlook |
| 1st Quarter | |
| Sustained demand, favorable pricing | |
| Modest raw material increases | |
| Margin momentum continues | |
| Full Year | |
| Sustained demand pricing | |
| Southern Methanol decreases Gulf Coast gas exposure | |
| Ethylene price relief from contracts | |
| Second half supply/demand balance to loosen on expansions | |
| Positive pricing momentum in downstream Celanese products | |
![]()
| Ticona Historical Perspective |
| Solid ’04 volume growth of 13%, all lines contributing | |
| Raw material increases offset by volume growth during year | |
| Q4 volume growth rate declines but is still strong at 6% | |
| Q4 profit erosion due to raw materials, price, and effects of maintenance turnaround | |
| $32 million impairment charge for planned COC sale | |
| (in $millions) | |||
Q404 | FY2004 Combined | ||
| Sales | $203 up 8% | $863 up 13% | |
| Segment Earnings(1) | $18 down 28% | $192 up 28% | |
| (1) – | Earnings from continuing operations before tax and minority interests excluding Depreciation and amortization, Special Charges, Stock Appreciation Rights, Inventory Step up |
![]()
| Ticona Outlook |
| 1st Quarter | |
| Continuation of slowed demand and raw material pressures | |
| Full Year | |
| Earnings growth momentum to pick up in second half and beyond after temporary correction in key markets | |
![]()
| Acetate/Performance Products Summaries |
| Acetate | |
| Stable financial results continue | |
| Focus is on completion of restructuring plan and significant benefits | |
| Performance Products | |
| Strong earnings in full year on Sunett volume growth | |
| Profitability will decline after patent expiration in March ’05, but will remain high margin business | |
![]()
| Combined Business Outlook |
| 1st Quarter | |
| 25-30% increase in adjusted EBITDA vs. Q1 ’04 | |
| Reflective of strong business growth and affiliate dividends | |
| Full Year | |
| 12-17% growth in adjusted EBITDA vs. ‘04 | |
| Reflective of strong business environment, methanol agreement and acquisitions | |
Appendix
![]()
| Appendix – Full Year 2005 Key Modeling Assumptions |
Equity – CE Shares | |||
| • | Common stock = 158.7 million outstanding | ||
| • | Fully diluted common stock = 170.7 million | ||
| • | Preferred stock dividends = approx. $10 million on 9.6 million outstanding shares | ||
Equity – CAG Minority Interest | |||
| • | Approximately 8 million shares outstanding as of February 16 | ||
| • | Current tender offer price = €41.92/share | ||
| • | Net guaranteed payment = approximately €24 million | ||
Capital Expenditures | |||
| • | Capital expenditures = $210 - $230 | ||
Income Statement ($ millions) | |||
| • | Depreciation = $230-$250 | ||
| • | Special charges = $30-$50 | ||
| • | Interest expense = $250-$260 | ||
| • | Excluding deferred finance/debt premium of approx. $115 | ||
| • | Avg cost of borrowed capital = 7% | ||
| • | Effective tax rate of 34% to 37% | ||
| • | Monitoring fee | ||
| • | Annual fee $10 | ||
| • | Cancellation $35 | ||
| • | Terminated Jan ’05 | ||
![]()
| Reconciliation of Segment Earnings |
Q4 2004 Successor | Q4 2003 Predecessor | |||||||||||||||||||||||
| Technical | Technical | |||||||||||||||||||||||
| Chemical | Polymers | Acetate | Performance | Other | Chemical | Polymers | Acetate | Performance | Other | |||||||||||||||
| Products | Ticona | Products | Products | Activities | Total | Products | Ticona | Products | Products | Activities | Total | |||||||||||||
| Earnings(loss) from Continuing Operations | ||||||||||||||||||||||||
| before Tax and Minority Interests | 131 | (29) | 18 | 3 | (162) | (39) | 35 | (9) | 2 | 11 | (42) | (3) | ||||||||||||
| Depreciation and Amortization | 12 | 14 | 3 | 5 | 0 | 34 | 41 | 14 | 23 | 1 | 2 | 81 | ||||||||||||
| Special Charges | (1) | 33 | 0 | 0 | 1 | 33 | 0 | 16 | 0 | 0 | (2) | 14 | ||||||||||||
| Stock Appreciation Rights | 0 | 0 | 0 | 0 | 0 | 0 | 4 | 4 | 1 | 0 | 9 | 18 | ||||||||||||
| Purchase Accounting for Inventories | 0 | 0 | 0 | 0 | 0 | 0 | 0 | 0 | 0 | 0 | 0 | 0 | ||||||||||||
Segment Earnings | 142 | 18 | 21 | 8 | (161) | 28 | 80 | 25 | 26 | 12 | (33) | 110 | ||||||||||||
FY 2004 Combined | FY 2003 Predecessor | |||||||||||||||||||||||
| Technical | Technical | |||||||||||||||||||||||
| Chemical | Polymers | Acetate | Performance | Other | Chemical | Polymers | Acetate | Performance | Other | |||||||||||||||
| Products | Ticona | Products | Products | Activities | Total | Products | Ticona | Products | Products | Activities | Total | |||||||||||||
| Earnings(loss) from Continuing Operations | ||||||||||||||||||||||||
| before Tax and Minority Interests | 329 | 71 | 2 | 26 | (530) | (102) | 175 | 167 | 17 | (44) | (119) | 196 | ||||||||||||
| Depreciation and Amortization | 128 | 64 | 46 | 12 | 6 | 256 | 157 | 57 | 66 | 7 | 7 | 294 | ||||||||||||
| Special Charges | 4 | 38 | 50 | 0 | 27 | 119 | (1) | (87) | 0 | 95 | (2) | 5 | ||||||||||||
| Stock Appreciation Rights | 0 | 1 | 0 | 0 | 0 | 1 | 14 | 13 | 4 | 1 | 27 | 59 | ||||||||||||
| Purchase Accounting for Inventories | 15 | 18 | 4 | 12 | 0 | 49 | 0 | 0 | 0 | 0 | 0 | 0 | ||||||||||||
Segment Earnings | 476 | 192 | 102 | 50 | (497) | 323 | 345 | 150 | 87 | 59 | (87) | 554 | ||||||||||||