Exhibit 99.2
Celanese
Celanese 2Q 2011 Earnings
Conference Call / Webcast
Thursday, July 21, 2011 10:00 a.m. ET
Dave Weidman, Chairman and Chief Executive Officer
Steven Sterin, Senior Vice President and Chief Financial Officer
CE
Listed
NYSE
1
Celanese
Forward looking statements
Reconciliation and use of non-GAAP measures to U.S. GAAP
This presentation may contain “forward-looking statements,” which include information concerning the company’s plans, objectives, goals, strategies, future revenues or performance, capital expenditures, financing needs and other information that is not historical information. When used in this release, the words “outlook,” “forecast,” “estimates,” “expects,” “anticipates,” “projects,” “plans,” “intends,” “believes,” “may,” “can,” “could,” “might,” “will,” and variations of such words or similar expressions are intended to identify forward-looking statements. All forward-looking statements are based upon current expectations and beliefs and various assumptions. There can be no assurance that the company will realize these expectations or that these beliefs will prove correct.
There are a number of risks and uncertainties that could cause actual results to differ materially from the results expressed or implied in the forward-looking statements contained in this release. These risks and uncertainties include, among other things: changes in general economic, business, political and regulatory conditions in the countries or regions in which we operate; the length and depth of business cycles, particularly in the automotive, electrical, electronics and construction industries; changes in the price and availability of raw materials; the ability to pass increases in raw material prices on to customers or otherwise improve margins through price increases; the ability to maintain plant utilization rates and to implement planned capacity additions and expansions; the ability to improve productivity by implementing technological improvements to existing plants; increased price competition and the introduction of competing products by other companies; market acceptance of our technology; the ability to obtain governmental approvals and to construct facilities on terms and schedule acceptable to the company; changes in the degree of intellectual property and other legal protection afforded to our products; compliance and other costs and potential disruption of production due to accidents or other unforeseen events or delays in construction or operation of facilities; potential liability for remedial actions and increased costs under existing or future environmental regulations, including those relating to climate change; potential liability resulting from pending or future litigation, or from changes in the laws, regulations or policies of governments or other governmental activities in the countries in which we operate; changes in currency exchange rates and interest rates; and various other factors discussed from time to time in the company’s filings with the Securities and Exchange Commission. Any forward-looking statement speaks only as of the date on which it is made, and the company undertakes no obligation to update any forward-looking statements to reflect events or circumstances after the date on which it is made or to reflect the occurrence of anticipated or unanticipated events or circumstances.
Reconciliation of Non-U.S. GAAP Measures to U.S. GAAP
This presentation reflects the following performance measures: operating EBITDA, business operating EBITDA, affiliate EBITDA and proportional affiliate EBITDA, adjusted earnings per share, net debt and adjusted free cash flow, as non-U.S. GAAP measures. These measurements are not recognized in accordance with U.S. GAAP and should not be viewed as an alternative to U.S. GAAP measures of performance. The most directly comparable financial measure presented in accordance with U.S. GAAP in our consolidated financial statements for operating EBITDA and business EBITDA is operating profit; for proportional affiliate EBITDA is equity in net earnings of affiliates; for affiliate EBITDA is operating profit; for adjusted earnings per share is earnings per common share-diluted; for net debt is total debt; and for adjusted free cash flow is cash flow from operations.
Use of Non-U.S. GAAP Financial Information
Operating EBITDA, a measure used by management to measure performance, is defined by the company as net earnings minus interest income plus loss (earnings) from discontinued operations, interest expense, income taxes and depreciation and amortization, and further adjusted for Other Charges and Adjustments as described in Table 7. We may provide guidance on operating EBITDA and are unable to reconcile forecasted operating EBITDA to a U.S. GAAP financial measure because a forecast of Other Charges and Adjustments is not practical.
Business operating EBITDA, a measure used by management to measure performance of its internal operations, is defined by the company as net earnings minus interest income plus loss (earnings) from discontinued operations, interest expense, income taxes and depreciation and amortization, and further adjusted for Other Charges and Adjustments as described in Table 7, less equity in net earnings of affiliates, dividend income from cost investments and other (income) expense. This reflects the operating results of the company’s operations without regard to its equity and cost investments. The company believes that investors should consider business operating EBITDA when evaluating the company’s internal operations.
Affiliate EBITDA is defined by the company as operating profit plus the depreciation and amortization of its equity affiliates. Proportional affiliate EBITDA, a measure used by management to measure performance of its equity investments, is defined by the company as the proportional operating profit plus the proportional depreciation and amortization of its equity investments. The company has determined that it does not have sufficient ownership for operating control of these investments to consider their results on a consolidated basis.
Adjusted earnings per share is a measure used by management to measure performance. It is defined by the company as net earnings (loss) available to common shareholders plus preferred dividends, adjusted for other charges and adjustments, and divided by the number of basic common shares, diluted preferred shares, and options valued using the treasury method. We may provide guidance on an adjusted earnings per share basis and are unable to reconcile forecasted adjusted earnings per share to a U.S. GAAP financial measure without unreasonable effort because a forecast of Other Items is not practical. We believe that the presentation of this non-U.S. GAAP measure provides useful information to management and investors regarding various financial and business trends relating to our financial condition and results of operations, and that when U.S. GAAP information is viewed in conjunction with non-U.S. GAAP information, investors are provided with a more meaningful understanding of our ongoing operating performance. Note: The income tax rate used for adjusted earnings per share approximates the midpoint in a range of forecasted tax rates for the year. This range may include certain partial or full-year forecasted tax opportunities, where applicable, and specifically excludes changes in uncertain tax positions, discrete items and other material items adjusted out of our U.S. GAAP earnings for adjusted earnings per share purposes, and changes in management's assessments regarding the ability to realize deferred tax assets. We analyze this rate quarterly and adjust if there is a material change in the range of forecasted tax rates; an updated forecast would not necessarily result in a change to our tax rate used for adjusted earnings per share. The adjusted tax rate is an estimate and may differ from the tax rate used for U.S. GAAP reporting in any given reporting period. It is not practical to reconcile our prospective adjusted tax rate to the actual U.S. GAAP tax rate in any given future period.
Net debt is defined by the company as total debt less cash and cash equivalents. We believe that the presentation of this non-U.S. GAAP measure provides useful information to management and investors regarding changes to the company’s capital structure. Our management and credit analysts use net debt to evaluate the company's capital structure and assess credit quality. Proportional net debt is defined as our proportionate share of our affiliates’ net debt.
Adjusted free cash flow is defined by the company as cash flow from operations less capital expenditures, other productive asset purchases, operating cash from discontinued operations and certain other charges and adjustments. We believe that the presentation of this non-U.S. GAAP measure provides useful information to management and investors regarding changes to the company’s cash flow. Our management and credit analysts use adjusted free cash flow to evaluate the company’s liquidity and assess credit quality.
Results Unaudited
The results presented in this presentation, together with the adjustments made to present the results on a comparable basis, have not been audited and are based on internal financial data furnished to management. Quarterly results should not be taken as an indication of the results of operations to be reported for any subsequent period or for the full fiscal year.
2
Celanese
Dave Weidman
Chairman and Chief Executive Officer
3
Celanese
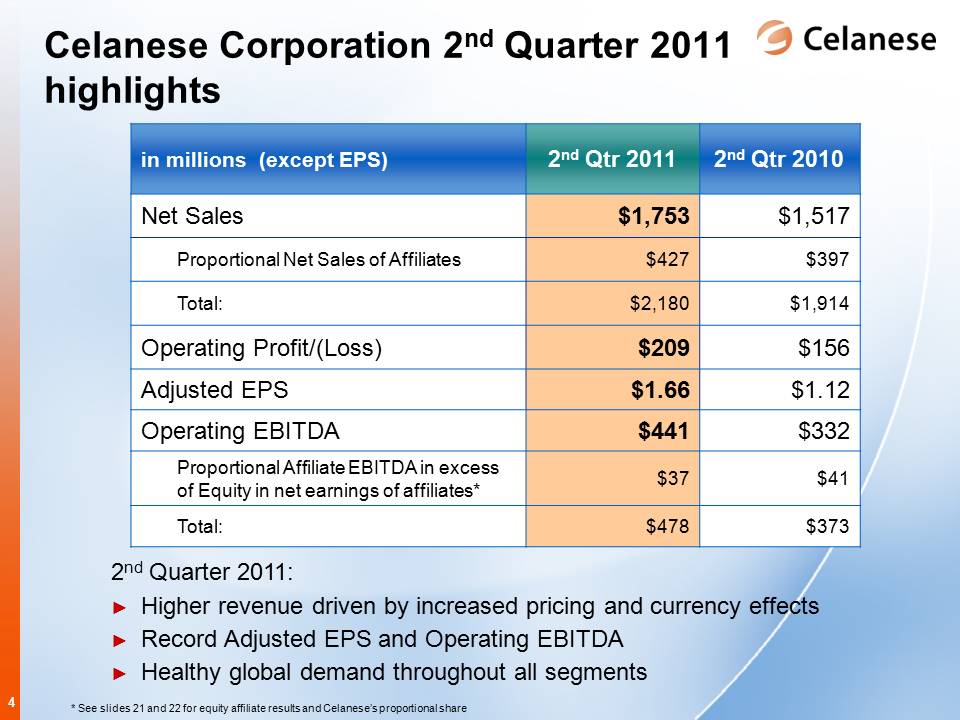
Celanese Corporation 2nd Quarter 2011 highlights
|
| | | | | | |
| in millions (except EPS) | 2nd Qtr 2011 | 2nd Qtr 2010 |
| Net Sales | $ | 1,753 |
| $ | 1,517 |
|
| Proportional Net Sales of Affiliates | $ | 427 |
| $ | 397 |
|
| Total: | $ | 2,180 |
| $ | 1,914 |
|
| Operating Profit/(Loss) | $ | 209 |
| $ | 156 |
|
| Adjusted EPS | $ | 1.66 |
| $ | 1.12 |
|
| Operating EBITDA | $ | 441 |
| $ | 332 |
|
| Proportional Affiliate EBITDA in excess of Equity in net earnings of affiliates* | $ | 37 |
| $ | 41 |
|
| Total: | $ | 478 |
| $ | 373 |
|
2nd Quarter 2011:
Higher revenue driven by increased pricing and currency effects
Record Adjusted EPS and Operating EBITDA
Healthy global demand throughout all segments
* See slides 21 and 22 for equity affiliate results and Celanese’s proportional share
4
Celanese
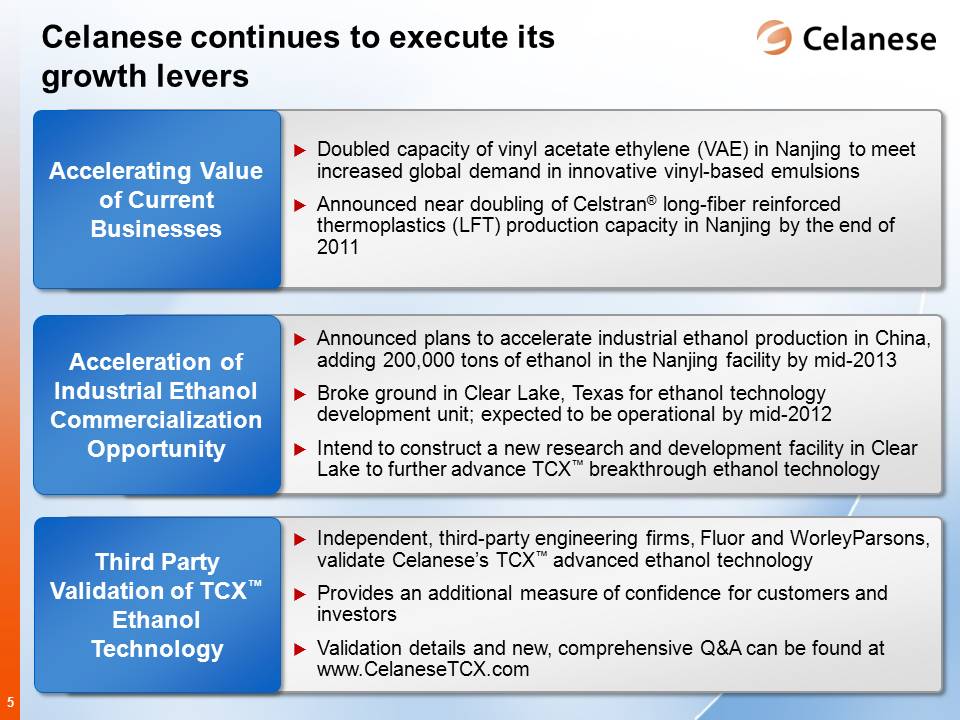
Celanese continues to execute its growth levers
Accelerating Value of Current Businesses:
| |
| • | Doubled capacity of vinyl acetate ethylene (VAE) in Nanjing to meet increased global demand in innovative vinyl-based emulsions |
| |
| • | Announced near doubling of Celstran® long-fiber reinforced thermoplastics (LFT) production capacity in Nanjing by the end of 2011 |
Acceleration of Industrial Ethanol Commercialization Opportunity:
| |
| • | Announced plans to accelerate industrial ethanol production in China, adding 200,000 tons of ethanol in the Nanjing facility by mid-2013 |
| |
| • | Broke ground in Clear Lake, Texas for ethanol technology development unit; expected to be operational by mid-2012 |
| |
| • | Intend to construct a new research and development facility in Clear Lake to further advance TCX™ breakthrough ethanol technology |
Third Party Validation of TCX™ Ethanol Technology:
| |
| • | Independent, third-party engineering firms, Fluor and WorleyParsons, validate Celanese’s TCX™ advanced ethanol technology |
| |
| • | Provides an additional measure of confidence for customers and investors |
| |
| • | Validation details and new, comprehensive Q&A can be found at www.CelaneseTCX.com |
5
Celanese
Steven Sterin
Senior Vice President and Chief Financial Officer
6
Celanese
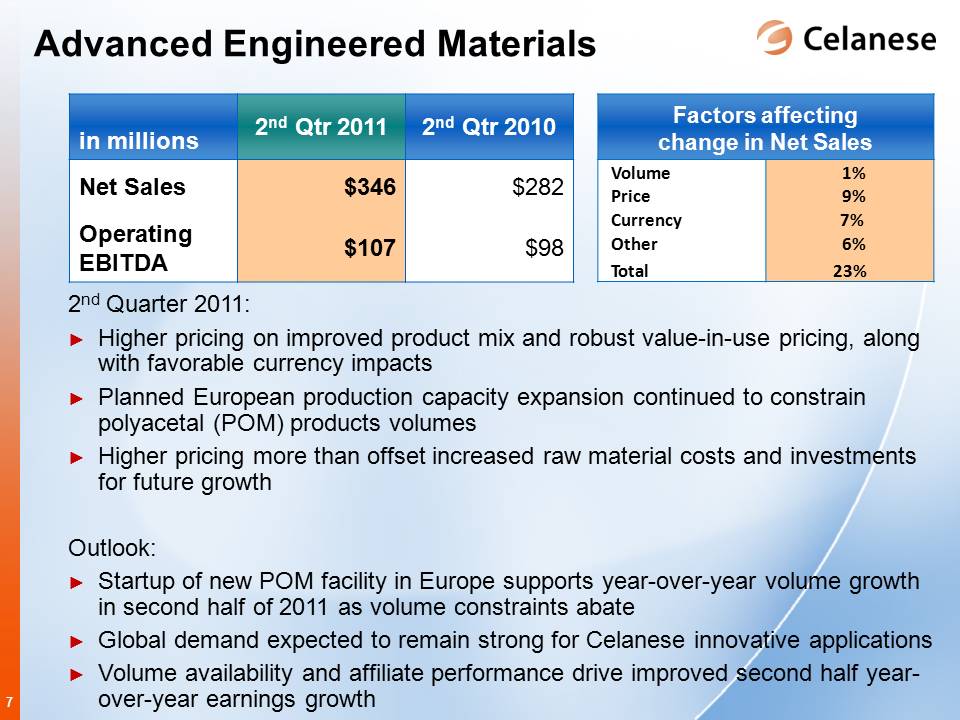
Advanced Engineered Materials
|
| | | | | | |
| in millions | 2nd Qtr 2011 | 2nd Qtr 2010 |
| Net Sales | $ | 346 |
| $ | 282 |
|
| Operating EBITDA | $ | 107 |
| $ | 98 |
|
| Factors affectingchange in Net Sales | | |
| Volume | 1% | |
| Price | 9% | |
| Currency | 7% | |
| Other | 6% | |
| Total | 23% | |
2nd Quarter 2011:
Higher pricing on improved product mix and robust value-in-use pricing, along with favorable currency impacts
Planned European production capacity expansion continued to constrain polyacetal (POM) products volumes
Higher pricing more than offset increased raw material costs and investments for future growth
Outlook:
Startup of new POM facility in Europe supports year-over-year volume growth in second half of 2011 as volume constraints abate
Global demand expected to remain strong for Celanese innovative applications
Volume availability and affiliate performance drive improved second half year-over-year earnings growth
7
Celanese
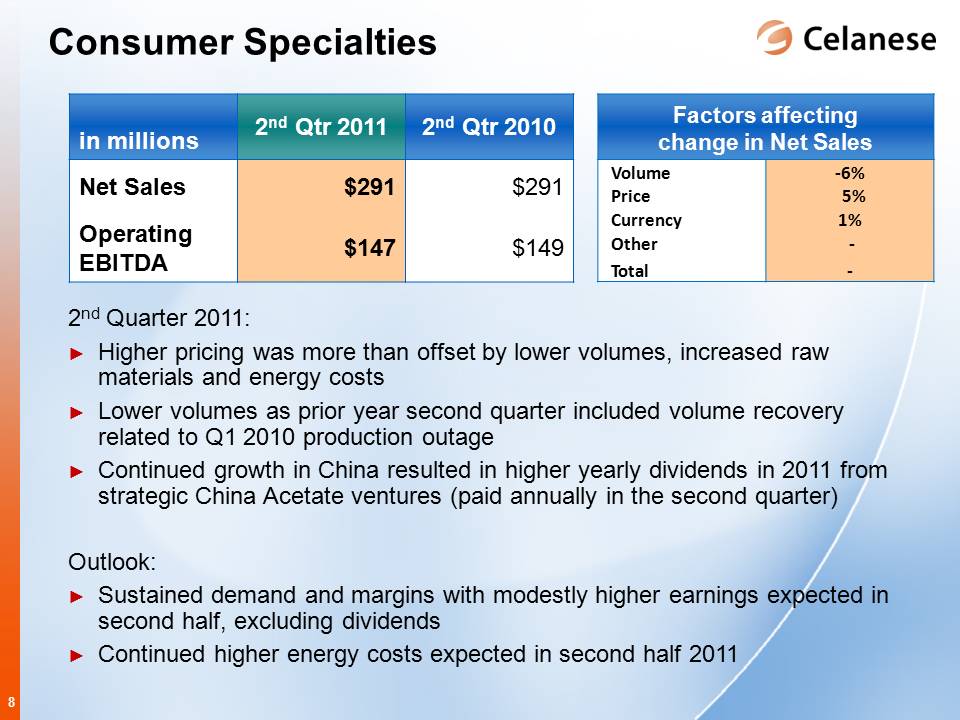
Consumer Specialties
|
| | | | | | |
| in millions | 2nd Qtr 2011 | 2nd Qtr 2010 |
| Net Sales | $ | 291 |
| $ | 291 |
|
| Operating EBITDA | $ | 147 |
| $ | 149 |
|
| Factors affecting change in Net Sales | | |
| | | |
| Volume | (6)% | |
| Price | 5% | |
| Currency | 1% | |
| Other | — | |
| Total | — | |
2nd Quarter 2011:
Higher pricing was more than offset by lower volumes, increased raw materials and energy costs
Lower volumes as prior year second quarter included volume recovery related to Q1 2010 production outage
Continued growth in China resulted in higher yearly dividends in 2011 from strategic China Acetate ventures (paid annually in the second quarter)
Outlook:
Sustained demand and margins with modestly higher earnings expected in second half, excluding dividends
Continued higher energy costs expected in second half 2011
8
Celanese
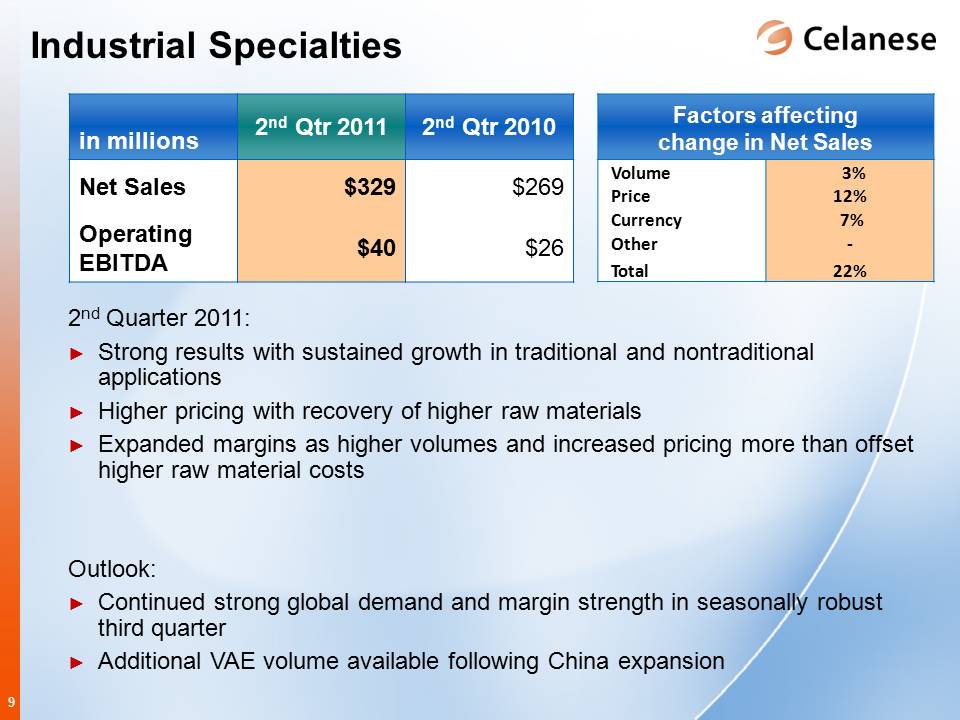
Industrial Specialties
|
| | | | | | |
| in millions | 2nd Qtr 2011 | 2nd Qtr 2010 |
| Net Sales | $ | 329 |
| $ | 269 |
|
| Operating EBITDA | $ | 40 |
| $ | 26 |
|
| Factors affecting change in Net Sales | | |
| Volume | 3% | |
| Price | 12% | |
| Currency | 7% | |
| Other | — | |
| Total | 22% | |
2nd Quarter 2011:
Strong results with sustained growth in traditional and nontraditional applications
Higher pricing with recovery of higher raw materials
Expanded margins as higher volumes and increased pricing more than offset higher raw material costs
Outlook:
Continued strong global demand and margin strength in seasonally robust third quarter
Additional VAE volume available following China expansion
9
Celanese
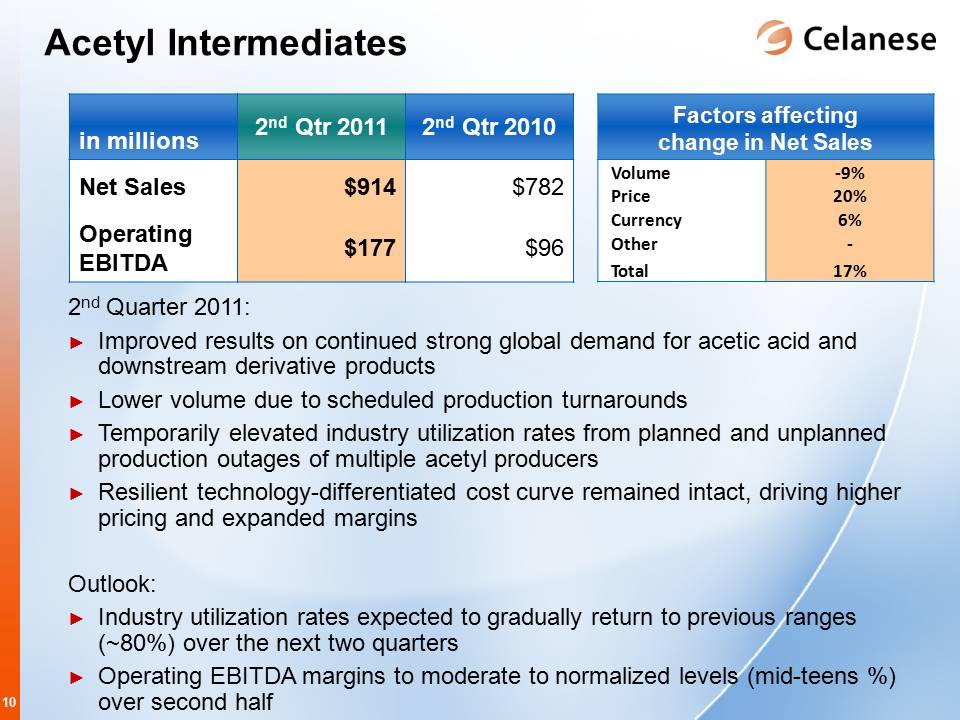
Acetyl Intermediates
|
| | | | | | |
| in millions | 2nd Qtr 2011 | 2nd Qtr 2010 |
| Net Sales | $ | 914 |
| $ | 782 |
|
| Operating EBITDA | $ | 177 |
| $ | 96 |
|
| Factors affecting change in Net Sales | | |
| Volume | (9)% | |
| Price | 20% | |
| Currency | 6% | |
| Other | — | |
| Total | 17% | |
2nd Quarter 2011:
Improved results on continued strong global demand for acetic acid and downstream derivative products
Lower volume due to scheduled production turnarounds
Temporarily elevated industry utilization rates from planned and unplanned production outages of multiple acetyl producers
Resilient technology-differentiated cost curve remained intact, driving higher pricing and expanded margins
Outlook:
Industry utilization rates expected to gradually return to previous ranges (~80%) over the next two quarters
Operating EBITDA margins to moderate to normalized levels (mid-teens %) over second half
10
Celanese
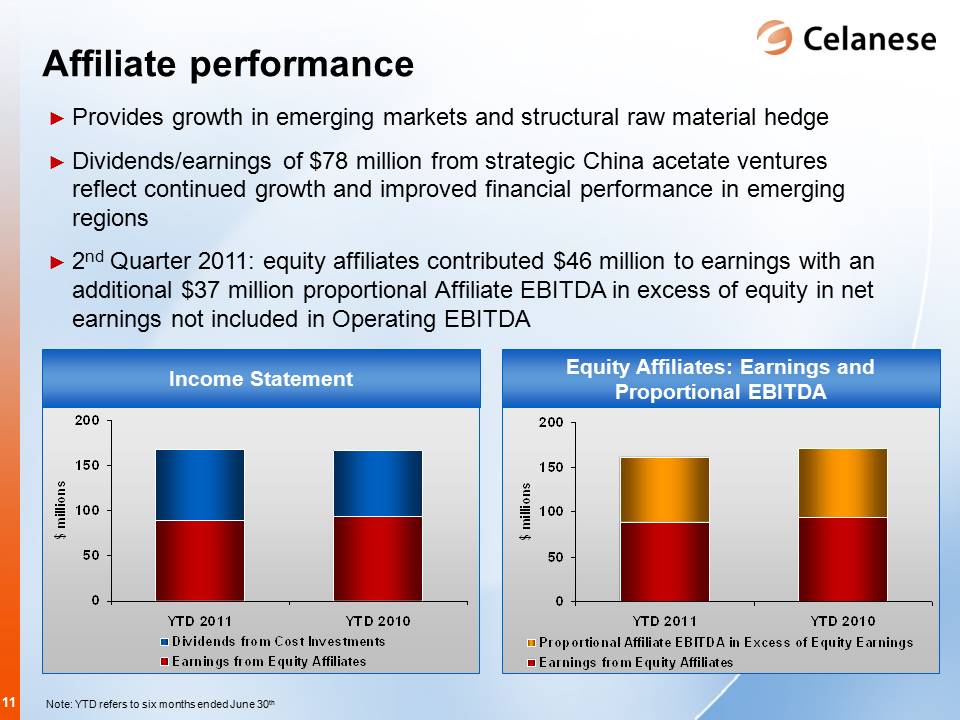
Affiliate Performance
Provides growth in emerging markets and structural raw material hedge
Dividends/earnings of $78 million from strategic China acetate ventures reflect continued growth and improved financial performance in emerging regions
2nd Quarter 2011: equity affiliates contributed $46 million to earnings with an additional $37 million proportional Affiliate EBITDA in excess of equity in net earnings not included in Operating EBITDA
Income Statement
$ millions
200 150 100 50 0 YTD 2011 YTD 2010
Dividends from Cost Investments
Earnings from Equity Affiliates
Equity Affiliates: Earnings and Proportional EBITDA
$ millions
200 150 100 50 0 YTD 2011 YTD 2010
Proportional Affiliate EBITDA in Excess of Equity Earnings
Earnings from Equity Affiliates
11
Celanese
Free cash flow 2nd Quarter 2011
|
| | |
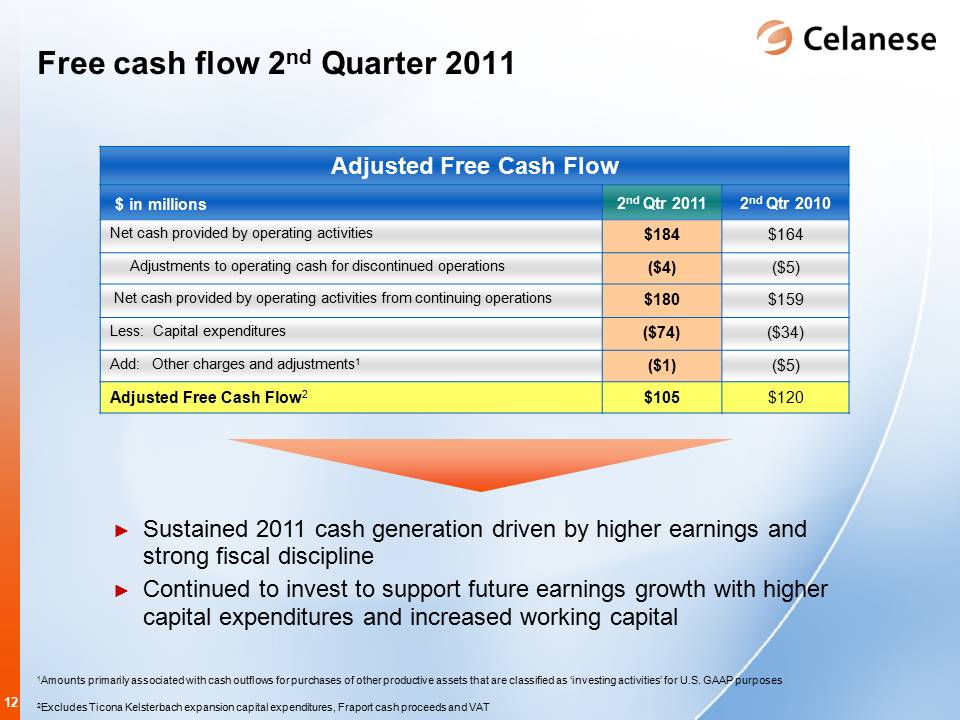
| Adjusted Free Cash Flow | | |
| $ in millions | 2nd Qtr 2011 | 2nd Qtr 2010 |
| Net cash provided by operating activities | $184 | $164 |
| Adjustments to operating cash for discontinued operations | $(4) | $(5) |
| Net cash provided by operating activities from continuing operations | $180 | $159 |
| Less: Capital expenditures | $(74) | $(34) |
| Add: Other charges and adjustments1 | $(1) | $(5) |
| Adjusted Free Cash Flow2 | $105 | $120 |
Sustained 2011 cash generation driven by higher earnings and strong fiscal discipline
Continued to invest to support future earnings growth with higher capital expenditures and increased working capital
1Amounts primarily associated with cash outflows for purchases of other productive assets that are classified as ‘investing activities’ for U.S. GAAP purposes
2Excludes Ticona Kelsterbach expansion capital expenditures, Fraport cash proceeds and VAT
12
Celanese
Strong cash generation continues throughout economic cycle
|
| | | |
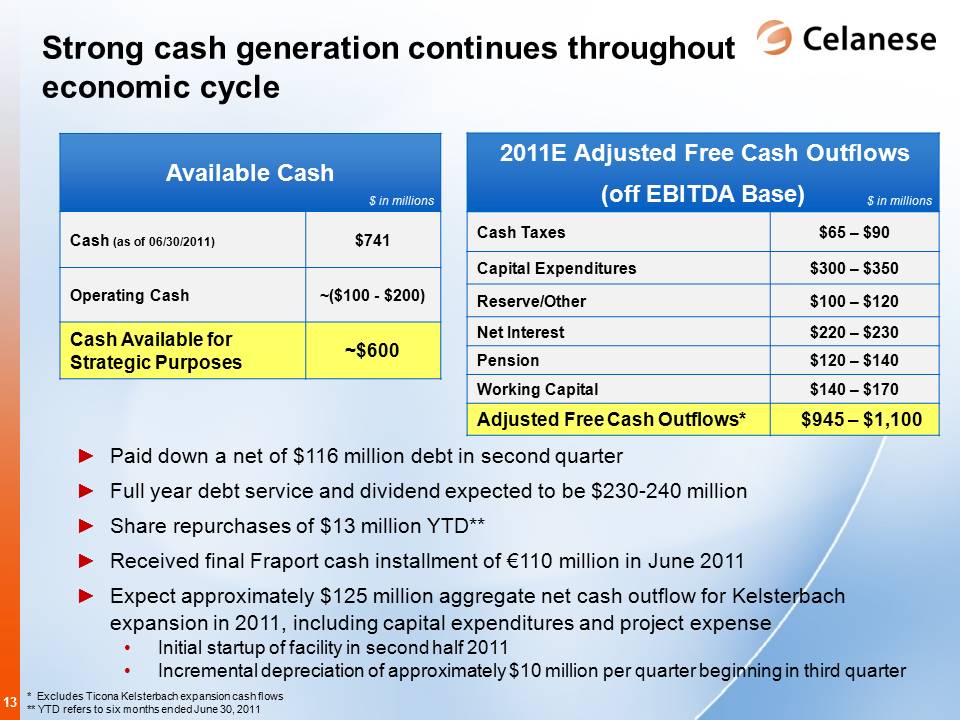
| Available Cash | $ in millions |
| Cash (as of 06/30/2011) | $ | 741 |
|
| Operating Cash | ~($100 - $200) |
|
| Cash Available for Strategic Purposes | ~$600 |
|
| 2011E Adjusted Free Cash Outflows(off EBITDA Base) | $ in millions |
| Cash Taxes | $65 – $90 |
|
| Capital Expenditures | $300 – $350 |
|
| Reserve/Other | $100 – $120 |
|
| Net Interest | $220 – $230 |
|
| Pension | $120 – $140 |
|
| Working Capital | $140 – $170 |
|
| Adjusted Free Cash Outflows* | $945 – $1,100 |
|
Paid down a net of $116 million debt in second quarter
Full year debt service and dividend expected to be $230-240 million
Share repurchases of $13 million YTD**
Received final Fraport cash installment of €110 million in June 2011
Expect approximately $125 million aggregate net cash outflow for Kelsterbach expansion in 2011, including capital expenditures and project expense
Initial startup of facility in second half 2011
Incremental depreciation of approximately $10 million per quarter beginning in third quarter
* Excludes Ticona Kelsterbach expansion cash flows
** YTD refers to six months ended June 30, 2011
13
Celanese
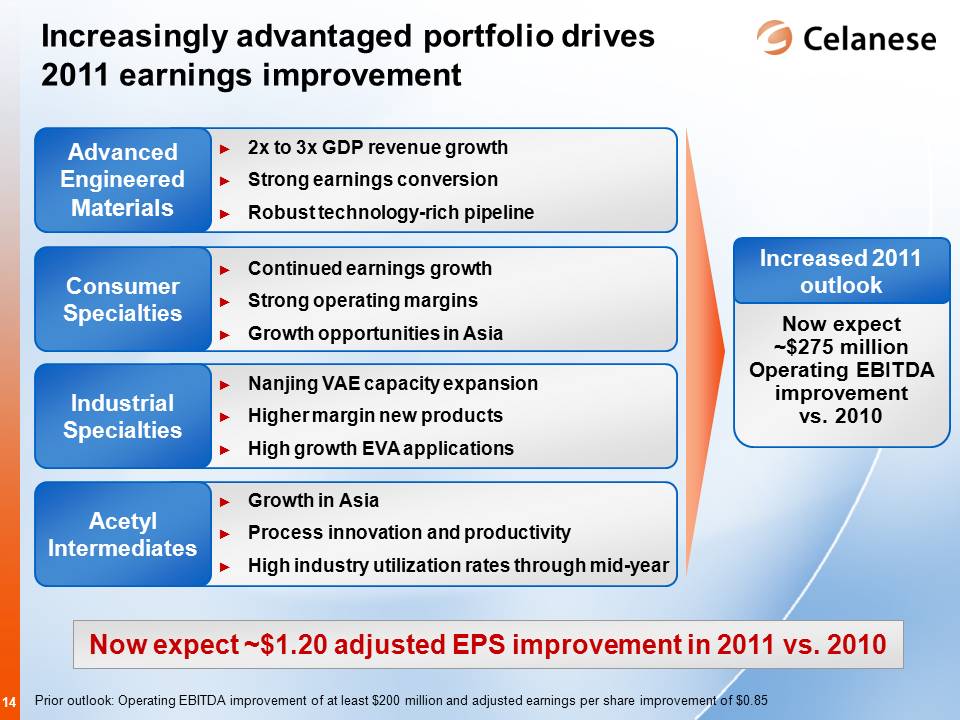
Increasingly advantaged portfolio drives 2011 earnings improvement
Advanced Engineered Materials
2x to 3x GDP revenue growth Strong earnings conversion Robust technology-rich pipeline
Consumer Specialties
Continued earnings growth Strong operating margins Growth opportunities in Asia
Industrial Specialties
Nanjing VAE capacity expansion Higher margin new products High growth EVA applications
Acetyl Intermediates
Growth in Asia Process innovation and productivity High industry utilization rates through mid-year
Increased 2011 outlook
Now expect ~$275 million Operating EBITDA improvement vs. 2010
Now expect ~$1.20 adjusted EPS improvement in 2011 vs. 2010
Prior outlook: Operating EBITDA improvement of at least $200 million and adjusted earnings per share improvement of $0.85
14
Celanese
Appendix
Notes:
References on the following slides to tables correspond to the tables included with Celanese press release dated July 21, 2011
15
Celanese
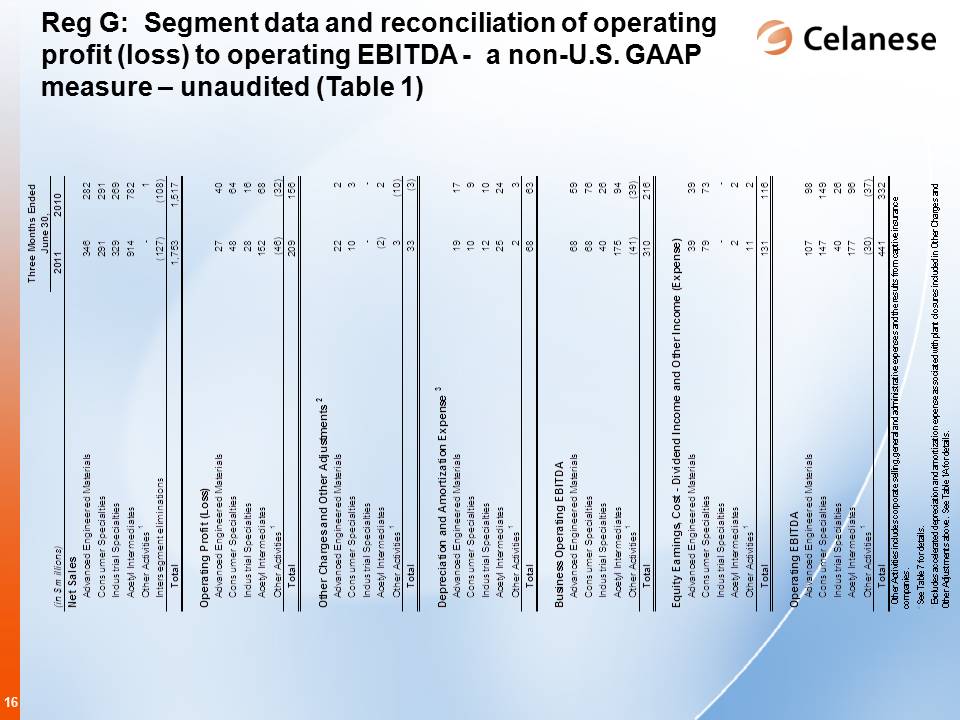
Reg G: Segment data and reconciliation of operating profit (loss) to operating EBITDA - a non-U.S. GAAP measure – unaudited (Table 1) |
| | | | | | | | | | |
| Three Months Ended | | | | | | |
| June 30, | | | | | | |
| (in $ millions) | 2011 | 2010 | | | 2011 |
| 2010 |
|
| Net Sales | | | | | | |
| Advanced Engineered Materials | 346 |
| 282 |
| | Business Operating EBITDA | | |
| Consumer Specialties | 291 |
| 291 |
| | Advanced Engineered Materials | 68 |
| 59 |
|
| Industrial Specialties | 329 |
| 269 |
| | Consumer Specialties | 68 |
| 76 |
|
| Acetyl Intermediates | 914 |
| 782 |
| | Industrial Specialties | 40 |
| 26 |
|
Other Activities 1 | — |
| 1 |
| | Acetyl Intermediates | 175 |
| 94 |
|
| Intersegment eliminations | (127 | ) | (108 | ) | | Other Activities 1 | (41 | ) | (39 | ) |
| Total | 1,753 |
| 1,517 |
| | Total | 310 |
| 216 |
|
| Operating Profit (Loss) | | | | Equity Earnings, Cost - Dividend Income and Other Income (Expense) | | |
| Advanced Engineered Materials | 27 |
| 40 |
| | Advanced Engineered Materials | 39 |
| 39 |
|
| Consumer Specialties | 48 |
| 64 |
| | Consumer Specialties | 79 |
| 73 |
|
| Industrial Specialties | 28 |
| 16 |
| | Industrial Specialties | — |
| — |
|
| Acetyl Intermediates | 152 |
| 68 |
| | Acetyl Intermediates | 2 |
| 2 |
|
Other Activities 1 | (46 | ) | (32 | ) | | Other Activities 1 | 11 |
| 2 |
|
| Total | 209 |
| 156 |
| | Total | 131 |
| 116 |
|
Other Charges and Other Adjustments 2 | | | | Operating EBITDA | | |
| Advanced Engineered Materials | 22 |
| 2 |
| | Advanced Engineered Materials | 107 |
| 98 |
|
| Consumer Specialties | 10 |
| 3 |
| | Consumer Specialties | 147 |
| 149 |
|
| Industrial Specialties | — |
| — |
| | Industrial Specialties | 40 |
| 26 |
|
| Acetyl Intermediates | (2 | ) | 2 |
| | Acetyl Intermediates | 177 |
| 96 |
|
Other Activities 1 | 3 |
| (10 | ) | | Other Activities 1 | (30 | ) | (37 | ) |
| Total | 33 |
| (3 | ) | | Total | 441 |
| 332 |
|
Depreciation and Amortization Expense 3 | | | | | | |
| Advanced Engineered Materials | 19 |
| 17 |
| | | | |
| Consumer Specialties | 10 |
| 9 |
| | | | |
| Industrial Specialties | 12 |
| 10 |
| | | | |
| Acetyl Intermediates | 25 |
| 24 |
| | | | |
Other Activities 1 | 2 |
| 3 |
| | | | |
| Total | 68 |
| 63 |
| | | | |
| 1 Other Activities includes corporate selling, general and administrative expenses and the results from captive insurance companies. |
| 2 See Table 7 for details. |
| 3 Excludes accelerated depreciation and amortization expense associated with plant closures included in Other Charges and Other Adjustments above. See Table 1A for details. |
16
Celanese
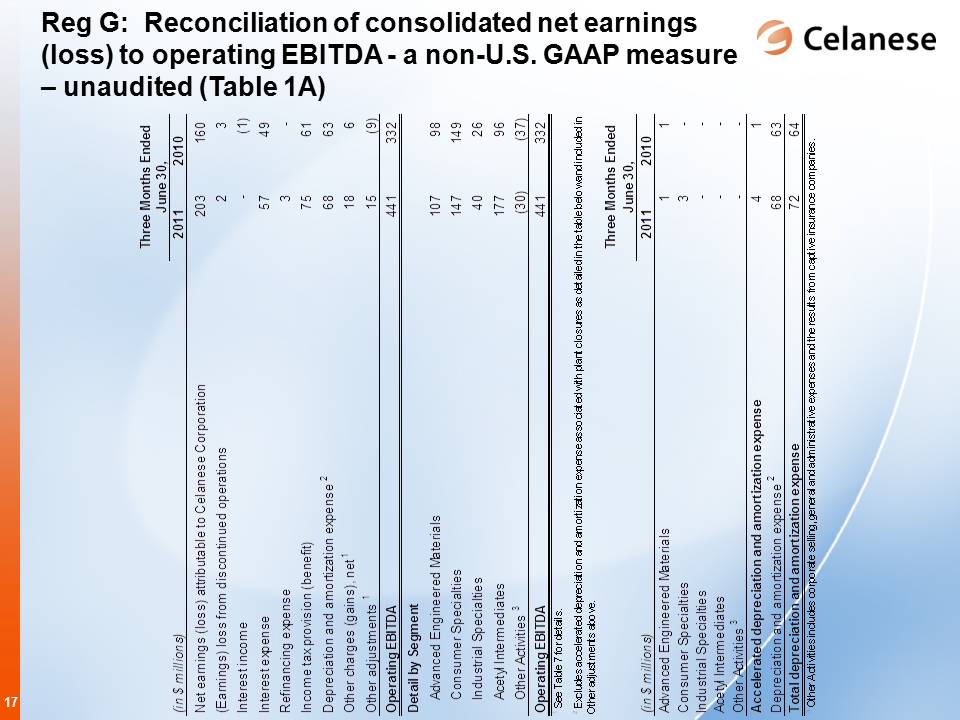
Reg G: Reconciliation of consolidated net earnings (loss) to operating EBITDA - a non-U.S. GAAP measure – unaudited (Table 1A)
|
| | | | |
| | Three Months Ended June 30, |
| (in $ millions) | 2011 | 2010 |
| Net earnings (loss) attributable to Celanese Corporation | 203 |
| 160 |
|
| (Earnings) loss from discontinued operations | 2 |
| 3 |
|
| Interest income | — |
| (1 | ) |
| Interest expense | 57 |
| 49 |
|
| Refinancing expense | 3 |
| — |
|
| Income tax provision (benefit) | 75 |
| 61 |
|
Depreciation and amortization expense 2 | 68 |
| 63 |
|
Other charges (gains), net 1 | 18 |
| 6 |
|
Other adjustments 1 | 15 |
| (9 | ) |
| Operating EBITDA | 441 |
| 332 |
|
| Detail by Segment | | |
| Advanced Engineered Materials | 107 |
| 98 |
|
| Consumer Specialties | 147 |
| 149 |
|
| Industrial Specialties | 40 |
| 26 |
|
| Acetyl Intermediates | 177 |
| 96 |
|
Other Activities 3 | (30 | ) | (37 | ) |
| Operating EBITDA | 441 |
| 332 |
|
| 1 See Table 7 for details. | | |
| 2 Excludes accelerated depreciation and amortization expense associated with plant closures as detailed in the table below and included in Other adjustments above. |
| | Three Months Ended June 30, |
| (in $ millions) | 2011 | 2010 |
| Advanced Engineered Materials | 1 |
| 1 |
|
| Consumer Specialties | 3 |
| — |
|
| Industrial Specialties | — |
| — |
|
| Acetyl Intermediates | — |
| — |
|
Other Activities 3 | — |
| — |
|
| Accelerated depreciation and amortization expense | 4 |
| 1 |
|
Depreciation and amortization expense 2 | 68 |
| 63 |
|
| Total depreciation and amortization expense | 72 |
| 64 |
|
| 3 Other Activities includes corporate selling, general and administrative expenses and the results from captive insurance companies. |
17
Celanese
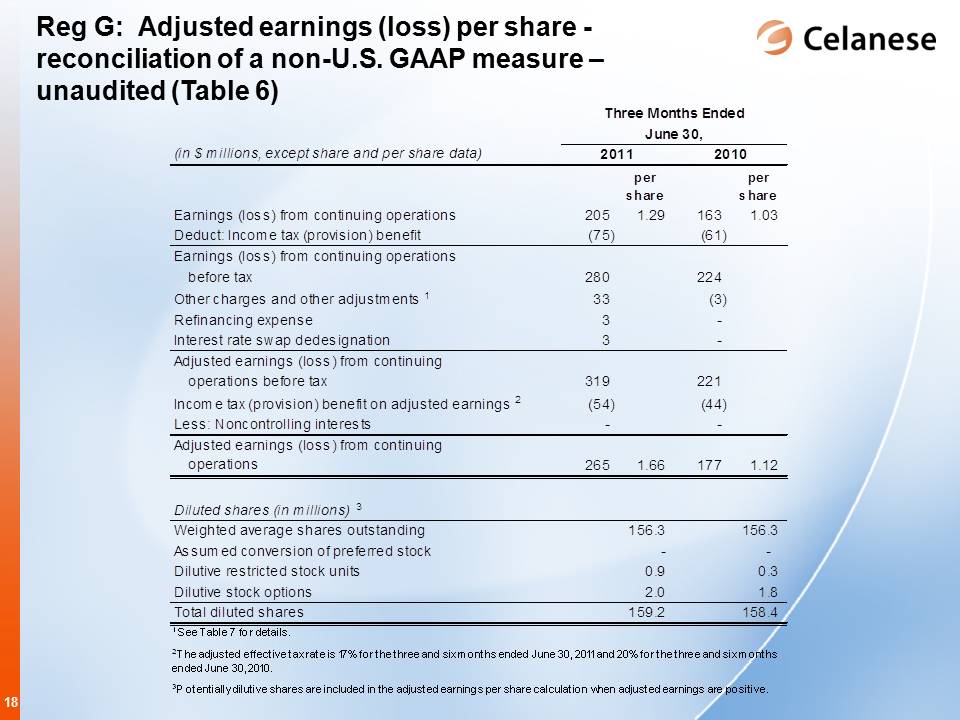
Reg G: Adjusted earnings (loss) per share - reconciliation of a non-U.S. GAAP measure – unaudited (Table 6)
|
| | | | | | | | |
| | Three Months Ended June 30, |
| (in $ millions, except share and per share data) | 2011 | | 2010 | |
| | | per share | | per share |
| Earnings (loss) from continuing operations | 205 |
| 1.29 |
| 163 |
| 1.03 |
|
| Deduct: Income tax (provision) benefit | (75 | ) | | (61 | ) | |
| Earnings (loss) from continuing operations before tax | 280 |
| | 224 |
| |
| Other charges and other adjustments 1 | 33 |
| | (3 | ) | |
| Refinancing expense | 3 |
| | — |
| |
| Interest rate swap dedesignation | 3 |
| | — |
| |
| Adjusted earnings (loss) from continuing operations before tax | 319 |
| | 221 |
| |
| Income tax (provision) benefit on adjusted earnings 2 | (54 | ) | | (44 | ) | |
| Less: Noncontrolling interests | — |
| | — |
| |
| Adjusted earnings (loss) from continuing operations | 265 |
| 1.66 | 177 |
| 1.12 |
|
| Diluted shares (in millions) 3 | | | | |
| Weighted average shares outstanding | | 156.3 |
| | 156.3 |
|
| Assumed conversion of preferred stock | | — |
| | — |
|
| Dilutive restricted stock units | | 0.9 |
| | 0.3 |
|
| Dilutive stock options | | 2.0 |
| | 1.8 |
|
| Total diluted shares | | 159.2 |
| | 158.4 |
|
| 1 See Table 7 for details. | | | | |
| 2 The adjusted effective tax rate is 17% for the three and six months ended June 30, 2011 and 20% for the three and six months ended June 30, 2010. |
| 3 Potentially dilutive shares are included in the adjusted earnings per share calculation when adjusted earnings are positive. |
18
Celanese
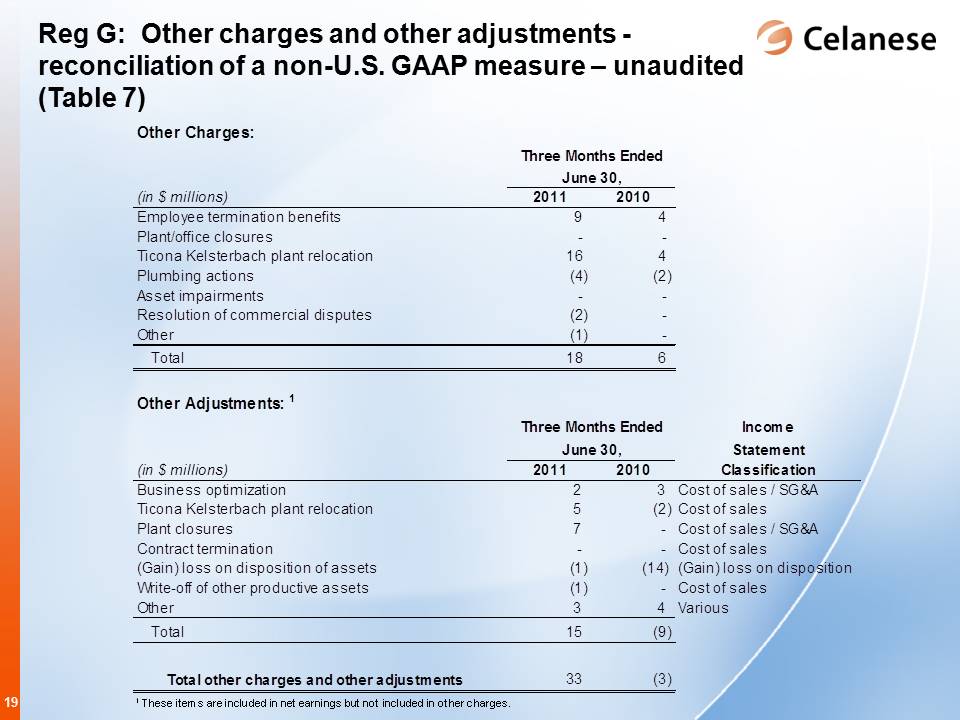
Reg G: Other charges and other adjustments - reconciliation of a non-U.S. GAAP measure – unaudited (Table 7)
|
| | | | | |
| Other Charges: | Three Months Ended June 30, | |
| (in $ millions) | 2011 | 2010 | |
| Employee termination benefits | 9 |
| 4 |
| |
| Plant/office closures | — |
| — |
| |
| Ticona Kelsterbach plant relocation | 16 |
| 4 |
| |
| Plumbing actions | (4 | ) | (2 | ) | |
| Asset impairments | — |
| — |
| |
| Resolution of commercial disputes | (2 | ) | — |
| |
| Other | (1 | ) | — |
| |
| Total | 18 |
| 6 |
| |
| Other Adjustments: 1 | Three Months Ended June 30, | |
| (in $ millions) | 2011 | 2010 | Income Statement Classification |
| Business optimization | 2 |
| 3 |
| Cost of sales / SG&A |
| Ticona Kelsterbach plant relocation | 5 |
| (2 | ) | Cost of sales |
| Plant closures | 7 |
| — |
| Cost of sales / SG&A |
| Contract termination | — |
| — |
| Cost of sales |
| (Gain) loss on disposition of assets | (1 | ) | (14 | ) | (Gain) loss on disposition |
| Write-off of other productive assets | (1 | ) | — |
| Cost of sales |
| Other | 3 |
| 4 |
| Various |
| Total | 15 |
| (9 | ) | |
| Total other charges and other adjustments | 33 |
| (3 | ) | |
| 1 These items are included in net earnings but not included in other charges. | | | |
19
Celanese
Reg G: 2Q 2011 Other charges and other adjustments by segment - reconciliation of a non-U.S. GAAP measure - unaudited
|
| | | | | | | | | | | | | |
| in millions | AEM | CS | IS | AI | Other | Total | Income Statement Classification |
| Employee termination benefits | 4 |
| 3 |
| — |
| 1 |
| 1 |
| 9 |
| |
| Plant/office closures | — |
| — |
| — |
| — |
| — |
| — |
| |
| Ticona Kelsterbach plant relocation | 16 |
| — |
| — |
| — |
| — |
| 16 |
| |
| Plumbing actions | (4 | ) | — |
| — |
| — |
| — |
| (4 | ) | |
| Asset impairments | — |
| — |
| — |
| — |
| — |
| — |
| |
| Insurance recoveries | — |
| — |
| — |
| — |
| — |
| — |
| |
| Resolution of commercial disputes | — |
| — |
| — |
| (2 | ) | — |
| (2 | ) | |
| Other | — |
| — |
| — |
| (1 | ) | — |
| (1 | ) | |
| Total other charges | 16 |
| 3 |
| — |
| (2 | ) | 1 |
| 18 |
| |
| Business optimization | — |
| — |
| — |
| — |
| 2 |
| 2 |
| Cost of Sales / SG&A |
| Ticona Kelsterbach plant relocation | 5 |
| — |
| — |
| — |
| — |
| 5 |
| Cost of Sales |
| Plant closures | 1 |
| 4 |
| — |
| 2 |
| — |
| 7 |
| Cost of Sales / SG&A |
| Contract termination | — |
| — |
| — |
| — |
| — |
| — |
| Cost of Sales |
| (Gain)/loss on disposition of assets | — |
| — |
| — |
| (1 | ) | — |
| (1 | ) | (Gain) loss on disposition |
| Write-off of other productive assets | — |
| — |
| — |
| (1 | ) | — |
| (1 | ) | Cost of Sales |
| Other | — |
| 3 |
| — |
| — |
| — |
| 3 |
| Various 1 |
| Total other adjustments | 6 |
| 7 |
| — |
| — |
| 2 |
| 15 |
| |
| Total other charges and other adjustments | 22 |
| 10 |
| — |
| (2 | ) | 3 |
| 33 |
| |
| 1 The following summarizes the income statement classification of the other adjustments: | | | | | | | |
| Cost of Sales | — |
| 3 |
| — |
| — |
| — |
| 3 |
| |
| Selling, General & Administrative | — |
| — |
| — |
| — |
| — |
| — |
| |
| Equity in net (earnings) loss of affiliates | — |
| — |
| — |
| — |
| — |
| — |
| |
| Other income/expense, net | — |
| — |
| — |
| — |
| — |
| — |
| |
| Total other | — |
| 3 |
| — |
| — |
| — |
| 3 |
| |
20
Celanese
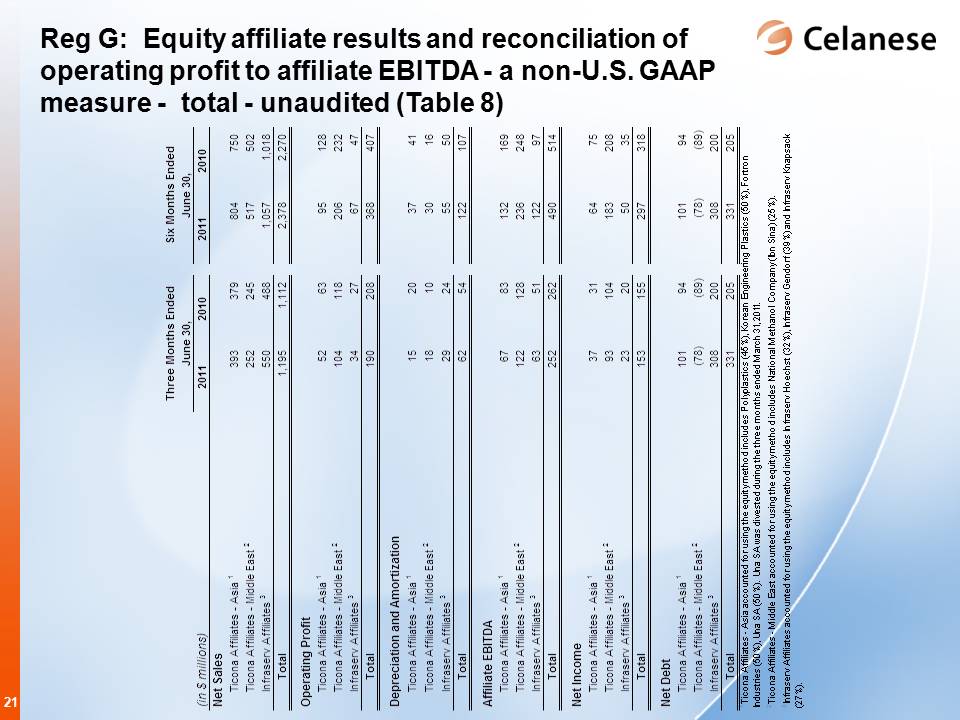
Reg G: Equity affiliate results and reconciliation of operating profit to affiliate EBITDA - a non-U.S. GAAP measure - total - unaudited (Table 8)
|
| | | | | | | | | |
| | Three Months Ended June 30, | | Six Months Ended June 30, |
| (in $ millions) | 2011 | 2010 | | 2011 | 2010 |
| Net Sales | | | | | |
| Ticona Affiliates - Asia 1 | 393 |
| 379 |
| | 804 |
| 750 |
|
| Ticona Affiliates - Middle East 2 | 252 |
| 245 |
| | 517 |
| 502 |
|
| Infraserv Affiliates 3 | 550 |
| 488 |
| | 1,057 |
| 1,018 |
|
| Total | 1,195 |
| 1,112 |
| | 2,378 |
| 2,270 |
|
| Operating Profit | | | | | |
| Ticona Affiliates - Asia 1 | 52 |
| 63 |
| | 95 |
| 128 |
|
| Ticona Affiliates - Middle East 2 | 104 |
| 118 |
| | 206 |
| 232 |
|
| Infraserv Affiliates 3 | 34 |
| 27 |
| | 67 |
| 47 |
|
| Total | 190 |
| 208 |
| | 368 |
| 407 |
|
| Depreciation and Amortization | | | | | |
| Ticona Affiliates - Asia 1 | 15 |
| 20 |
| | 37 |
| 41 |
|
| Ticona Affiliates - Middle East 2 | 18 |
| 10 |
| | 30 |
| 16 |
|
| Infraserv Affiliates 3 | 29 |
| 24 |
| | 55 |
| 50 |
|
| Total | 62 |
| 54 |
| | 122 |
| 107 |
|
| Affiliate EBITDA | | | | | |
| Ticona Affiliates - Asia 1 | 67 |
| 83 |
| | 132 |
| 169 |
|
| Ticona Affiliates - Middle East 2 | 122 |
| 128 |
| | 236 |
| 248 |
|
| Infraserv Affiliates 3 | 63 |
| 51 |
| | 122 |
| 97 |
|
| Total | 252 |
| 262 |
| | 490 |
| 514 |
|
| Net Income | | | | | |
| Ticona Affiliates - Asia 1 | 37 |
| 31 |
| | 64 |
| 75 |
|
| Ticona Affiliates - Middle East 2 | 93 |
| 104 |
| | 183 |
| 208 |
|
| Infraserv Affiliates 3 | 23 |
| 20 |
| | 50 |
| 35 |
|
| Total | 153 |
| 155 |
| | 297 |
| 318 |
|
| Net Debt | | | | | |
| Ticona Affiliates - Asia 1 | 101 |
| 94 |
| | 101 |
| 94 |
|
| Ticona Affiliates - Middle East 2 | (78 | ) | (89 | ) | | (78 | ) | (89 | ) |
| Infraserv Affiliates 3 | 308 |
| 200 |
| | 308 |
| 200 |
|
| Total | 331 |
| 205 |
| | 331 |
| 205 |
|
| 1 Ticona Affiliates - Asia accounted for using the equity method includes Polyplastics (45%), Korean Engineering Plastics (50%), Fortron Industries (50%), Una SA (50%). Una SA was divested during the three months ended March 31, 2011. |
| 2 Ticona Affiliates - Middle East accounted for using the equity method includes National Methanol Company (Ibn Sina) (25%). |
| 3 Infraserv Affiliates accounted for using the equity method includes Infraserv Hoechst (32%), Infraserv Gendorf (39%) and Infraserv Knapsack (27%). |
21
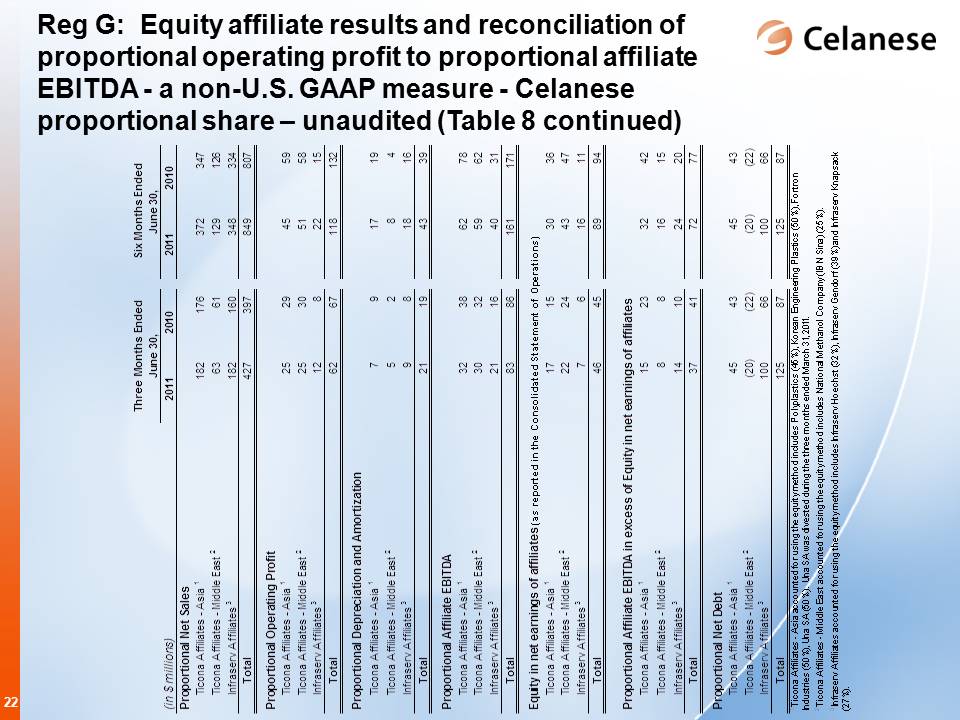
Celanese Reg G: Equity affiliate results and reconciliation of proportional operating profit to proportional affiliate EBITDA - a non-U.S. GAAP measure - Celanese proportional share – unaudited (Table 8 continued) |
| | | | | | | | | |
| | Three Months Ended June 30, | | Six Months Ended June 30, |
| (in $ millions) | 2011 | 2010 | | 2011 | 2010 |
| Proportional Net Sales | | | | | |
| Ticona Affiliates - Asia 1 | 182 |
| 176 |
| | 372 |
| 347 |
|
| Ticona Affiliates - Middle East 2 | 63 |
| 61 |
| | 129 |
| 126 |
|
| Infraserv Affiliates 3 | 182 |
| 160 |
| | 348 |
| 334 |
|
| Total | 427 |
| 397 |
| | 849 |
| 807 |
|
| Proportional Operating Profit | | | | | |
| Ticona Affiliates - Asia 1 | 25 |
| 29 |
| | 45 |
| 59 |
|
| Ticona Affiliates - Middle East 2 | 25 |
| 30 |
| | 51 |
| 58 |
|
| Infraserv Affiliates 3 | 12 |
| 8 |
| | 22 |
| 15 |
|
| Total | 62 |
| 67 |
| | 118 |
| 132 |
|
| Proportional Depreciation and Amortization | | | | | |
| Ticona Affiliates - Asia 1 | 7 |
| 9 |
| | 17 |
| 19 |
|
| Ticona Affiliates - Middle East 2 | 5 |
| 2 |
| | 8 |
| 4 |
|
| Infraserv Affiliates 3 | 9 |
| 8 |
| | 18 |
| 16 |
|
| Total | 21 |
| 19 |
| | 43 |
| 39 |
|
| Proportional Affiliate EBITDA | | | | | |
| Ticona Affiliates - Asia 1 | 32 |
| 38 |
| | 62 |
| 78 |
|
| Ticona Affiliates - Middle East 2 | 30 |
| 32 |
| | 59 |
| 62 |
|
| Infraserv Affiliates 3 | 21 |
| 16 |
| | 40 |
| 31 |
|
| Total | 83 |
| 86 |
| | 161 |
| 171 |
|
| Equity in net earnings of affiliates (as reported in the Consolidated Statement of Operations) | | | | | |
| Ticona Affiliates - Asia 1 | 17 |
| 15 |
| | 30 |
| 36 |
|
| Ticona Affiliates - Middle East 2 | 22 |
| 24 |
| | 43 |
| 47 |
|
| Infraserv Affiliates 3 | 7 |
| 6 |
| | 16 |
| 11 |
|
| Total | 46 |
| 45 |
| | 89 |
| 94 |
|
| Proportional Affiliate EBITDA in excess of Equity in net earnings of affiliates | | | | | |
| Ticona Affiliates - Asia 1 | 15 |
| 23 |
| | 32 |
| 42 |
|
| Ticona Affiliates - Middle East 2 | 8 |
| 8 |
| | 16 |
| 15 |
|
| Infraserv Affiliates 3 | 14 |
| 10 |
| | 24 |
| 20 |
|
| Total | 37 |
| 41 |
| | 72 |
| 77 |
|
| Proportional Net Debt | | | | | |
| Ticona Affiliates - Asia 1 | 45 |
| 43 |
| | 45 |
| 43 |
|
| Ticona Affiliates - Middle East 2 | (20 | ) | (22 | ) | | (20 | ) | (22 | ) |
| Infraserv Affiliates 3 | 100 |
| 66 |
| | 100 |
| 66 |
|
| Total | 125 |
| 87 |
| | 125 |
| 87 |
|
| 1 Ticona Affiliates - Asia accounted for using the equity method includes Polyplastics (45%), Korean Engineering Plastics (50%), Fortron Industries (50%), Una SA (50%). Una SA was divested during the three months ended March 31, 2011. |
| 2 Ticona Affiliates - Middle East accounted for using the equity method includes National Methanol Company (IBN Sina) (25%). |
| 3 Infraserv Affiliates accounted for using the equity method includes Infraserv Hoechst (32%), Infraserv Gendorf (39%) and Infraserv Knapsack (27%). |
22