Exhibit 99.2
Celanese 3Q 2011 Earnings
Conference Call / Webcast
Tuesday, October 25, 2011 10:00 a.m. ET
Dave Weidman, Chairman and Chief Executive Officer
Steven Sterin, Senior Vice President and Chief Financial Officer
CE
Listed
NYSE
1
Forward looking statements
Reconciliation and use of non-GAAP measures to U.S. GAAP
This presentation may contain “forward-looking statements,” which include information concerning the company's plans, objectives, goals, strategies, future revenues or performance, capital expenditures, financing needs and other information that is not historical information. When used in this presentation, the words “outlook,” “forecast,” “estimates,” “expects,” “anticipates,” “projects,” “plans,” “intends,” “believes,” “may,” “can,” “could,” “might,” “will” and variations of such words or similar expressions are intended to identify forward-looking statements. All forward-looking statements are based upon current expectations and beliefs and various assumptions. There can be no assurance that the company will realize these expectations or that these beliefs will prove correct.
There are a number of risks and uncertainties that could cause actual results to differ materially from the results expressed or implied in the forward-looking statements contained in this presentation. These risks and uncertainties include, among other things: changes in general economic, business, political and regulatory conditions in the countries or regions in which we operate; the length and depth of business cycles, particularly in the automotive, electrical, electronics and construction industries; changes in the price and availability of raw materials; the ability to pass increases in raw material prices on to customers or otherwise improve margins through price increases; the ability to maintain plant utilization rates and to implement planned capacity additions and expansions; the ability to improve productivity by implementing technological improvements to existing plants; increased price competition and the introduction of competing products by other companies; market acceptance of our technology; the ability to obtain governmental approvals and to construct facilities on terms and schedule acceptable to the company; changes in the degree of intellectual property and other legal protection afforded to our products; compliance and other costs and potential disruption or interruption of production or operations due to accidents, cyber security incidents, terrorism or political unrest or other unforeseen events or delays in construction or operation of facilities; potential liability for remedial actions and increased costs under existing or future environmental regulations, including those relating to climate change; potential liability resulting from pending or future litigation, or from changes in the laws, regulations or policies of governments or other governmental activities in the countries in which we operate; changes in currency exchange rates and interest rates; and various other factors discussed from time to time in the company's filings with the Securities and Exchange Commission. Any forward-looking statement speaks only as of the date on which it is made, and the company undertakes no obligation to update any forward-looking statements to reflect events or circumstances after the date on which it is made or to reflect the occurrence of anticipated or unanticipated events or circumstances.
Reconciliation of Non-U.S. GAAP Measures to U.S. GAAP
This presentation reflects the following performance measures: operating EBITDA, business operating EBITDA, affiliate EBITDA and proportional affiliate EBITDA, adjusted earnings per share, and net debt as non-U.S. GAAP measures. These measurements are not recognized in accordance with U.S. GAAP and should not be viewed as an alternative to U.S. GAAP measures of performance. The most directly comparable financial measure presented in accordance with U.S. GAAP in our consolidated financial statements for operating EBITDA and business operating EBITDA is net income; for proportional affiliate EBITDA is equity in net earnings of affiliates; for affiliate EBITDA is operating profit; for adjusted earnings per share is earnings per common share-diluted; and for net debt is total debt.
Use of Non-U.S. GAAP Financial Information
Operating EBITDA is defined by the company as net earnings less interest income plus loss (earnings) from discontinued operations, interest expense, taxes, and depreciation and amortization, and further adjusted for Other Charges and Adjustments as described in Table 7. We present operating EBITDA because we consider it an important supplemental measure of our operations and financial performance. We believe that operating EBITDA is more reflective of our operations as it provides transparency to investors and enhances period-to-period comparability of our operations and financial performance. Operating EBITDA is one of the measures management uses for its planning and budgeting process to monitor and evaluate financial and operating results and for the company's incentive compensation plan. Operating EBITDA should not be considered as an alternative to net income determined in accordance with U.S. GAAP. We may provide guidance on operating EBITDA and are unable to reconcile forecasted operating EBITDA to a U.S. GAAP financial measure because a forecast of Other Charges and Adjustments is not practical.
Business operating EBITDA is defined by the company as net earnings less interest income plus loss (earnings) from discontinued operations, interest expense, taxes and depreciation and amortization, and further adjusted for Other Charges and Adjustments as described in Table 7, less equity in net earnings of affiliates, dividend income from cost investments and other (income) expense. This supplemental performance measure reflects the operating results of the company's operations without regard to the financial impact of its equity and cost investments.
Affiliate EBITDA is defined by the company as operating profit plus the depreciation and amortization of its equity affiliates. Proportional affiliate EBITDA is defined by the company as the proportional operating profit plus the proportional depreciation and amortization of its equity investments. The company has determined that it does not have sufficient ownership for operating control of these investments to consider their results on a consolidated basis. The company believes that investors should consider proportional affiliate EBITDA as an additional measure of operating results.
Adjusted earnings per share is a measure used by management to measure performance. It is defined by the company as net earnings (loss) available to common shareholders plus preferred dividends, adjusted for other charges and adjustments, and divided by the number of basic common shares, diluted preferred shares, and options valued using the treasury method. We may provide guidance on an adjusted earnings per share basis and are unable to reconcile forecasted adjusted earnings per share to a U.S. GAAP financial measure without unreasonable effort because a forecast of Other Items is not practical. We believe that the presentation of this non-U.S. GAAP measure provides useful information to management and investors regarding various financial and business trends relating to our financial condition and results of operations, and that when U.S. GAAP information is viewed in conjunction with non-U.S. GAAP information, investors are provided with a more meaningful understanding of our ongoing operating performance. Note: The income tax rate used for adjusted earnings per share approximates the midpoint in a range of forecasted tax rates for the year. This range may include certain partial or full-year forecasted tax opportunities, where applicable, and specifically excludes changes in uncertain tax positions, discrete items and other material items adjusted out of our U.S. GAAP earnings for adjusted earnings per share purposes, and changes in management's assessments regarding the ability to realize deferred tax assets. We analyze this rate quarterly and adjust if there is a material change in the range of forecasted tax rates; an updated forecast would not necessarily result in a change to our tax rate used for adjusted earnings per share. The adjusted tax rate is an estimate and may differ from the tax rate used for U.S.GAAP reporting in any given reporting period. It is not practical to reconcile our prospective adjusted tax rate to the actual U.S. GAAP tax rate in any given future period.
Net debt is defined by the company as total debt less cash and cash equivalents. We believe that the presentation of this non-U.S. GAAP measure provides useful information to management and investors regarding changes to the company's capital structure. Our management and credit analysts use net debt to evaluate the company's capital structure and assess credit quality. Proportional net debt is defined as our proportionate share of our affiliates' net debt.
Adjusted free cash flow is defined by the company as cash flow from operations less capital expenditures, other productive asset purchases, operating cash from discontinued operations and certain other charges and adjustments. We believe that the presentation of this non-U.S. GAAP measure provides useful information to management and investors regarding changes to the company’s cash flow. Our management and credit analysts use adjusted free cash flow to evaluate the company’s liquidity and assess credit quality.
Results Unaudited
The results presented in this presentation, together with the adjustments made to present the results on a comparable basis, have not been audited and are based on internal financial data furnished to management. Quarterly results should not be taken as an indication of the results of operations to be reported for any subsequent period or for the full fiscal year.
2
Dave Weidman
Chairman and Chief Executive Officer
3
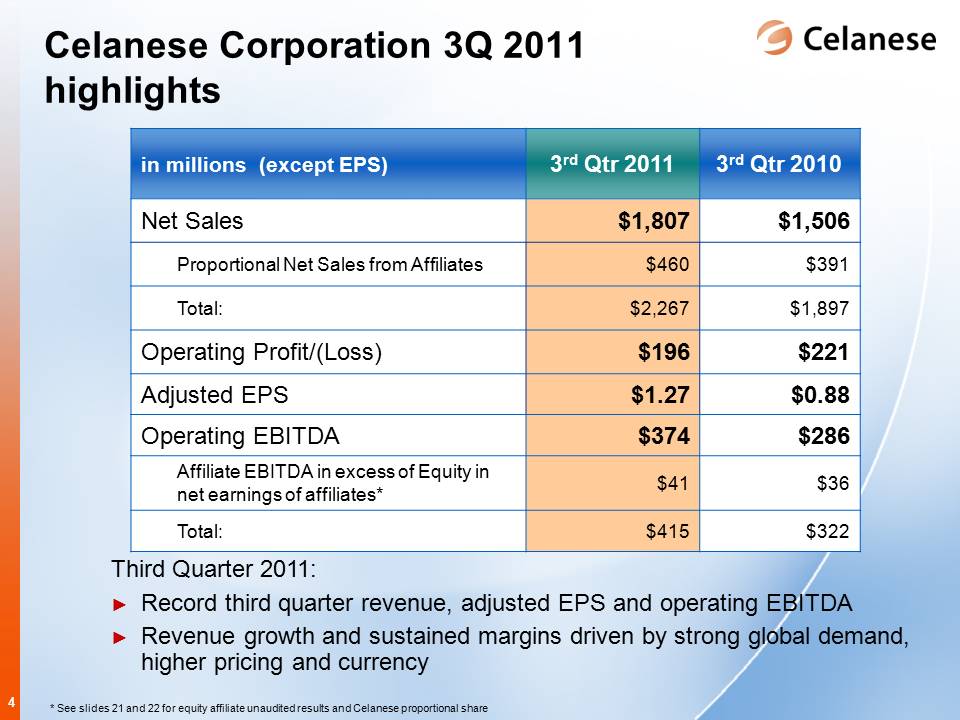
Celanese Corporation 3Q 2011 highlights
|
| | | | | | |
| in millions (except EPS) | 3rd Qtr 2011 | 3rd Qtr 2010 |
| Net Sales | $ | 1,807 |
| $ | 1,506 |
|
| Proportional Net Sales from Affiliates | $ | 460 |
| $ | 391 |
|
| Total: | $ | 2,267 |
| $ | 1,897 |
|
| Operating Profit/(Loss) | $ | 196 |
| $ | 221 |
|
| Adjusted EPS | $ | 1.27 |
| $ | 0.88 |
|
| Operating EBITDA | $ | 374 |
| $ | 286 |
|
| Affiliate EBITDA in excess of Equity in net earnings of affiliates* | $ | 41 |
| $ | 36 |
|
| Total: | $ | 415 |
| $ | 322 |
|
Third Quarter 2011:
Record third quarter revenue, adjusted EPS and operating EBITDA
Revenue growth and sustained margins driven by strong global demand, higher pricing and currency
*See slides 21 and 22 for equity affiliate unaudited results and Celanese proportional share
4
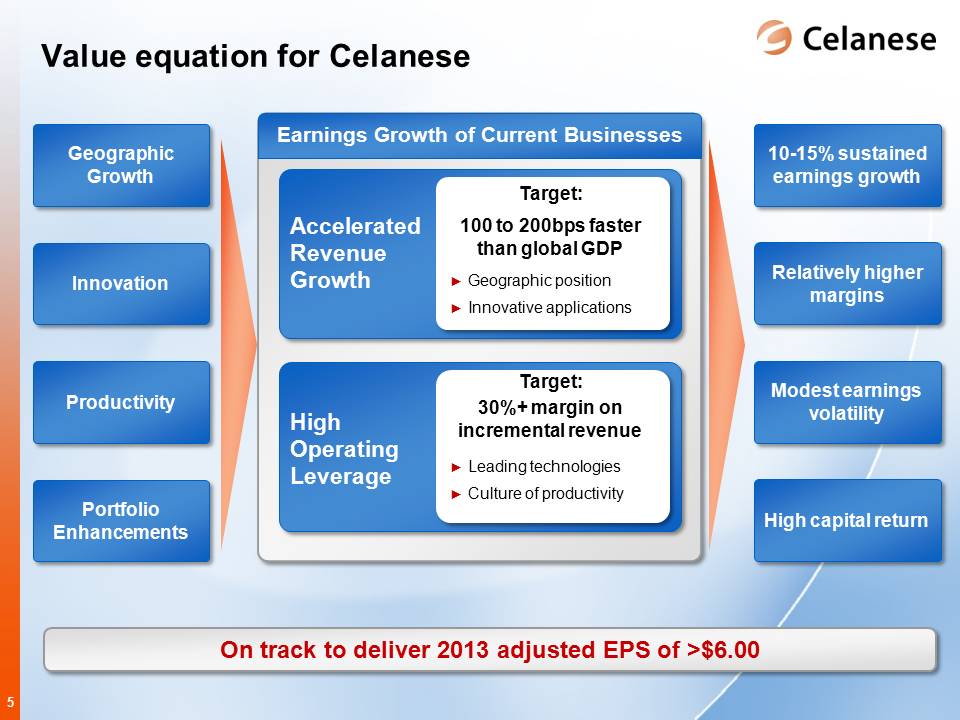
Value equation for Celanese
Geographic Growth 10-15% sustained earnings growth
Innovation Relatively higher margins
Productivity Modest earnings volatility
Portfolio Enhancements High capital return
Earnings Growth of Current Businesses
Accelerated Revenue Growth
Target: 100 to 200bps faster than global GDP
Geographic position
Innovative applications
High Operating Leverage
Target: 30% + margin on incremental revenue
Leading technologies
Culture of productivity
On track to deliver 2013 adjusted EPS of >$6.00
5
Steven Sterin
Senior Vice President and Chief Financial Officer
6
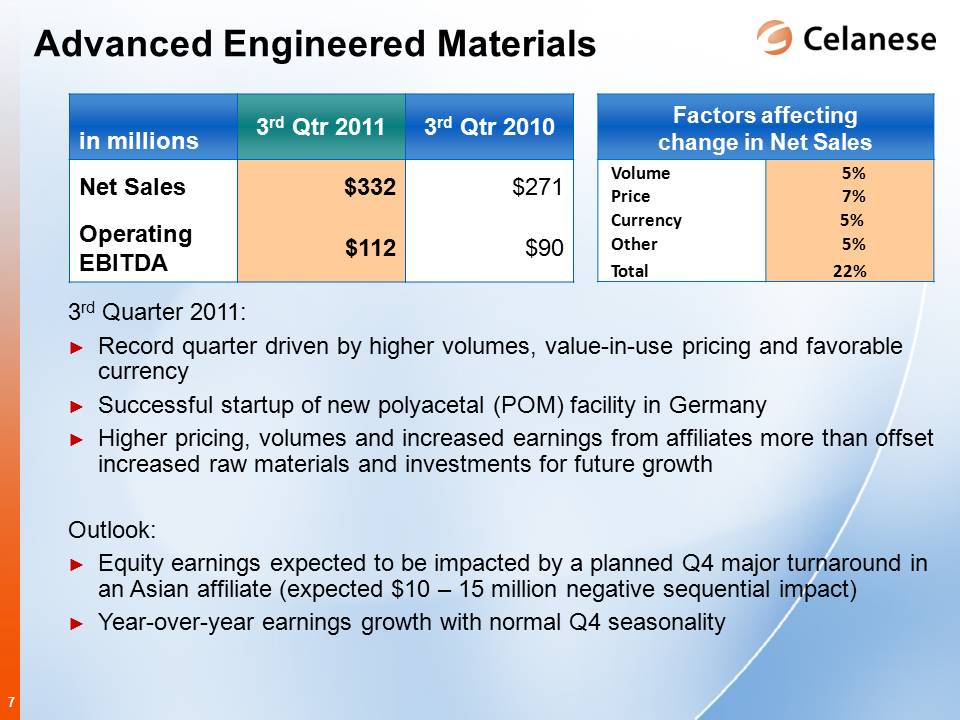
Advanced Engineered Materials
|
| | | | | | | | | |
| in millions | 3rd Qtr 2011 | 3rd Qtr 2010 | Factors affecting change in Net Sales |
| Net Sales | $ | 332 |
| $ | 271 |
| Volume | 5 | % |
| Operating EBITDA | $ | 112 |
| $ | 90 |
| Price | 7 | % |
| | | | Currency | 5 | % |
| | | | Other | 5 | % |
| | | | Total | 22 | % |
3rd Quarter 2011:
Record quarter driven by higher volumes, value-in-use pricing and favorable currency
Successful startup of new polyacetal (POM) facility in Germany
Higher pricing, volumes and increased earnings from affiliates more than offset increased raw materials and investments for future growth
Outlook:
Equity earnings expected to be impacted by a planned Q4 major turnaround in an Asian affiliate (expected $10 - 15 million negative sequential impact)
Year-over-year earnings growth with normal Q4 seasonality
7
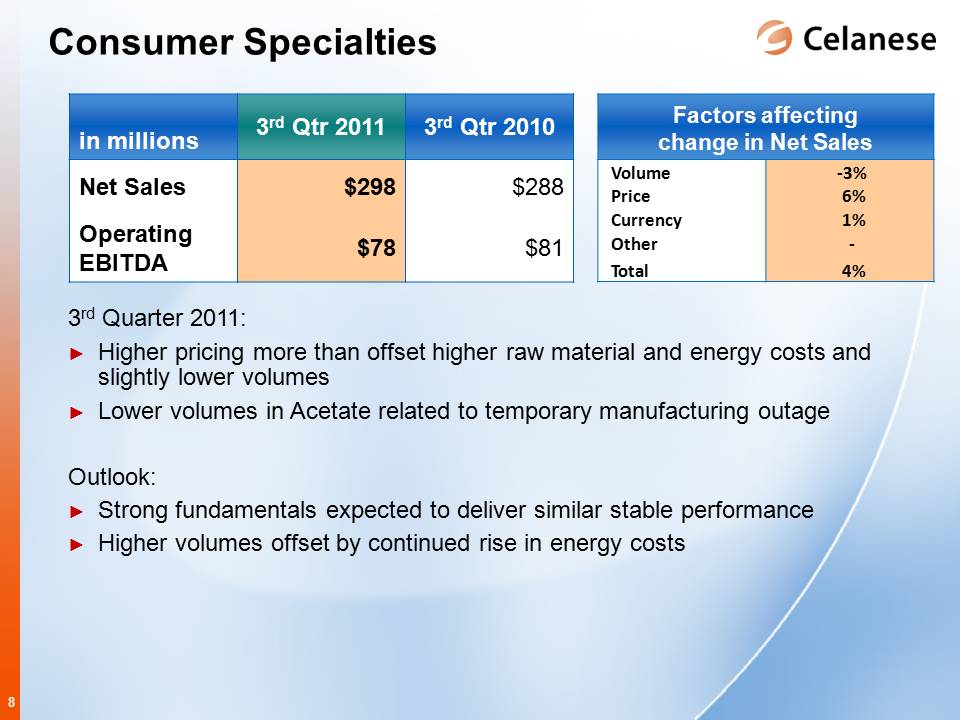
Consumer Specialties
|
| | | | | | | | | |
| in millions | 3rd Qtr 2011 | 3rd Qtr 2010 | Factors affecting change in Net Sales |
| Net Sales | $ | 298 |
| $ | 288 |
| Volume | (3 | )% |
| Operating EBITDA | $ | 78 |
| $ | 81 |
| Price | 6 | % |
| | | | Currency | 1 | % |
| | | | Other | — | % |
| | | | Total | 4 | % |
3rd Quarter 2011:
Higher pricing more than offset higher raw material and energy costs and slightly lower volumes
Lower volumes in Acetate related to temporary manufacturing outage
Outlook:
Strong fundamentals expected to deliver similar stable performance
Higher volumes offset by continued rise in energy costs
8
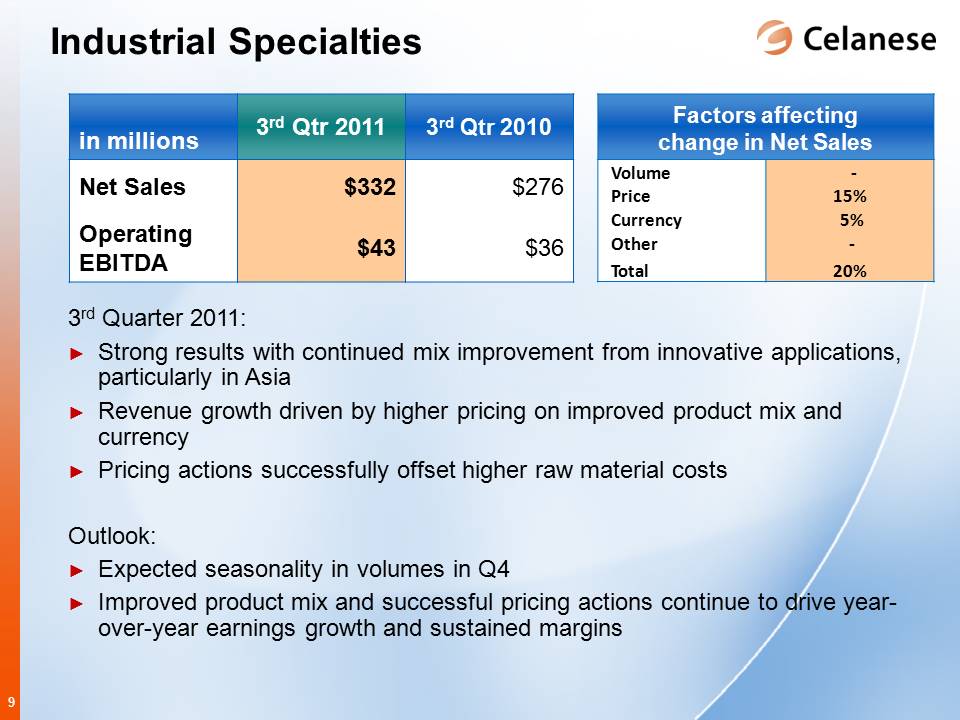
Industrial Specialties
|
| | | | | | | | | |
| in millions | 3rd Qtr 2011 | 3rd Qtr 2010 | Factors affecting change in Net Sales |
| Net Sales | $ | 332 |
| $ | 276 |
| Volume | — | % |
| Operating EBITDA | $ | 43 |
| $ | 36 |
| Price | 15 | % |
| | | | Currency | 5 | % |
| | | | Other | — | % |
| | | | Total | 20 | % |
3rd Quarter 2011:
Strong results with continued mix improvement from innovative applications, particularly in Asia
Revenue growth driven by higher pricing on improved product mix and currency
Pricing actions successfully offset higher raw material costs
Outlook:
Expected seasonality in volumes in Q4
Improved product mix and successful pricing actions continue to drive year-over-year earnings growth and sustained margins
9
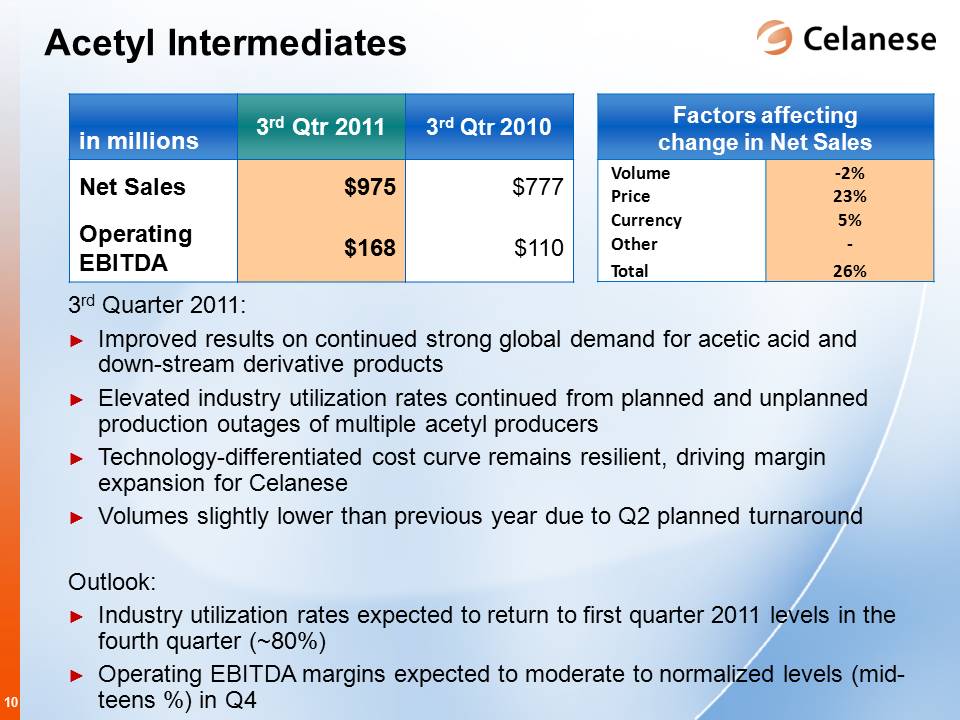
Acetyl Intermediates
|
| | | | | | | | | |
| in millions | 3rd Qtr 2011 | 3rd Qtr 2010 | Factors affecting change in Net Sales |
| Net Sales | $ | 975 |
| $ | 777 |
| Volume | (2 | )% |
| Operating EBITDA | $ | 168 |
| $ | 110 |
| Price | 23 | % |
| | | | Currency | 5 | % |
| | | | Other | — | % |
| | | | Total | 26 | % |
3rd Quarter 2011:
Improved results on continued strong global demand for acetic acid and
down-stream derivative products
Elevated industry utilization rates continued from planned and unplanned production outages of multiple acetyl producers
Technology-differentiated cost curve remains resilient, driving margin expansion for Celanese
Volumes slightly lower than previous year due to Q2 planned turnaround
Outlook:
Industry utilization rates expected to return to first quarter 2011 levels in the fourth quarter (~80%)
Operating EBITDA margins expected to moderate to normalized levels (mid-teens %) in Q4
10
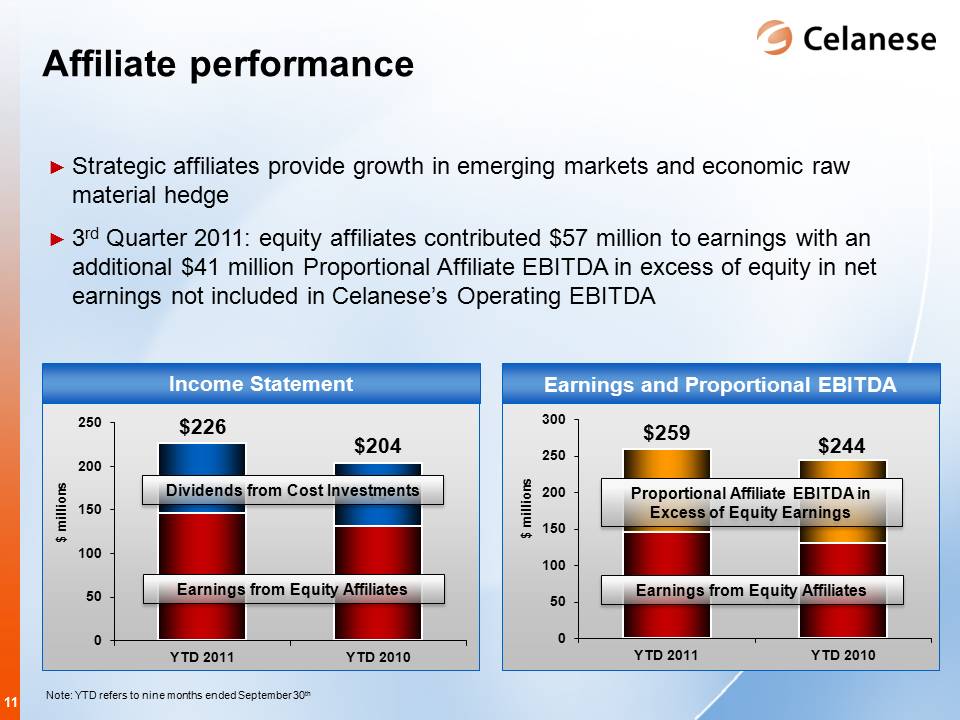
Affiliate performance
Strategic affiliates provide growth in emerging markets and economic raw material hedge
3rd Quarter 2011: equity affiliates contributed $57 million to earnings with an additional $41 million Proportional
Affiliate EBITDA in excess of equity in net earnings not included in Celanese’s Operating EBITDA
Income Statement
YTD 2011 $226
YTD 2010 $204
Dividends from Cost Investments
Earnings from Equity Affiliates
Earnings and Proportional EBITDA
Proportional Affiliate EBITDA in Excess of Equity Earnings
Earnings from Equity Affiliates
11
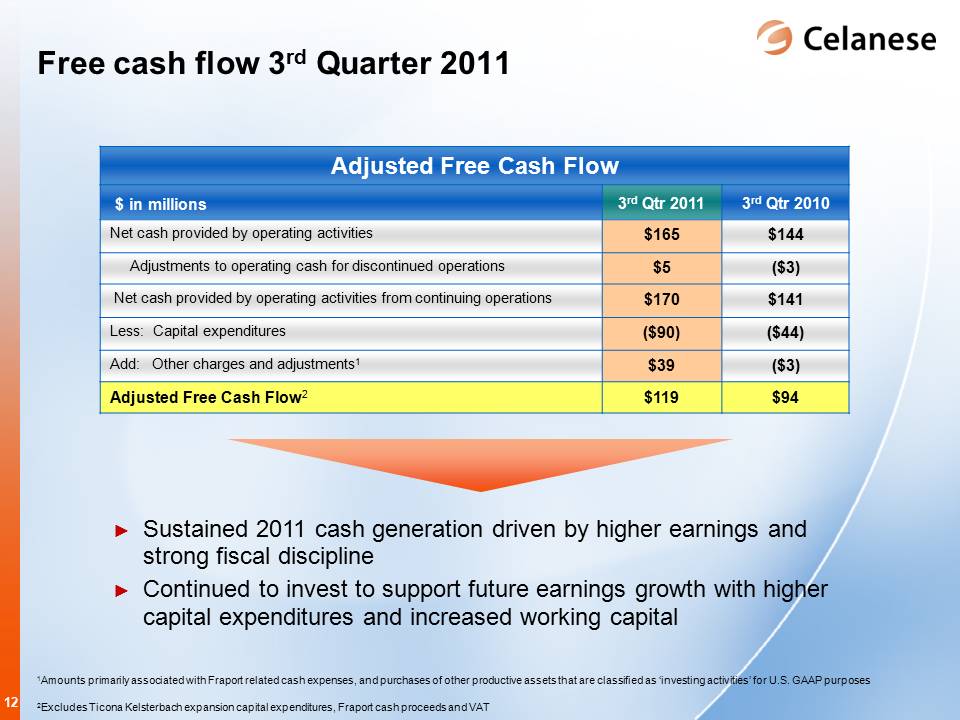
Free cash flow 3rd Quarter 2011 |
| | | | | | |
| Adjusted Free Cash Flow |
| $ in millions | 3rd Qtr 2011 | 3rd Qtr 2010 |
| Net cash provided by operating activities | $ | 165 |
| $ | 144 |
|
| Adjustments to operating cash for discontinued operations | $ | 5 |
| $ | (3 | ) |
| Net cash provided by operating activities from continuing operations | $ | 170 |
| $ | 141 |
|
| Less: Capital expenditures | $ | (90 | ) | $ | (44 | ) |
| Add: Other charges and adjustments | $ | 39 |
| $ | (3 | ) |
| Adjusted Free Cash Flow | $ | 119 |
| $ | 94 |
|
Sustained 2011 cash generation driven by higher earnings and strong fiscal discipline
Continued to invest to support future earnings growth with higher capital expenditures and increased working capital
1Amounts primarily associated with Fraport related cash expenses, and purchases of other productive assets that are classified as ‘investing activities’ for U.S. GAAP purposes
2Excludes Ticona Kelsterbach expansion capital expenditures, Fraport cash proceeds and VAT
12
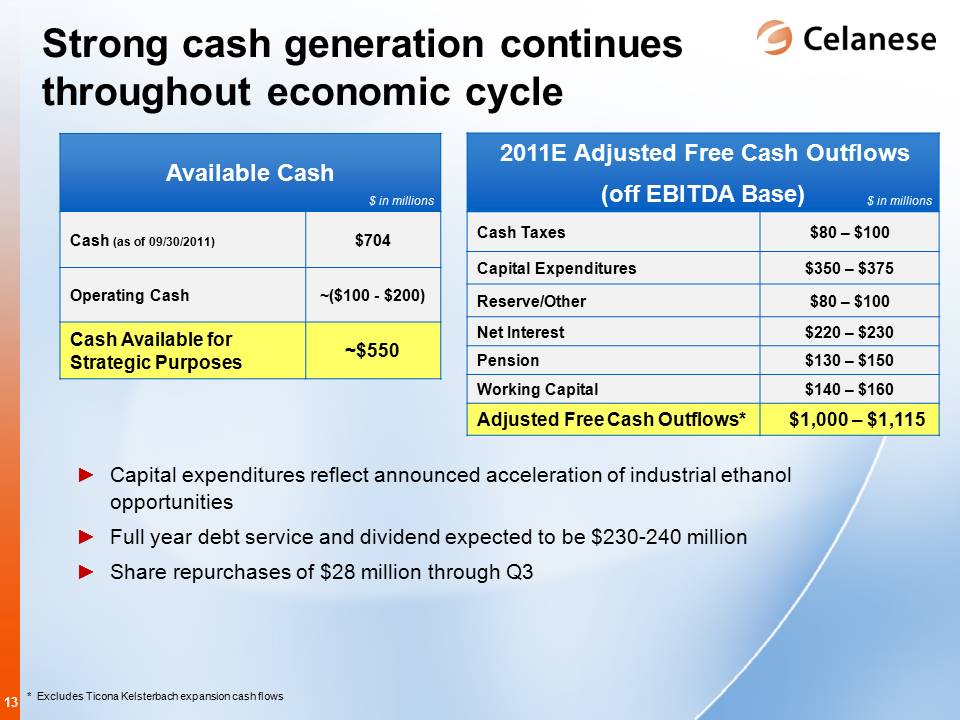
Strong cash generation continues throughout economic cycle
|
| | | |
| Available Cash | $ in millions | 2011E Adjusted Free Cash Outflows (off EBITDA Base) | $ in millions |
| Cash (as of 09/30/2011) | $704 | Cash Taxes | $80 - $100 |
| Operating Cash | ~($100 - $200) | Capital Expenditures | $350 - $375 |
| Cash Available for Strategic Purposes | ~$550 | Reserve/Other | $80 - $100 |
| | | Net Interest | $220 - $230 |
| | | Pension | $130 - $150 |
| | | Working Capital | $140 - $160 |
| | | Adjusted Free Cash Outflows* | $1,000 - $1,115 |
Capital expenditures reflect announced acceleration of industrial ethanol opportunities
Full year debt service and dividend expected to be $230-240 million
Share repurchases of $28 million through Q3
*Excludes Ticona Kelsterbach expansion cash flows
13
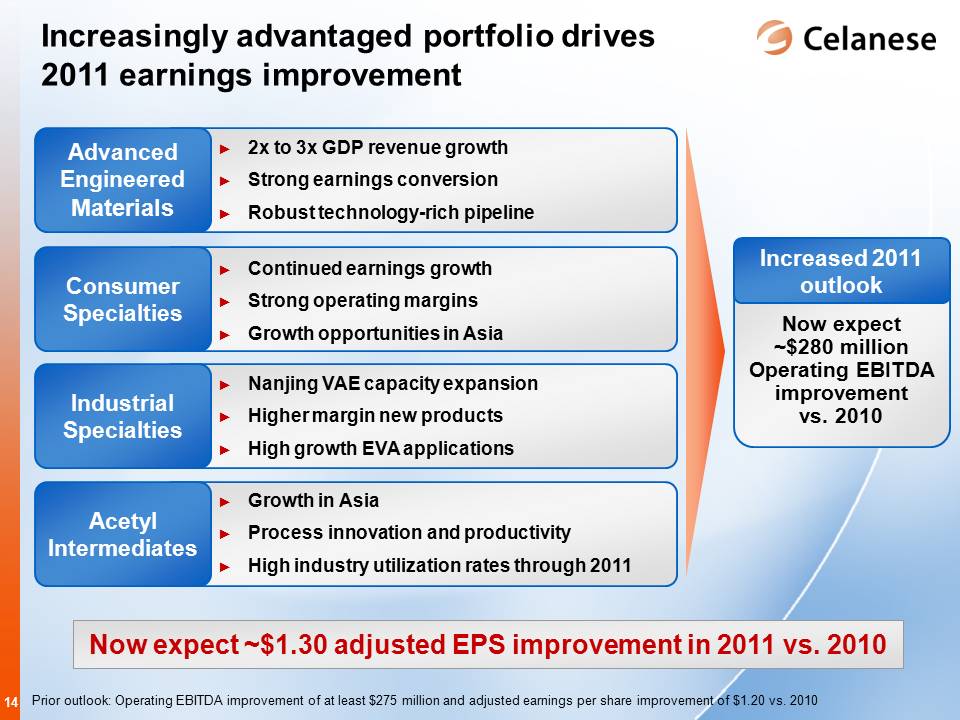
Increasingly advantaged portfolio drives 2011 earnings improvement
Advanced Engineered Materials
2x to 3x GDP revenue growth
Strong earnings conversion
Robust technology-rich pipeline
Consumer Specialties
Continued earnings growth
Strong operating margins
Growth opportunities in Asia
Industrial Specialties
Nanjing VAE capacity expansion
Higher margin new products
High growth EVA applications
Acetyl Intermediates
Growth in Asia
Process innovation and productivity
High industry utilization rates through 2011
Increased 2011 outlook
Now expected ~280 million Operating EBITDA improvement vs. 2010
Now expect ~$1.30 adjusted EPS improvement in 2011 vs. 2010
Prior outlook: Operating EBITDA improvement of at least $275 million and adjusted earnings per share improvement of $1.20 vs. 2010
14
Appendix
Notes:
References on the following slides to tables correspond to the tables included with Celanese press release dated October 25, 2011
15
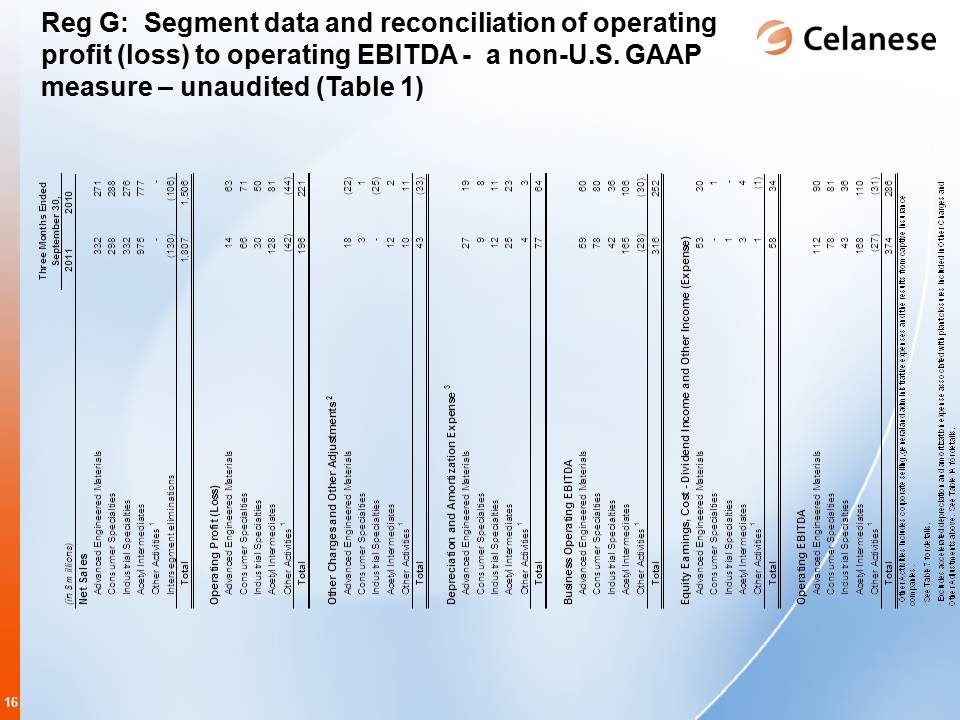
Reg G: Segment data and reconciliation of operating profit (loss) to operating EBITDA - a non-U.S. GAAP measure – unaudited (Table 1)
Three Months Ended
September 30,
(in $ millions) 2011 2010 2011 2010
Net Sales
Advanced Engineered Materials 332 271 Business Operating EBITDA
Consumer Specialties 298 288 Advanced Engineered Materials 59 60
Industrial Specialties 332 276 Consumer Specialties 78 80
Acetyl Intermediates 975 777 Industrial Specialties 42 36
Other Activities 1 - - Acetyl Intermediates 165 106
Intersegment eliminations (130) (106) Other Activities 1 (28) (30)
Total 1,807 1,506 Total 316 252
Operating Profit (Loss) Equity Earnings, Cost - Dividend Income and Other Income (Expense)
Advanced Engineered Materials 14 63 Advanced Engineered Materials 53 30
Consumer Specialties 66 71 Consumer Specialties - 1
Industrial Specialties 30 50 Industrial Specialties 1 -
Acetyl Intermediates 128 81 Acetyl Intermediates 3 4
Other Activities 1 (42) (44) Other Activities 1 1 (1)
Total 196 221 Total 58 34
Other Charges and Other Adjustments 2 Operating EBITDA
Advanced Engineered Materials 18 (22) Advanced Engineered Materials 112 90
Consumer Specialties 3 1 Consumer Specialties 78 81
Industrial Specialties - (25) Industrial Specialties 43 36
Acetyl Intermediates 12 2 Acetyl Intermediates 168 110
Other Activities 1 10 11 Other Activities 1 (27) (31)
Total 43 (33) Total 374 286
Depreciation and Amortization Expense 3
Advanced Engineered Materials 27 19
Consumer Specialties 9 8
Industrial Specialties 12 11
Acetyl Intermediates 25 23
Other Activities 1 4 3
Total 77 64
1 Other Activities includes corporate selling, general and administrative expenses and the results from captive insurance companies.
2 See Table 7 for details.
3 Excludes accelerated depreciation and amortization expense associated with plant closures included in Other Charges and Other Adjustments above. See Table 1A for details.
16
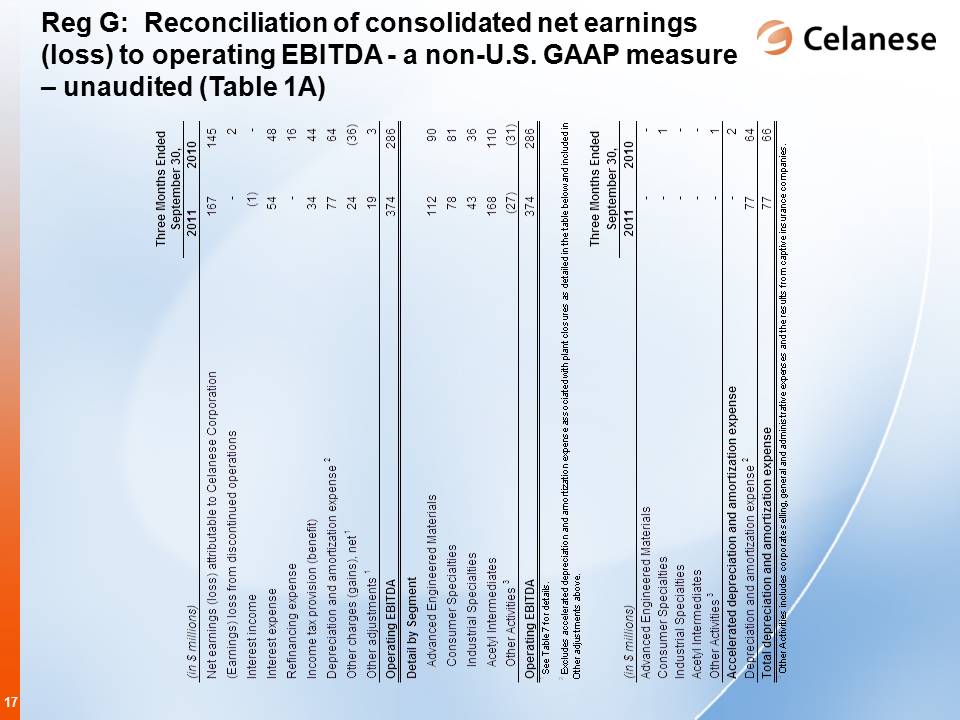
Reg G: Reconciliation of consolidated net earnings (loss) to operating EBITDA - a non-U.S. GAAP measure – unaudited (Table 1A)
Three Months Ended
September 30,
(in $ millions) 2011 2010
Net earnings (loss) attributable to Celanese Corporation 167 145
(Earnings) loss from discontinued operations - 2
Interest income (1) -
Interest expense 54 48
Refinancing expense - 16
Income tax provision (benefit) 34 44
Depreciation and amortization expense 2 77 64
Other charges (gains), net 1 24 (36)
Other adjustments 1 19 3
Operating EBITDA 374 286
Detail by Segment
Advanced Engineered Materials 112 90
Consumer Specialties 78 81
Industrial Specialties 43 36
Acetyl Intermediates 168 110
Other Activities 3 (27) (31)
Operating EBITDA 374 286
1 See Table 7 for details.
2 Excludes accelerated depreciation and amortization expense associated with plant closures as detailed in the table below and included in Other adjustments above.
Three Months Ended
September 30,
(in $ millions) 2011 2010
Advanced Engineered Materials - -
Consumer Specialties - 1
Industrial Specialties - -
Acetyl Intermediates - -
Other Activities 3 - 1
Accelerated depreciation and amortization expense - 2
Depreciation and amortization expense 2 77 64
Total depreciation and amortization expense 77 66
3 Other Activities includes corporate selling, general and administrative expenses and the results from captive insurance companies.
17
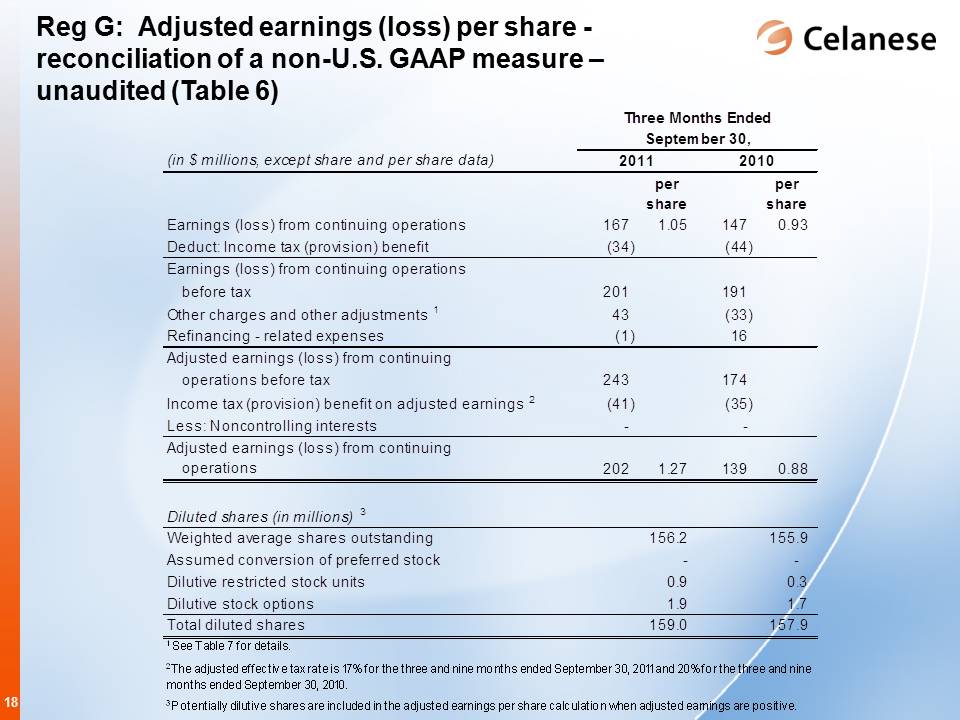
Reg G: Adjusted earnings (loss) per share - reconciliation of a non-U.S. GAAP measure – unaudited (Table 6)
Three Months Ended
September 30,
(in $ millions, except share and per share data) 2011 2010
"per
share" per share
Earnings (loss) from continuing operations 167 1.05 147 0.93
Deduct: Income tax (provision) benefit (34) (44)
Earnings (loss) from continuing operations
before tax 201 191
Other charges and other adjustments 1 43 (33)
Refinancing - related expenses (1) 16
Adjusted earnings (loss) from continuing
operations before tax 243 174
Income tax (provision) benefit on adjusted earnings 2 (41) (35)
Less: Noncontrolling interests - -
Adjusted earnings (loss) from continuing
operations 202 1.27 139 0.88
Diluted shares (in millions) 3
Weighted average shares outstanding 156.2 155.9
Assumed conversion of preferred stock - -
Dilutive restricted stock units 0.9 0.3
Dilutive stock options 1.9 1.7
Total diluted shares 159.0 157.9
1 See Table 7 for details.
2 The adjusted effective tax rate is 17% for the three and nine months ended September 30, 2011 and 20% for the three and nine months ended September 30, 2010.
3 Potentially dilutive shares are included in the adjusted earnings per share calculation when adjusted earnings are positive.
18
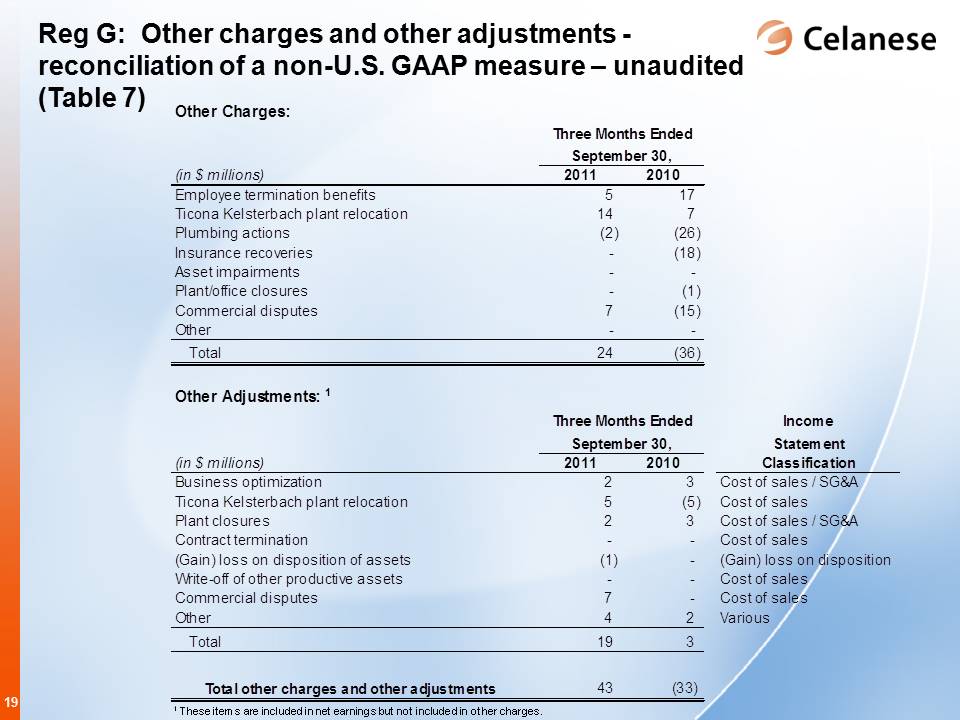
Reg G: Other charges and other adjustments - reconciliation of a non-U.S. GAAP measure – unaudited (Table 7)
Other Charges:
Three Months Ended
September 30,
(in $ millions) 2011 2010
Employee termination benefits 5 17
Ticona Kelsterbach plant relocation 14 7
Plumbing actions (2) (26)
Insurance recoveries - (18)
Asset impairments - -
Plant/office closures - (1)
Commercial disputes 7 (15)
Other - -
Total 24 (36)
Other Adjustments: 1
Three Months Ended Income
September 30, Statement
(in $ millions) 2011 2010 Classification
Business optimization 2 3 Cost of sales / SG&A
Ticona Kelsterbach plant relocation 5 (5) Cost of sales
Plant closures 2 3 Cost of sales / SG&A
Contract termination - - Cost of sales
(Gain) loss on disposition of assets (1) - (Gain) loss on disposition
Write-off of other productive assets - - Cost of sales
Commercial disputes 7 - Cost of sales
Other 4 2 Various
Total 19 3
Total other charges and other adjustments 43 (33)
1 These items are included in net earnings but not included in other charges.
19
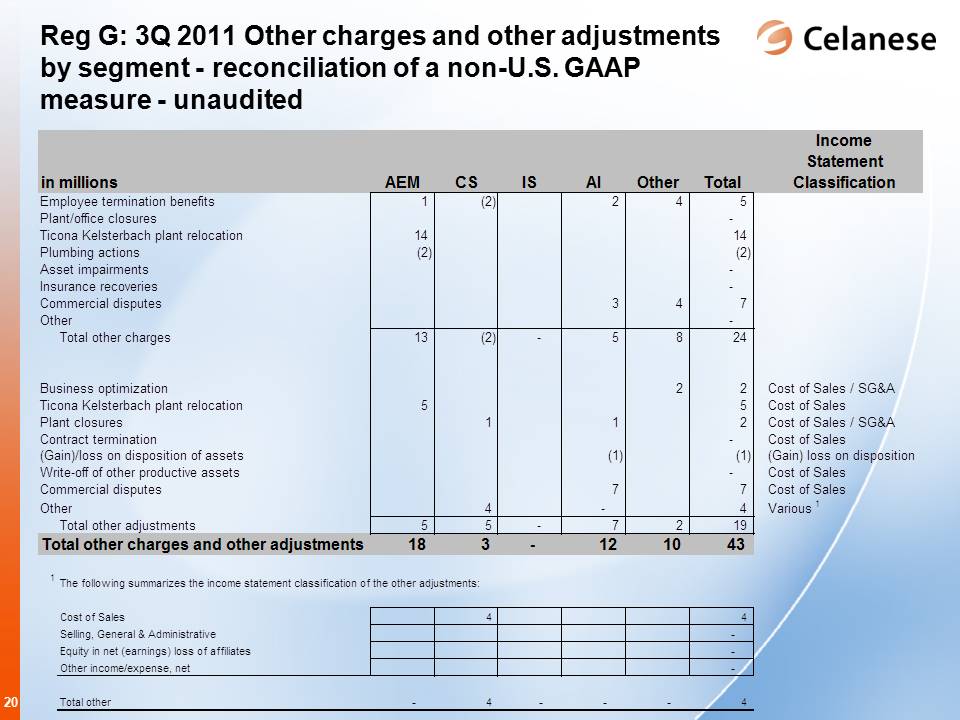
Reg G: 3Q 2011 Other charges and other adjustments by segment - reconciliation of a non-U.S. GAAP measure - unaudited
Income
Statement
AEM CS IS AI Other Total Classification
1 (2) 2 4 5
-
14 14
(2) (2)
-
-
3 4 7
-
Total other charges 13 (2) - 5 8 24
2 2 Cost of Sales / SG&A
5 5 Cost of Sales
1 1 2 Cost of Sales / SG&A
- Cost of Sales
(1) (1) (Gain) loss on disposition
- Cost of Sales
7 7 Cost of Sales
4 - 4 Various 1
Total other adjustments 5 5 - 7 2 19
18 3 - 12 10 43
The following summarizes the income statement classification of the other adjustments:
Cost of Sales 4 4
Selling, General & Administrative -
Equity in net (earnings) loss of affiliates -
Other income/expense, net -
Total other - 4 - - - 4
20
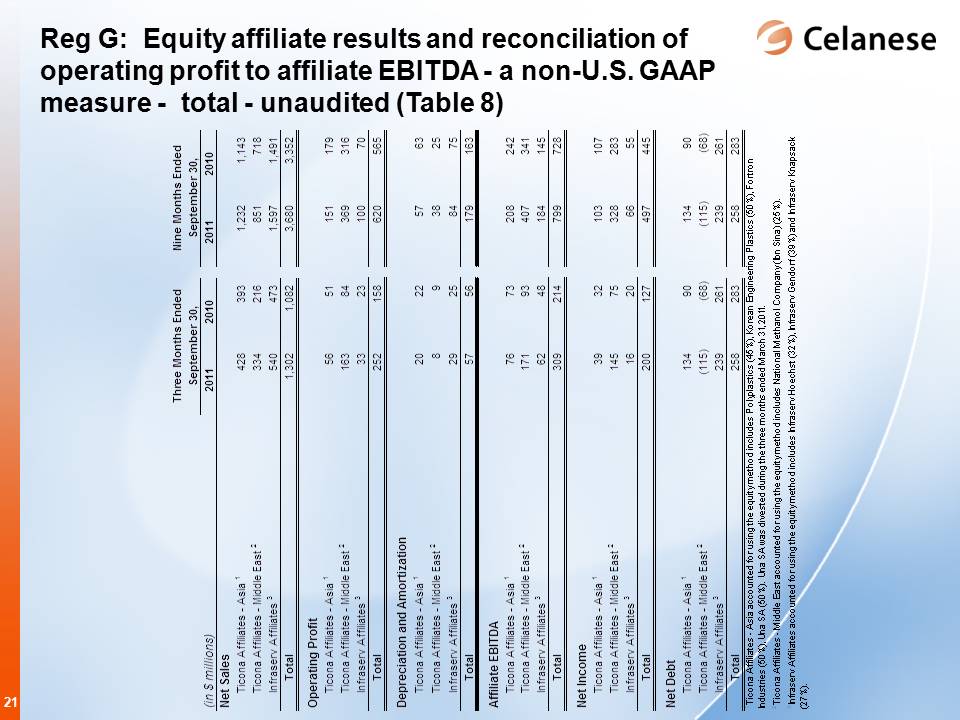
Reg G: Equity affiliate results and reconciliation of operating profit to affiliate EBITDA - a non-U.S. GAAP measure - total - unaudited (Table 8)
Three Months Ended Nine Months Ended
September 30, September 30,
(in $ millions) 2011 2010 2011 2010
Net Sales
Ticona Affiliates - Asia 1 428 393 1,232 1,143
Ticona Affiliates - Middle East 2 334 216 851 718
Infraserv Affiliates 3 540 473 1,597 1,491
Total 1,302 1,082 3,680 3,352
Operating Profit
Ticona Affiliates - Asia 1 56 51 151 179
Ticona Affiliates - Middle East 2 163 84 369 316
Infraserv Affiliates 3 33 23 100 70
Total 252 158 620 565
Depreciation and Amortization
Ticona Affiliates - Asia 1 20 22 57 63
Ticona Affiliates - Middle East 2 8 9 38 25
Infraserv Affiliates 3 29 25 84 75
Total 57 56 179 163
Affiliate EBITDA
Ticona Affiliates - Asia 1 76 73 208 242
Ticona Affiliates - Middle East 2 171 93 407 341
Infraserv Affiliates 3 62 48 184 145
Total 309 214 799 728
Net Income
Ticona Affiliates - Asia 1 39 32 103 107
Ticona Affiliates - Middle East 2 145 75 328 283
Infraserv Affiliates 3 16 20 66 55
Total 200 127 497 445
Net Debt
Ticona Affiliates - Asia 1 134 90 134 90
Ticona Affiliates - Middle East 2 (115) (68) (115) (68)
Infraserv Affiliates 3 239 261 239 261
Total 258 283 258 283
1 Ticona Affiliates - Asia accounted for using the equity method includes Polyplastics (45%), Korean Engineering Plastics (50%), Fortron Industries (50%), Una SA (50%). Una SA was divested during the three months ended March 31, 2011.
2 Ticona Affiliates - Middle East accounted for using the equity method includes National Methanol Company (Ibn Sina) (25%).
3 Infraserv Affiliates accounted for using the equity method includes Infraserv Hoechst (32%), Infraserv Gendorf (39%) and Infraserv Knapsack (27%).
21
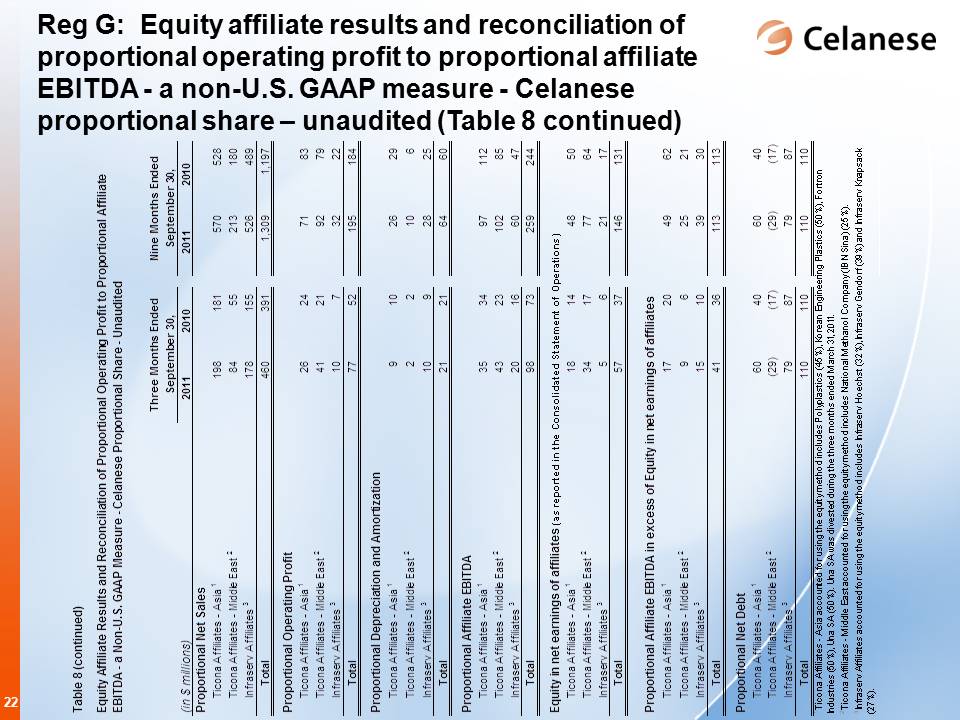
Reg G: Equity affiliate results and reconciliation of proportional operating profit to proportional affiliate EBITDA - a non-U.S. GAAP measure - Celanese proportional share – unaudited (Table 8 continued)
Three Months Ended Nine Months Ended
September 30, September 30,
(in $ millions) 2011 2010 2011 2010
Proportional Net Sales
Ticona Affiliates - Asia 1 198 181 570 528
Ticona Affiliates - Middle East 2 84 55 213 180
Infraserv Affiliates 3 178 155 526 489
Total 460 391 1,309 1,197
Proportional Operating Profit
Ticona Affiliates - Asia 1 26 24 71 83
Ticona Affiliates - Middle East 2 41 21 92 79
Infraserv Affiliates 3 10 7 32 22
Total 77 52 195 184
Proportional Depreciation and Amortization
Ticona Affiliates - Asia 1 9 10 26 29
Ticona Affiliates - Middle East 2 2 2 �� 10 6
Infraserv Affiliates 3 10 9 28 25
Total 21 21 64 60
Proportional Affiliate EBITDA
Ticona Affiliates - Asia 1 35 34 97 112
Ticona Affiliates - Middle East 2 43 23 102 85
Infraserv Affiliates 3 20 16 60 47
Total 98 73 259 244
Equity in net earnings of affiliates (as reported in the Consolidated Statement of Operations)
Ticona Affiliates - Asia 1 18 14 48 50
Ticona Affiliates - Middle East 2 34 17 77 64
Infraserv Affiliates 3 5 6 21 17
Total 57 37 146 131
Proportional Affiliate EBITDA in excess of Equity in net earnings of affiliates
Ticona Affiliates - Asia 1 17 20 49 62
Ticona Affiliates - Middle East 2 9 6 25 21
Infraserv Affiliates 3 15 10 39 30
Total 41 36 113 113
Proportional Net Debt
Ticona Affiliates - Asia 1 60 40 60 40
Ticona Affiliates - Middle East 2 (29) (17) (29) (17)
Infraserv Affiliates 3 79 87 79 87
Total 110 110 110 110
1 Ticona Affiliates - Asia accounted for using the equity method includes Polyplastics (45%), Korean Engineering Plastics (50%), Fortron Industries (50%), Una SA (50%). Una SA was divested during the three months ended March 31, 2011.
2 Ticona Affiliates - Middle East accounted for using the equity method includes National Methanol Company (IBN Sina) (25%).
3 Infraserv Affiliates accounted for using the equity method includes Infraserv Hoechst (32%), Infraserv Gendorf (39%) and Infraserv Knapsack (27%).
22