
1 Celanese Corporation 2012 Technology Day September 20, 2012

2 Agenda 8:00 am Welcome & Agenda Jon Puckett, Vice President, Investor Relations 8:05 am Transformation Through Technology Mark Rohr, Chairman & Chief Executive Officer 8:20 am Acetyl Chain Chemistry Scott Richardson, Vice President & General Manager, Acetyl Intermediates 8:40 am Advanced Fuel Technologies Steven Sterin, Senior Vice President & Chief Financial Officer and President, Advanced Fuel Technologies John Fotheringham, Vice President and General Manager, Advanced Fuel Technologies 9:00 am Specialty Engineering Polymers Phil McDivitt, Vice President & General Manager, Advanced Engineered Materials 9:20 am Cellulosic Technologies Todd Elliott, Vice President and General Manager, Celanese Acetate 9:35 am Sweetener Solutions Diana Peninger, Vice President and General Manager, EVA Performance Polymers 9:50 am Technology Showcase 11:20 am Balancing Growth and Shareholder Returns Steven Sterin 11:35 am Q&A
1 Forward-Looking Statements Use and Reconciliation of Non-U.S. GAAP Measures to U.S. GAAP Measures

2 Forward-Looking Statements This presentation and remarks made as part of this presentation contain “forward-looking statements,” which include information concerning the company’s plans, objectives, goals, strategies, future revenues or performance, capital expenditures, financing needs and other information that is not historical information. When used in this presentation and related remarks, the words “outlook,” “forecast,” “estimates,” “expects,” “anticipates,” “projects,” “plans,” “intends,” “believes,” “may,” “can,” “could,” “might,” “will” and variations of such words or similar expressions are intended to identify forward-looking statements. All forward-looking statements are based upon current expectations and beliefs and various assumptions. There can be no assurance that the company will realize these expectations or that these beliefs will prove correct. There are a number of risks and uncertainties that could cause actual results to differ materially from the results expressed or implied in the forward-looking statements contained in this presentation and related remarks. These risks and uncertainties include, among other things: changes in general economic, business, political and regulatory conditions in the countries or regions in which we operate; the length and depth of product and industry business cycles, particularly in the automotive, electrical, textiles, electronics and construction industries; changes in the price and availability of raw materials, particularly changes in the demand for, supply of, and market prices of ethylene, methanol, natural gas, wood pulp and fuel oil and the prices for electricity and other energy sources; the ability to pass increases in raw material prices on to customers or otherwise improve margins through price increases; the ability to maintain plant utilization rates and to implement planned capacity additions and expansions; the ability to improve productivity by implementing technological improvements to existing plants; increased price competition and the introduction of competing products by other companies; market acceptance of our technology; the ability to obtain governmental approvals and to construct facilities on terms and schedules acceptable to the company; changes in the degree of intellectual property and other legal protection afforded to our products or technology, or the theft of such intellectual property; compliance and other costs and potential disruption or interruption of production or operations due to accidents, cyber security incidents, terrorism or political unrest or other unforeseen events or delays in construction or operation of facilities, including as a result of geopolitical conditions, including the occurrence of acts of war or terrorist incidents, or as a result of weather or natural disasters; potential liability for remedial actions and increased costs under existing or future environmental regulations, including those relating to climate change; potential liability resulting from pending or future litigation, or from changes in the laws, regulations or policies of governments or other governmental activities in the countries in which we operate; changes in currency exchange rates and interest rates; our level of indebtedness, which could diminish our ability to raise additional capital to fund operations or limit our ability to react to changes in the economy or the chemicals industry; and various other factors discussed from time to time in the company’s filings with the Securities and Exchange Commission. In addition to the risks and uncertainties identified above, the following risks and uncertainties, among others, could cause the company’s actual results regarding its initiatives involving the use of advanced technology for the production of ethanol for chemical applications and other uses to differ materially from the results expressed or implied in these materials: the impact of technological developments and competition; our ability to obtain licenses of, or other access to, alternative ethanol production processes on attractive terms; unanticipated operational or commercialization difficulties, including failure of facilities or processes to operate in accordance with specifications or expectations; the cost and availability of capital necessary to fund plant construction and expansion; the unavailability of required materials and equipment; changes in the price and availability of commodities and supplies; the ability to achieve the anticipated cost structure; the growth in demand for products produced from our technology in certain industries or geographic regions; the adoption of new or different industry or regulatory standards; and the ability of third parties, including our commercial partners or suppliers, to comply with their commitments to us. Forward-looking statements speak only as of the date on which they are made, and the company undertakes no obligation to update any forward-looking statement to reflect events or circumstances after the date on which it is made or to reflect the occurrence of anticipated or unanticipated events or circumstances. Results Unaudited The results in this presentation, together with the adjustments made to present the results on a comparable basis, have not been audited and are based on internal financial data furnished to management. Quarterly and full fiscal year results should not be taken as an indication of the results of operations to be reported for any subsequent period or for the full fiscal year.

3 Non-U.S. GAAP Financial Measures Non-U.S. GAAP Financial Measures This presentation reflects the following performance measures: operating EBITDA, operating EBIT, return on Invested capital (ROIC),net debt and adjusted free cash flow as non-U.S. GAAP measures. These measurements are not recognized in accordance with U.S. GAAP and should not be viewed as an alternative to U.S. GAAP measures of performance. The most directly comparable financial measure presented in accordance with U.S. GAAP in our consolidated financial statements for operating EBITDA and business operating EBITDA is net income; for proportional affiliate EBITDA is equity in net earnings of affiliates; for affiliate EBITDA is operating profit; for adjusted earnings per share is earnings per common share- diluted; for net debt is total debt; and for adjusted free cash flow is cash flow from operations. Reconciliations of the non-U.S. GAAP financial measures to the most directly comparable U.S. GAAP financial measure are included in the Appendix. Non-U.S. GAAP Definitions Operating EBITDA, a measure used by management to measure performance, is defined by the company as net earnings minus interest income plus loss (earnings) from discontinued operations, interest expense, income taxes and depreciation and amortization, and further adjusted for Other Charges and Other Adjustments as described in the Appendix. We may provide guidance on operating EBITDA and are unable to reconcile forecasted operating EBITDA to a U.S. GAAP financial measure because a forecast of Other Charges and Other Adjustments is not practical. Operating EBIT, a measure used by management to measure performance, is defined by the company as net earnings minus interest income plus loss (earnings) from discontinued operations, interest expense and income taxes, and further adjusted for Other Charges and Other Adjustments as described in the Appendix. We may provide guidance on operating EBIT and are unable to reconcile forecasted operating EBIT to a U.S. GAAP financial measure because a forecast of Other Charges and Other Adjustments is not practical. Net debt is defined by the company as total debt less cash and cash equivalents. We believe that the presentation of this non-U.S. GAAP measure provides useful information to management and investors regarding changes to the company's capital structure. Our management and credit analysts use net debt to evaluate the company's capital structure and assess credit quality. Proportional net debt is defined as our proportionate share of our affiliates' net debt. Adjusted free cash flow is defined by the company as cash flow from operations less other productive asset purchases, operating cash from discontinued operations and certain other charges and adjustments. We believe that the presentation of this non-U.S. GAAP measure provides useful information to management and investors regarding changes to the company’s cash flow. Our management and credit analysts use adjusted free cash flow to evaluate the company’s liquidity and assess credit quality. Although we use adjusted free cash flow as a financial measure to assess the performance of our business, the use of adjusted free cash flow has important limitations, including that the adjusted free cash flow does not reflect the cash requirements necessary to service our indebtedness, lease obligations, unconditional purchase obligations or pension and postretirement funding obligations. In addition, with respect to peer company data included in the Balancing Growth and Shareholder Returns presentation, the following non-U.S. GAAP definitions are used (as defined by FactSet Research Systems Inc. (FactSet)). Reconciliations of these non-U.S. GAAP financial measures to the most directly comparable U.S. GAAP financial measure are included in the Appendix. EBITDA is defined as gross profit less selling, general and administrative expenses, amortization of intangibles and research and development expenses, and adding back depreciation, amortization and accretion (as disclosed in the Company’s consolidated statement of cash flows). Gross debt is defined as total debt plus the Company’s unfunded pension status (excluding assets held in non-qualified pension trusts). Free cash flow is defined as cash flow from operations less capital expenditures on property, plant and equipment as per the Company’s consolidated statement of cash flows (excluding capital expenditures relating to the Ticona Kelsterbach plant relocation). Return on Invested capital (ROIC) is defined as earnings (loss) from continuing operations divided by the average invested capital over the past two fiscal years. Invested capital is defined as long term debt plus total equity.

1 © Copyright Celanese 2012 Transformation Through Technology Mark Rohr Chairman & Chief Executive Officer
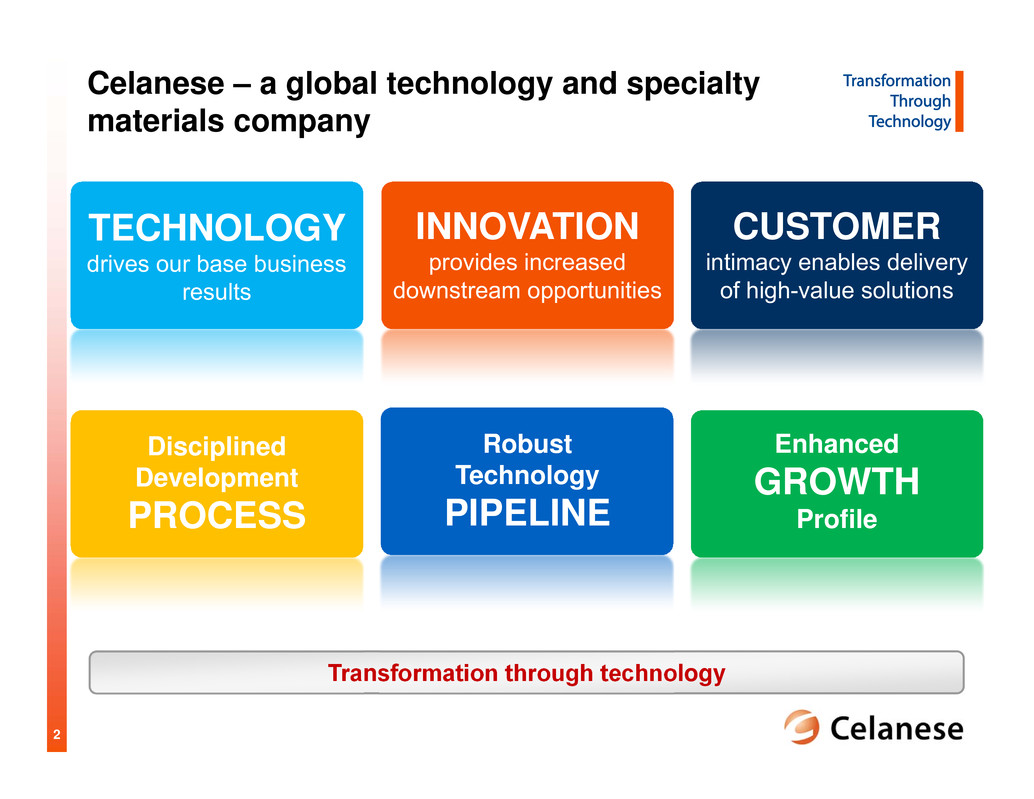
2 Celanese – a global technology and specialty materials company INNOVATION provides increased downstream opportunities TECHNOLOGY drives our base business results Transformation through technology CUSTOMER intimacy enables delivery of high-value solutions Disciplined Development PROCESS Robust Technology PIPELINE Enhanced GROWTH Profile
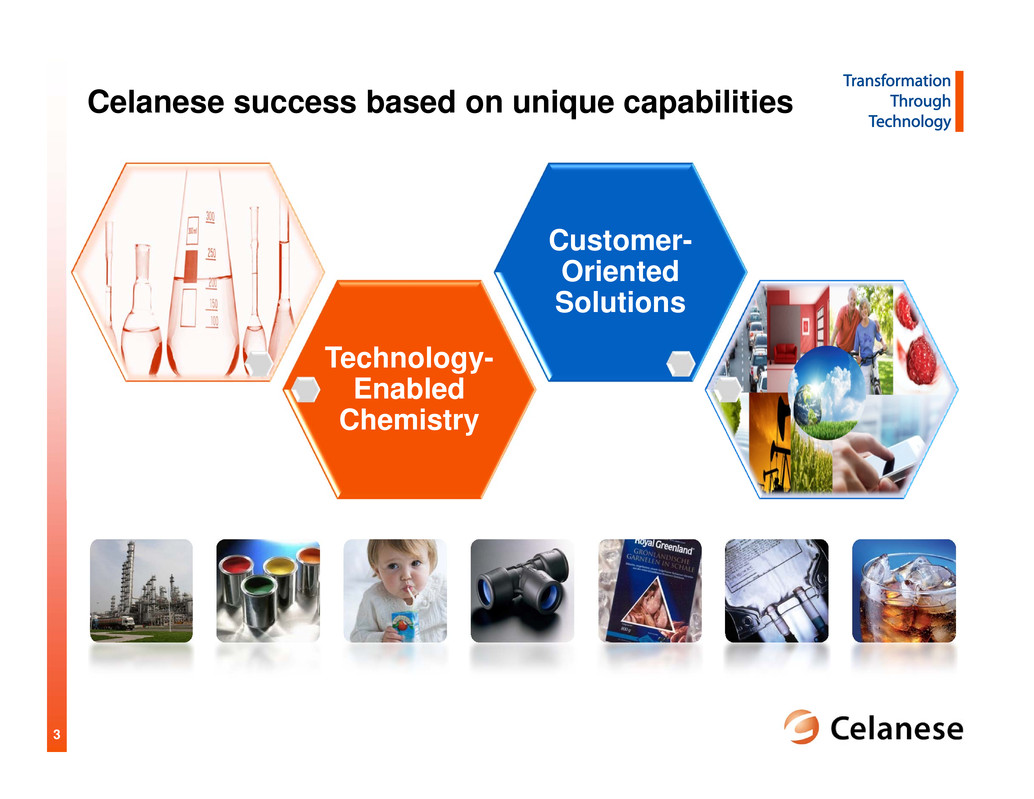
3 Technology- Enabled Chemistry Customer- Oriented Solutions Celanese success based on unique capabilities

4 ► Leading positions building on product and application expertise ► Technology focused on solutions for existing and future customer needs ► Customer intimacy ► Growth driven by differentiation ► Industry leading cost positions based on advantaged process technology ► Technology focused on enhancing cost advantage ► Global, integrated production footprint ► Growth tied to GDP Technology- Enabled Chemistry Customer- Oriented Solutions Leading positions based on technology and customer-focused solutions Our unique capabilities enable our industry leadership and value creation
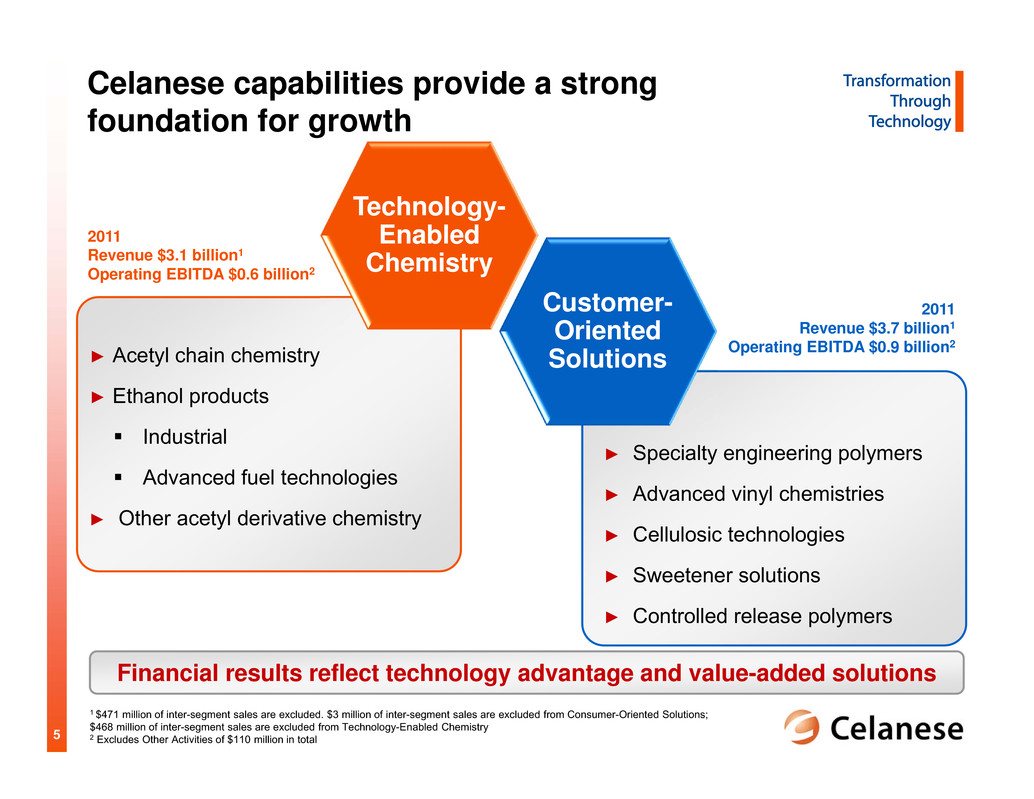
5 ► Specialty engineering polymers ► Advanced vinyl chemistries ► Cellulosic technologies ► Sweetener solutions ► Controlled release polymers ► Acetyl chain chemistry ► Ethanol products Industrial Advanced fuel technologies ► Other acetyl derivative chemistry Technology- Enabled Chemistry Customer- Oriented Solutions Financial results reflect technology advantage and value-added solutions 2011 Revenue $3.7 billion1 Operating EBITDA $0.9 billion2 2011 Revenue $3.1 billion1 Operating EBITDA $0.6 billion2 1 $471 million of inter-segment sales are excluded. $3 million of inter-segment sales are excluded from Consumer-Oriented Solutions; $468 million of inter-segment sales are excluded from Technology-Enabled Chemistry 2 Excludes Other Activities of $110 million in total Celanese capabilities provide a strong foundation for growth
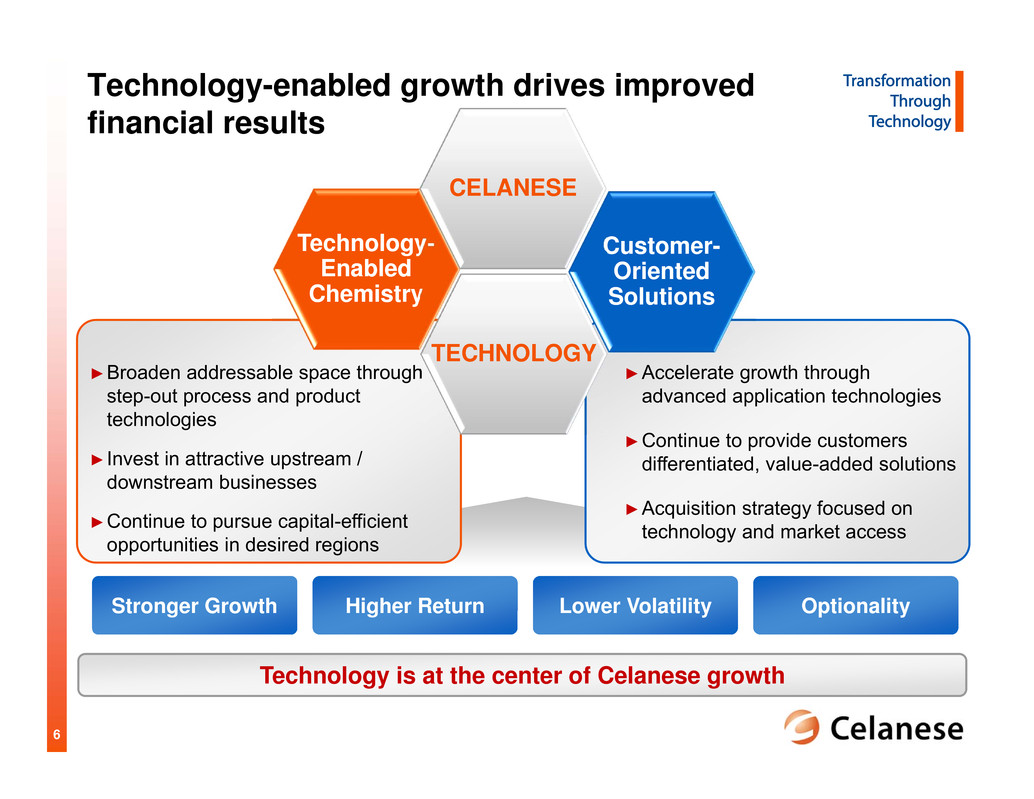
6 ►Accelerate growth through advanced application technologies ►Continue to provide customers differentiated, value-added solutions ►Acquisition strategy focused on technology and market access ►Broaden addressable space through step-out process and product technologies ► Invest in attractive upstream / downstream businesses ►Continue to pursue capital-efficient opportunities in desired regions Technology-enabled growth drives improved financial results Technology is at the center of Celanese growth Lower VolatilityStronger Growth Higher Return Optionality Technology- Enabled Chemistry Customer- Oriented Solutions TECHNOLOGY CELANESE

7 Celanese technology is addressing global macro trends Representative CE Solutions ► AOPlus® Technology ► Hostaform® POM ► TCX® Technology ► Thermoplastic composites Resource Scarcity Resource Scarcity Rising disposable income Demand for higher quality goods Increasing mobility Growing Middle Class Air quality Sustainability Biodegradable Increasing regulations ► Specialty engineering polymers ► TCX® Technology ► Cellulosic technologies Environment Aging population Obesity Diabetes ► GUR® UHMW-PE ► Hostaform® POM ► High intensity sweeteners ► Controlled release EVA Resource ScarcitySafety, Health & Wellness Energy Food Water ► AOPlus® Technology ► Low odor paints (EcoVAE®) ► Specialty engineering polymers ► TCX® Technology Global connectivity Mobile communication Miniaturization ► Fortron® PPS ► Vectra® LCP/ Zenite® LCP ► Thermx® PCT Technology

8 Technology- Enabled Chemistry Customer- Oriented Solutions

9 Source: Celanese internal management data and estimates Technology improvements provide a competitive advantage Celanese’s acetic acid technology provides competitive advantage AOPlus® Technology AOPlus®2 Technology AO® Technology

10 R&D Investments in Technology-Enabled Chemistry Technology provides new demand for acetic acid 0 20 40 2009 2011 Process Technology New Technology ►Sustained and strengthening R&D investment through trough periods and economic recovery ►Strategic R&D focus on exploring downstream derivatives (e.g. ethanol and other acetyl derivatives) Ethanol Demand by 2016/2020 ►Diversified value-added end uses with broad applications ►China’s industrial ethanol demand expected to grow at 8-10% through 2016 ►Global fuel ethanol demand expected to double over the next 10 years Industrial Ethanol ($ in billion) Fuel Ethanol ($ in billion) Source: Celanese internal management estimates, SRI Consulting, GAIN report, Hart Energy 2010 ~$4.5 Growth thru 2016 ~$3.0 2010 ~$50 Growth thru 2020 ~$50 $ i n m i l l i o n
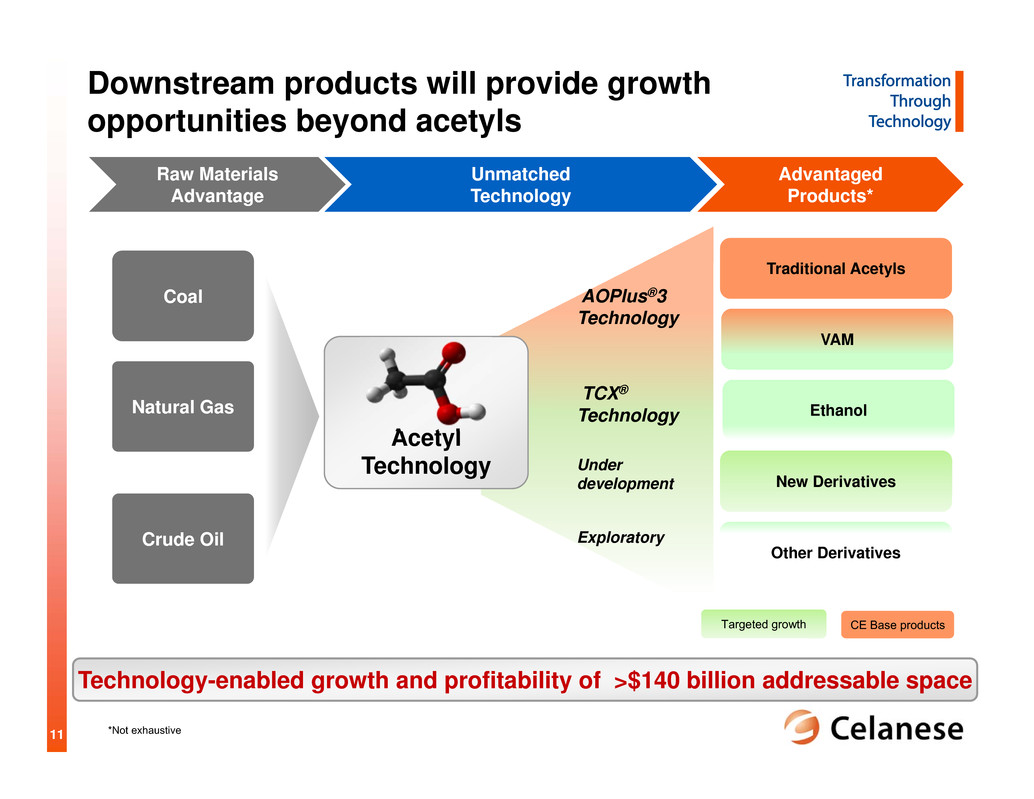
11 Downstream products will provide growth opportunities beyond acetyls Acetyl Technology AOPlus®3 Technology Traditional Acetyls New Derivatives TCX® Technology Under development ExploratoryCrude Oil Natural Gas Coal CE Base productsTargeted growth *Not exhaustive Technology-enabled growth and profitability of >$140 billion addressable space Raw Materials Advantage Unmatched Technology Advantaged Products* VAM Ethanol Other Derivatives
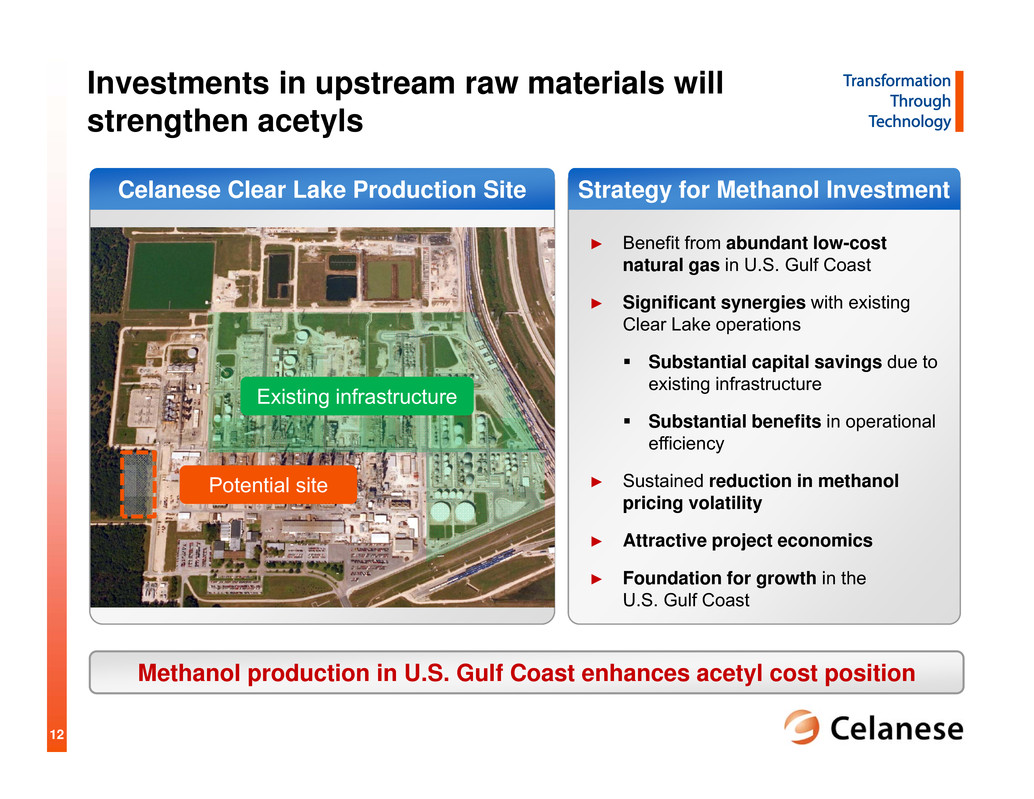
12 Investments in upstream raw materials will strengthen acetyls Methanol production in U.S. Gulf Coast enhances acetyl cost position Strategy for Methanol Investment ► Benefit from abundant low-cost natural gas in U.S. Gulf Coast ► Significant synergies with existing Clear Lake operations Substantial capital savings due to existing infrastructure Substantial benefits in operational efficiency ► Sustained reduction in methanol pricing volatility ► Attractive project economics ► Foundation for growth in the U.S. Gulf Coast Celanese Clear Lake Production Site Potential site Existing infrastructure

13 Technology- Enabled Chemistry Customer- Oriented Solutions
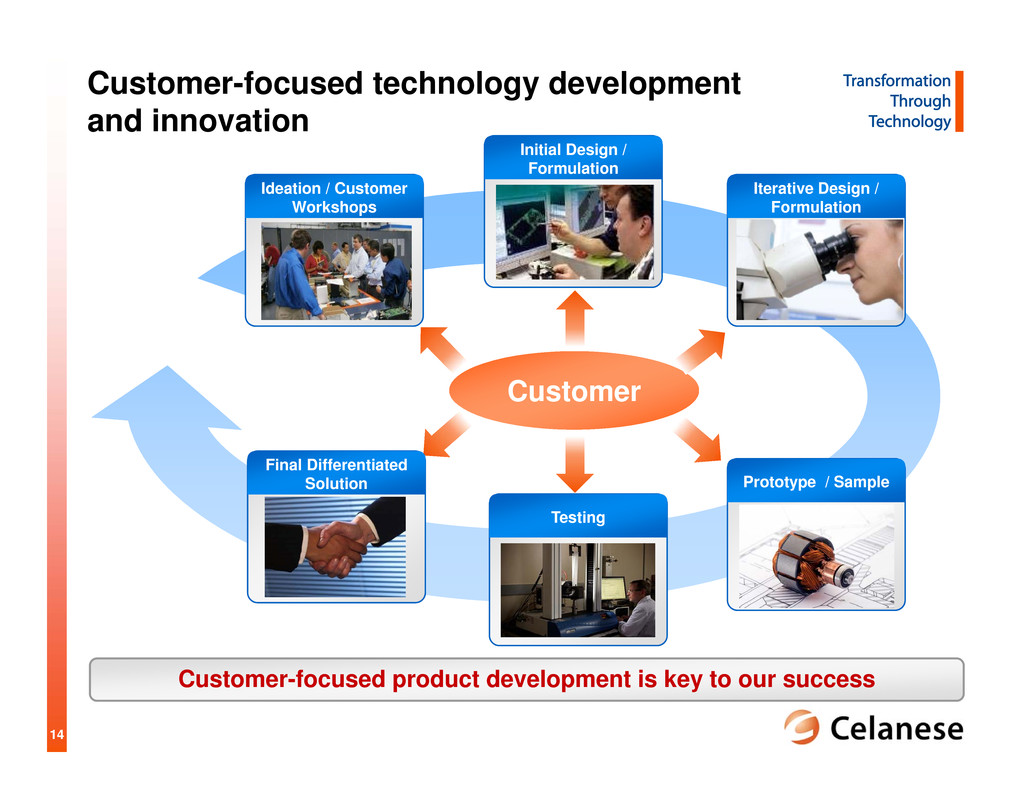
14 Customer-focused technology development and innovation Customer Customer-focused product development is key to our success Initial Design / Formulation Ideation / Customer Workshops Iterative Design / Formulation Prototype / Sample Testing Final Differentiated Solution

15 Capturing Macro Trends to Meet Customer Needs Technology investments are focused on opportunities adjacent to existing businesses 0 30 60 90 2009 2011 Process Technology New Application & Product R&D Investment in Customer-Oriented Solutions ►Sustained and strengthening R&D investment through trough periods and economic recovery ►R&D spending in Customer-Oriented Solutions increased at CAGR >15% between 2009-2011 Environmental Growing Middle Class Safety, Health & Wellness Resource Scarcity Technology $ i n m i l l i o n Source: Celanese internal management estimates

16 Trial Product Development Our application technology development process provides a rich and broad opportunity pipeline C u s t o m e r f o c u s e d C u s t o m e r f o c u s e d Innovation Process Translational and Transformational Impact Launch Ideation Discovery & Scope Business Case

17 Innovation expands addressable space to ~$200 billion Our technology platforms provide access to adjacent addressable space Fine fragrances Insect repellents Veterinary Key Existing Applications* Future New Applications* Beverages Dairy Oral care IVR Drug Delivery Systems Crop protection Automotive Fuel Systems Electronic Connectors Drug Delivery Systems Precision Gears Composites in Oil & Gas Small Engine Fuel Tanks & Lines Compact Camera Modules Portable Electronic Device Covers Paints and coating Adhesives Paper Carpet Textiles Chewing gum Baked goods Dressings & sauces Encapsulation Specialty fibers Film Adhesives & coating Tobacco Filter media Luxury packaging *Not exhaustive
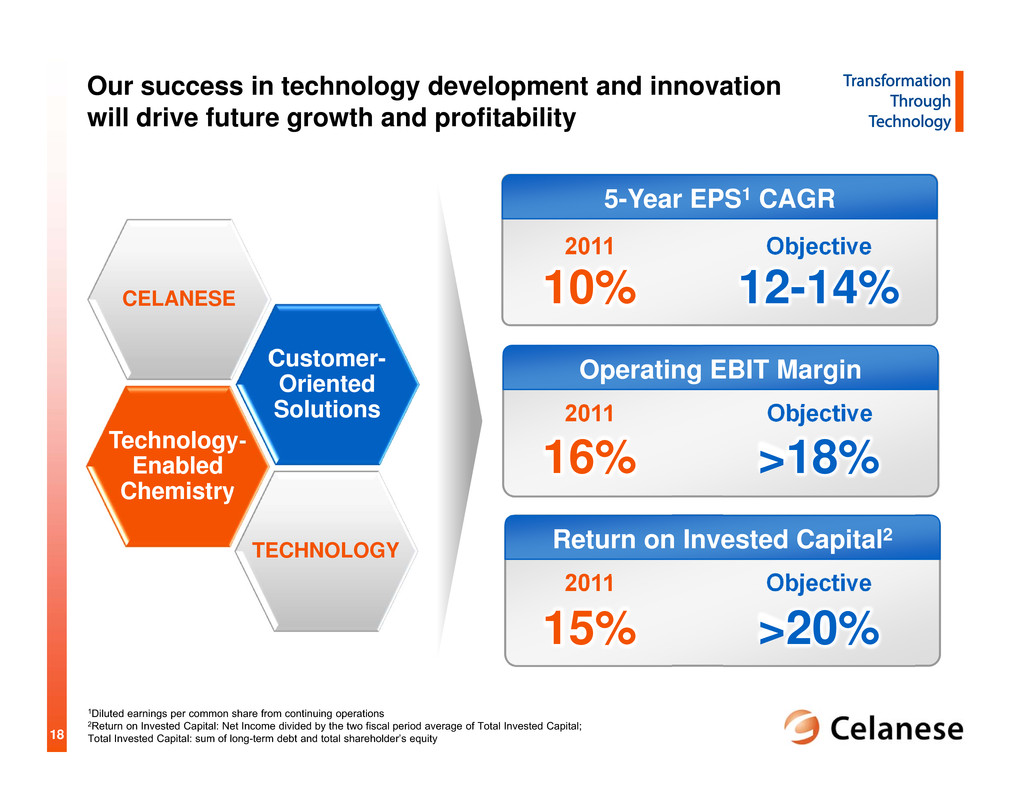
18 Our success in technology development and innovation will drive future growth and profitability 1Diluted earnings per common share from continuing operations 2Return on Invested Capital: Net Income divided by the two fiscal period average of Total Invested Capital; Total Invested Capital: sum of long-term debt and total shareholder’s equity 2011 Objective 15% >20% 5-Year EPS1 CAGR Operating EBIT Margin Return on Invested Capital2 2011 Objective 10% 12-14% 2011 Objective 16% >18%Technology-Enabled Chemistry Customer- Oriented Solutions TECHNOLOGY CELANESE

19 ► Grow the base business ► Invest in technology ► Reduce debt and become investment grade ► Increase shareholder dividends ► Repurchase shares opportunistically ► Reduce focus on growing free cash flow ► Hold back on productivity initiatives ► Spend more than $400 million in capital spending annually ► Destroy value with M&A We are focused on delivering shareholder value What We Will Do What We Won’t Do

20 Technology Day line up Scott Richardson Acetyl Chain Chemistry Steven Sterin & John Fotheringham Advanced Fuel Technologies Phil McDivitt Specialty Engineering Polymers Todd Elliott Cellulosic Technologies Diana Peninger Sweetener Solutions Technology Showcase Tour of Clear Lake Plant Steven Sterin Balancing Growth and Shareholder Returns

1 © Copyright Celanese 2012 Acetyl Chain Chemistry Scott Richardson

2 Acetyl Chemistry: Our advantage and opportunity Securing long term advantage and accelerating growth through technology Advantaged Raw Material Chemistry ► Acetyl chemistries drive additional advantage throughout the value chain ► Investing in upstream technology secures value from raw material advantage Technology-Enabled Growth ► TCX® Technology on track for 2013 commercialization ► Expected technical innovations further expand addressable space beyond acetyls Unmatched Core Technology ► Celanese maintains most advanced acetic acid technology in the industry ► AOPlus®3 Technology provides flexible low cost growth opportunities

3 Industry leading acetic acid technology ► Projected 2016 landscape remains attractive ► Limited capacity growth beyond 2013 ► Celanese technology advantage results in >15% Operating EBITDA margins ► Celanese continues to invest in technologies that strengthen cost position 2013E Acetic Acid Cost Curve 2016E Acetic Acid Cost Curve Source: Celanese internal management estimates

4 ► 1000+ patents issued/granted ► Protected conversion and purification technologies minimize raw material and energy usage ► >3x the capital efficiency of other leading technologies ► Drives lowest fixed cost in the industry regardless of geography The AOPlus® Technology advantage represents over 30 years of ongoing technical development AOPlus® Technology platform drives sustainable industry advantage Source: Celanese internal management estimates; assumes static raw material cost, capital defined as appropriate return on investment AOPlus® Technology Advantage vs. High Cost China Producer ($/ton) Proprietary Process Technologies Advanced Process Control Unmatched Capital Efficiencies ► Industry leading on-stream reliability ► Reduced maintenance requirements ► Leading energy efficiencies from heat integration

5 Acetic acid demand growth across diversified industrial end uses Source: CMAI 2012; demand does not include ethanol 2011 Regional Acetic Acid Demand Acetic acid demand growth remains strong and trends toward derivatives Demand by Derivative Growth 0 2 4 6 8 10 12 14 16 2010 2016 A c e t i c A c i d D e m a n d , M M t a BuAc Anhydride EtAc Other PTA VAM ► Global acetic acid: GDP+ growth at 3-4% ► VAM: Increased substitution using vinyl-based paints and coatings ► PTA: Growth from natural fiber substitution ► China: China has been leading acetyl growth in the last several years ► Americas: Low-cost natural gas combined with growing South American demand and global distribution likely to accelerate U.S. production China 37% Asia oustide of China 27% EMEA 16% Americas 20%
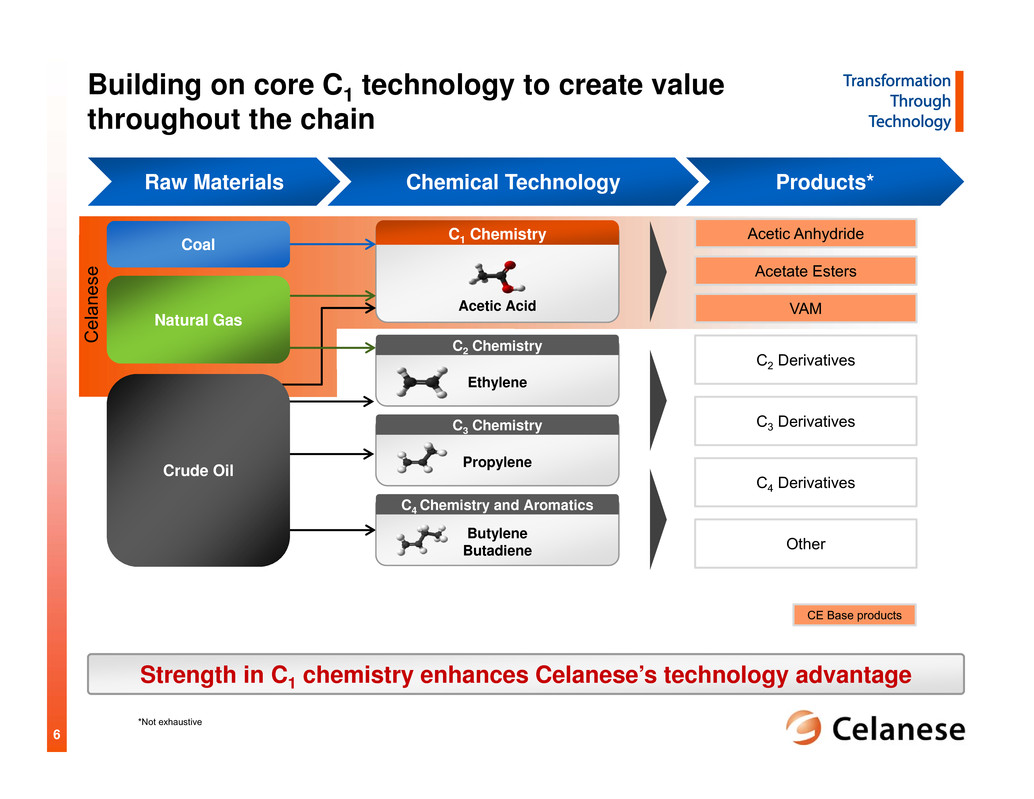
6 Building on core C1 technology to create value throughout the chain C e l a n e s e Acetic Acid Propylene C3 Chemistry Crude Oil Natural Gas Coal Acetic AnhydrideC1 Chemistry C2 Derivatives *Not exhaustive CE Base products Butylene Butadiene C4 Chemistry and Aromatics Ethylene C2 Chemistry Acetate Esters VAM Strength in C1 chemistry enhances Celanese’s technology advantage C3 Derivatives C4 Derivatives Other Raw Materials Chemical Technology Products*

7 0 5 10 15 20 25 30 35 40 1990 1994 1998 2002 2006 2010 2014 $ B B L : $ M M B T U Crude oil to Natural gas ratio Advantage to natural gas Dislocation Advantage to crude oil Celanese plans to capture regional value and secure cost position by investing upstream into Gulf Coast methanol production Evolution of raw material dynamics creates a unique opportunity in the U.S. Gulf Coast ► Acetic acid from natural gas or coal is advantaged versus oil ~80% Celanese production capacity utilizes coal or gas feedstock ► Shale gas production driving natural gas economics in the United States Natural gas advantage projected to continue through the foreseeable future ► Majority of incremental acetic acid capacity (Asia) is coal-based Coal-based economics improving through emerging technology U.S. Natural Gas Production (1990-2035E) ImplicationsCrude Oil to U.S. Natural Gas Ratio Source: CMAI 2012 0 5 10 15 20 25 30 1990 1995 2000 2005 2010 2015 2020 2025 2030 2035 T r i l l i o n f t 3 p e r y e a r Shale gas Source: EIA 2011 Traditional sources

8 Celanese Clear Lake Production Site Methanol Investment Utilizing existing Celanese infrastructure helps reduce capital requirements while capturing advantages of state-of-the-art technologies Investing upstream in U.S. Gulf Coast methanol production secures cost position ► Highly integrated with existing infrastructure ► Captures significant energy synergies ► Capacity: 1.3 million tons per year ► Production volume and capital investment expected to be shared with one or more parties ► Anticipated start-up: 2H 2015 Potential site Existing infrastructure

9 Raw Material Improvements Generate Value Through the Chain Core Product Methanol Key Process Inputs Improved gasification technologies provide opportunity to enhance advantage through the chain Syngas Celanese currently evaluating various technologies to extend advantages Hydrocarbon Crude Oil Natural Gas High rank coal Low rank coal Pet coke Biomass Waste CO Hydrogen Energy CO Hydrogen Acetic Acid Methanol Biomass Waste Sustainable and potentially low-cost raw material source Exploratory Low cost coal gasification technology Gasification Technology Development Crude oil Natural gas Higher cost coal Drives current raw material costsTraditional Improved reduction in acetic acid variable costsEmerging

10 C a l o r i c v a l u e ( k c a l / k g ) Emerging gasification technologies exhibit improved efficiencies using lower cost coal Celanese robustly evaluating alternative gasification technologies Hard coal (>5,700 kcal/kg) Sub- bituminous (4,165-5,700 kcal/kg) Lignite (<4,165 kcal/kg) Note: Hard coal includes anthracite, coking coal and other bituminous coal as defined by IEA Source: IEA 2011 Lower cost ► Entrained flow with coal- water slurry feed ► Limited to higher quality and higher cost coal ► Entrained flow with dry pulverized coal feed ►Higher raw material efficiencies ►Not limited to higher quality coal; capable of processing lower cost sub- bituminous and lignite Traditional Technology Emerging Technology Coal Gasification Technology Evolution Types of coal

11 TCX® Technology Attractive growth opportunities extend advantage beyond acetyls Advantaged raw material chemistry Unmatched core technology Technology-enabled growth Propylene C3 Chemistry Crude Oil Acetic Acid Acetic AnhydrideC1 Chemistry Traditional Acetyls VAM Industrial Ethanol Fuel Ethanol EO/EG Acrylic Acid / Esters Other Derivatives Butylene Butadiene C4 Chemistry Ethylene C2 Chemistry Early-stage Projects Exploratory ► AOPlus®3 Technology Natural Gas Coal Butanol Addressable space ($ billion) $20-25 ~$100 >$140 billion ~$15-20 $5-7 Raw Materials Chemical Technology Products* Source: Celanese internal management estimate, available public information * Not exhaustive

12 Feedstock diversity Application diversity Source: Celanese internal management estimates, available public information; based on recent third party raw material prices Advantaged TCX® Technology links C1 feedstock to attractive industry US ~14% Brazil ~13% West Europe ~14% China ~50% ROW ~11% Fuel ~65-75 mmT ~5-6 mmT Industrial 2011 Global Ethanol Demand ► TCX® Technology offers feedstock flexibility, reducing the burden on arable land ► Diversified value-added end uses with broad applications ► 2010-2016 China industrial ethanol growth: 8-10% Breakthrough TCX® Technology economics extend C1 advantage to ethanol Paints, Coatings, Solvents Natural Gas Celanese TCX® Technology Pharma./ Medical Fuels and Additives Pet Coke Coal

13 Celanese TCX® Technology ethanol demonstration facility accelerates development ► Project completed on time and budget ► Flexible, modular design facilitates rapid implementation of modifications and improvements ► Successful startup in July 2012 ► Provides full scale testing of all process designs prior to greenfield investments TDU provides a platform for rapid technology improvement Technology Development Unit (TDU) TCX® Technology Achievements Tech. Initial Discovery First Commercial Current Technology Relative Improvement Capital 100% 85% 50-55% Conversion 100% 125% >200% Energy 100% 90% 60-65% Period 100% 67% 45-50% Source: Celanese internal management estimates
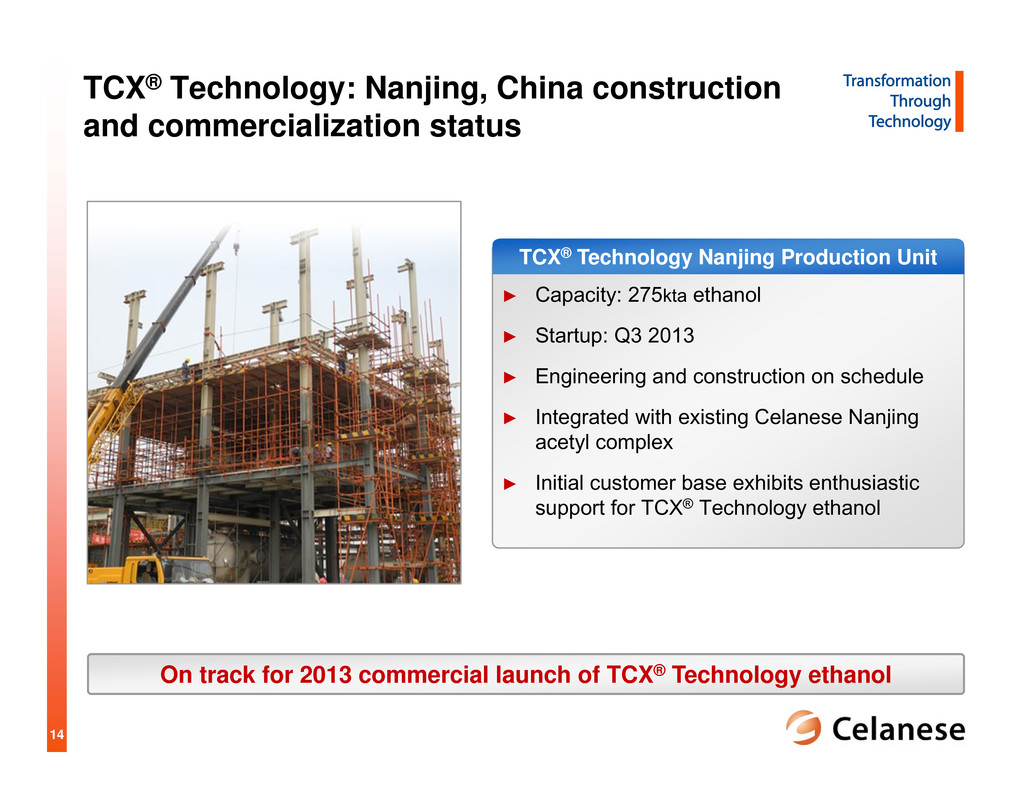
14 TCX® Technology: Nanjing, China construction and commercialization status ► Capacity: 275kta ethanol ► Startup: Q3 2013 ► Engineering and construction on schedule ► Integrated with existing Celanese Nanjing acetyl complex ► Initial customer base exhibits enthusiastic support for TCX® Technology ethanol On track for 2013 commercial launch of TCX® Technology ethanol TCX® Technology Nanjing Production Unit

15 Raw Materials Conversion Demand ► Low cost coal: pursuing next generation gasification technology ► Natural gas: investing in U.S. Gulf Coast methanol production ► Continue to advance acetyl platform technology Lower capital Lower catalyst cost Lower energy usage ► AOPlus®3 Technology Acetyl Chemistry: strategic summary ► Developing innovative C1 product technology ► TCX® Technology ethanol ► Other new derivatives ► ~7x increase in addressable space Access to New Demand Beyond Acetyls Advantaged Chemistry Breakthrough Technology Secure and Expand Competitive Advantage Grow through Technology

1 © Copyright Celanese 2012 Advanced Fuel Technologies Steven Sterin & John Fotheringham

2 Celanese TCX® Technology production process TCX ® Technology Breakthrough Elements ► Catalyst systems ► Process control ► Conditions of operation ► Materials of construction Acetyl Technologies TCX® Technology Ethanol Methanol Natural gas Coal Pet coke Biomass (future) Waste (future) Syngas Feedstock Conversion Product ► >3,000 patents globally* ► 30+ years of operational excellence and know-how TCX® Technology builds on Celanese’s expertise in acetyl technologies *Global Celanese granted and pending patents

3 Value proposition of TCX® Technology ethanol TCX® Technology provides a broad value proposition 1

4 TCX® Technology commercialization TCX® Technology Value Proposition Prioritizing commercialization efforts Near-term Focus China Indonesia Nov. 2010 TCX® Technology launched Sep. 2012 JSC with a major Chinese SOE2 refiner in process Jul. 2012 Technology Development Unit started up Jul. 2012 JSC1 signed with Pertamina Jun. 2011 Announced acceleration of ethanol production in China Jul. 2011 Third-party engineering validation 1 JSC=Joint Statement of Cooperation; 2 SOE=State-Owned Enterprise; 3 Compared to alternative XTL technologies Utilize local coal to produce fuel ethanol reducing gasoline imports • Higher energy efficiency3 • Lower greenhouse gas emission3 • Does not compete with food for arable land Provide abundant low-cost fuel lowering subsidies Produce excellent blend stock (ethanol) at world scale volume to improve gasoline and air quality

5 High-Octane Blend Stock Accepted Globally Ethanol is a widely accepted, clean, safe fuel solution Ethanol blended gasoline improves air quality 90 100 110 120 130 140 Ethanol Methanol MTBE AromaticsReformate Alkylate Better Combustion Characteristics Improved tailpipe emissions if gasoline replaced with E10 2 (per ton basis) 1 Source: Guide to Petroleum Product Blending, HPI Consultants, Inc. 2 Source: US EPA, Argonne National Lab, China NDRC, “Evaluating the Health Impacts of Ethanol Blend Petrol” (a study of Australian government in June 2008), Beijing Institute of Technology 3 Source: NASA, Dalhousie University, Aaron van Donkelaar Octane Rating (RON) of Key Components1 Global Air Pollution – Particulate Matter 2001-2006 average ChinaUS and Brazil -30% -19% -25% -40% -46% CO GHGx Benzene PM2.5 SOx Satellite-Derived3 PM2.5 (µg/m3)

6 TCX® Technology cost and quality advantage TCX® Technology provides a low cost, clean-burning gasoline alternative 1 Celanese proprietary models, Booz & Company analysis. $/bbl adjusted for historic market relationship to crude; price assumptions based on consensus outlook; 2 Source: Indicative model, based on Qinghuangdao5500 kcal/kg coal. ► Ethanol, at the right price, is an excellent fuel blending component All–In Costs, including capital return (landed Asia, Indexed) ► TCX® Technology produces the lowest cost alternative liquid fuel Cost Advantaged1A Clean-Burning Fuel Bio-Ethanol MTBE Aromatics Lead TCX® Technology Ethanol Safe/ Clean High cost Hazardous/ Polluting Low cost TCX® EtOH MTBE Sugarcane EtOH Methanol- To-Gasoline Coal- To-Liquid Corn EtOH Gas- To-Liquid Low Cost Alternative2 TCX® Technology Ethanol Price Relative to Raw Materials (oil equivalent basis) ► TCX® Technology produces ethanol with a lower long-term cost than gasoline <$70 >$120 <$40 >$100 C r u d e O i l P r i c e $ / b b l Coal Price $/ton China TCX® Technology Ethanol Economical to Customers China * All growth and value projections regarding TCX™ Technology are based on Celanese internal management current estimates and assumptions, including capital and raw material costs and availability, demand for ethanol, and continuing technology developments

7 …Particularly in Asia Global fuel ethanol potential by 2020 Near-term focus covers ~30% of global non-bio fuel ethanol potential Source: Global Biofuels Outlook 2010-2020, Hart Energy; Global Petroleum Market Outlook: Petroleum Balances Purvin and Gertz Inc.; Celanese internal management estimates Global Ethanol Potential China E10 Potential Indonesia E10 Potential ROW Potential 120 – 130 3-413-15 Non-bio potential Bio potential (in million tons) Near-term focus Significant Growth Potential… 3 to 4 world scale facilities China Indonesia 13 to 15 world scale facilities * All growth and value projections regarding TCX™ ethanol technology are based on Celanese internal management current estimates and assumptions, including capital and raw material costs and availability, demand for ethanol, and continuing technology developments

8 China’s liquid fuel considerations TCX® Technology Value Proposition Energy Security Global Considerations 1 Safe & Clean 2 Cost 3 4 30% Beijing PM2.5 emission reduction goal by 2020 70% Crude oil imported by 2020 1/6 Arable land per capita than the US 3rd Largest global coal reserves Sources: Beijing government; EIA and Celanese internal management estimates; Global Petroleum Market Outlook: Petroleum Balances (Purvin & Gertz Inc., March 2010); BP Statistical Review of World Energy (June 2012); World Bank, UN; EIA; other available public data and Celanese internal management estimates. * Compared to other XTL technologies 1/4 Of today’s global CO2 emissions ► Higher energy efficiency* ► Lower greenhouse gas emission* ► Does not compete with food for arable land Provide abundant low-cost fuel to reduce government subsidies Produce excellent blend stock (ethanol) to: ~$9.0 billion Crude oil and fuel ethanol subsidies in 2010 ► Provide world scale volume ► Improve air quality Utilize local coal to ► Produce fuel ethanol ► Reduce gasoline imports

9 Opportunities for Celanese Significant opportunity in China 40 60 80 100 120 140 2010 2015E 2020E I n m i l l i o n t o n s p e r y e a r Gasoline Demand E10 Fuel Ethanol ► Government targeting air quality improvements country-wide ► Existing ethanol supply limited by cost and availability ► Abundant coal supplies available Project Summary TCX® Technology supports China’s policies Source: C1Energy, Global Petroleum Market Outlook: Petroleum Balances (Purvin & Gertz Inc., March 2010), Celanese internal management estimates Engaged leading institution to prove benefit of ethanol blending in Beijing Feasibility study co-written with a major Chinese SOE refiner JSC with a major Chinese SOE refiner under final stage negotiation Negotiated terms for critical raw materials Build broad provincial government support Sign JSC with major Chinese SOE refiners Develop additional channels to market Finalize Celanese specific opportunity
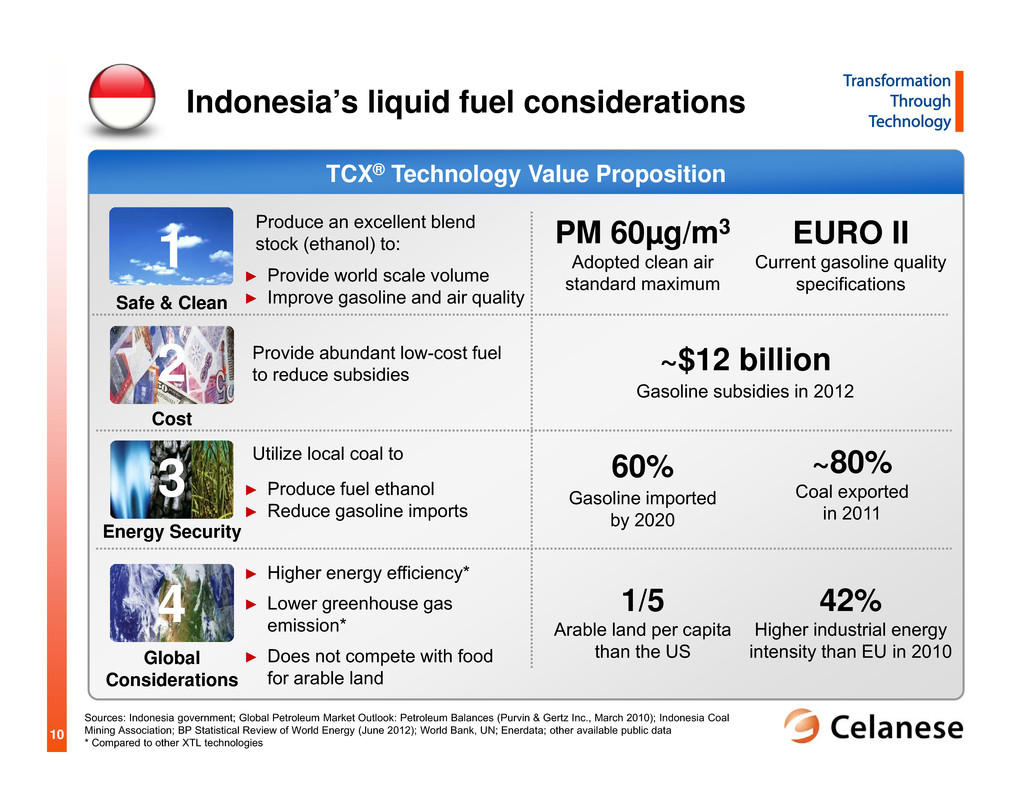
10 TCX® Technology Value Proposition Indonesia’s liquid fuel considerations Utilize local coal to ► Higher energy efficiency* ► Lower greenhouse gas emission* ► Does not compete with food for arable land Provide abundant low-cost fuel to reduce subsidies Produce an excellent blend stock (ethanol) to: PM 60µg/m3 Adopted clean air standard maximum 60% Gasoline imported by 2020 1/5 Arable land per capita than the US ~80% Coal exported in 2011 42% Higher industrial energy intensity than EU in 2010 Sources: Indonesia government; Global Petroleum Market Outlook: Petroleum Balances (Purvin & Gertz Inc., March 2010); Indonesia Coal Mining Association; BP Statistical Review of World Energy (June 2012); World Bank, UN; Enerdata; other available public data * Compared to other XTL technologies ~$12 billion Gasoline subsidies in 2012 EURO II Current gasoline quality specifications Energy Security Global Considerations Safe & Clean 2 Cost 3 4 ► Provide world scale volume ► Improve gasoline and air quality ► Produce fuel ethanol ► Reduce gasoline imports 1

11 Opportunities for Celanese Project Summary Indonesian business update ► Fuels subsidies burdening economic development ► Abundant low-rank coal availability ► Potential to reduce ~$1 billion of government subsidies Significant opportunity to lower energy subsidies Source: Global Petroleum Market Outlook: Petroleum Balances (Purvin & Gertz Inc., March 2010), Celanese internal management estimates 0 5 10 15 20 25 30 35 2010 2015E 2020E I n m i l l i o n t o n s p e r y e a r Gasoline Demand E10 Fuel Ethanol Blending Gained strong, broad government support Signed Joint Statement of Cooperation with Pertamina Identified and vetted low-rank coal gasification technology providers Prioritized potential investment locations Finalize critical raw material partners and site selection Finalize ideal business model for Celanese
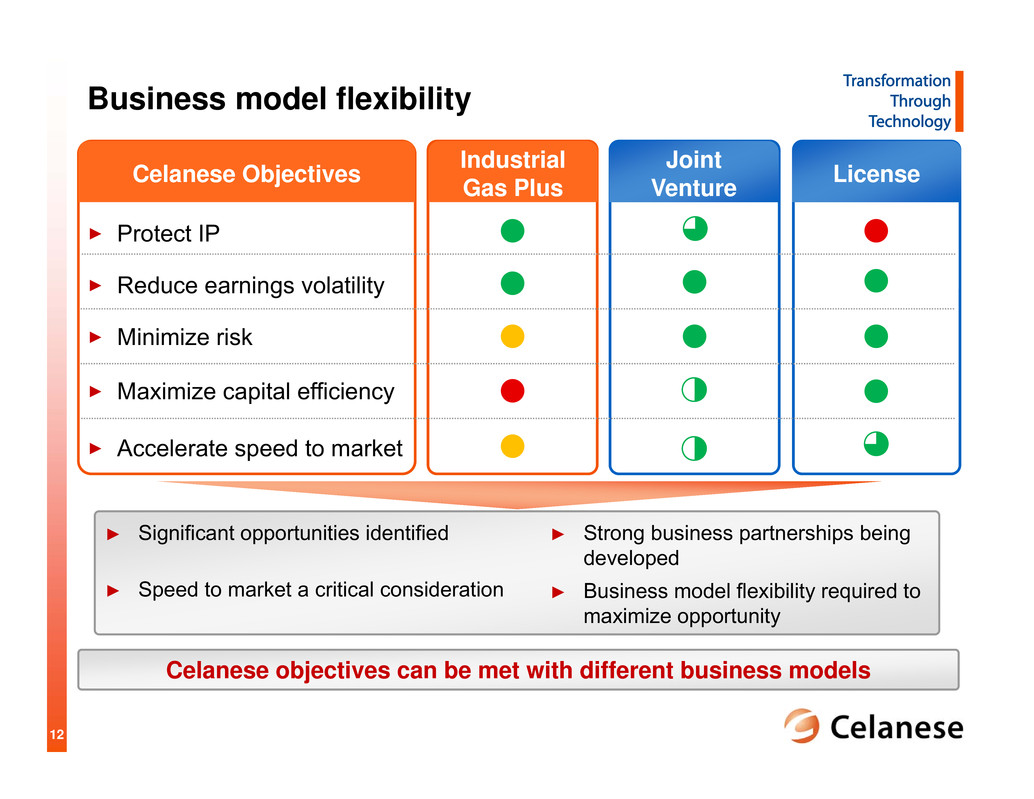
12 Business model flexibility ► Significant opportunities identified ► Speed to market a critical consideration Celanese objectives can be met with different business models Industrial Gas Plus Joint Venture LicenseCelanese Objectives > Protect IP > Reduce earnings volatility > Minimize risk > Maximize capital efficiency > Accelerate speed to market ► Strong business partnerships being developed ► Business model flexibility required to maximize opportunity

13 2011 - 2012 Clear path to commercialization Progressing as planned against project objectives ► Early China commercialization ► Larger China opportunities negotiated ► Finalize Indonesian opportunity ► Greenfield investment in Asia ► Potential licensing arrangements ► Extended commercialization in other countries 2013 - 2015 2016+ ► Develop technology to meet market needs ► Prove benefit of value proposition ► Prioritize opportunities

14 Refined our unique value propositions Focused on two strongest opportunities Significant external interest with resources committed Tangible progress on advanced opportunities Lower-risk business models to accelerate opportunities Advanced Fuel Technologies: progressing on fuel opportunity Energy Security Global Considerations 1 Safe & Clean 2 Cost 3 4

© Copyright Celanese 2012 Specialty Engineering Polymers Phil McDivitt

2 Advanced Engineered Materials: Recognized leader in specialty engineering polymers ► High customer intimacy leading to participation early in customer development cycle ► Unique polymer development capability across a broad range of end-uses ► Engineering and design expertise to advance an optimized solution ► Global leader with broadest portfolio in highest value engineering polymer applications Strategic Overview Technology- Enabled Chemistry Customer- Oriented Solutions CELANESE ► Acetyl chain chemistry ► Ethanol products Industrial Advanced fuel technologies ► Other acetyl derivative chemistry ► Specialty engineering polymers ► Advanced vinyl chemistries ► Cellulosic technologies ► Sweetener solutions ► Controlled release polymers

3 AEM participates in the highest value applications of the $300+ billion polymers industry Specialty Engineering Polymers Standard Polymers S e r v i c e t e m p e r a t u r e Broadest polymer offerings in highest performance applications ~10% of polymer industry volume AEM Polymers Source: SRI Consulting
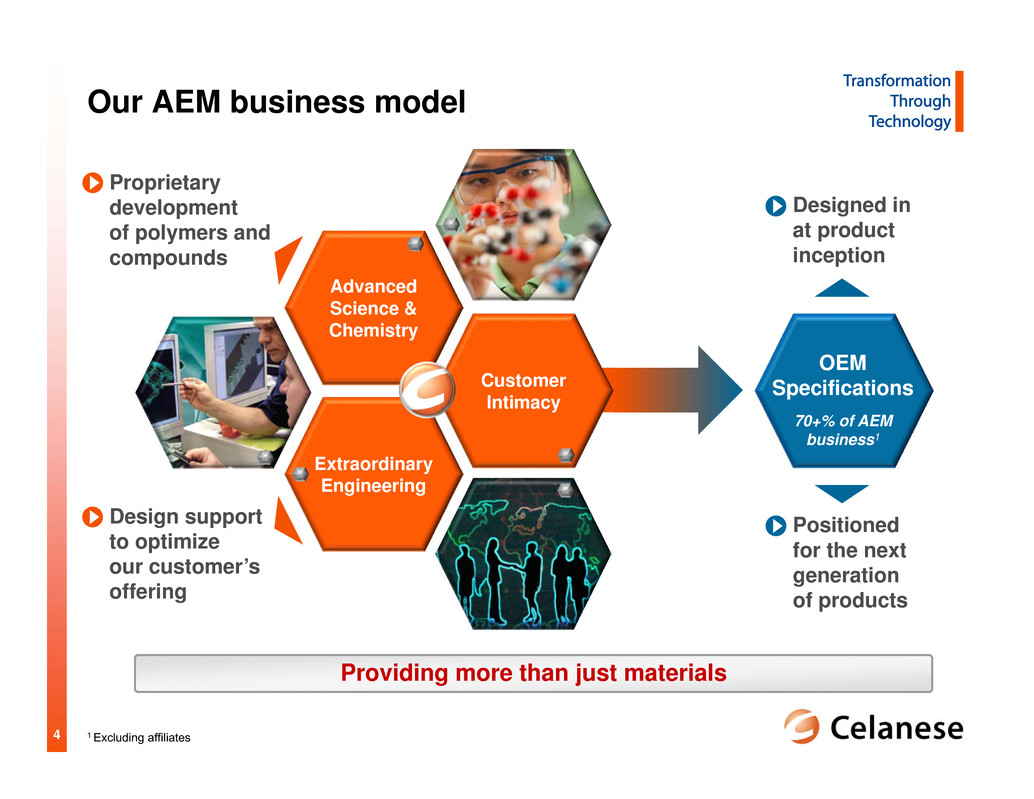
4 Our AEM business model Extraordinary Engineering Customer Intimacy Advanced Science & Chemistry OEM Specifications 70+% of AEM business1 Designed in at product inception Positioned for the next generation of products Proprietary development of polymers and compounds Design support to optimize our customer’s offering 1 Excluding affiliates Providing more than just materials

5 Global dynamics influence innovation pipeline Resource Scarcity Resource Scarcity Innovation Focus Areas Vehicle light- weighting Oil & gas industry Household appliances Consumer goods Alternative fuel/energy systems Filtration Thin wall connectors Compact camera modules Orthopedic implants Drug delivery systems Resource Scarcity Environment Technology Growing Middle Class Safety, Health & Wellness

6 2010 2011 2012E New Products New Applications Close customer cooperation drives mutual success How We Do It Collaboration with customers feeds our growth pipeline 100+ Customer workshops and tech forums Up to 100 Projects/OEM 3000+ Application projects 10x Increase in patent filings from 2009 to 2012 One automotive workshop in 2012 yielded ~$100 million of innovation ideas Multiplying what we know New product and end- use application technology covered by intellectual property Numerous projects at each OEM made possible through customer intimacy Innovation Pipeline Potential Revenue ($ in million) ~80% of pipeline is patent protected 3x 4x ~$75 Source: Celanese internal management estimates

7 Creating technology - polymer functionalization Hostaform® POMCompetitive POM Homopolymer impact modified Competitive POM Copolymer impact modified High Impact Hostaform® POM I m p a c t Weld Line Strain @ Break Examples in Hostaform® POM, Fortron® PPS, and Zenite® LCP polymer functional group additive Example: Hostaform® POM Performance Functionalization Concept Enabled Applications Challenge Solution Higher Toughness Fasteners Super High Impact POM Higher Emission Standards Low Fuel Permeation POM Fasteners, fuel tanks & lines Laptop/ tablet covers Challenge Solution Low Halogen with Dimensional Stability Low Halogen PPS Printer components Challenge Solution Complex Part Geometries High Flow, Dimensionally Stable LCP Source: Celanese internal management estimates

8 Enabling technology to transform with emerging trends Past Present Future • 2 pounds • Voice only • No camera • Regional • Luxury item • Flexible form factor • Mobile productivity • Increasing resolution • Everywhere • Total life device ► Rapid evolution in functionality ► Complex, highly engineered parts required We collaborate with customers to enable technology evolution Example: Camera Phone Evolution • Lightweight • Multi-media device • 8MP cameras • Global • Essential AEM Success Story Leading Smartphones Customer Need New polymers for high resolution compact camera module AEM Technology Transformation Patent pending high flow Vectra® LCP technology concept Results Commercialized in leading smartphones Additional Addressable Space $10+ million Technology Transformation Source: Celanese internal management estimates

9 As complexity increases, AEM provides solutions $500+ million sales with high growth in global transportation sector Platform Example: Light Vehicles AEM Success Story Automotive Fuel Systems Customer Need ►Lightweight, strong, electrically conductive ►High impact and chemical resistance AEM Technology Transformation POM copolymer (Hostaform®) and linear PPS (Fortron®) solutions Results Global leader in automotive fuel systems Addressable Space $500+ million Continued growth in high value-in-use applications Past Present Future 0 100 200 300 400 1960 1990 2000 2005 2011 Engineering Polymers Other Polymers Polymer Use in North American Light Vehicles P o u n d s / V e h i c l e 48 38 31 19 Minimal 2x rate of growth for engineering polymers versus other polymers since 2000 Source: ACC, Celanese internal management estimates

10 AEM positioned for continued value-in-use Global dynamics support opportunity to build on existing success 0 10 20 30 40 50 60 1990 2000 2010 2025 Passenger Cars Light Trucks M P G Source: NHTSA, EPA 1 Corporate Average Fuel Economy standards as regulated by the NHTSA U.S. CAFE1 Standards g C O 2 / k m Source: European Environment Agency, European Commission Engineering polymers are the lightest Weight reduction enables greater fuel efficiency and lower emissions 50 75 100 125 150 175 2000 2005 2010 2015 2020 Average CO2 emissions for new passenger cars Engineering Polymers Versus Metals EU Emission Standards 2006 2010 2016E P o u n d s / v e h i c l e 2006 2010 2016E P o u n d s / v e h i c l e Entitlement Entitlement Additional opportunities for AEM value-in- use with increasing auto standards Celanese Americas Celanese Europe Source: Celanese internal management estimates

11 Expanding our expertise into new applications New applications provide accelerated growth opportunity Composite Technology Polymer for New Fuel Applications Resource Scarcity Drives need for deep sea and deep forest oil and gas exploration Industry looking for high strength-to-weight ratio solutions Applications in cables, spoolable pipe, risers and umbilicals Environment New EPA standards to reduce evaporative emissions Industry looking for high impact and low fuel permeation Applications in tank fuel lines and small fuel engine tanks Addressable Space $1 billion Addressable Space >$500 million Global dynamicsOur business model Ideation Source: Celanese internal management estimates

12 Well established strategic growth platforms Medical Orthopedic implants, drug delivery devices, medical device components, diagnostic systems Consumer Personal care products, toys, lawn & garden equipment, durable household goods Electrical & Electronics Connectors, sockets, sensors, switches, motor components, lighting, contactor housings Specialty Applications Including fibers, ropes, textiles Industrial Fluid handling, bearing & gear applications, material transport equipment Transportation Fuel & safety systems, interior & exterior components, power train & chassis, under the hood applications Adding new strategic platforms to broaden growth opportunities New Transformational Opportunities Including oil & gas, composites, separations, additives Source: Celanese internal management estimates Addressable Space of $25+ billion $7+ billion of additional addressable space
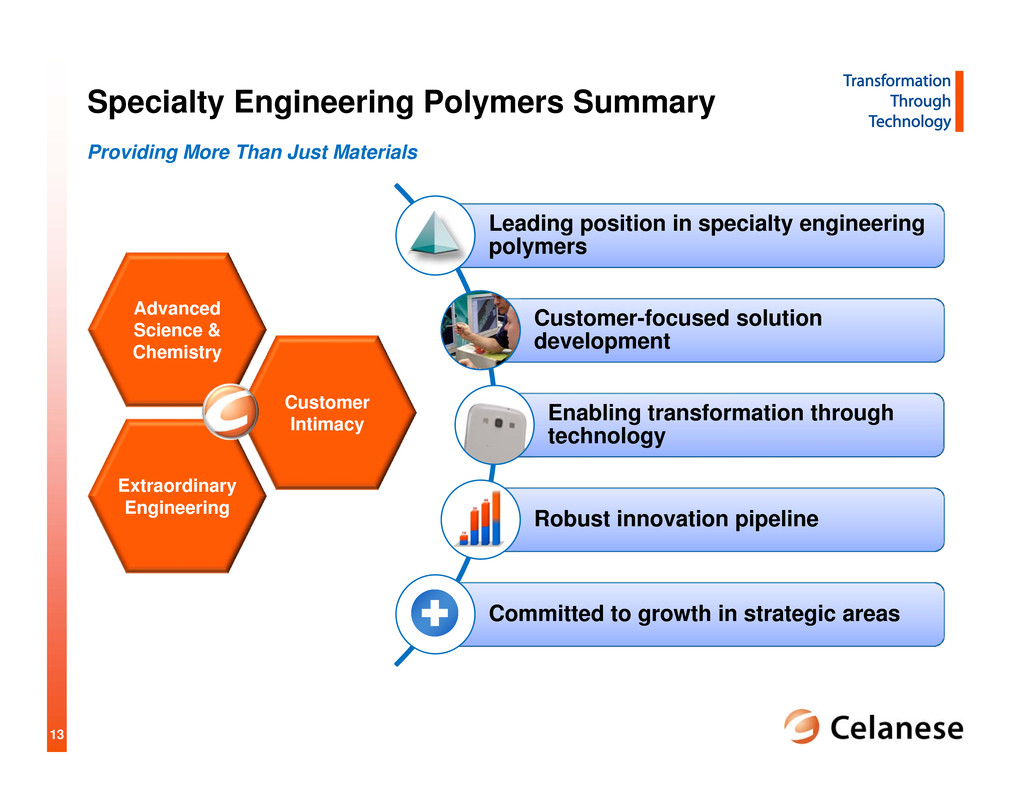
13 Specialty Engineering Polymers Summary Extraordinary Engineering Customer Intimacy Advanced Science & Chemistry Leading position in specialty engineering polymers Customer-focused solution development Enabling transformation through technology Robust innovation pipeline Committed to growth in strategic areas Providing More Than Just Materials

1 © Copyright Celanese 2012 Cellulosic Technologies Todd Elliott
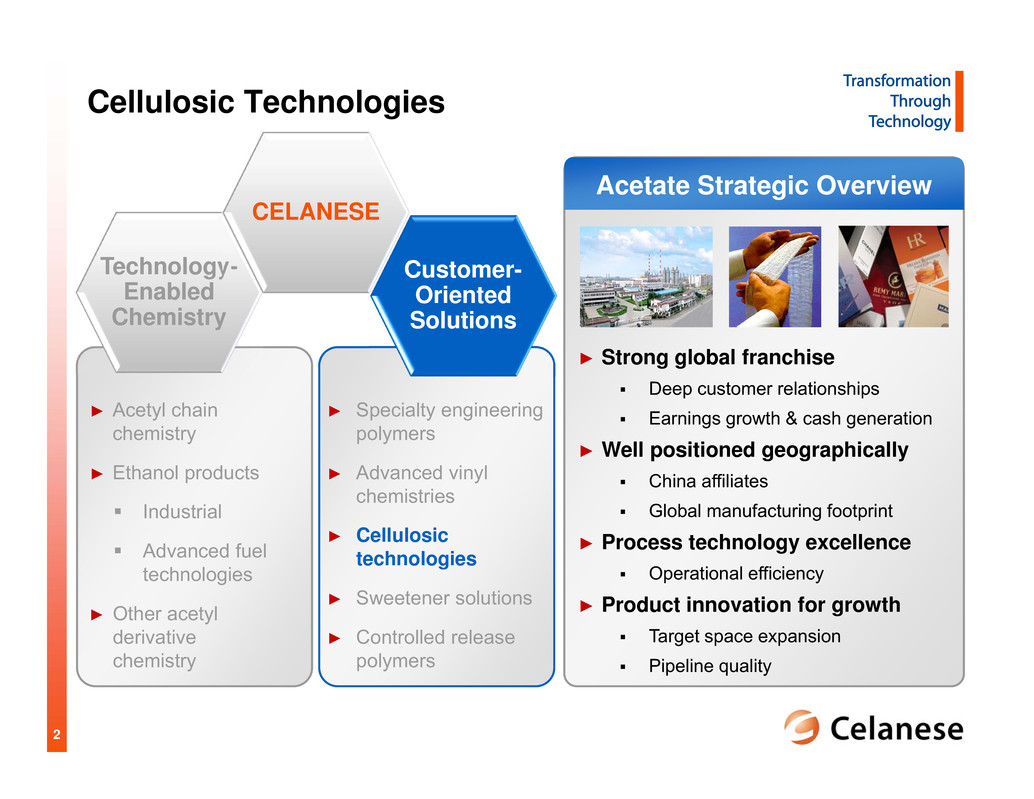
2 Cellulosic Technologies ► Strong global franchise Deep customer relationships Earnings growth & cash generation ► Well positioned geographically China affiliates Global manufacturing footprint ► Process technology excellence Operational efficiency ► Product innovation for growth Target space expansion Pipeline quality Acetate Strategic Overview Technology- Enabled Chemistry Customer- Oriented Solutions CELANESE ► Acetyl chain chemistry ► Ethanol products Industrial Advanced fuel technologies ► Other acetyl derivative chemistry ► Specialty engineering polymers ► Advanced vinyl chemistries ► Cellulosic technologies ► Sweetener solutions ► Controlled release polymers

3 China Affiliates Advanced Filtration Microslims Energy Process Technology Wood Pulp Value Capture Product Portfolio Adhesives Encapsulants Film Strategic Prioritization Protect and Improve the Core New Applications and Platforms Commercial Excellence Technology and Alternative Raw Materials Create Value with Innovation Unlock higher margins with value-driven solutions Open entry points to new customers and geographies Build sustainable advantages with patented, unique technologies
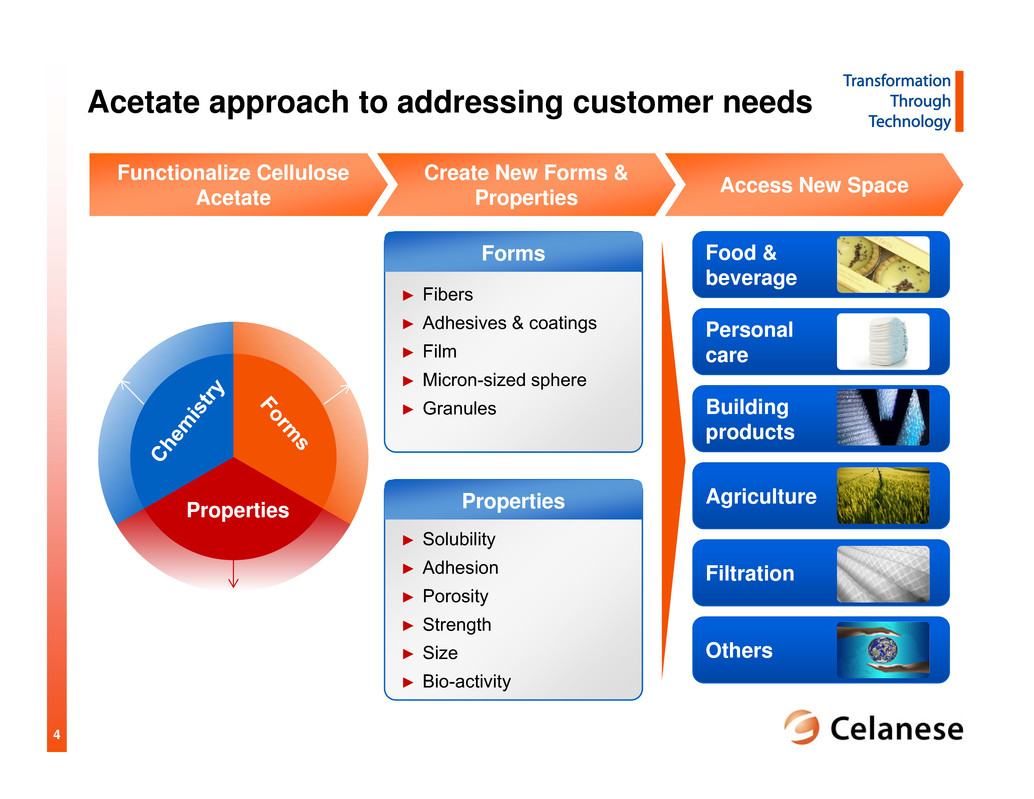
4 Food & beverage Personal care Building products Agriculture Filtration Others Forms Acetate approach to addressing customer needs Functionalize Cellulose Acetate Create New Forms & Properties Access New Space Properties ► Fibers ► Adhesives & coatings ► Film ► Micron-sized sphere ► Granules ► Solubility ► Adhesion ► Porosity ► Strength ► Size ► Bio-activity Properties

5 Well positioned for global trends Current Business Capabilities Product Attributes Resource Scarcity Growing Middle Class Environment Resource Scarcity Safety, Health & Wellness Technology Flexible polymer based on renewable feedstock Customer Intimacy Luxury Package Lamination Fiber Forming and Spinning Tobacco Industry / Manufacturing Acetylation Process & Technology Particulate Filtration Food Safe Bio- degradable Bio-sourced Form Flexible

6 $14 $15 $2 $4 $12 $10 Trends generating unique needs Total Value of Addressable Space ~$4 billion Tobacco ►Regulations ►Health ►Population Dynamics Film ►Health ►Food and Water ►Green Solutions Adhesives& Coatings ►Regulations ►Health ►Green Solutions Specialty Fibers ►Health ►Energy ►Population Dynamics Bio-plastics ►Green Solutions ►Food and Water ►Regulations Real challenges in large addressable spaces ~$55 billion Encapsulation ►Food and Beverage ►Health ►Regulations ►Green Solutions Source: Euromonitor, SRI, BCC Research, Japan Trade Organization, IHS and external expert interviews

7 Progress in target space Tobacco ► CelFX™ ► Degradation Progress Launch Total value of addressable space ~$55 billion Space Value of target space, $ billion 2.4 Discovery Development Film ► Thermoforming ► Functional films 1.0 Specialty Fibers ► Non-wovens 1.0 Adhesives & Coatings ► Wood adhesive ► Agriculture 3.1 Encapsulation ► Food and beverage ► Personal care 2.4 Bio-plastics ► Pure cellulose acetate ► Blends 2.1 Significant growth potential in $12 billion target space Source: Euromonitor, SRI, BCC Research, Japan Trade Organization, IHS, external expert interviews, and Celanese internal management estimates

8 Case Study: CelFX™ Matrix Technology Tobacco Initial target space worth $2.4 billion Improved constituent reduction1 Broad choice of additives2 Increased design flexibility3 Production compatible5 Lower particle breakthrough4

9 Case Study: CelFX™ Matrix Technology Tobacco Significant increase in constituent reduction performance 0 10 20 30 40 50 60 70 80 90 100 Aldehydes Ketones Butadiene Benzene % reduction in gas phase constituent levels compared with standard mono-acetate filter cigarettes 1 Represents simple weighted average in reduction performance across more than 1 constituent 2 Includes formaldehyde, acetaldehyde, acrolein, propionaldehyde, crotonaldehyde and butyraldehyde 3 Includes acetone and methyl ethyl ketone Source: Celanese internal test results 1,2 1,3 Carbon on tow (10 mm / 56 mg) 5 mm / 75 mg 10 mm / 150 mg 15 mm / 225 mg CelFXTM %
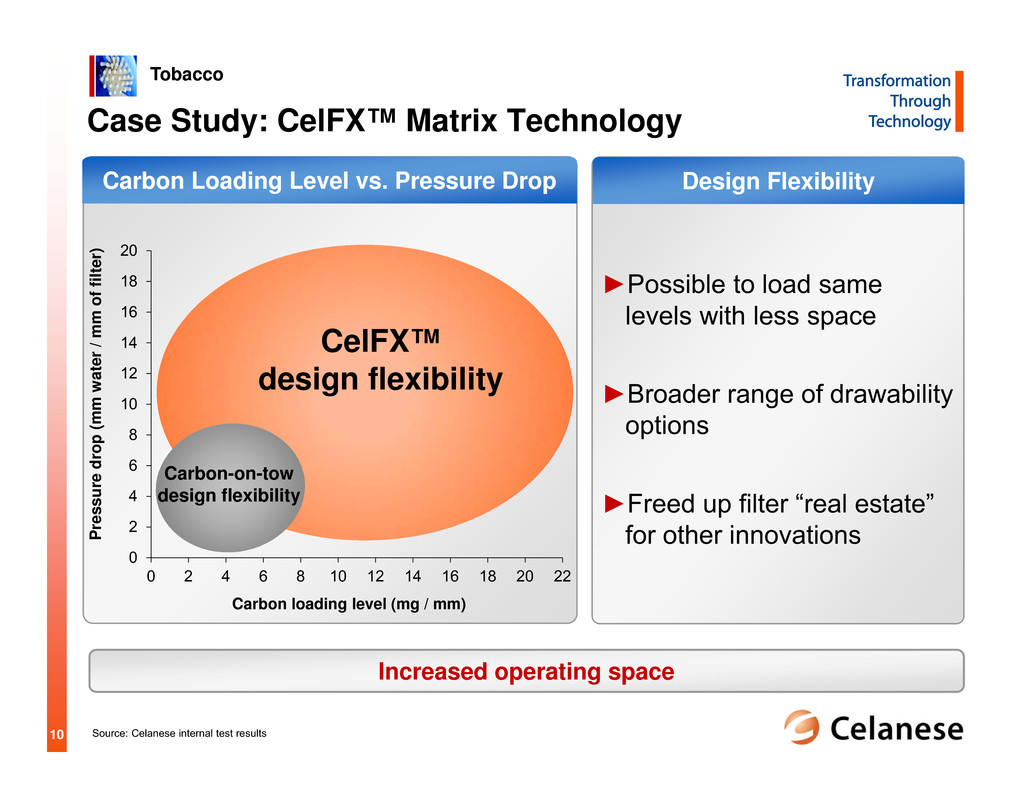
10 0 2 4 6 8 10 12 14 16 18 20 0 2 4 6 8 10 12 14 16 18 20 22 Pressure drop (mm w a ter / mm of filter ) Carbon loading level (mg / mm) Case Study: CelFX™ Matrix Technology Tobacco Increased operating space CelFX™ design flexibility Carbon-on-tow design flexibility Source: Celanese internal test results ►Possible to load same levels with less space ►Broader range of drawability options ►Freed up filter “real estate” for other innovations Design FlexibilityCarbon Loading Level vs. Pressure Drop

11 ► Protection from elements ► Masking of tastes/odors/colors Case Study: Porous Cellulose Acetate Encapsulation Food & Beverage Personal Care Pharma Applications Encapsulation needs Cellulose Solution ► Micron-sized spheres ► High internal surface area ► “Tunable” outer shell Source: Celanese internal test results, external expert interview Trends ► Converting liquids to solids ► Reduce volatility ► Controlled delivery ► Prevent premature reactions/ interactions ► Fiber-based material ► Good loading levels ► Non-caloric ► Naturally sourced Comparative Loading Levels ~10% Silica ~40% Starch Porous Cellulose Acetate 40-60% Efficient use of encapsulation materials

12 Strong global franchise Flexible polymer well positioned for global trends Focused on addressable space where real needs exist Developing novel technologies Penetrating expanding addressable space Cellulosic technology innovation drives growth strategy
1 © Copyright Celanese 2012 Sweetener Solutions Diana Peninger

2 Nutrinova A Leading “Sweet Taste Solution Provider” ► Accelerating highly profitable growth through advanced sweetener solutions ► Application technology offers customers significant benefits in taste and speed to market ► Extending sweetener leading position with a robust next generation technology pipeline SunsationSM artificial sweetener platform Natural sweetener/ enhancer platform (Acesulfame potassium) Technology- Enabled Chemistry Customer- Oriented Solutions CELANESE ► Acetyl chain chemistry ► Ethanol products Industrial Advanced fuel technologies ► Other acetyl derivative chemistry ► Specialty engineering polymers ► Advanced vinyl chemistries ► Cellulosic technologies ► Sweetener solutions ► Controlled release polymers

3 Global epidemic health concerns drive need for healthy food alternatives Source: WHO, International Diabetes foundation 2008- Obesity in males & females above age of 20, news articles Reduced sugar products More functional ingredients (e.g. heart, digestive, energy) Increased natural ingredients Obesity has doubled in last two decades ► More than 1.4 billion adults overweight; 0.5 billion are obese ► Greater than 40 million children under five are overweight <20% 20-40% 40-60% >60% % of Population overweight But, consumers will not compromise on sweet taste! Safety, Health & Wellness Resulting Consumer Needs
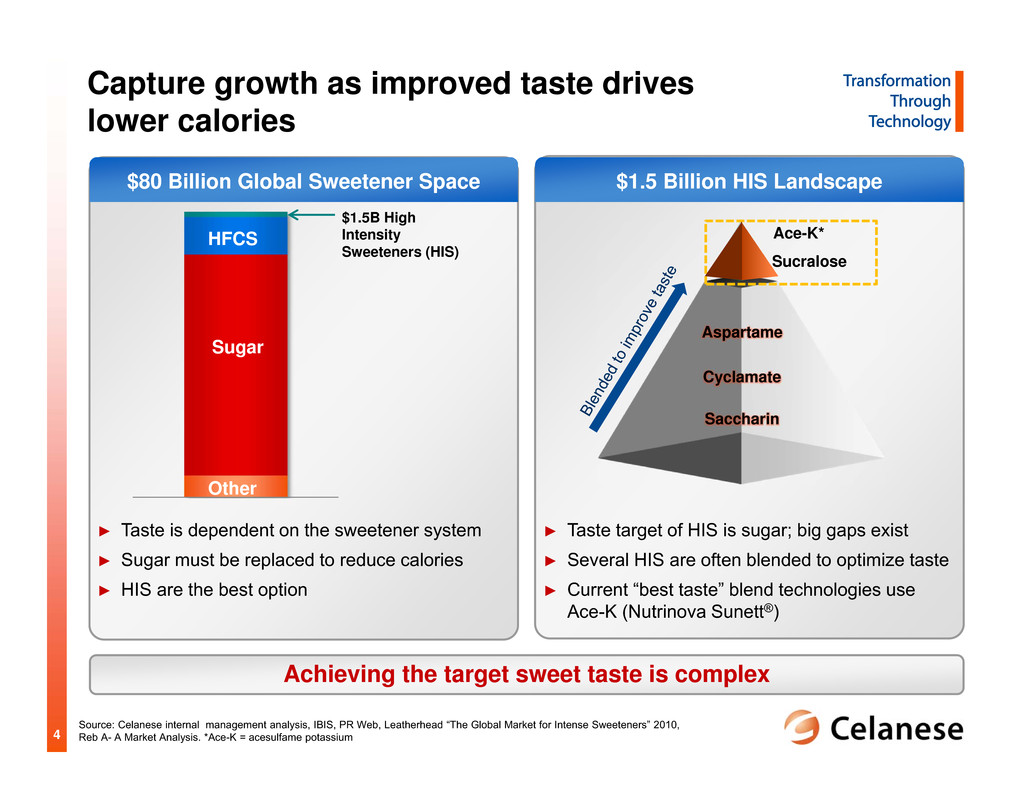
4 $1.5 Billion HIS Landscape$80 Billion Global Sweetener Space Capture growth as improved taste drives lower calories Source: Celanese internal management analysis, IBIS, PR Web, Leatherhead “The Global Market for Intense Sweeteners” 2010, Reb A- A Market Analysis. *Ace-K = acesulfame potassium ► Taste is dependent on the sweetener system ► Sugar must be replaced to reduce calories ► HIS are the best option ► Taste target of HIS is sugar; big gaps exist ► Several HIS are often blended to optimize taste ► Current “best taste” blend technologies use Ace-K (Nutrinova Sunett®) Achieving the target sweet taste is complex Sugar Sucralose $1.5B High Intensity Sweeteners (HIS) Other HFCS Ace-K* Saccharin Cyclamate Aspartame
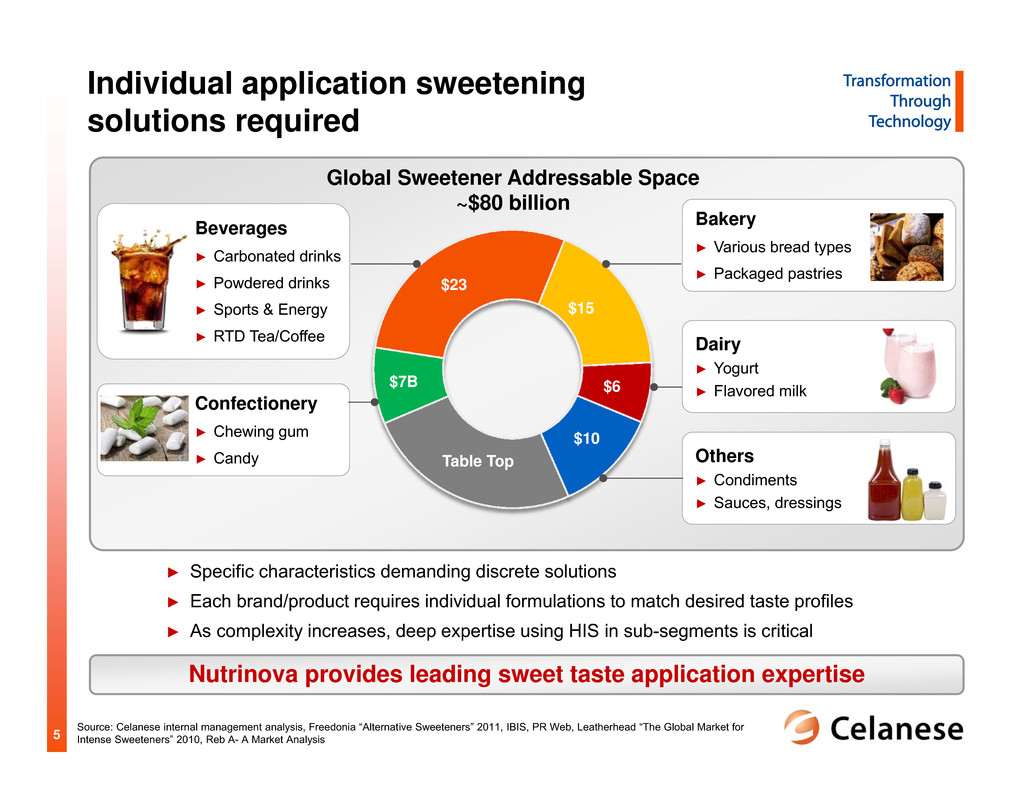
5 Individual application sweetening solutions required Others ► Condiments ► Sauces, dressings Nutrinova provides leading sweet taste application expertise Dairy ► Yogurt ► Flavored milk Bakery ► Various bread types ► Packaged pastries ► Specific characteristics demanding discrete solutions ► Each brand/product requires individual formulations to match desired taste profiles ► As complexity increases, deep expertise using HIS in sub-segments is critical Source: Celanese internal management analysis, Freedonia “Alternative Sweeteners” 2011, IBIS, PR Web, Leatherhead “The Global Market for Intense Sweeteners” 2010, Reb A- A Market Analysis Table Top $10 Global Sweetener Addressable Space ~$80 billion $23 $7B $15 $6 Confectionery ► Chewing gum ► Candy Beverages ► Carbonated drinks ► Powdered drinks ► Sports & Energy ► RTD Tea/Coffee

6 Nutrinova application expertise critical to reduce iterations ► Brand specific ► Complex recipe ► Marketing review ► Consumer panel ► Consumer trial Base ingredients ► Sweeteners ► Preservatives ► Flavors, etc. Internal review ► Replace sugar bulking volume ► Provide mouth-feel (viscosity) ► Survive processing conditions Other complex formulations require HIS to: Bringing value to customers to reach their calorie reduction targets Final product Iterative formulation Initial formulation ► Iterative process ► Mask off-tastes

7 SunsationSM Platform Multi-generation Pipeline (Addressable Space) Nutrinova’s new advanced sweet taste technology platform ► Ingredients work synergistically enhancing sweetness ► Validated superior by professional sensory taste panel ► Proprietary formulation developed for each platform product Bakery solution $15 billion Others (e.g. dressing & sauces solution) $10 billion SunsationSM SL $29 billion SunsationSM XT $1 billion Chewing gum Beverages and Dairy Current HIS blend Sunett® other HIS Clean sweet taste + Proprietary formulation SunsationSM Launched 2012 Close to Sugar TasteSunsationSM Technology Platform Source: Celanese internal management analysis, Freedonia “Alternative Sweeteners” 2011, IBIS, PR Web, Leatherhead “The Global Market for Intense Sweeteners” 2010, Reb A- A Market Analysis
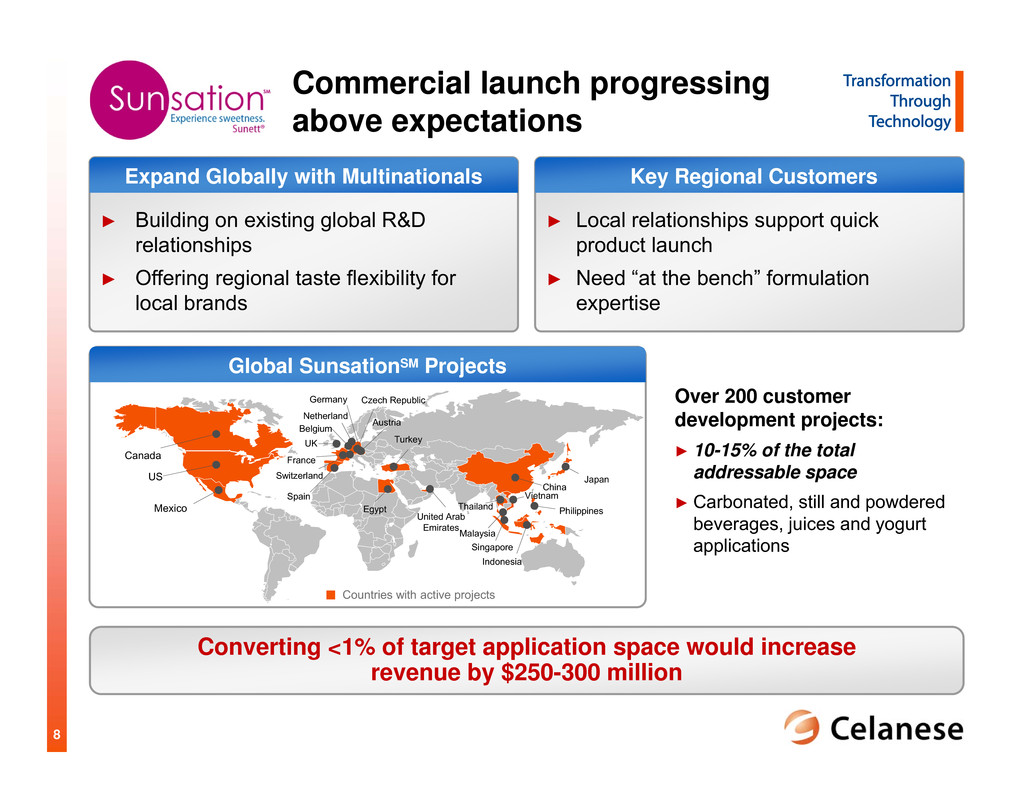
8 ► Local relationships support quick product launch ► Need “at the bench” formulation expertise ► Building on existing global R&D relationships ► Offering regional taste flexibility for local brands Key Regional CustomersExpand Globally with Multinationals Commercial launch progressing above expectations Converting <1% of target application space would increase revenue by $250-300 million Countries with active projects Belgium Czech Republic United Arab Emirates Austria UK Canada US Mexico France Germany Netherland Switzerland Turkey China Singapore Malaysia Philippines Indonesia Thailand Vietnam Japan Egypt Over 200 customer development projects: ► 10-15% of the total addressable space ► Carbonated, still and powdered beverages, juices and yogurt applications Spain Global SunsationSM Projects

9 ► >200% year-over-year growth experienced by recently introduced natural sweeteners ► Global natural sweetener space is potential opportunity ► Increasing desire for all-natural food and beverage ingredients ► Bio-grown products have >100% year- over-year growth Significant PotentialGrowing Consumer Trend Securing sweetener leading position into the future: Next generation Natural Sweetener program Extensive Library Screening Sensory Feasibility ► Evaluated both plant extracts and micro-organisms ► High throughput patented technology ► Identified ‘sweet’ ► Determine sweetener intensity ► Clean sweet taste, no bitterness Regulatory ► Commercial economics ► Stability and scalability L a u n c h ► FDA/EFSA approval ► Product registration >20,000 candidates Estimated 1-2 candidates Today Future Customer collaboration with key industry leaders

10 Sweetener Solutions Summary Significant opportunity in the $80 billion sweetener addressable space New sweetener technology platform offers best sugar taste Global SunsationSM platform customer projects exceeding expectations Expanding our leading sweetener position with robust technology pipeline Accelerating sustainable, highly profitable growth through advanced sweet taste technology

1 © Copyright Celanese 2012 Balancing Growth and Shareholder Returns Steven Sterin Senior Vice President & Chief Financial Officer

2 Balanced Cash Deployment Strategy Growth Deleverage Cash Return ► Fund strategic growth initiatives with operating cash flows ► Invest ~$400 million/year in capital projects ► Delever by deploying excess cash ►Move towards investment grade over time ►Grow dividend towards median yield over time ► Repurchase shares opportunistically Continue to deliver significant value creation for shareholders Shareholder Value Continue to invest in growth, improve our balance sheet, and return cash to shareholders to maximize shareholder value
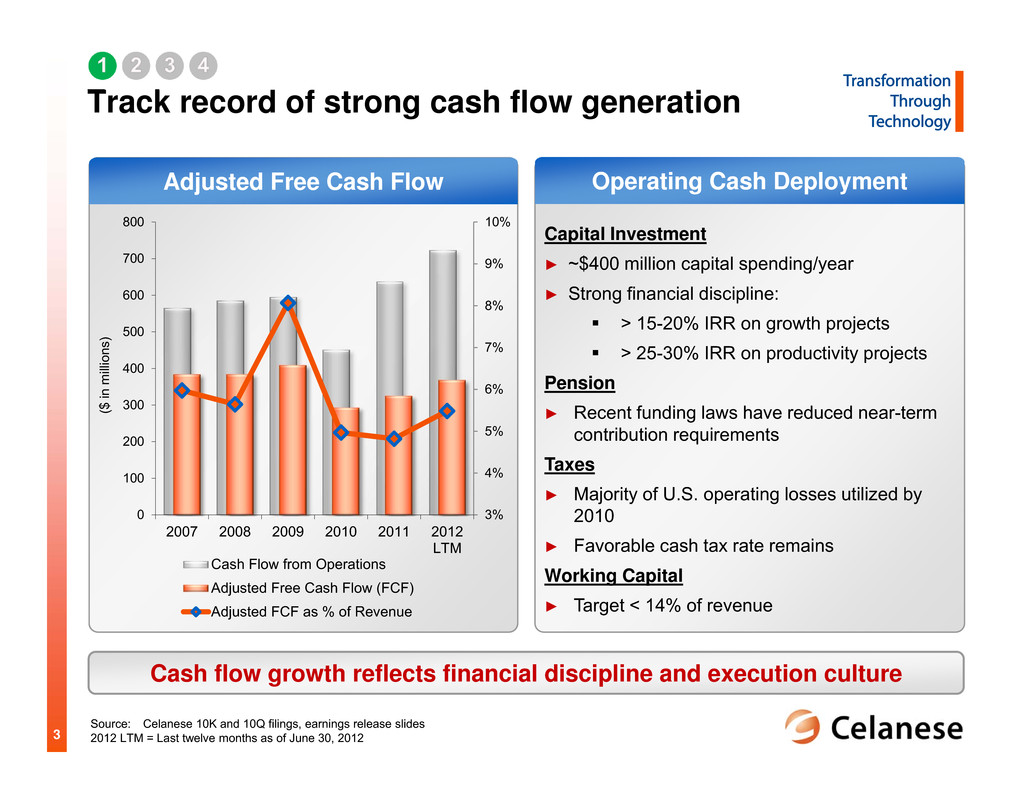
3 Adjusted Free Cash Flow Track record of strong cash flow generation ( $ i n m i l l i o n s ) Source: Celanese 10K and 10Q filings, earnings release slides 2012 LTM = Last twelve months as of June 30, 2012 Cash flow growth reflects financial discipline and execution culture 3% 4% 5% 6% 7% 8% 9% 10% 0 100 200 300 400 500 600 700 800 2007 2008 2009 2010 2011 2012 LTM Cash Flow from Operations Adjusted Free Cash Flow (FCF) Adjusted FCF as % of Revenue Operating Cash Deployment Capital Investment ► ~$400 million capital spending/year ► Strong financial discipline: > 15-20% IRR on growth projects > 25-30% IRR on productivity projects Pension ► Recent funding laws have reduced near-term contribution requirements Taxes ► Majority of U.S. operating losses utilized by 2010 ► Favorable cash tax rate remains Working Capital ► Target < 14% of revenue
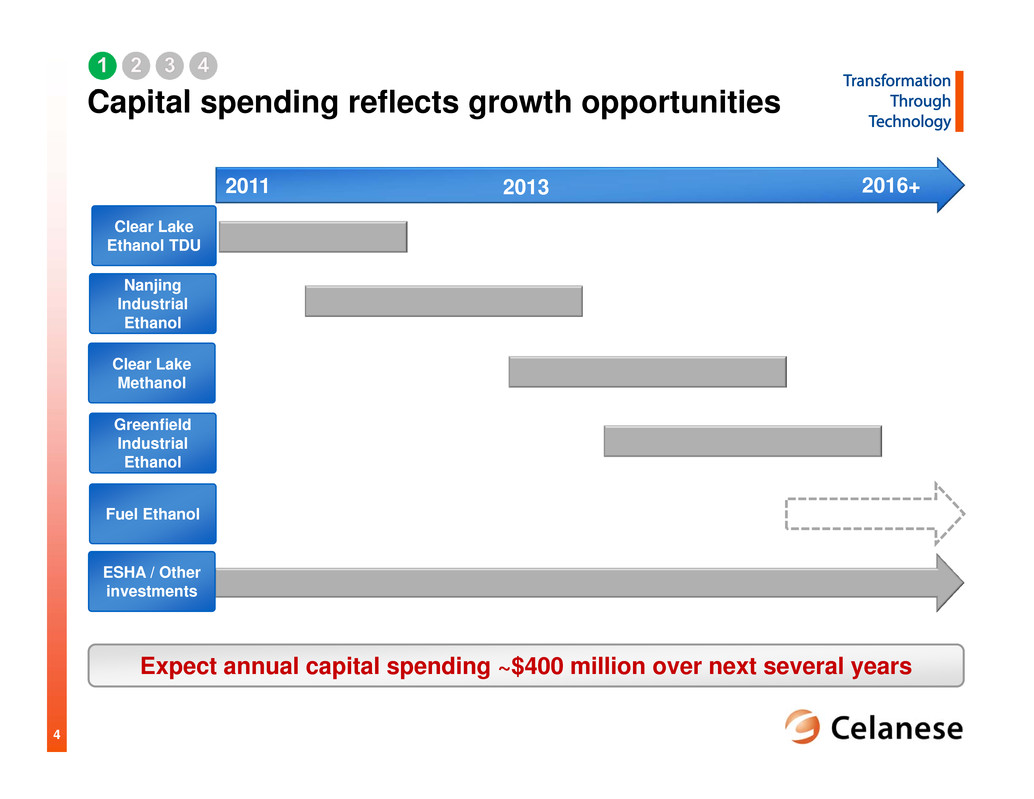
4 Capital spending reflects growth opportunities 2011 2016+ Clear Lake Ethanol TDU Nanjing Industrial Ethanol Clear Lake Methanol Greenfield Industrial Ethanol Fuel Ethanol 2013 ESHA / Other investments Expect annual capital spending ~$400 million over next several years

5 Progressing towards investment grade 4.1x 5.5x 6.2x 6.4x 2.6x 2.2x 1.7x 1.7x 2009 2010 2011 2012 LTM Operating EBITDA/Interest Expense Net Debt/Operating EBITDA Stronger Credit Profile ► Maintain broad market access ► Reduce leverage over time ► Reduce secured debt ~$850 million debt pay down since 2007 ► Maintain low borrowing costs ► Extend / stagger debt maturities ► Maintain covenant flexibility Major Debt Maturity Profile1 $600 $1,320 $600 $400 2012 2013 2014 2015 2016 2017 2018 2019 2020 2021 Senior Unsecured Notes Revolver Capacity Term Loan Senior Unsecured Notes As of June 30, 2012 Debt Objectives Source: Celanese 10K and 10Q filings. 2012 LTM = Last twelve months as of June 30, 2012 1 Major debt maturity profile net of annual debt amortization of term loans; excludes capital leases, pollution bonds, and credit linked revolving facility

6 Pension Strategy Pension Funding StrategyPension Plan Funded Status1 0 500 1,000 1,500 2,000 2,500 3,000 3,500 4,000 4,500 2008 2009 2010 2011 2012 Q2 ( $ i n m i l l i o n ) ► Recent, extended low interest rate environment has elevated GAAP unfunded pension liabilities ► $470 million of pension contributions from Dec. 31, 2004 to June 30, 2012 ► Recent funding law changes result in lower range of pension cash outflows over operating EBITDA base $110 – $120 million in 2012 ~$50 million in 20132 ► Sufficient operating cash flows to cover ongoing funding Source: Celanese 10K filings and company estimates 1 Funded status of Pension Benefit Obligations (PBO) : includes assets held in non-qualified trusts 2 Based on today’s interest rates and expected returns Pension funding requirements will not inhibit growth strategy Unfunded PBO Funded PBO

7 Continue to increase return of cash to shareholders ► Average annual growth of dividend >20% since 2009 ► ~$150 million dividends paid from Dec. 31, 2006 to June 30, 2012 ► Opportunistic repurchases ► Repurchased ~$890 million of shares reducing share count by ~23.6 million from Dec. 31, 2006 to June 30, 2012 ► Average share repurchase price less than $38 2009 2010 2011 2012 LTM Share Repurchases Consistently Increasing Dividend Over $1 billion returned to shareholders since 2007 Source: Celanese 10K and 10Q filings. 2012 LTM = Last twelve months as of June 30, 2012
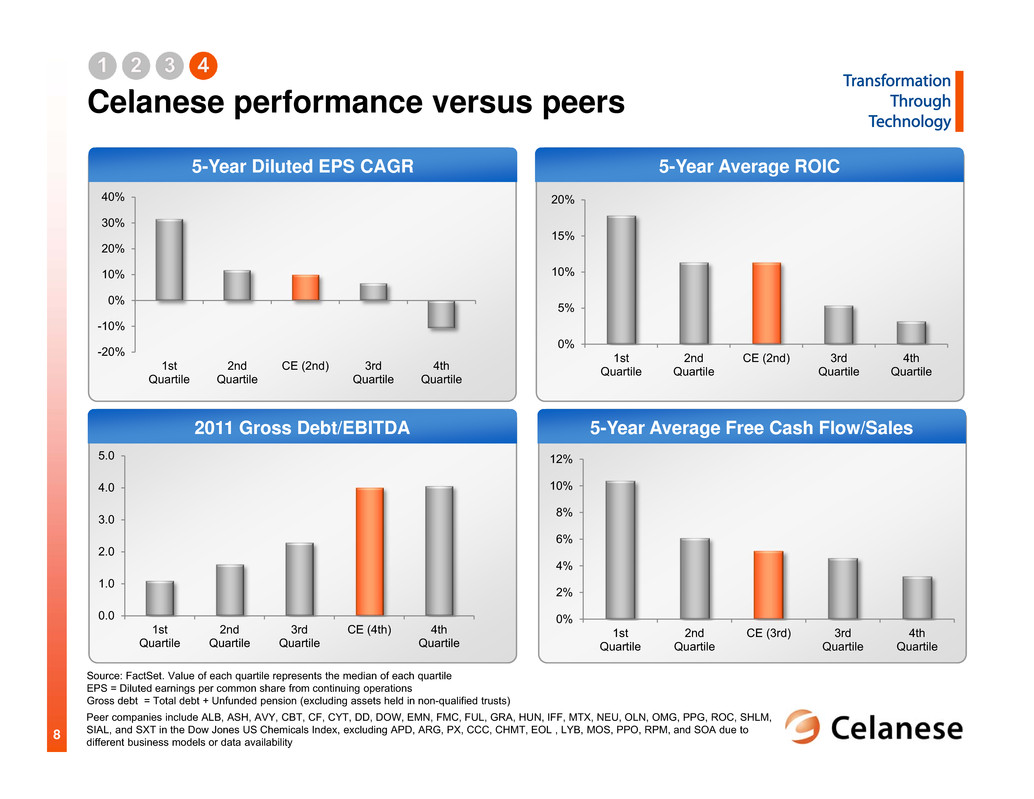
8 -20% -10% 0% 10% 20% 30% 40% 1st Quartile 2nd Quartile CE (2nd) 3rd Quartile 4th Quartile 0% 5% 10% 15% 20% 1st Quartile 2nd Quartile CE (2nd) 3rd Quartile 4th Quartile 0% 2% 4% 6% 8% 10% 12% 1st Quartile 2nd Quartile CE (3rd) 3rd Quartile 4th Quartile 0.0 1.0 2.0 3.0 4.0 5.0 1st Quartile 2nd Quartile 3rd Quartile CE (4th) 4th Quartile 5-Year Average Free Cash Flow/Sales 5-Year Diluted EPS CAGR 5-Year Average ROIC Celanese performance versus peers Peer companies include ALB, ASH, AVY, CBT, CF, CYT, DD, DOW, EMN, FMC, FUL, GRA, HUN, IFF, MTX, NEU, OLN, OMG, PPG, ROC, SHLM, SIAL, and SXT in the Dow Jones US Chemicals Index, excluding APD, ARG, PX, CCC, CHMT, EOL , LYB, MOS, PPO, RPM, and SOA due to different business models or data availability 2011 Gross Debt/EBITDA Source: FactSet. Value of each quartile represents the median of each quartile EPS = Diluted earnings per common share from continuing operations Gross debt = Total debt + Unfunded pension (excluding assets held in non-qualified trusts)

9 Free Cash Flow/Sales Earnings Growth Return on Invested Capital Actions to achieve top quartile performance Gross Debt/EBITDA ► Continue to make focused technology investments ► Expect high translation of technology investments into earnings growth ► Debt reduction expected to reduce interest cost ► Technology investments will be capital-efficient ► Process technology advantages drive high capital return ► Maintain strict financial discipline ► Continue to reduce debt ► Delever through EBITDA growth ► Move to investment grade over time ► Continue to fund pension plans ► Control working capital ► ~$400 million in capex with high returns ► Reduce interest and pension burden through delevering

10 Total Shareholder Return (TSR) since IPO in 2005 Excellent Total Shareholder Return since IPO This comparison is based on a return assuming $100 invested January 21, 2005 (IPO date) in Celanese Corporation Common Stock and the S&P 500 Composite Index, the S&P 500 Chemicals Index and the S&P Specialty Chemicals Index, assuming the reinvestment of all dividends Source: Factset 265% 120% 152% 258% CE S&P 500 S&P 500 Chemicals S&P 500 Specialty Chemicals Premier TSR (As of August 15, 2012 versus January 21, 2005) ► History is in-line with specialty chemical peers ► > 2x S&P 500 average ► Recent corporate actions Continuing to increase shareholder dividends Opportunistic share repurchases Track record of significant improvement; opportunities still exist
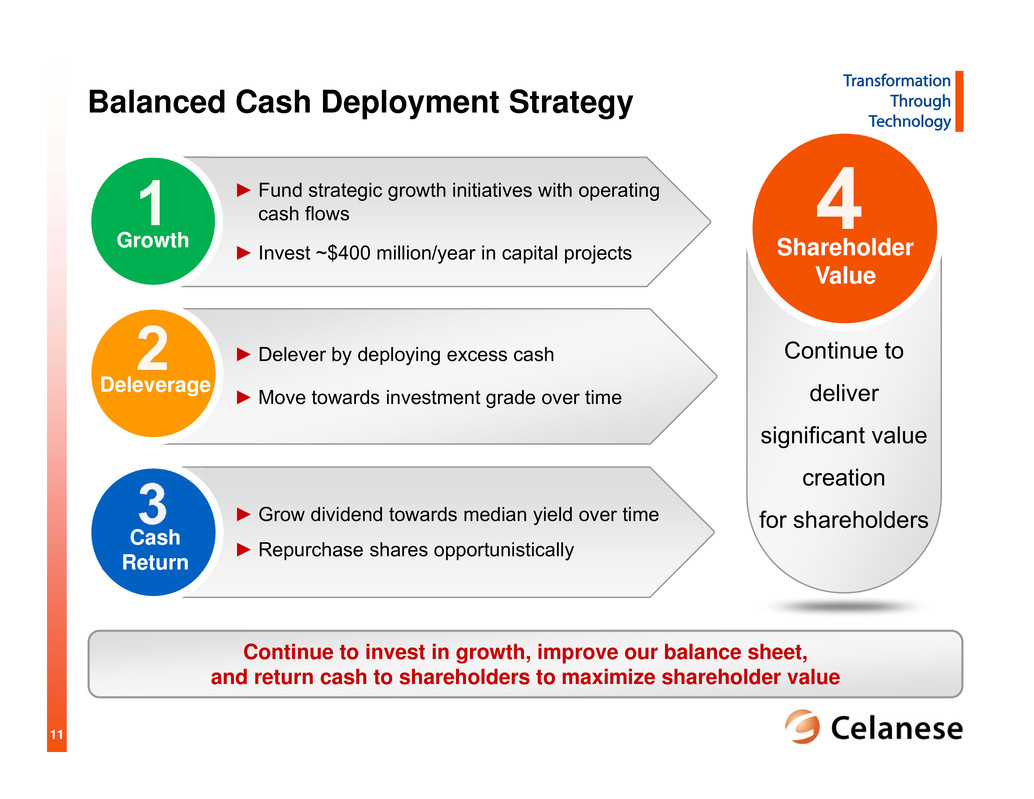
11 Balanced Cash Deployment Strategy Growth Deleverage Cash Return ► Fund strategic growth initiatives with operating cash flows ► Invest ~$400 million/year in capital projects ► Delever by deploying excess cash ►Move towards investment grade over time ►Grow dividend towards median yield over time ► Repurchase shares opportunistically Continue to deliver significant value creation for shareholders Shareholder Value Continue to invest in growth, improve our balance sheet, and return cash to shareholders to maximize shareholder value

1 Reconciliations of non-U.S. GAAP financial measures

2 Reg G: Business segment data and reconciliation of operating profit (loss) to operating EBITDA – a non-U.S. GAAP measure – unaudited Y e a r E n d e d D e c e m b e r 3 1 , ( I n $ m i l l i o n s ) 2 0 1 1 N e t S a l e s A d v a n c e d E n g i n e e r e d M a t e r i a l s 5 1 , 2 9 8 C o n s u m e r S p e c i a l t i e s 5 1 , 1 6 1 I n d u s t r i a l S p e c i a l t i e s 5 1 , 2 2 3 A c e t y l I n t e r m e d i a t e s 4 3 , 5 5 1 O t h e r A c t i v i t i e s 1 1 I n t e r s e g m e n t e l i m i n a t i o n s 4 , 5 ( 4 7 1 ) T o t a l 6 , 7 6 3 O p e r a t i n g P r o f i t ( L o s s ) A d v a n c e d E n g i n e e r e d M a t e r i a l s 7 6 C o n s u m e r S p e c i a l t i e s 2 2 7 I n d u s t r i a l S p e c i a l t i e s 1 0 0 A c e t y l I n t e r m e d i a t e s 4 5 9 O t h e r A c t i v i t i e s 1 ( 1 7 2 ) T o t a l 6 9 0 O t h e r C h a r g e s a n d O t h e r A d j u s t m e n t s 2 A d v a n c e d E n g i n e e r e d M a t e r i a l s 6 0 C o n s u m e r S p e c i a l t i e s 2 3 I n d u s t r i a l S p e c i a l t i e s 1 A c e t y l I n t e r m e d i a t e s ( 3 ) O t h e r A c t i v i t i e s 1 1 8 T o t a l 9 9 D e p r e c i a t i o n a n d A m o r t i z a t i o n E x p e n s e 3 A d v a n c e d E n g i n e e r e d M a t e r i a l s 9 7 C o n s u m e r S p e c i a l t i e s 3 6 I n d u s t r i a l S p e c i a l t i e s 4 5 A c e t y l I n t e r m e d i a t e s 9 6 O t h e r A c t i v i t i e s 1 1 3 T o t a l 2 8 7 E q u i t y E a r n i n g s , C o s t - D i v i d e n d I n c o m e a n d O t h e r I n c o m e ( E x p e n s e ) A d v a n c e d E n g i n e e r e d M a t e r i a l s 1 6 3 C o n s u m e r S p e c i a l t i e s 8 0 I n d u s t r i a l S p e c i a l t i e s 2 A c e t y l I n t e r m e d i a t e s 1 0 O t h e r A c t i v i t i e s 1 3 1 T o t a l 2 8 6 O p e r a t i n g E B I T D A A d v a n c e d E n g i n e e r e d M a t e r i a l s 7 3 9 6 C o n s u m e r S p e c i a l t i e s 7 3 6 6 I n d u s t r i a l S p e c i a l t i e s 7 1 4 8 A c e t y l I n t e r m e d i a t e s 6 5 6 2 O t h e r A c t i v i t i e s 1 ( 1 1 0 ) T o t a l 1 , 3 6 2 D e p r e c i a t i o n a n d a m o r t i z a t i o n e x p e n s e 8 ( 2 9 8 ) O p e r a t i n g E B I T 1 , 0 6 4 O p e r a t i n g E B I T M a r g i n 1 6 % 1 O t h e r A c t i v i t i e s p r i m a r i l y i n c l u d e s c o r p o r a t e s e l l i n g , g e n e r a l a n d a d m i n i s t r a t i v e e x p e n s e s a n d t h e r e s u l t s f r o m c a p t i v e i n s u r a n c e c o m p a n i e s . 2 S e e O t h e r C h a r g e s a n d O t h e r A d j u s t m e n t s R e g G r e c o n c i l i a t i o n f o r d e t a i l s . 3 E x c l u d e s a c c e l e r a t e d d e p r e c i a t i o n a n d a m o r t i z a t i o n a s s o c i a t e d w i t h p l a n t c l o s u r e s i n c l u d e d i n O t h e r C h a r g e s a n d O t h e r A d j u s t m e n t s a b o v e . 4 N e t S a l e s f o r T e c h n o l o g y - E n a b l e d C h e m i s t r y i n c l u d e s A c e t y l I n t e r m e d i a t e s b u s i n e s s s e g m e n t a n d e x c l u d e s $ 4 6 8 m i l l i o n o f i n t e r s e g m e n t s a l e s . 6 O p e r a t i n g E B I T D A f o r T e c h n o l o g y - E n a b l e d C h e m i s t r y i n c l u d e s A c e t y l I n t e r m e d i a t e s b u s i n e s s s e g m e n t . 8 I n c l u d e s a c c e l e r a t e d d e p r e c i a t i o n a n d a m o r t i z a t i o n a s s o c i a t e d w i t h p l a n t c l o s u r e s i n c l u d e d i n O t h e r C h a r g e s a n d O t h e r A d j u s t m e n t s a b o v e . 5 N e t S a l e s f o r C u s t o m e r - O r i e n t e d S o l u t i o n s i n c l u d e s A d v a n c e d E n g i n e e r e d M a t e r i a l s , C o n s u m e r S p e c i a l t i e s a n d I n d u s t r i a l S p e c i a l t i e s b u s i n e s s s e g m e n t s a n d e x c l u d e s $ 3 m i l l i o n o f i n t e r s e g m e n t s a l e s . 7 O p e r a t i n g E B I T D A f o r C u s t o m e r - O r i e n t e d S o l u t i o n s i n c l u d e s A d v a n c e d E n g i n e e r e d M a t e r i a l s , C o n s u m e r S p e c i a l t i e s a n d I n d u s t r i a l S p e c i a l t i e s b u s i n e s s s e g m e n t s .

3 Reg G: Reconciliation of consolidated net earnings (loss) to operating EBITDA – a non-U.S. GAAP measure – unaudited (In $ millions) 2012 LTM1 2011 2010 2009 Net earnings (loss) 655 607 377 498 (Earnings) loss from discontinued operations 1 (1) 49 (4) Interest income (3) (3) (7) (8) Interest expense 199 221 204 207 Refinancing expense - 3 16 - Income tax provision (benefit) 10 149 112 (243) Depreciation and amortization expense2 299 287 258 290 Other charges (gains), net3 36 48 46 136 Other adjustments3 77 51 67 (19) Operating EBITDA 1,274 1,362 1,122 857 Depreciation and amortization expense4 (298) Operating EBIT 1,064 Operating EBITDA/ Interest Expense 6.4 6.2 5.5 4.1 (In $ millions) 2012 LTM1 2011 2010 2009 Advanced Engineered Materials 3 Consumer Specialties 8 Industrial Specialties - Acetyl Intermediates - Other Activities5 - Accelerated depreciation and amortization expense 4 11 29 18 Depreciation and amortization expense2 299 287 258 290 Total depreciation and amortization expense 303 298 287 308 1 Last twelve months as of June 30, 2012. 2 Excludes accelerated depreciation and amortization expense as detailed in the table above and is included in Other adjustments above. 3 See Other Charges and Other Adjustments Reg G reconciliation for details. 4 Includes accelerated depreciation and amortization expense as detailed in the table above and is included in Other adjustments above. 5 Other Activities primarily includes corporate selling, general and administrative expenses and the results from captive insurance companies. Year Ended December 31, Year Ended December 31,

4 Reg G: Other charges and other adjustments – reconciliation of a non-U.S. GAAP measure – unaudited (In $ millions) 2012 LTM1 2011 2010 2009 Employee termination benefits 10 22 32 105 Plant/office closures - - 4 17 Ticona Kelsterbach plant relocation 20 47 26 16 Plumbing actions (2) (6) (59) (10) Asset impairments 1 1 74 14 Insurance recoveries - - (18) (6) Commercial disputes 7 (15) (13) - Other - (1) - - Total 36 48 46 136 Other Adjustments:2 Income Statement (In $ millions) 2012 LTM1 2011 2010 2009 Classification Business optimization 11 8 16 7 Cost of sales / SG&A Ticona Kelsterbach plant relocation 17 8 (13) - Cost of sales Plant closures 11 18 17 25 Cost of sales / SG&A Contract termination - - 22 - Cost of sales (Gain) loss on disposition of businesses and assets, net (1) (1) (10) (34) (Gain) loss on disposition Write-off of other productive assets - (1) 18 - Cost of sales Commercial disputes 8 8 - - Cost of sales Acetate production interruption costs 10 - - - Cost of sales Other 21 11 17 (17) Various Total 77 51 67 (19) Total Other charges and Other adjustments 113 99 113 117 1 Last twelve months as of June 30, 2012. 2 These items are included in net earnings but not included in Other charges (gains), net. Year Ended December 31, Year Ended December 31,
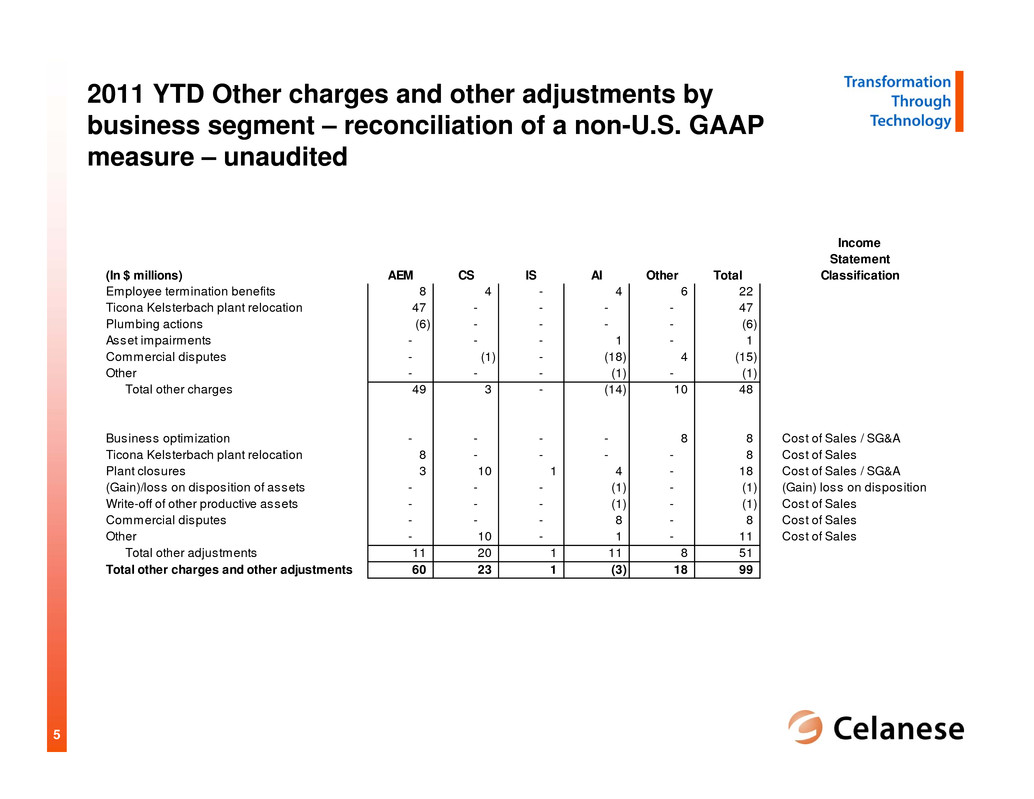
5 2011 YTD Other charges and other adjustments by business segment – reconciliation of a non-U.S. GAAP measure – unaudited Income Statement (In $ millions) AEM CS IS AI Other Total Classification Employee termination benefits 8 4 - 4 6 22 Ticona Kelsterbach plant relocation 47 - - - - 47 Plumbing actions (6) - - - - (6) Asset impairments - - - 1 - 1 Commercial disputes - (1) - (18) 4 (15) Other - - - (1) - (1) Total other charges 49 3 - (14) 10 48 Business optimization - - - - 8 8 Cost of Sales / SG&A Ticona Kelsterbach plant relocation 8 - - - - 8 Cost of Sales Plant closures 3 10 1 4 - 18 Cost of Sales / SG&A (Gain)/loss on disposition of assets - - - (1) - (1) (Gain) loss on disposition Write-off of other productive assets - - - (1) - (1) Cost of Sales Commercial disputes - - - 8 - 8 Cost of Sales Other - 10 - 1 - 11 Cost of Sales Total other adjustments 11 20 1 11 8 51 Total other charges and other adjustments 60 23 1 (3) 18 99

6 Reg G: Net debt - reconciliation of a non-U.S. GAAP measure – unaudited (In $ millions) 2012 LTM1 2011 2010 2009 Short-term borrowings and current installments of long-term debt - third party and affiliates 131 144 228 242 Long-term debt 2,845 2,873 2,990 3,259 Total debt 2,976 3,017 3,218 3,501 Cash and cash equivalents (800) (682) (740) (1,254) Net debt 2,176 2,335 2,478 2,247 Operating EBITDA 1,274 1,362 1,122 857 Net debt / Operating EBITDA 1.7 1.7 2.2 2.6 1 Last twelve months as of June 30, 2012. Year Ended December 31,

7 Reg G: Adjusted free cash flow - reconciliation of a non- U.S. GAAP measure – unaudited (In $ millions) 2012 LTM1 2011 2010 2009 2008 2007 Net cash provided by operating activities 724 638 452 596 586 566 Adjustments to operating cash for discontinued operations 12 9 58 2 (3) 84 Net cash provided by operating activities from continuing operations 736 647 510 598 583 650 Capital expenditures (381) (349) (201) (176) (274) (288) Other charges and adjustments2 14 28 (15) (12) 76 23 Adjusted Free Cash Flow 369 326 294 410 385 385 Net Sales 6,729 6,763 5,918 5,082 6,823 6,444 Adjusted Free Cash Flow as % of Net Sales 5.5% 4.8% 5.0% 8.1% 5.6% 6.0% 1 Last twelve months as of June 30, 2012. Year Ended December 31, 2 Amounts primarily associated with Kelsterbach plant related cash expenses, and purchases of other productive assets that are classified as 'investing activities' for U.S. GAAP purposes.

8 Reg G: Return on invested capital (ROIC) per FactSet - reconciliation of a non-U.S. GAAP measure – unaudited (In $ millions) 2011 2010 2009 2008 2007 2006 Earnings (loss) from continuing operations 606 426 494 371 326 406 Long-term debt 2,873 2,990 3,259 3,300 3,284 3,189 Total equity 1,341 926 586 182 1,062 787 Total invested capital per FactSet 4,214 3,916 3,845 3,482 4,346 3,976 ROIC per FactSet 14.9% 11.0% 13.5% 9.5% 7.8% 11.3% Year Ended December 31, 5‐Year Average

9 Reg G: Free cash flow per FactSet - reconciliation of a non-U.S. GAAP measure – unaudited (In $ millions) 2011 2010 2009 2008 2007 Net cash provided by operating activities 638 452 596 586 566 Captial expenditures (349) (201) (176) (274) (288) Free Cash Flow per FactSet 289 251 420 312 278 Net sales 6,763 5,918 5,082 6,823 6,444 Free Cash Flow as % of Net Sales per FactSet 4.3% 4.2% 8.3% 4.6% 4.3% 5.1% Year Ended December 31, 5‐Year Average

10 Reg G: Reconciliation of consolidated net earnings (loss) to EBITDA per FactSet - a Non-U.S. GAAP Measure - Unaudited (In $ millions) 2011 Net earnings (loss) 607 Earnings from discontinued operations (1) Income tax provision 149 Other income (14) Dividend income - cost investments (80) Interest income (3) Refinancing expense 3 Interest expense 221 Equity in net earnings of affiliates (192) Loss on disposition of of businesses and assets, net 2 Foreign exchange gain (loss) - Other charges 48 Depreciation, amorization and accretion1 311 EBITDA per FactSet 1,051 (In $ millions) 2011 Operating EBITDA 1,362 Depreciation and amortization expense2 (287) Other adjustments3 (51) Dividend income - cost investments (80) Other income (14) Equity in net earnings of affiliates (192) Loss on disposition of businesses and assets, net 2 Foreign exchange gain (loss), net - Depreciation, amorization and accretion1 311 EBITDA per FactSet 1,051 1 As reported on the consolidated statement of cash flows. 3 See Other Charges and Other Adjustments Reg G reconciliation for details. Year Ended December 31, Year Ended December 31, 2 Excludes accelerated depreciation and amortization associated with plant closures. See reconciliation of Net earnings (loss) to Consolidated Operating EBITDA for details.

11 Reg G: Gross debt per FactSet - a Non-U.S. GAAP Measure - Unaudited (In $ millions) 2011 Total debt 3,017 Unfunded benefit obligation 1,199 Gross debt per FactSet 4,216 EBITDA per FactSet 1,051 Gross debt / EBITDA per FactSet 4.0 Year Ended December 31,


